Note: This Synoptic Discussion describes recent weather events and climate anomalies in relation to the phenomena that cause the weather. These phenomena include the jet stream, fronts and low pressure systems that bring precipitation, high pressure systems that bring dry weather, and the mechanisms which control these features — such as El Niño, La Niña, and other oceanic and atmospheric drivers (PNA, NAO, AO, and others). The report may contain more technical language than other components of the State of the Climate series.
Synoptic Discussion
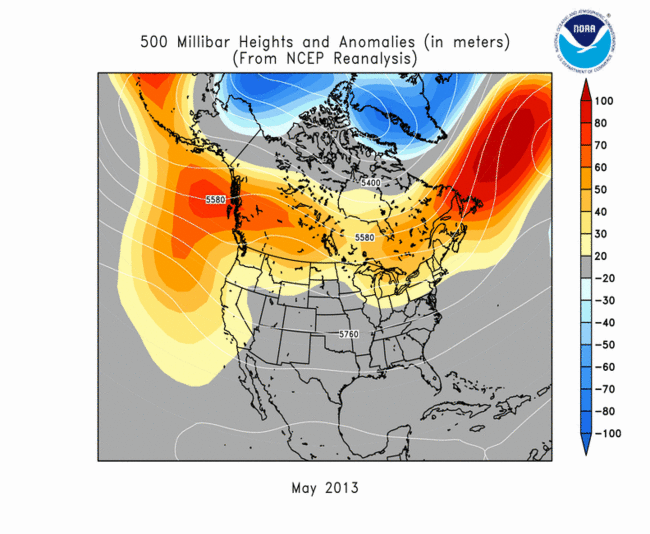
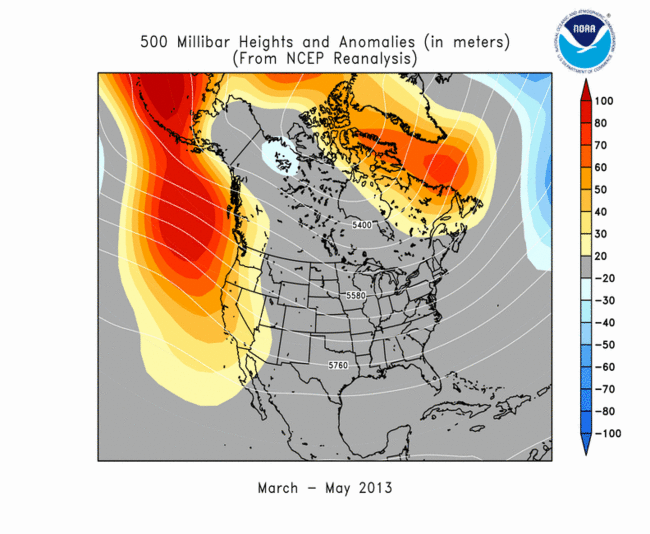
Monthly upper-level circulation pattern and anomalies.
May marks the end of the Northern Hemisphere's climatological spring (March-May). As the sun's angle approaches its June maximum and solar heating continues to intensify in the Northern Hemisphere, the circumpolar vortex contracts further to the north with warm southerly air masses increasing their dominance over cold northerly air masses. The clash between the air masses can result in violent spring weather, with May having the most tornadoes, on average. At the same time, dry weather associated with the subtropical high pressure belt can become influential as this belt also migrates northward.
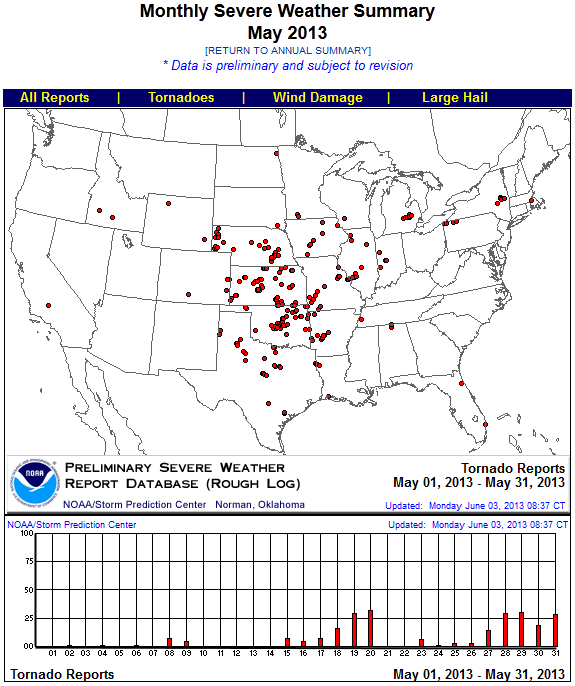
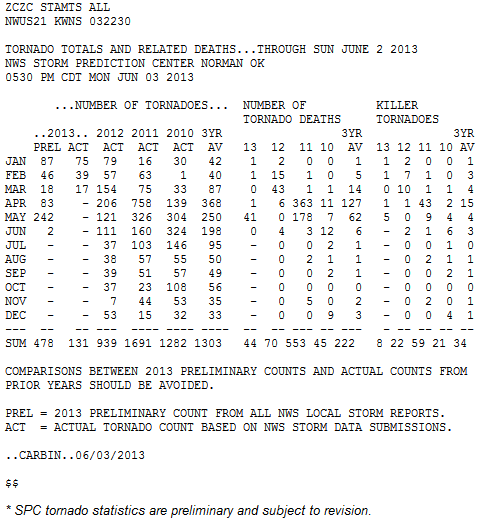
During May 2013, the polar jet stream (which marks the edge of the circumpolar vortex and the boundary between the cold polar air masses to the north and the warmer sub-tropical air masses to the south) was  very active, with many upper-level troughs and ridges migrating across the country in the upper-level circulation. Some of these troughs moved very slowly and tapped Gulf of Mexico moisture, resulting in heavy rains and causing extensive flooding, especially in the Midwest, where Iowa had the wettest May on record. These upper-level troughs and their complex circulations also triggered widespread tornado outbreaks from the Plains to the Midwest, although the preliminary national monthly count of 242 tornadoes was below the average of 276 for May.
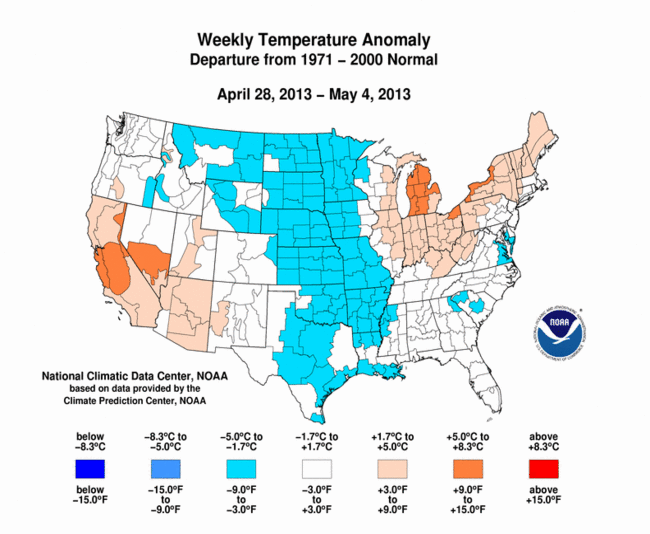
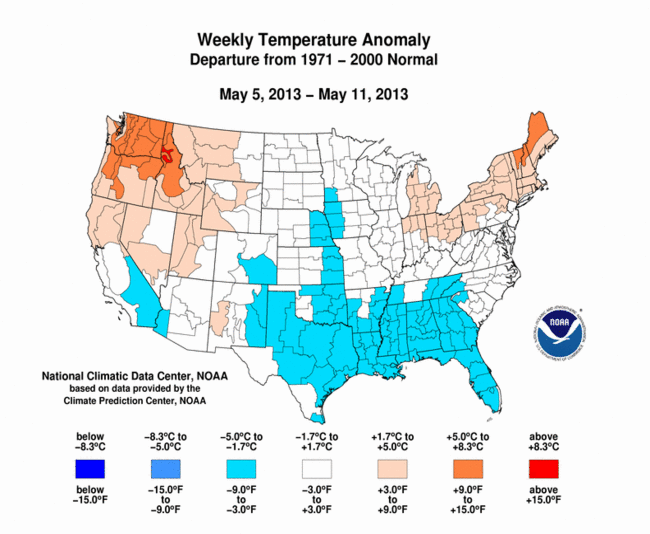
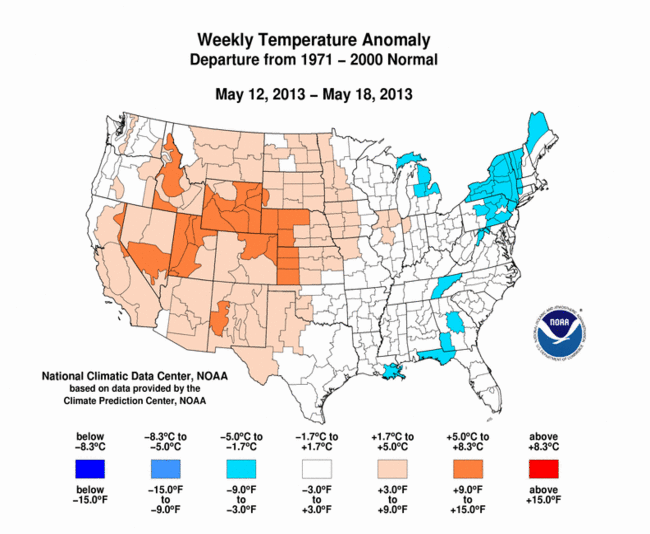
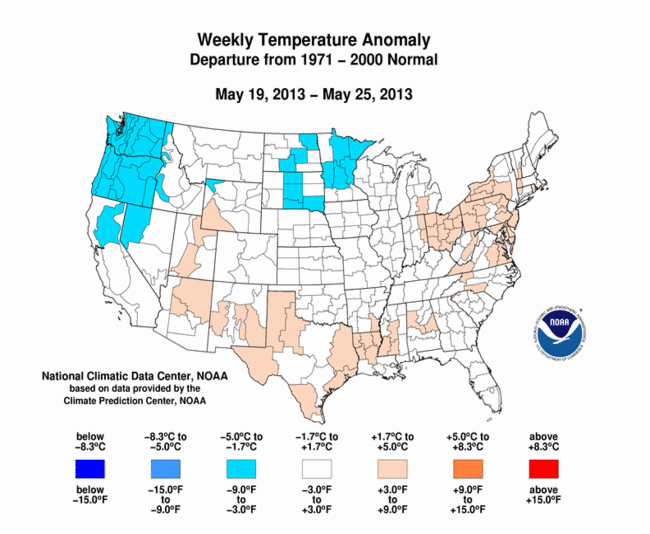
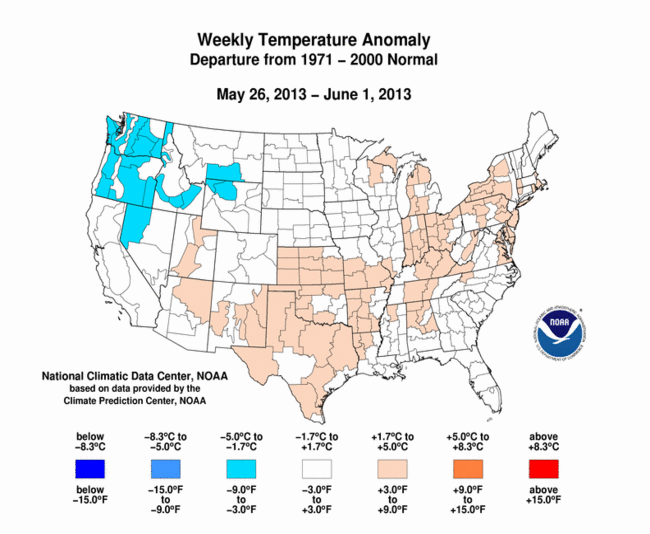
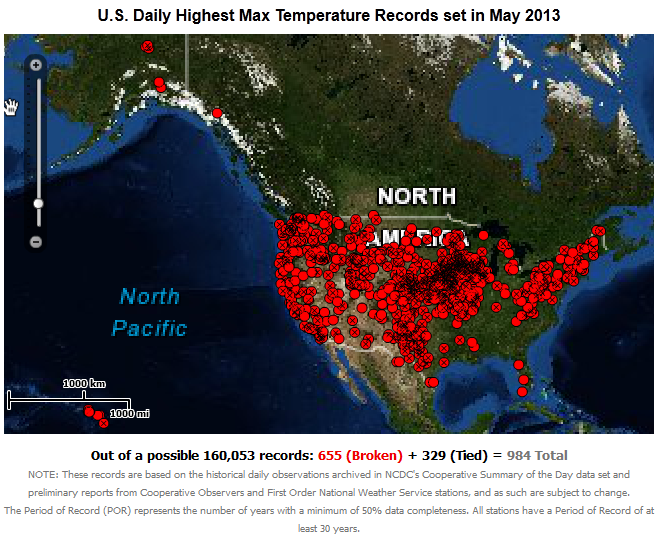
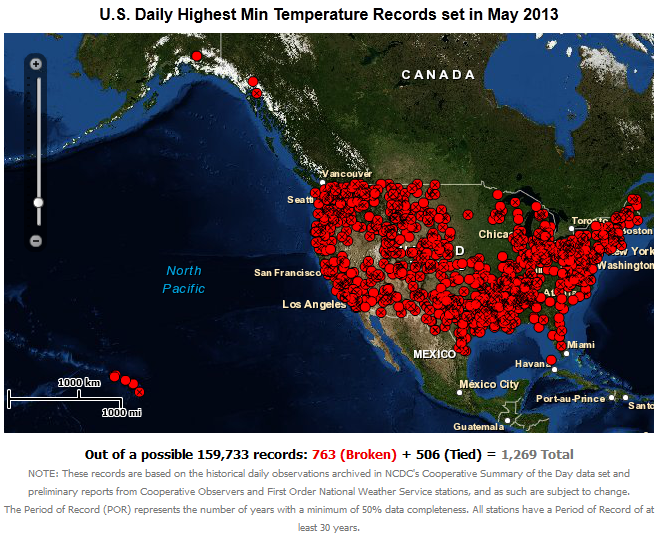
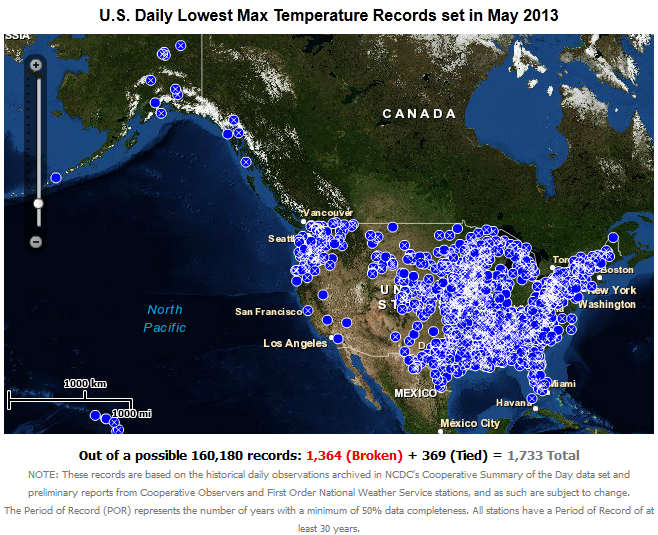
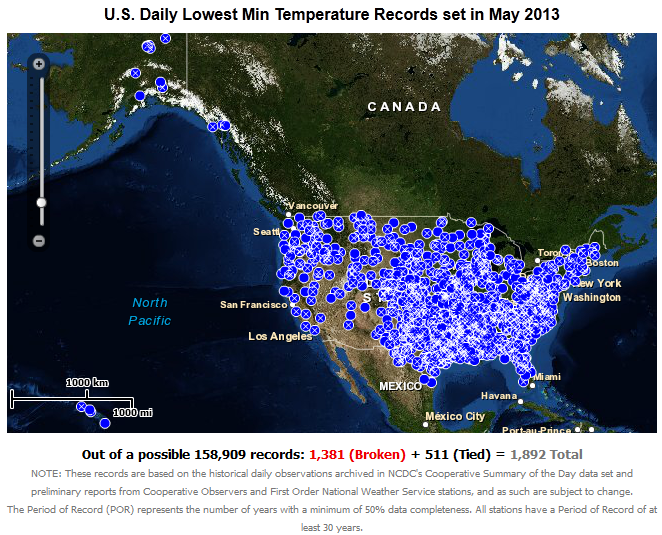
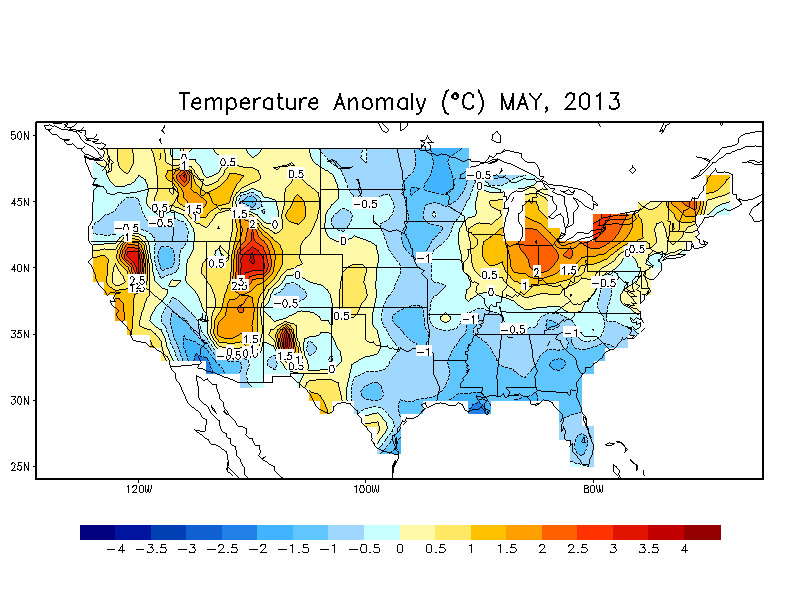
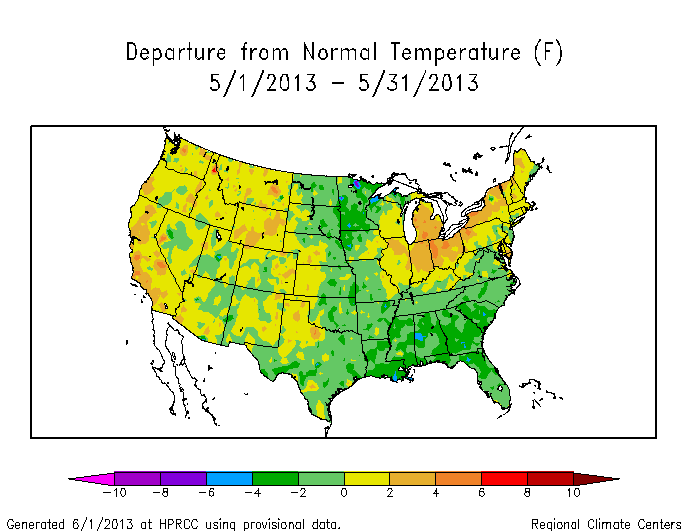
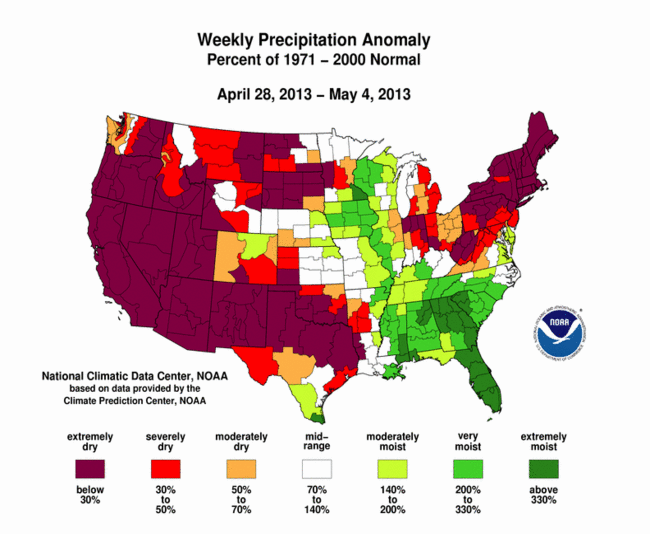
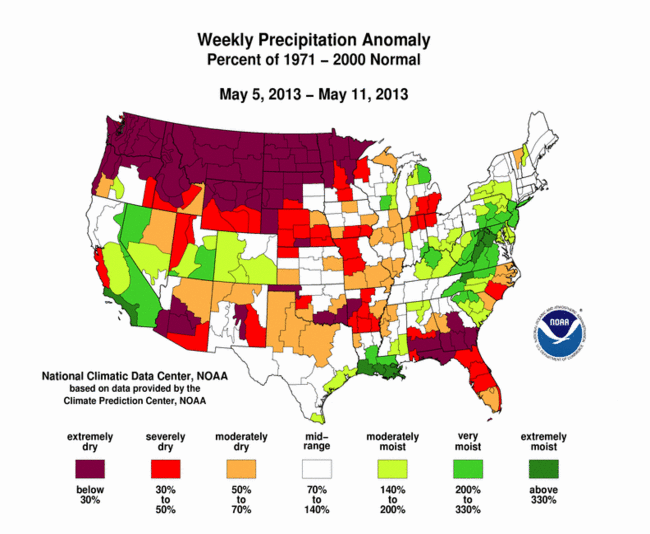
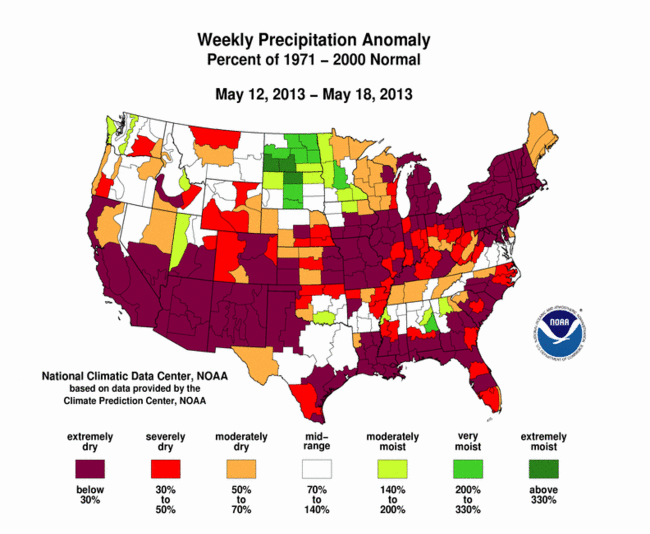
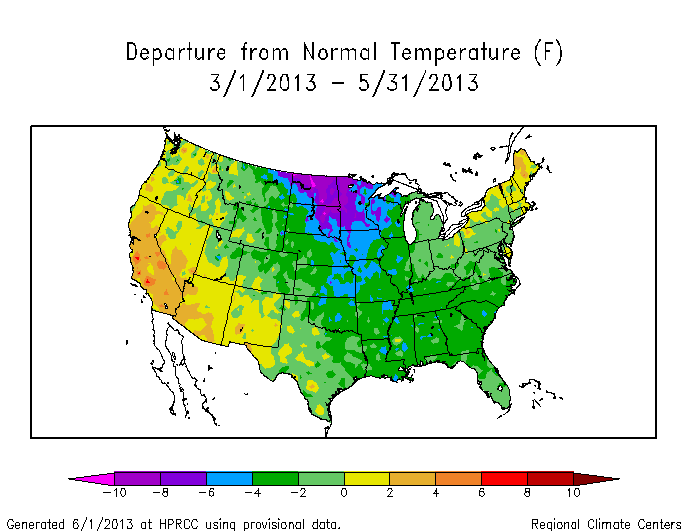
Cold fronts and warm fronts moving with these upper-level systems brought migrating spells of cooler-than-normal and warmer-than-normal weather to parts of the country (weeks 1, 2, 3, 4, 5). About 2250 record warm daily highs and lows were recorded, but more than one and a half times as many record cool daily highs and lows (over 3600) were observed. When integrated across the month, the north central and southeastern parts of the country averaged cooler than normal while the Midwest to Northeast and parts of the West were warmer than normal.
The intrusions of cold air masses produced heavy snow outbreaks when they mixed with the moist southerly flow, but the snow cover did not last long under the intensifying sunlight and subsequent warm fronts. Monthly snow cover averaged below normal for May due to the ephemeral nature of these snow storms and below-normal snow cover in the West.
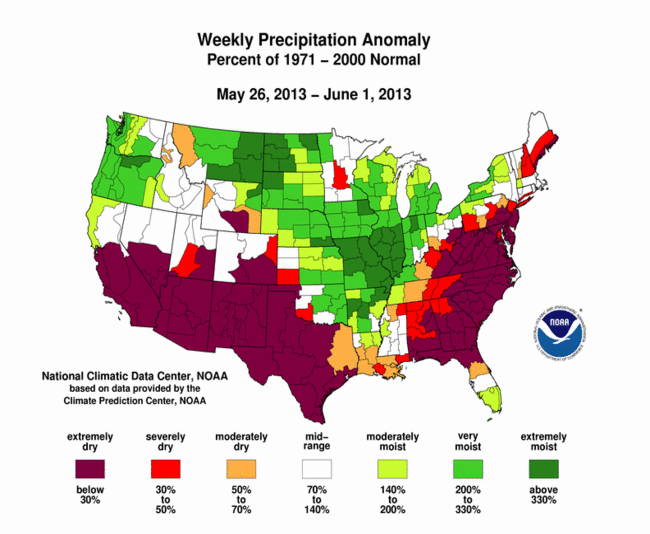
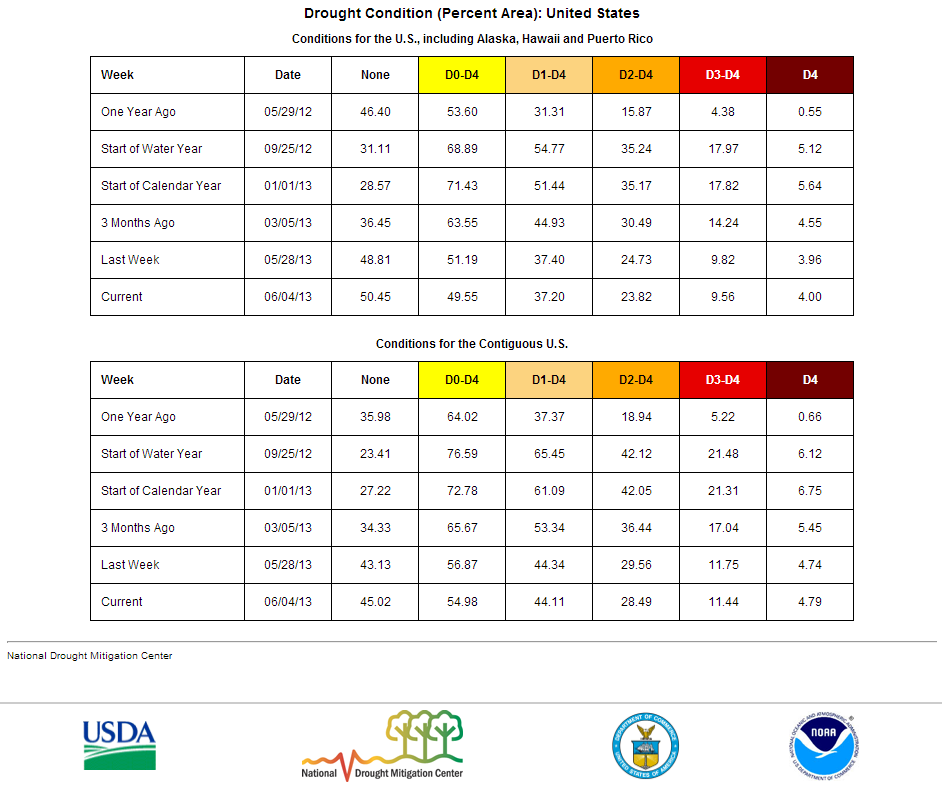
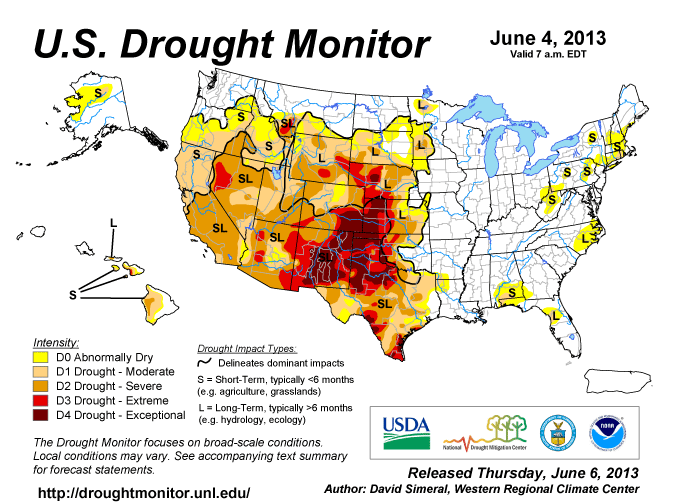
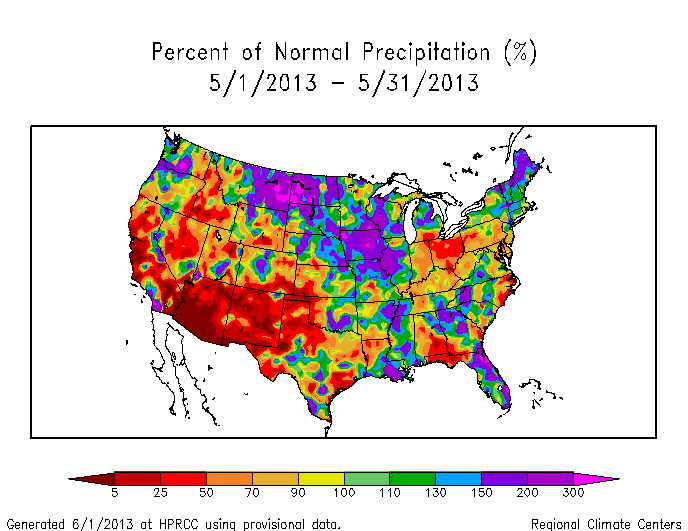
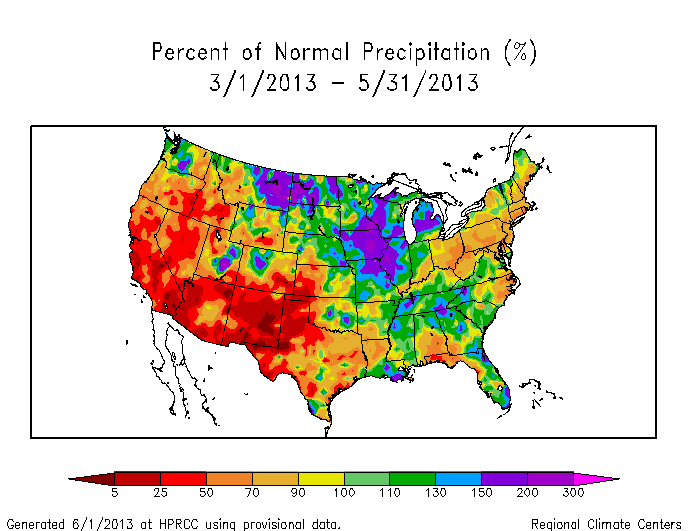
The rain-producing systems largely missed the West and Ohio Valley, and parts of the Mid-Atlantic coast and Gulf of Mexico coast were also drier than normal. Drought expanded in the West, where the circulation favored an upper-level ridge, but it contracted under beneficial rains in the Plains, Midwest, and Southeast. Overall, the national drought footprint shrank from 46.9 percent in moderate to exceptional drought last month to 44.1 percent at the end of May (according to U.S. Drought Monitor statistics). When the temperature and precipitation anomalies are integrated across the country and across the month, May 2013 ranked as the 40th warmest and 17th wettest May for the nation.
very active, with many upper-level troughs and ridges migrating across the country in the upper-level circulation. Some of these troughs moved very slowly and tapped Gulf of Mexico moisture, resulting in heavy rains and causing extensive flooding, especially in the Midwest, where Iowa had the wettest May on record. These upper-level troughs and their complex circulations also triggered widespread tornado outbreaks from the Plains to the Midwest, although the preliminary national monthly count of 242 tornadoes was below the average of 276 for May.
Cold fronts and warm fronts moving with these upper-level systems brought migrating spells of cooler-than-normal and warmer-than-normal weather to parts of the country (weeks 1, 2, 3, 4, 5). About 2250 record warm daily highs and lows were recorded, but more than one and a half times as many record cool daily highs and lows (over 3600) were observed. When integrated across the month, the north central and southeastern parts of the country averaged cooler than normal while the Midwest to Northeast and parts of the West were warmer than normal.
The intrusions of cold air masses produced heavy snow outbreaks when they mixed with the moist southerly flow, but the snow cover did not last long under the intensifying sunlight and subsequent warm fronts. Monthly snow cover averaged below normal for May due to the ephemeral nature of these snow storms and below-normal snow cover in the West.
The rain-producing systems largely missed the West and Ohio Valley, and parts of the Mid-Atlantic coast and Gulf of Mexico coast were also drier than normal. Drought expanded in the West, where the circulation favored an upper-level ridge, but it contracted under beneficial rains in the Plains, Midwest, and Southeast. Overall, the national drought footprint shrank from 46.9 percent in moderate to exceptional drought last month to 44.1 percent at the end of May (according to U.S. Drought Monitor statistics). When the temperature and precipitation anomalies are integrated across the country and across the month, May 2013 ranked as the 40th warmest and 17th wettest May for the nation.
 |
 |
Subtropical highs, and cold fronts and low pressure systems moving in the storm track flow, are influenced by the broadscale atmospheric circulation. The following describes several such large-scale atmospheric circulation drivers and their potential influence this month:
-
El Niño Southern Oscillation (ENSO)
- Description: Oceanic and atmospheric conditions in the tropical Pacific Ocean can influence weather across the globe. ENSO is characterized by two extreme modes: El Niño (warmer-than-normal sea surface temperature [SST] anomalies in the tropical Pacific) and La Niña (cooler-than-normal SST anomalies), with the absence of either of these modes termed "ENSO-neutral" conditions.
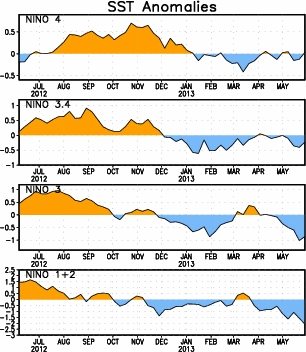
- Status: Ocean temperatures and atmospheric circulation anomalies indicated that the equatorial Pacific continued in an ENSO-neutral state during May, but SSTs were cooler-than-average over the eastern equatorial Pacific.
- Teleconnections (influence on weather): To the extent teleconnections are known, while in a neutral state, ENSO normally is not a player in the month's weather. Historical data can be analyzed to show typical temperature and precipitation patterns associated with El Niño and La Niña ENSO episodes. Teleconnections are not available for ENSO-neutral conditions.
-
Madden-Julian Oscillation (MJO)
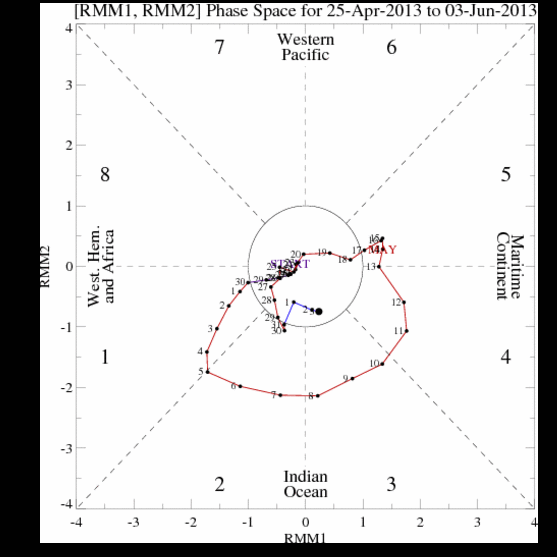
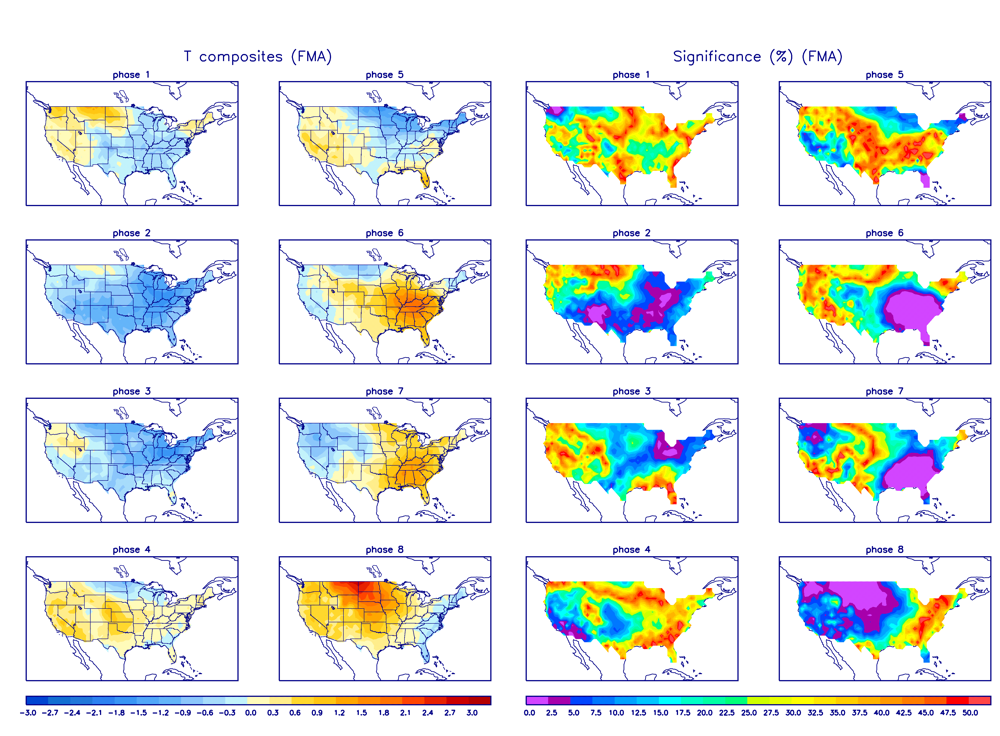
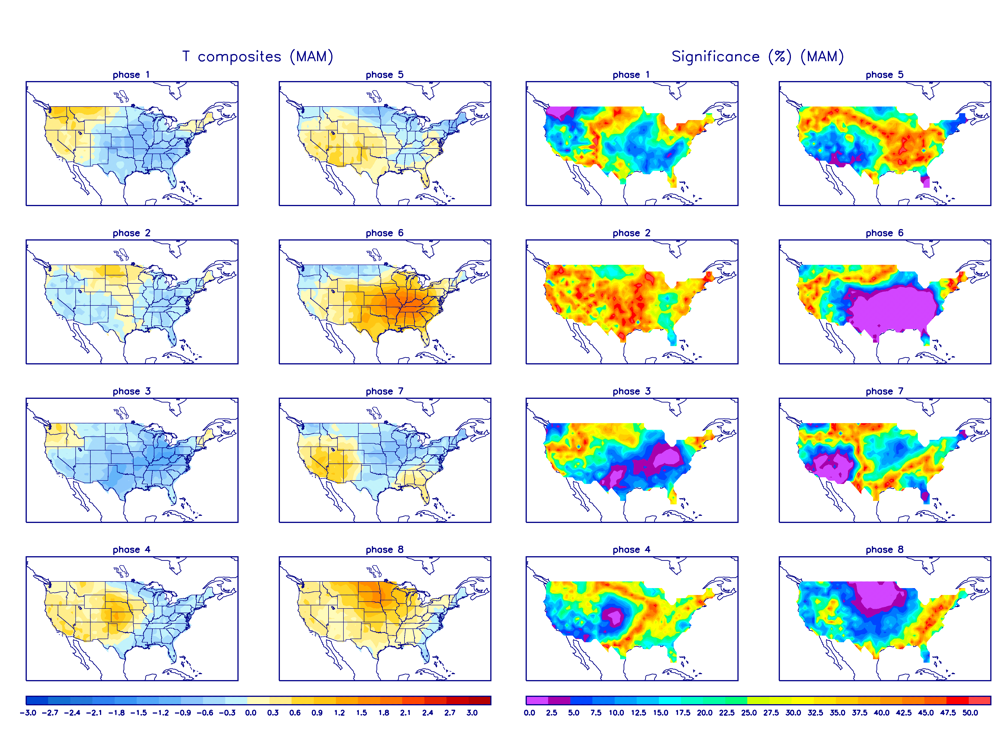
- Description: The MJO is a tropical disturbance or "wave" that propagates eastward around the global tropics with a cycle on the order of 30-60 days. It is characterized by regions of enhanced and suppressed tropical rainfall. One of its indices is a phase diagram which illustrates the phase (1-8) and amplitude of the MJO on a daily basis. The MJO is categorized into eight "phases" depending on the pattern of the location and intensity of the regions of enhanced and suppressed tropical rainfall. Overall, the MJO tends to be most active during ENSO-neutral years, and is often absent during moderate-to-strong El Niño and La Niña episodes.
- Status:The MJO transitioned through phases 1 to 4 during the first half of the month, entered phase 5 and weakened at mid-month, then further weakened and became incoherent during the last half of the month (indicated by the index moving into the inner circle on the phase diagram and by the MJO discussions for May 6, 13, 20, and 27).
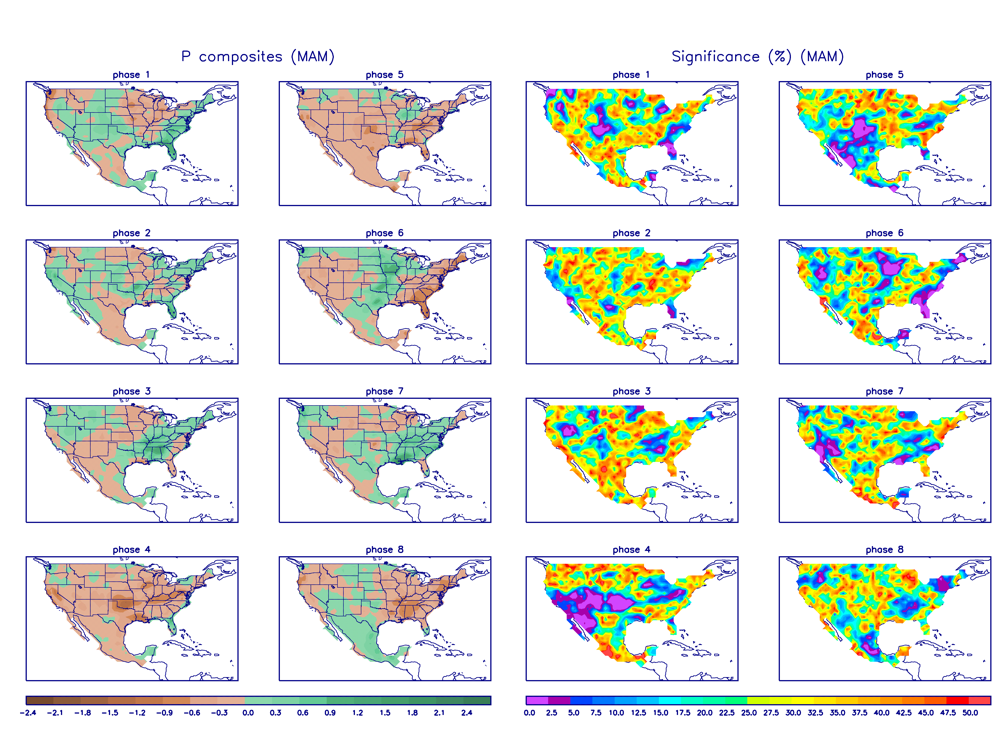
- Teleconnections (influence on weather): The MJO's temperature and precipitation teleconnections to U.S. weather depend on time of year and MJO phase. To the extent teleconnections are known, the March-May teleconnections for precipitation are shown here and for temperature are shown here.
- Observed: The MJO is transitory and can change phases (modes) within a month, so it is more closely related to weekly weather patterns than monthly. The May 2013 monthly precipitation pattern shows little correlation to the precipitation teleconnection patterns for MJO phases 1-4 this time of year. However, the weekly precipitation anomaly patterns correspond in some locations to the teleconnections for the MJO phase during these weeks — above-normal precipitation in the Southeast during week 1 is associated with phase 1, above-normal precipitation in the Northeast and California to the Great Basin during week 2 is associated with phases 2 and 3, and dry weather across much of the country during week 3 could be associated with phases 4 and 5. The May 2013 monthly temperature pattern shows some similarity to the teleconnections for MJO phases 1-4 (warmer than normal west and colder than normal east, especially Southeast). There are some regional differences, but the movement of the temperature anomaly patterns for weeks 1, 2, and 3 generally match the teleconnections for MJO phases 1, 2-3, and 4, respectively.
- The Pacific/North American (PNA) pattern
- Description: The PNA teleconnection pattern is associated with strong fluctuations in the strength and location of the East Asian jet stream. PNA-related blocking of the jet stream flow in the Pacific can affect weather downstream over North America, especially the West and especially in the winter half of the year.
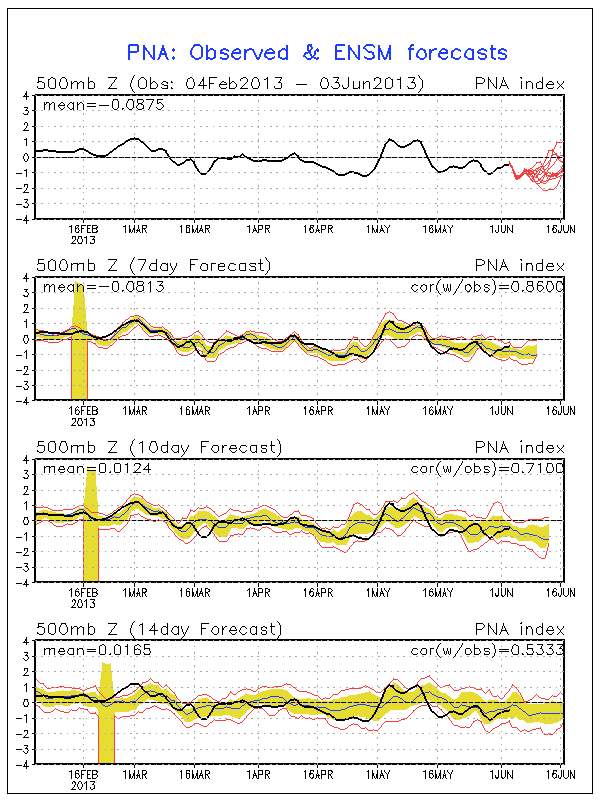
- Status: The daily PNA index was positive for the first half of May, then turned negative for the second half, averaging negative for the month as a whole.
- Teleconnections (influence on weather): To the extent teleconnections are known, the temperature teleconnection map for this time of year (April on the maps) shows that a negative PNA is correlated with warmer-than-normal temperatures in the Southeast and Southern Plains and cooler-than-normal temperatures in the Pacific Northwest and especially in western Canada and Alaska (a positive PNA has the opposite correlations). The precipitation teleconnections are weak. The upper-level circulation anomalies associated with a negative PNA are below-normal heights over much of Canada, especially western Canada, and above-normal heights over southeastern North America.
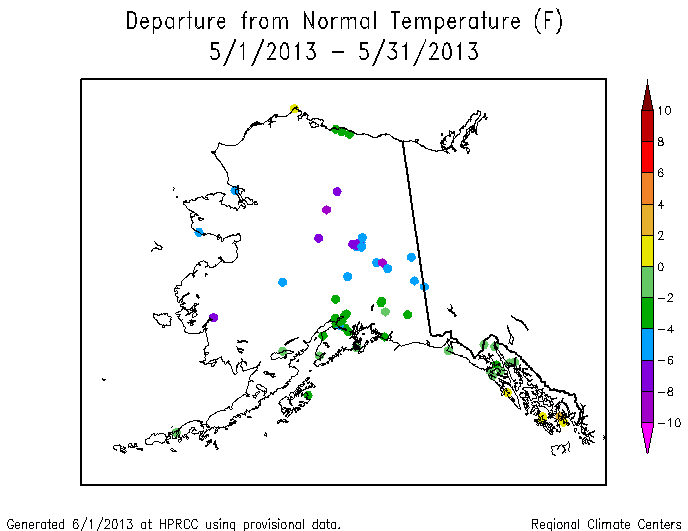
- Observed: Alaska was cooler than normal during May (consistent with a negative PNA), but the temperature anomaly pattern over the contiguous U.S. is a better match for a positive PNA. The March-May temperature anomaly pattern also is a reasonable match for a positive PNA. The May precipitation anomaly pattern is too variable to be correlated well with the weak PNA teleconnections. The May 2013 upper-level circulation pattern had positive anomalies across much of Canada, which is consistent with a positive PNA, but the pattern did not show negative anomalies across the southeastern United States.
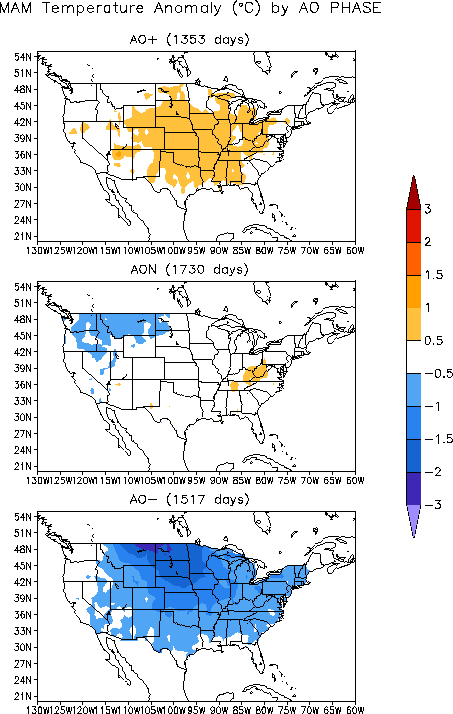
- The Arctic Oscillation (AO) pattern
- Description: The AO teleconnection pattern relates upper-level circulation over the Arctic to circulation features over the Northern Hemisphere mid-latitudes and is most active during the cold season.
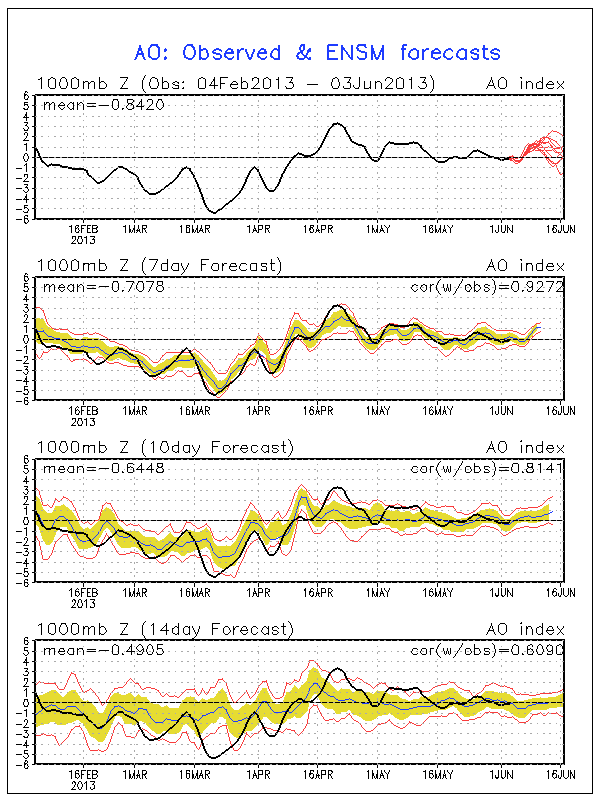
- Status: The daily AO index began May positive, then turned neutral (near zero) during the last half of the month, and averaged positive for the month.
- Teleconnections (influence on weather): To the extent teleconnections are known, a positive AO this time of year (March-May) is typically associated with warmer-than-normal temperatures across the contiguous U.S. from the Rockies to the Appalachians, patchy dry conditions in the West, central Plains, and Gulf of Mexico to Atlantic coasts, although the precipitation correlations are weak. The March-May averaged upper-level circulation anomalies for a positive AO are above-normal 500-millibar (mb) geopotential heights (which translates to weaker trough or stronger ridge, depending on the circulation) over the eastern U.S. and bands of the mid-latitude North Atlantic and North Pacific, and below-normal 500-mb heights (which translates to weaker ridge or stronger trough, depending on the circulation) over the Arctic and northern Canada.
- Observed: The May monthly temperature anomaly pattern is not consistent with any phase of the AO (positive, negative, or neutral), but the March-May temperature anomaly pattern is a good match for a negative AO. There is some agreement with the May precipitation pattern in the parts of the Gulf and Mid-Atlantic coasts, Plains, and West. The May 2013 upper-level circulation had negative anomalies over the Arctic and positive height anomalies over southern Canada and the northern U.S., which is somewhat consistent with a positive AO, although the anomalies seem shifted to the north.
- The North Atlantic Oscillation (NAO) pattern
- Description: The NAO teleconnection pattern relates upper-level circulation over the North Atlantic Ocean to circulation features over the Northern Hemisphere mid-latitudes.
- Status: Like the AO index, the daily NAO index began the month positive, then fluctuated around zero for the last half of the month, and averaged positive for the month.
- Teleconnections (influence on weather): To the extent teleconnections are known, a positive NAO during this time of year (April on the teleconnection maps) is typically associated with warmer-than-normal temperatures for much of the country except the South and Southeast, drier-than-normal conditions in the Southeast, Central Plains, and parts of the West (although the correlations are weak for precipitation), and positive upper-level circulation anomalies across most of the country, especially over the Central Rockies.
- Observed: The May and March-May 2013 temperature anomaly patterns agree with that expected for a positive NAO in parts of the country but are a poor match overall. The May precipitation anomaly pattern is a reasonable match where correlations exist. The May 2013 upper-level circulation anomaly pattern is somewhat consistent with a positive NAO, but the positive anomalies seem shifted northward into Canada.
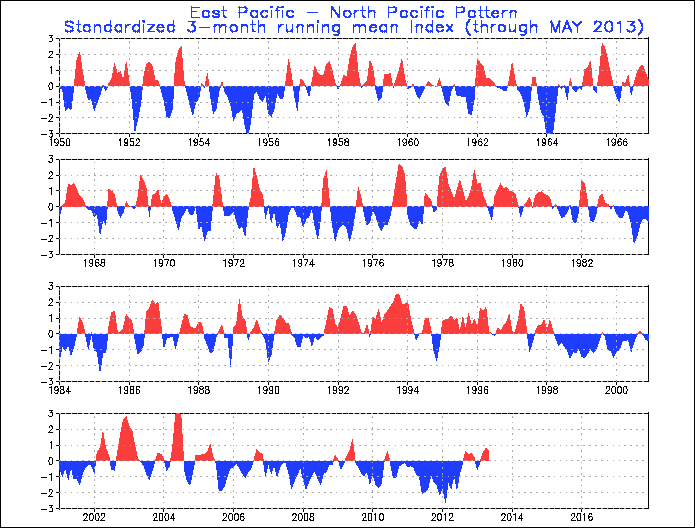
- The East Pacific-North Pacific (EP-NP) pattern
- Description: The EP-NP teleconnection pattern relates SST and upper-level circulation patterns over the eastern and northern Pacific to temperature, precipitation, and circulation anomalies downstream over North America. Its influence during the winter is not as strong as during the other three seasons.
- Status: The SST pattern over the northeast Pacific during May 2013 was dominated by a large pool of warmer-than-normal SSTs in the central North Pacific which intensified and expanded, while the cooler-than-normal SSTs along the western U.S. coast continued to shrink. The EP-NP index (3-month running mean) continued positive but the monthly index went slightly negative.
- Teleconnections (influence on weather): To the extent these teleconnections are known, a positive EP-NP index during this time of year (April on the maps) is typically associated with cooler-than-normal temperatures east of the Rockies, warmer-than-normal temperatures along the West Coast and Alaska, below-normal upper-level circulation anomalies (stronger upper-level trough) over eastern North America, and above-normal upper-level circulation anomalies (stronger upper-level ridge) over western North America (the correlations are weak for precipitation). A negative EP-NP index is associated with the opposite conditions.
- Observed: The temperature anomalies for May (except for the Ohio Valley to Northeast, and Alaska) and March-May are a good match for a positive EP-NP. The upper-level circulation anomaly patterns are not consistent with those expected for either a positive or negative EP-NP.
 |
 |
Examination of these circulation indices and their teleconnection patterns, and comparison to observed May 2013 and March-May 2013 temperature, precipitation, and circulation patterns, suggests that the MJO, PNA, AO, and EP-NP drivers each exerted some influence during May (the influence for temperature is stronger than for precipitation this time of year). ENSO was neutral, and thus not a player; the MJO weakened during the month and became less influential, but still was a player early in the month; and the PNA, NAO, and AO changed signs during the month, thus making their signals difficult to decipher. The MJO signal could be seen during the first 3 weeks in both the temperature and precipitation patterns, and the positive PNA likely reinforced the MJO for temperature during this period. The upper-level circulation pattern for May shows some hint of consistency with a positive PNA, AO, and NAO, but it is not a really good match for any of them. The influence of the AO and EP-NP drivers is more evident on a seasonal (last 2 to 3 months) basis than monthly (May) basis. This month illustrates how competing atmospheric drivers can result in a complex weather pattern and how, when the atmospheric circulation drivers are neutral or in a state of transition, their influence can become difficult to trace and can be overwhelmed by other competing forces, including random fluctuations in the atmosphere.