Climate Data Online: Integrated Mapping Tool Help
Getting Started
The Mapping Tool application uses Adobe® Flash technology to display the interactive data within web browsers. Please make sure that all Flash plugins are updated to the most recent version for a better experience.
The Integrated Mapping applications have been tested for use at a resolution of 1024x768 or greater with the following web browsers:
Using the Map
Step 1
Navigate to the Integrated Map Application. Once the map is loaded, follow the steps to locate and identify stations and download data.
Step 2
Use the  Layer controls to adjust the desired map layer visiblity.
Step 3
Navigate to your area of interest on the map.
Step 4
With  Identify or
  Select Tools, select features on the map.
Step 5
In the Results window, select  checkboxes or click the
  Data icon to access. Click the
  Graph icon to view data.
Navigation
How to use different parts of the navigation tools and find your way around the maps.
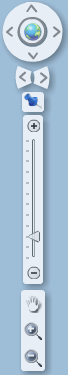
Controller
 |
 |
Zoom to Full Map | zooms the map to the full extent |
| Previous Map | zooms the map back to the previous extent | ||
| Next Map | zooms the map forward to the next extent, if applicable | ||
 |
Zoom to Latitude/Longitude | zooms the map to a user-defined geographic coordinate location | |
 |
Zoom slider | the zoom slider allows the map to zoom in/out to different map scales | |
 |
Move Map | moves the map without changing the scale; click, hold, then drag the map in the desired direction and release |
|
 |
Zoom In | zooms map into a smaller geographic area, showing more detail; zoom in by drawing a rectangle on the map |
|
 |
Zoom Out | zooms map out to a larger geographic area, showing less detail; zoom out by drawing a rectangle on the map |
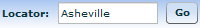
Locator
The locator enables you to search for and navigate to areas of interest: countries, states, provinces, counties, cities, landmarks, water bodies, zip codes, etc. Searches are not case-sensitive.
Step 1
Enter a location into the text box and click the Go button:
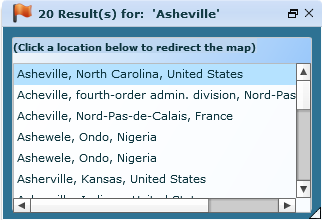
Step 2
The results are displayed in a new window. Click on a result to redirect the map to that location.
Mouse Wheel
The mouse wheel can be used to zoom the map in and out where available. Scroll the mouse wheel up to zoom in and down to zoom out.
Basemaps
The basemap is the layer on which all other map layers draw on top of. One basemap layer is always visible.
Move the mouse over the Basemaps button to open the thumbnail gallery. 
Click on the thumbnail of your preferred basemap* and the basemap layer of the map will be updated.
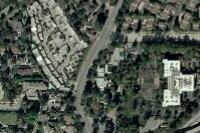 Satellite |
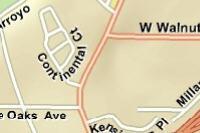 Streets |
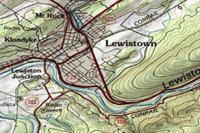 Topo |
* not all basemaps are shown
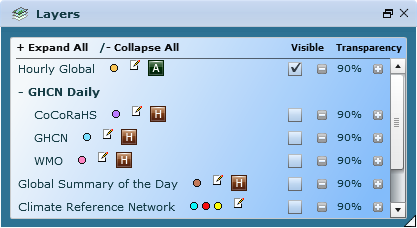
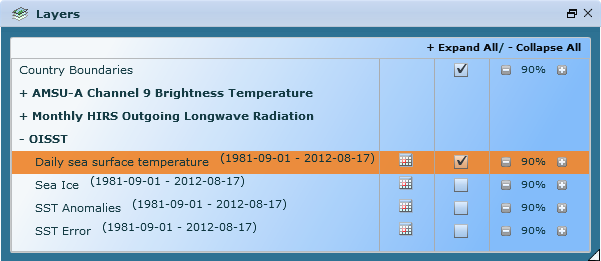
Layers
The layers window allows control over the visibility and transparency of the layers available in the map application. The layer legend image may also be displayed.
Step 1
Click the Layers button to open the layers window:
Step 2
Use any of the following options*:
|
Toggle Visibility | Turns the layer visibility on/off |
 |
Set Transparency | Sets the transparency level of the layer |
 |
Select Date | Select a date or a date range |
 |
Historical Active | Toggles between historical and active stations |
 |
Metadata | Link to layer metadata |
* not available for all layers
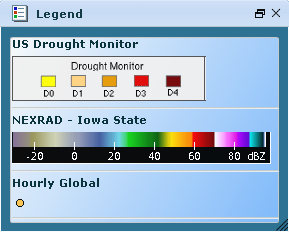
Legend
The legend window displays a legend of all visible layers on the map, excluding the basemap layer.
 Click the Legend button to display the legend window.
Tools
Identify
The Identify tool queries and displays information about visible features on the map, excluding the basemap layer.
Step 1
Click the Identify tool to make it active.
Step 2
Click on a feature on the map and the results will display in a window:
Select
The Select Tools window allows various types of querying against a selected map layer, excluding the basemap layer.
Step 1
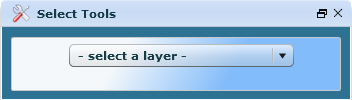
Click Select Tools Select Tools to display the Select Tools window:
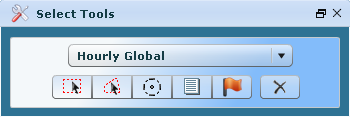
Step 2
Select a map layer and the tools become visible:
Step 3
Use functionality* as desired:
 |
Select By Rectangle | Selects features from the map layer based on a user-defined rectangle. Using the mouse, left-click, hold, and draw a rectangle on the map. |
 |
Select By Polygon | Selects features from the map layer based on a user-defined polygon. Using the mouse, left-click, hold, and draw a polygon on the map. |
 |
Select By Proximity | Selects features from the map layer based on a user-defined point and a radial distance. Enter the distance, units (miles or kilometers), and click a point on the map. |
 |
Select By Attributes | Selects features from the map layer based on attribute values. Enter the search text and click 'Search'. |
 |
Select By Location | Selects features from the map layer based on a location (i.e. country, state, county, climate division, climate region, USGS HUCs, or zip code). Choose the appropriate location from the dropdown list(s) and click 'Search'. |
 |
Clear Graphics | Clears any highlighted graphics from the map. |
Step 4
Selected features will be highlighted on the map and the results will display in a window:
View more details about the Results window.
* not available on all maps
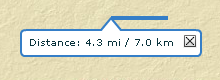
Measure
The measure tool allows distance to be measured long a drawn line. Distance is displayed in both miles and kilometers.
Step 1
Click the  Measure tool to make it active.
Step 2
With the mouse cursor over the map, left-click and hold, then draw a line and release. The measure results display. Click the X to clear.
The print tool allows map printing in either landscape or portrait orientation.
Step 1
Click the  Print tool to open the Print Options window:
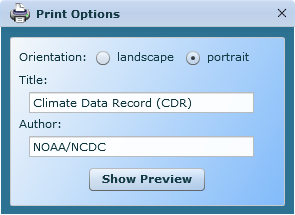
Step 2
Choose the orientation, edit the map title and author, and click the Show Preview button. The Print Preview window opens:
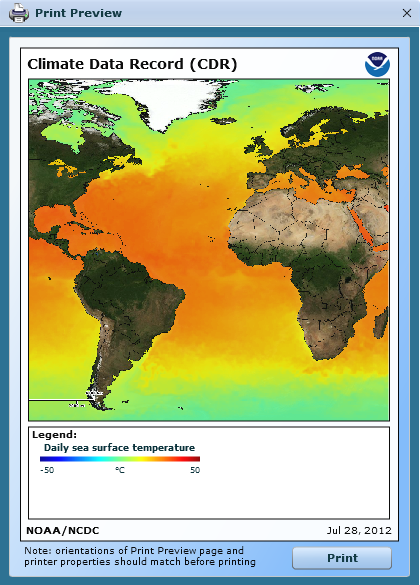
Step 3
Click the Print button. Note that the orientation of both the Print Preview page and the printer properties should match before printing.
Legacy Search
A legacy-style search (i.e. web page dropdowns and picklists) can be accomplished via the map:
Using the legacy search
Step 1
Click Select Tools to display the options window:
Step 2
Select a map layer and click the Location icon:
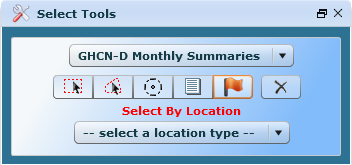
Step 3
Select a location type from the dropdown (e.g. US State) and select a state:
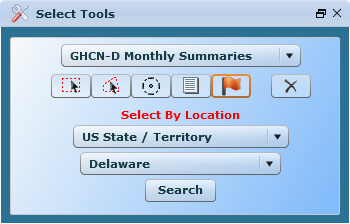
Step 4
Click the Search button. Selected features will be highlighted on the map and the results will display in a window:
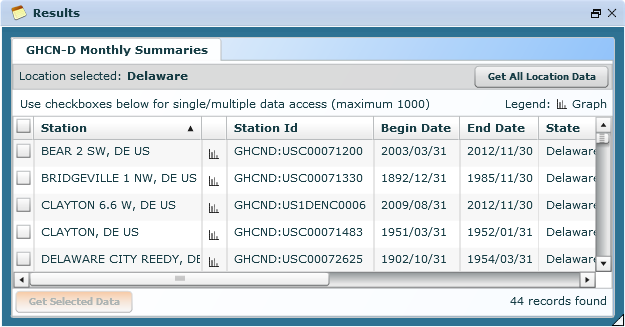
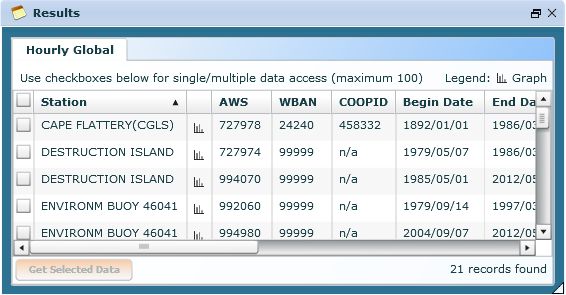
Results
The results window displays map layer selection sets.
Note: There is a limit to the number of features the map will display. View more details about the maximum number of records.
Getting data with results
Step 1
With Identify or Select Tools, select features on the map. The results will display in a window:
Note: If sorting of the search results is not functioning properly, the recommended fix is to clear the cache in your browser.
Step 2
Use functionality* as desired:
|
Selects records for data retrieval via Climate Data Online (CDO). |
 |
Passes the selected records to Climate Data Online (CDO) for data retrieval. |
 |
Passes the selected location to Climate Data Online (CDO) for data retrieval. This is only available when a Select By Location query has been performed. |
|
Allows the graphing of data for the selected record. |
* not available for all layers or maps
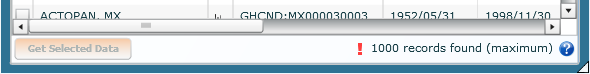
Max Features
Be aware that the map will only highlight and return a maximum of 1,000 features in a result set, regardless of how many features are actually selected.
The result set feature count is indicated at the bottom right hand corner of the Results window:
MultiGraph
MultiGraph* is an interactive graphing tool. The graph's appearance can be manipulated by clicking and dragging on the either the horizontal or vertical axis. Multiple variables can be graphed.
* not available for all layers or maps
Using Multigraph
Step 1
With Identify or Select Tools, select features on the map. The results will display in a window:
Step 2
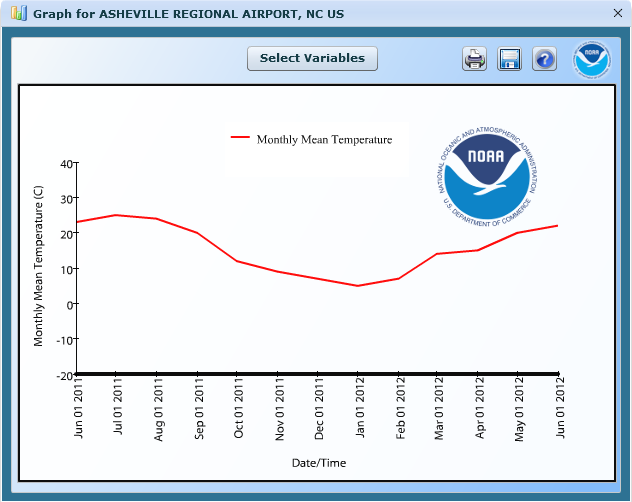
Click the Graph icon on the desired record to open the Graph window:
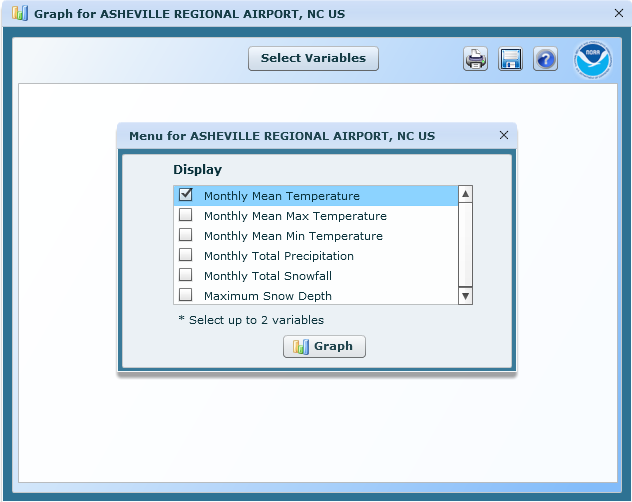
Step 3
Select up to 2 variables and click the Graph button. The graph will load:
Step 4
Use functionality as desired:
| Change Date/Time (Horizontal Drag) | to move the graph forward or backwards in time, click and drag on the horizontal axis (to the left or right) while holding the mouse button down. |
| Expand or Compress Date/Time (Horizontal Stretch or Shrink) | to stretch or shrink the date/time, hold the <Shift> key down and click and drag on the horizontal axis while holding down the mouse button. Dragging to the right expands and dragging to the left compresses. The axis will expand or compress at the point where you begin dragging. |
| Change Vertical Axis (Vertical Drag) | to change the vertical axis, click and drag on the vertical axis (up or down) while holding the mouse button down. |
| Expand or Compress Vertical Axis (Vertical Stretch or Shrink) | to stretch or shrink the vertical axis, hold the <Shift> key down and click and drag on the vertical axis while holding the mouse button down. The axis will expand or compress at the point where you begin dragging. |
NEXRAD Radar
The NEXRAD Radar custom component* allows browsing of historical NEXRAD National Reflectivity Mosaics and ordering of historical NEXRAD data.
The mosaic data is available from 1995/01/01 and is courtesy of Iowa Environmental Mesonet (IEM)
* not available on all maps
Getting NEXRAD Radar Data
Step 1
Use the Layer controls to make the National Reflectivity Mosaic map layer visible.
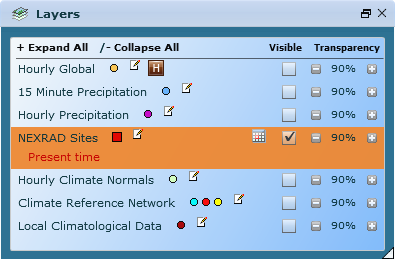
Step 2
Click the Calendar icon to open the National Reflectivity Mosaic and Data window:
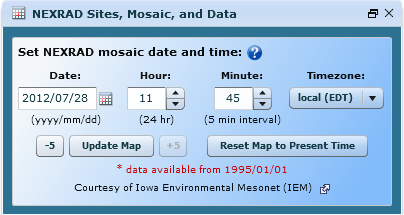
Step 3
Browse historical National Reflectivity Mosaics by setting the date and time and clicking the Update Map button. Incremental buttons (+ or - 5 minutes) are also available.
Step 4
With Identify or Select Tools, select NEXRAD stations on the map. The results will display in a window:
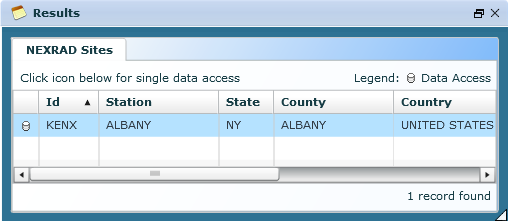
Step 5
In the Results window, select records and click the Get Selected Data button for data retrieval via Climate Data Online (CDO).
NetCDF Downloads
The NetCDF Download custom component* allows downloading of Network Common Data Form (NetCDF) array-oriented scientific data.
* not available on all maps
Using NetCDF
Step 1
Use the Layer controls to make a NetCDF map layer visible. Optionally, click the Calendar icon to set a particular dataset date.
Step 2
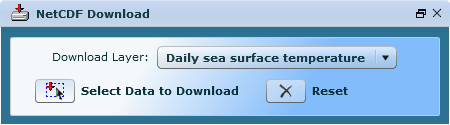
Click the  NetCDF Download button to open the NetCDF Download window. Choose the NetCDF layer from the dropdown and click the
  Select Data to Download button:
Step 3
Using the mouse, left-click, hold, and draw a rectangle on the map in the desired location. The NetCDF Download window expands and displays additional information like Period of Record, Bounding Box, and file size.
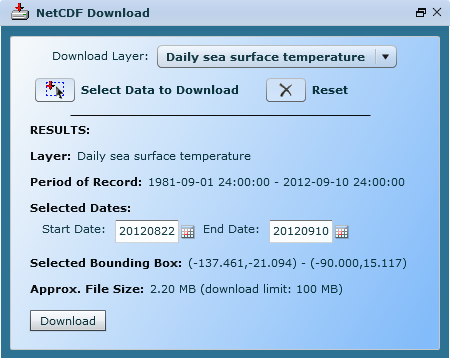
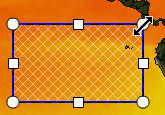
Step 4
Use the Calendar icons to set the dataset start and end dates. Adjust the area of interest by resizing or moving the highlighted selection graphic:
Step 5
Click the Download button. A window opens prompting for the file name and save location:
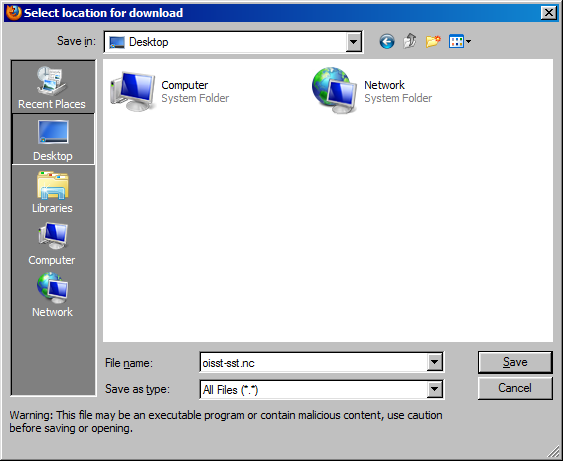
Step 6
Accept or edit the file name and save location defaults and click Save. The file download progress displays:
Step 7
A message appears when the NetCDF download has completed: