West North Pacific Basin
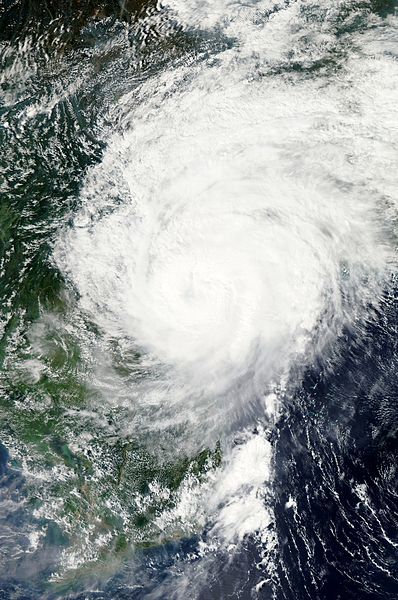
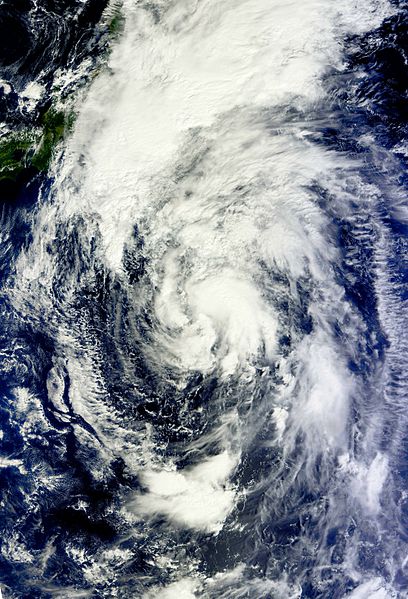 Tropical Storm Maliksi Satellite Image |
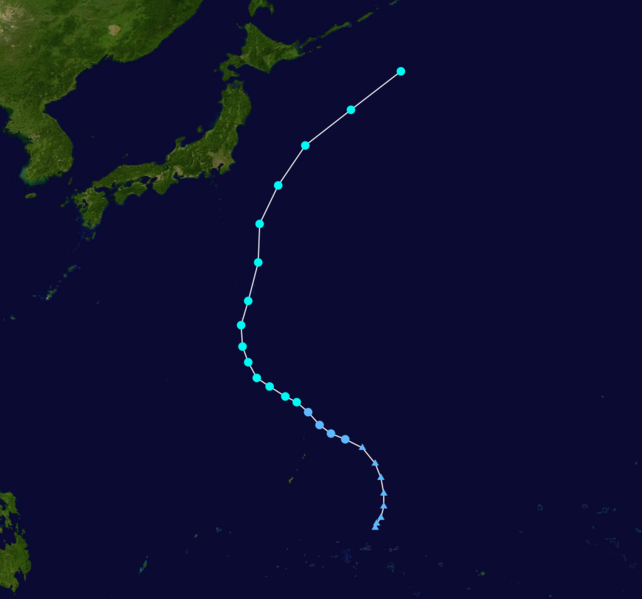 Tropical Storm Maliksi Forecast Track  Saffir-Simpson Scale Color Legend |
| Tropical Cyclone | Maliksi | Cyclogenesis Date | 10/01 | ||||||
| Cyclolysis Date | 10/05 | ||||||||
| Highest Saffir-Simpson Category | TS | ||||||||
| Maximum 6-hr Sustained Wind | 52 mph (45 kt or 83 km/h) | ||||||||
| Min Pressure | 985 mbar | ||||||||
| Accumulated Cyclone Energy (ACE*) Index (kt2) | 2.7500 x 10⁴ | ||||||||
| Landfall Information (date, location and sustained winds) | |||||||||
| Deaths | |||||||||
| *The (ACE) Index calculations are based on preliminary data. | |||||||||
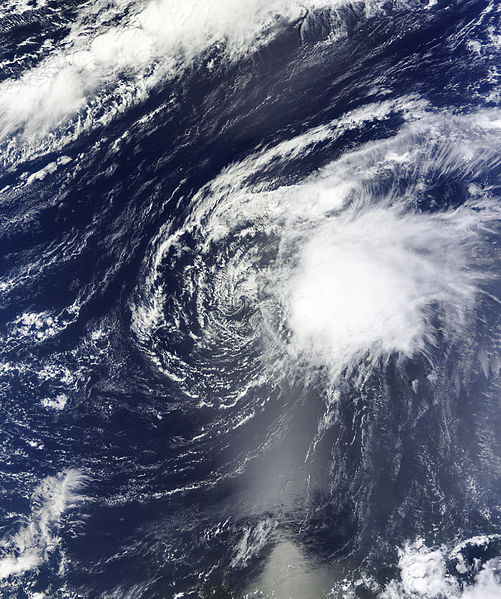
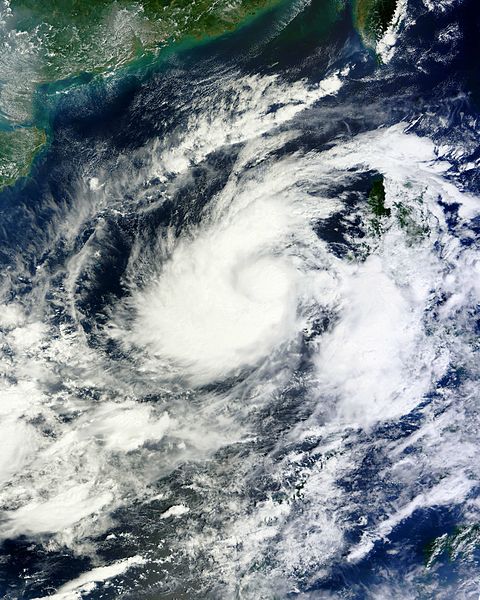 Tropical Storm Gaemi Satellite Image |
 Tropical Storm Gaemi Forecast Track Saffir-Simpson Scale Color Legend |
| Tropical Cyclone | Gaemi(Marce) | ||||||||
| Cyclogenesis Date | 10/01 | ||||||||
| Cyclolysis Date | 10/06 | ||||||||
| Highest Saffir-Simpson Category | TS | ||||||||
| Maximum 6-hr Sustained Wind | 63 mph (55 kt or 102 km/h) | ||||||||
| Min Pressure | 990 mbar | ||||||||
| Accumulated Cyclone Energy (ACE*) Index (kt2) | 3.4500 x 10⁴ | ||||||||
| Landfall Information (date, location and sustained winds) | |||||||||
| Deaths | |||||||||
| *The (ACE) Index calculations are based on preliminary data. | |||||||||
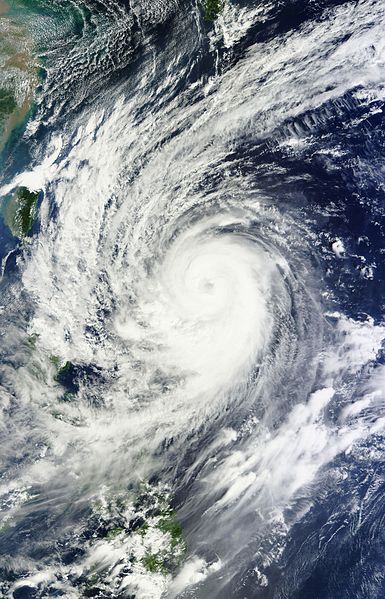 Tropical Storm Prapiroon Satellite Image |
 Tropical Storm Prapiroon Forecast Track Saffir-Simpson Scale Color Legend |
| Tropical Cyclone | Prapiroon(Nina) | ||||||||
| Cyclogenesis Date | 10/07 | ||||||||
| Cyclolysis Date | 10/19 | ||||||||
| Highest Saffir-Simpson Category | Cat 3 | ||||||||
| Maximum 6-hr Sustained Wind | 115 mph (100 kt or 185 km/h) | ||||||||
| Min Pressure | 940 mbar | ||||||||
| Accumulated Cyclone Energy (ACE*) Index (kt2) | 22.5750 x 10⁴ | ||||||||
| Landfall Information (date, location and sustained winds) | |||||||||
| Deaths | |||||||||
| *The (ACE) Index calculations are based on preliminary data. | |||||||||
 Tropical Storm Maria Satellite Image |
 Tropical Storm Maria Forecast Track Saffir-Simpson Scale Color Legend |
| Tropical Cyclone | Maria | ||||||||
| Cyclogenesis Date | 10/07 | ||||||||
| Cyclolysis Date | 10/20 | ||||||||
| Highest Saffir-Simpson Category | TS | ||||||||
| Maximum 6-hr Sustained Wind | 63 mph (55 kt or 102 km/h) | ||||||||
| Min Pressure | 990 mbar | ||||||||
| Accumulated Cyclone Energy (ACE*) Index (kt2) | 3.9675 x 10⁴ | ||||||||
| Landfall Information (date, location and sustained winds) | |||||||||
| Deaths | |||||||||
| *The (ACE) Index calculations are based on preliminary data. | |||||||||
 Tropical Storm Ofel Satellite Image |
 Tropical Storm Ofel Forecast Track Saffir-Simpson Scale Color Legend |
| Tropical Cyclone | Ofel(Son-Tinh) | ||||||||
| Cyclogenesis Date | 10/24 | ||||||||
| Cyclolysis Date | 10/29 | ||||||||
| Highest Saffir-Simpson Category | Cat 3 | ||||||||
| Maximum 6-hr Sustained Wind | 127 mph (110 kt or 204 km/h) | ||||||||
| Min Pressure | 945 mbar | ||||||||
| Accumulated Cyclone Energy (ACE*) Index (kt2) | 9.9150 x 10⁴ | ||||||||
| Landfall Information (date, location and sustained winds) | 10/24 - Philippines (35 kt or 65 km/h) 10/28 - Vietnam (75 kt or 139 km/h) |
||||||||
| Deaths | 39 | ||||||||
| *The (ACE) Index calculations are based on preliminary data. | |||||||||
Atlantic Basin
 Tropical Storm Oscar Satellite Image  Tropical Storm Oscar Track Saffir-Simpson Scale Color Legend | |||||||||
| Tropical Cyclone | Oscar | ||||||||
| Cyclogenesis Date | 10/04 | ||||||||
| Cyclolysis Date | 10/05 | ||||||||
| Highest Saffir-Simpson Category | TS | ||||||||
| Maximum 6-hr Sustained Wind | 52 mph (45 kt or 83 km/h) | ||||||||
| Min Pressure | 997 mbar | ||||||||
| Accumulated Cyclone Energy (ACE*) Index (kt2) | .9700 x 104 | ||||||||
| Landfall Information (date, location and sustained winds) | |||||||||
| Deaths | 0 | ||||||||
| *The (ACE) Index calculations are based on preliminary data. | |||||||||
 Tropical Storm Patty Satellite Image 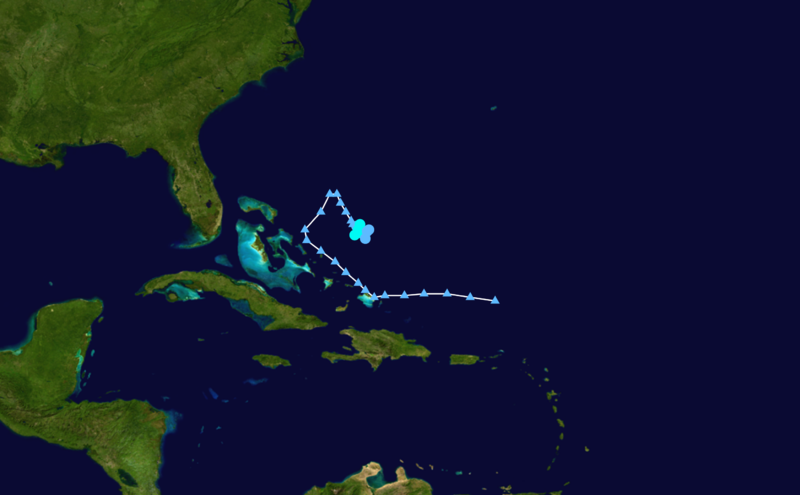 Tropical Storm Patty Track Saffir-Simpson Scale Color Legend | |||||||||
| Tropical Cyclone | Patty | ||||||||
| Cyclogenesis Date | 10/11 | ||||||||
| Cyclolysis Date | 10/12 | ||||||||
| Highest Saffir-Simpson Category | TS | ||||||||
| Maximum 6-hr Sustained Wind | 46 mph (40 kt or 74 km/h) | ||||||||
| Min Pressure | 1005 mbar | ||||||||
| Accumulated Cyclone Energy (ACE*) Index (kt2) | .6500 x 104 | ||||||||
| Landfall Information (date, location and sustained winds) | |||||||||
| Deaths | 0 | ||||||||
| *The (ACE) Index calculations are based on preliminary data. | |||||||||
 Tropical Storm Rafael Satellite Image  Tropical Storm Rafael Track Saffir-Simpson Scale Color Legend | |||||||||
| Tropical Cyclone | Rafael | ||||||||
| Cyclogenesis Date | 10/13 | ||||||||
| Cyclolysis Date | 10/17 | ||||||||
| Highest Saffir-Simpson Category | Cat 1 | ||||||||
| Maximum 6-hr Sustained Wind | 86 mph (75 kt or 139 km/h) | ||||||||
| Min Pressure | 969 mbar | ||||||||
| Accumulated Cyclone Energy (ACE*) Index (kt2) | 6.9975 x 10⁴ | ||||||||
| Landfall Information (date, location and sustained winds) | |||||||||
| Deaths | 1 | ||||||||
| *The (ACE) Index calculations are based on preliminary data. | |||||||||
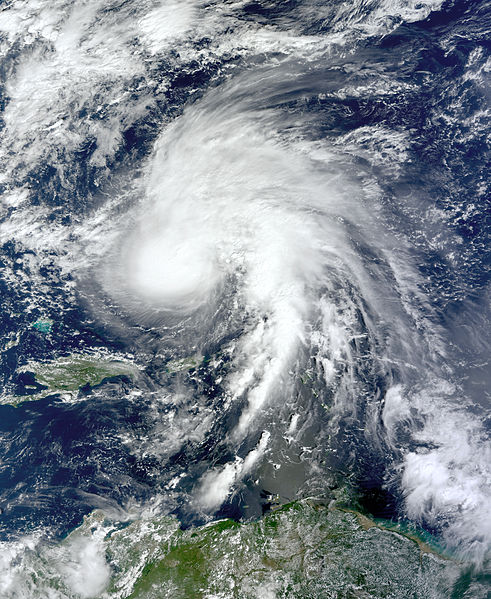
 Tropical Storm Sandy Satellite Image  Tropical Storm Sandy Track Saffir-Simpson Scale Color Legend | |||||||||
| Tropical Cyclone | Sandy | ||||||||
| Cyclogenesis Date | 10/23 | ||||||||
| Cyclolysis Date | 10/30 | ||||||||
| Highest Saffir-Simpson Category | Cat 2 | ||||||||
| Maximum 6-hr Sustained Wind | 105 mph (95 kt or 176 km/h) | ||||||||
| Min Pressure | 940 mbar | ||||||||
| Accumulated Cyclone Energy (ACE*) Index (kt2) | 14.2150 x 10⁴ | ||||||||
| Landfall Information (date, location and sustained winds) | 10/24 - Jamaica (70 kt or 130 km/h) 10/25 - Cuba (95 kt or 176 km/h) 10/29 - coastal New Jersey (80 kt or 148 km/h) |
||||||||
| Deaths | 165 | ||||||||
| *The (ACE) Index calculations are based on preliminary data. | |||||||||
The tropical storm which would develop into Hurricane Sandy formed in the Caribbean Sea, just south of Jamaica on October 22nd. Sandy moved northward, strengthening into a category 1 hurricane before making landfall along Jamaica’s southern coast. Hurricane Sandy continued its northward track across Cuba and the Bahamas through the 25th when the storm’s intensity peaked at Category 2 strength, with sustained winds of 105 miles per hour. Sandy moved parallel to the Eastern Seaboard of the U.S. where it weakened to Category 1 strength. On October 28th, tropical storm force winds reached the North Carolina coast. On the 29th, an upper level trough positioned over the eastern U.S. became negatively tilted (oriented from Northwest to Southeast), steering the storm directly towards the New Jersey Coast, an unusual tropical cyclone track. Warmer-than-average sea surface temperatures (3-5°F above average) allowed Sandy to retain tropical characteristics much farther north than what is typical this late in the North Atlantic Hurricane Season. Hours before landfall, Sandy began to lose tropical characteristics, and the storm hit near Atlantic City, New Jersey as it was transitioning from a tropical cyclone to an extra-tropical cyclone. At landfall, post-tropical storm Sandy had a central minimum pressure of 946 millibars and sustained winds of 80 miles per hour with tropical storm force winds extending up to 500 miles from the center of the storm.
At the time this report was published, it was known that Sandy had caused numerous fatalities across the Caribbean early in its life — 54 fatalities in Haiti, 11 in Cuba, 2 in both the Bahamas and Dominican Republic, and 1 in Jamaica. Impacts across the U.S. included record breaking storm surge for the densely populated Northeast Corridor, widespread wind damage, coastal and inland flooding, blizzard conditions for the Appalachians, and power outages to over 8 million households. Over 100 fatalities were confirmed due to Sandy in the U.S., mostly in New Jersey and New York. More information on the impacts of Sandy and records broken due to the storm in the U.S. can be found here:
- Sandy Precipitation
- Sandy Wind and Storm Surge
- Sandy Barometric Pressure Records
 Tropical Storm Tony Satellite Image  Tropical Storm Tony Track Saffir-Simpson Scale Color Legend | |||||||||
| Tropical Cyclone | Tony | ||||||||
| Cyclogenesis Date | 10/24 | ||||||||
| Cyclolysis Date | 10/25 | ||||||||
| Highest Saffir-Simpson Category | TS | ||||||||
| Maximum 6-hr Sustained Wind | 52 mph (45 kt or 83 km/h) | ||||||||
| Min Pressure | 1000 mbar | ||||||||
| Accumulated Cyclone Energy (ACE*) Index (kt2) | 1.3750 x 10⁴ | ||||||||
| Landfall Information (date, location and sustained winds) | |||||||||
| Deaths | 0 | ||||||||
| *The (ACE) Index calculations are based on preliminary data. | |||||||||
East North Pacific Basin
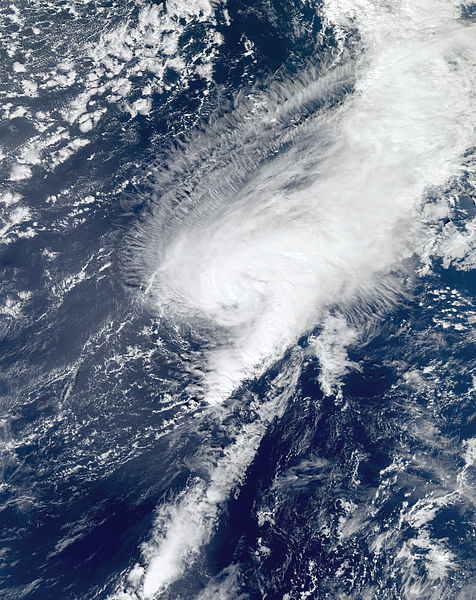
 Tropical Storm Olivia Satellite Image |
 Tropical Storm Olivia Forecast Track Saffir-Simpson Scale Color Legend |
| Tropical Cyclone | Olivia | ||||||||
| Cyclogenesis Date | 10/06 | ||||||||
| Cyclolysis Date | 10/08 | ||||||||
| Highest Saffir-Simpson Category | TS | ||||||||
| Maximum 6-hr Sustained Wind | 58 mph (50 kt or 93 km/h) | ||||||||
| Min Pressure | 998 mbar | ||||||||
| Accumulated Cyclone Energy (ACE*) Index (kt2) | 1.9850 x 10⁴ | ||||||||
| Landfall Information (date, location and sustained winds) | |||||||||
| Deaths | |||||||||
| *The (ACE) Index calculations are based on preliminary data. | |||||||||
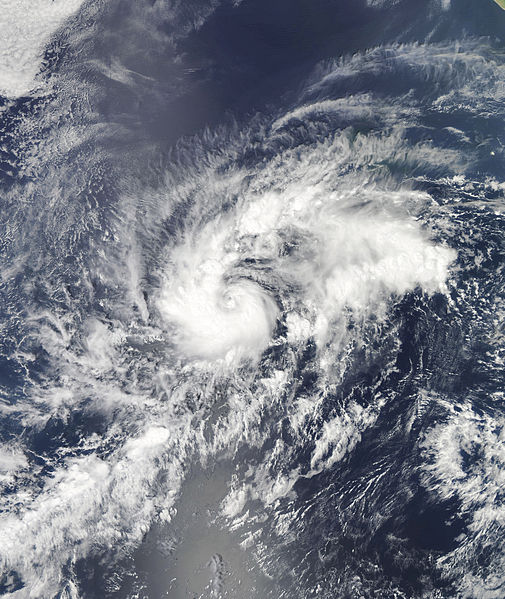
 Tropical Storm Paul Satellite Image |
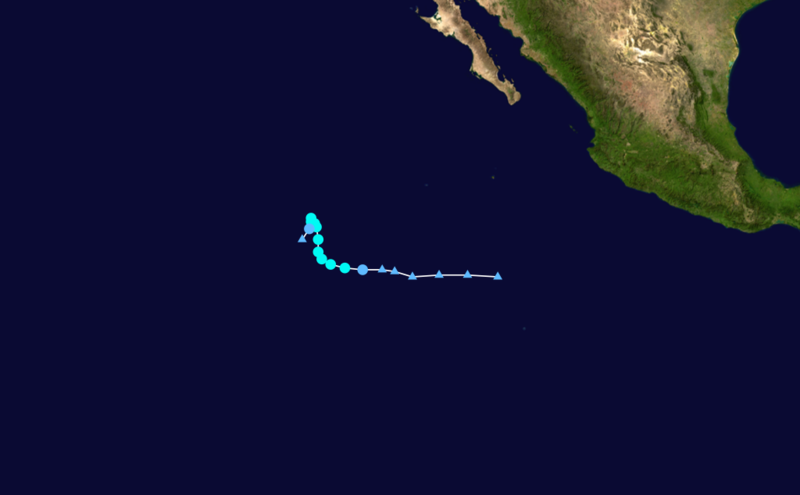
 Tropical Storm Paul Forecast Track Saffir-Simpson Scale Color Legend |
| Tropical Cyclone | Paul | ||||||||
| Cyclogenesis Date | 10/14 | ||||||||
| Cyclolysis Date | 10/17 | ||||||||
| Highest Saffir-Simpson Category | Cat 3 | ||||||||
| Maximum 6-hr Sustained Wind | 115 mph (100 kt or 185 km/h) | ||||||||
| Min Pressure | 960 mbar | ||||||||
| Accumulated Cyclone Energy (ACE*) Index (kt2) | 6.9825 x 10⁴ | ||||||||
| Landfall Information (date, location and sustained winds) | |||||||||
| Deaths | |||||||||
| *The (ACE) Index calculations are based on preliminary data. | |||||||||
 Tropical Storm Rosa Satellite Image |
 Tropical Storm Rosa Forecast Track Saffir-Simpson Scale Color Legend |
| Tropical Cyclone | Rosa | ||||||||
| Cyclogenesis Date | 10/30 | ||||||||
| Cyclolysis Date | |||||||||
| Highest Saffir-Simpson Category | TS | ||||||||
| Maximum 6-hr Sustained Wind | 58 mph (50 kt or 93 km/h) | ||||||||
| Min Pressure | 1000 mbar | ||||||||
| Accumulated Cyclone Energy (ACE*) Index (kt2) | N/A | ||||||||
| Landfall Information (date, location and sustained winds) | |||||||||
| Deaths | |||||||||
| *The (ACE) Index calculations are based on preliminary data. | |||||||||
North Indian Basin
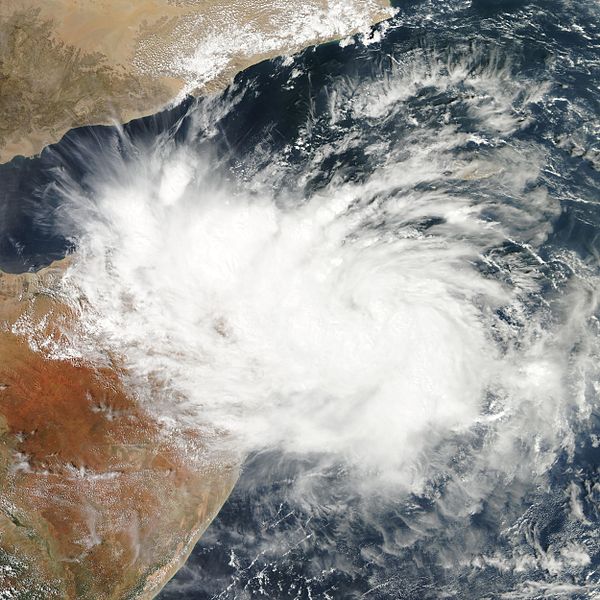 Tropical Storm Murjan Satellite Image |
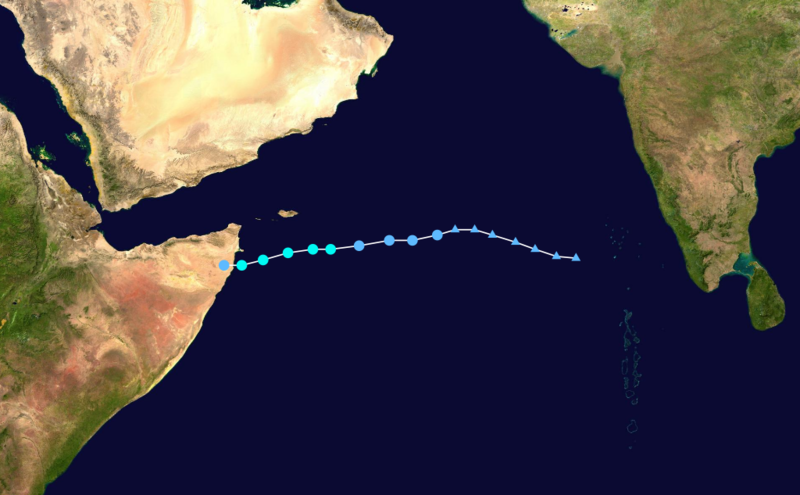 Tropical Storm Murjan Forecast Track Saffir-Simpson Scale Color Legend |
| Tropical Cyclone | Murjan | Cyclogenesis Date | 10/24 | ||||||
| Cyclolysis Date | 10/25 | ||||||||
| Highest Saffir-Simpson Category | TS | ||||||||
| Maximum 6-hr Sustained Wind | 40 mph (35 kt or 65 km/h) | ||||||||
| Min Pressure | 1000 mbar | ||||||||
| Accumulated Cyclone Energy (ACE*) Index (kt2) | .6125 x 104 | ||||||||
| Landfall Information (date, location and sustained winds) | |||||||||
| Deaths | |||||||||
| *The (ACE) Index calculations are based on preliminary data. | |||||||||
 Tropical Storm Nilam Satellite Image |
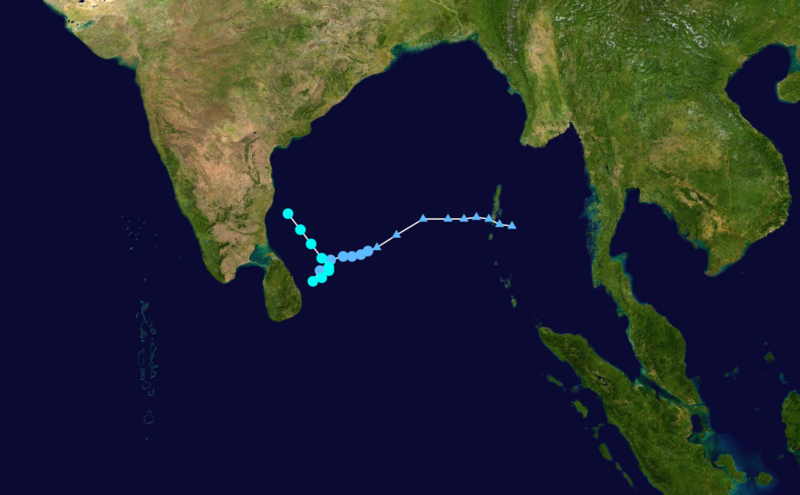 Tropical Storm Nilam Forecast Track Saffir-Simpson Scale Color Legend |
| Tropical Cyclone | Nilam | Cyclogenesis Date | 10/29 | ||||||
| Cyclolysis Date | |||||||||
| Highest Saffir-Simpson Category | TS | ||||||||
| Maximum 6-hr Sustained Wind | 63 mph (55 kt or 102 km/h) | ||||||||
| Min Pressure | 992 mbar | ||||||||
| Accumulated Cyclone Energy (ACE*) Index (kt2) | 2.0600 x 10⁴ | ||||||||
| Landfall Information (date, location and sustained winds) | |||||||||
| Deaths | |||||||||
| *The (ACE) Index calculations are based on preliminary data. | |||||||||