Note: This report catalogs recent tropical cyclones across the North Atlantic and East Pacific and places each basin’s tropical cyclone activity in a climate-scale context. It is not updated in real time. Users seeking the real time status and forecasts of tropical cyclones should visit The National Hurricane Center.
Atlantic Basin
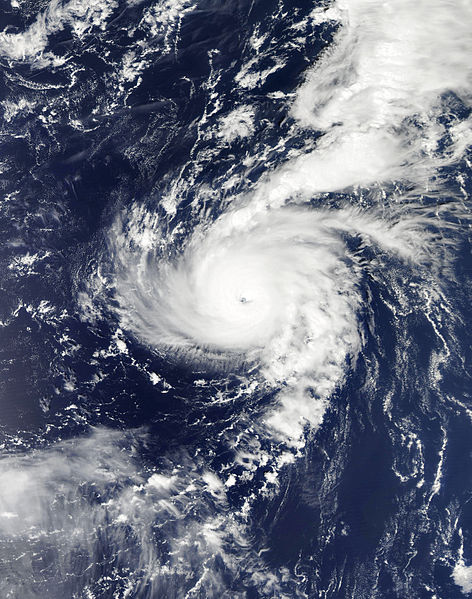 Tropical Storm Michael Satellite Image 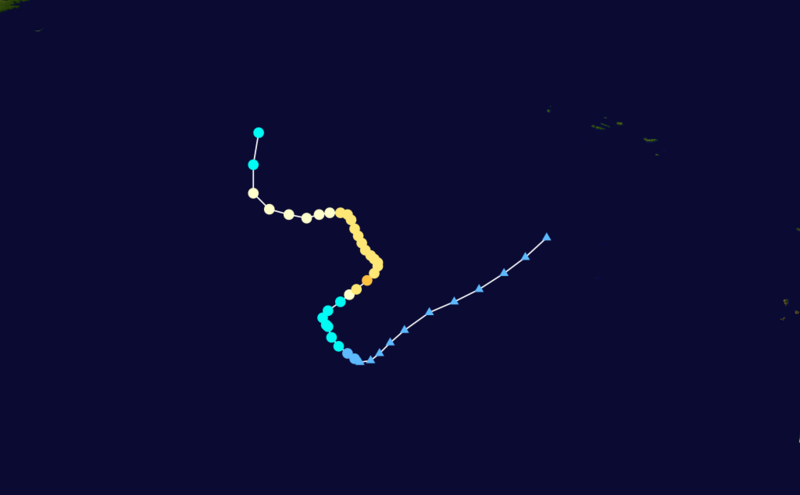 Tropical Storm Michael Track  Saffir-Simpson Scale Color Legend | |||||||||
| Tropical Cyclone | Michael | ||||||||
| Cyclogenesis Date | 09/04 | ||||||||
| Cyclolysis Date | 09/11 | ||||||||
| Highest Saffir-Simpson Category | Cat 3 | ||||||||
| Maximum 6-hr Sustained Wind | 115 mph (100 kt or 185 km/h) | ||||||||
| Min Pressure | 964 mbar | ||||||||
| Accumulated Cyclone Energy (ACE*) Index (kt2) | 16.7725 x 10⁴ | ||||||||
| Landfall Information (date, location and sustained winds) | |||||||||
| Deaths | 0 | ||||||||
| *The (ACE) Index calculations are based on preliminary data. | |||||||||
 Tropical Storm Nadine Satellite Image 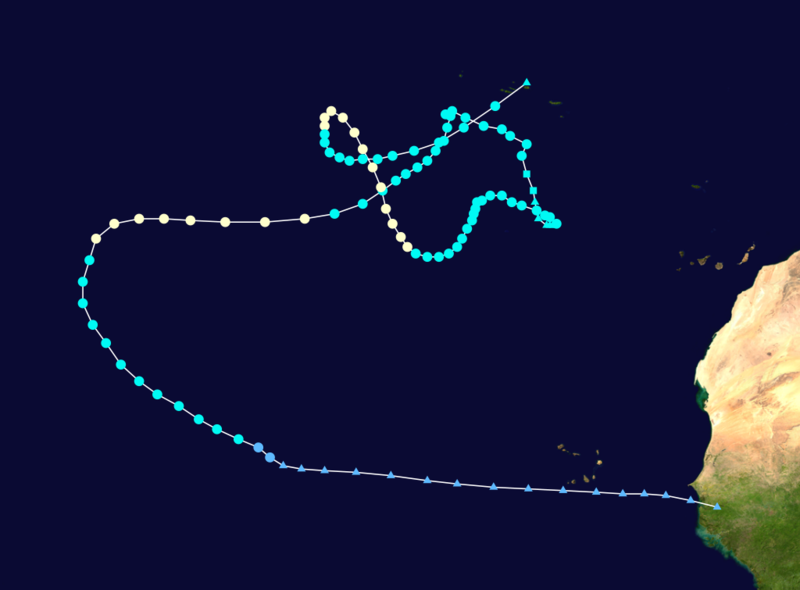 Tropical Storm Nadine Track Saffir-Simpson Scale Color Legend | |||||||||
| Tropical Cyclone | Nadine | ||||||||
| Cyclogenesis Date | 09/12 | ||||||||
| Cyclolysis Date | 10/04 | ||||||||
| Highest Saffir-Simpson Category | Cat 1 | ||||||||
| Maximum 6-hr Sustained Wind | 92 mph (80 kt or 148 km/h) | ||||||||
| Min Pressure | 978 mbar | ||||||||
| Accumulated Cyclone Energy (ACE*) Index (kt2) | 27.2050 x 10⁴> | ||||||||
| Landfall Information (date, location and sustained winds) | |||||||||
| Deaths | 0 | ||||||||
| *The (ACE) Index calculations are based on preliminary data. | |||||||||
West North Pacific Basin
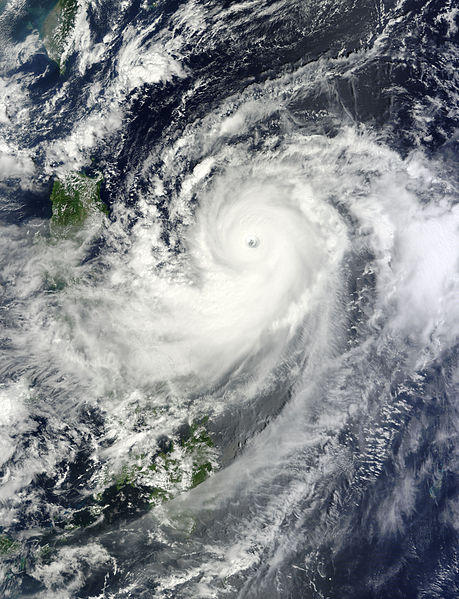
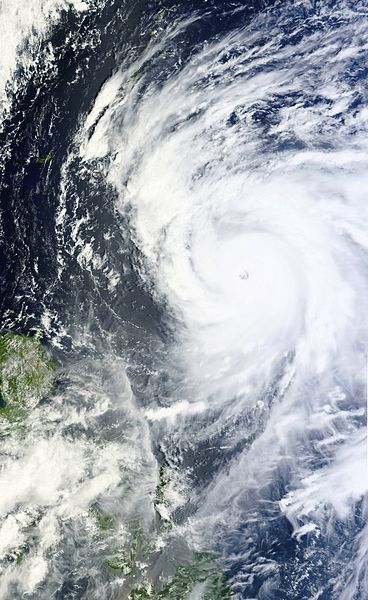 Tropical Storm Sanba Satellite Image |
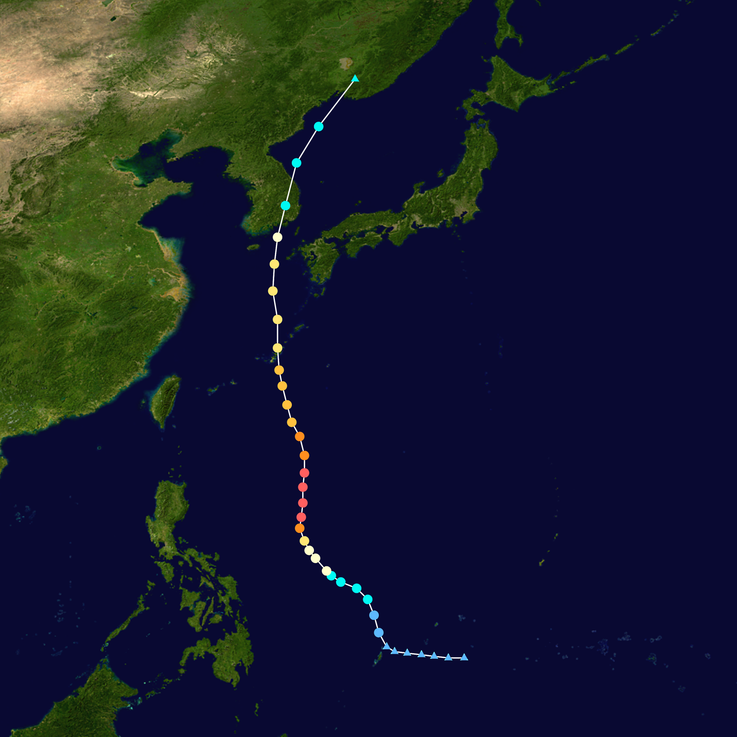 Tropical Storm Sanba Forecast Track Saffir-Simpson Scale Color Legend |
| Tropical Cyclone | Sanba(Karen) | ||||||||
| Cyclogenesis Date | 09/11 | ||||||||
| Cyclolysis Date | 09/17 | ||||||||
| Highest Saffir-Simpson Category | Cat 5 | ||||||||
| Maximum 6-hr Sustained Wind | 173 mph (150 kt or 278 km/h) | ||||||||
| Min Pressure | 900 mbar | ||||||||
| Accumulated Cyclone Energy (ACE*) Index (kt2) | 25.4250 x 10⁴ | ||||||||
| Landfall Information (date, location and sustained winds) | 09/17 - southern coast of South Korea (80 kt or 148 km/h) | ||||||||
| Deaths | 2 | ||||||||
| *The (ACE) Index calculations are based on preliminary data. | |||||||||
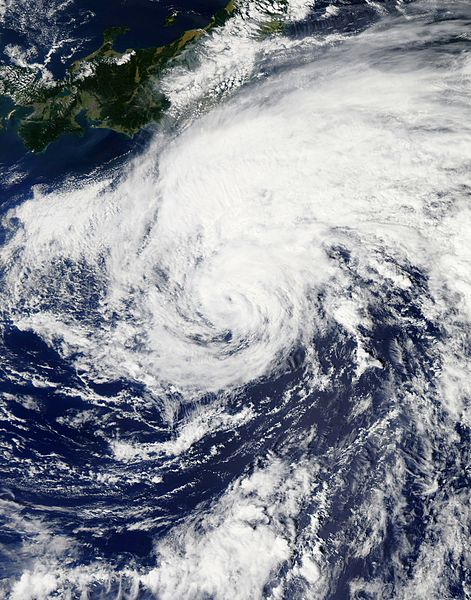
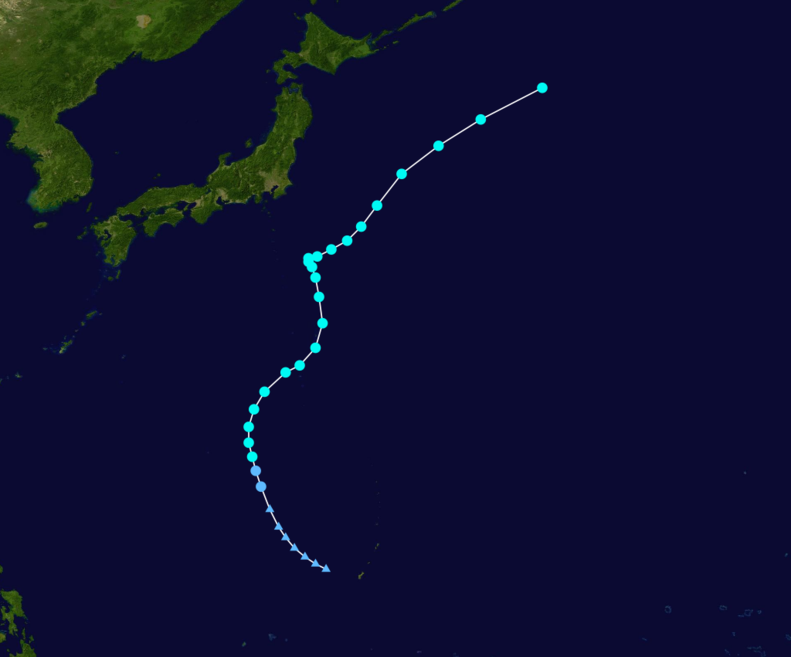
 Tropical Storm Jelawat Satellite Image |
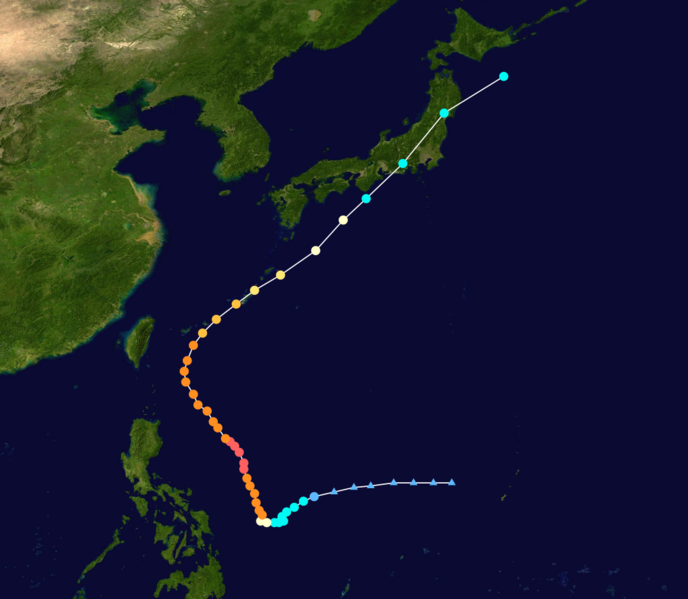 Tropical Storm Jelawat Forecast Track Saffir-Simpson Scale Color Legend |
| Tropical Cyclone | Jelawat(Lawin) | ||||||||
| Cyclogenesis Date | 09/20 | ||||||||
| Cyclolysis Date | 10/01 | ||||||||
| Highest Saffir-Simpson Category | Cat 5 | ||||||||
| Maximum 6-hr Sustained Wind | 161 mph (140 kt or 259 km/h) | ||||||||
| Min Pressure | 905 mbar | ||||||||
| Accumulated Cyclone Energy (ACE*) Index (kt2) | 45.2400 x 10⁴ | ||||||||
| Landfall Information (date, location and sustained winds) | |||||||||
| Deaths | 7 | ||||||||
| *The (ACE) Index calculations are based on preliminary data. | |||||||||
 Tropical Storm Ewiniar Satellite Image |
 Tropical Storm Ewiniar Forecast Track Saffir-Simpson Scale Color Legend |
| Tropical Cyclone | Ewiniar | ||||||||
| Cyclogenesis Date | 09/24 | ||||||||
| Cyclolysis Date | 09/30 | ||||||||
| Highest Saffir-Simpson Category | TS | ||||||||
| Maximum 6-hr Sustained Wind | 63 mph (55 kt or 102 km/h) | ||||||||
| Min Pressure | 985 mbar | ||||||||
| Accumulated Cyclone Energy (ACE*) Index (kt2) | 4.8000 x 10⁴ | ||||||||
| Landfall Information (date, location and sustained winds) | |||||||||
| Deaths | |||||||||
| *The (ACE) Index calculations are based on preliminary data. | |||||||||
East North Pacific Basin
 Tropical Storm Kristy Satellite Image |
 Tropical Storm Kristy Forecast Track Saffir-Simpson Scale Color Legend |
| Tropical Cyclone | Kristy | ||||||||
| Cyclogenesis Date | 09/12 | ||||||||
| Cyclolysis Date | 09/17 | ||||||||
| Highest Saffir-Simpson Category | TS | ||||||||
| Maximum 6-hr Sustained Wind | 58 mph (50 kt or 93 km/h) | ||||||||
| Min Pressure | 998 mbar | ||||||||
| Accumulated Cyclone Energy (ACE*) Index (kt2) | 2.8075 x 10⁴ | ||||||||
| Landfall Information (date, location and sustained winds) | |||||||||
| Deaths | |||||||||
| *The (ACE) Index calculations are based on preliminary data. | |||||||||
 Tropical Storm Lane Satellite Image |
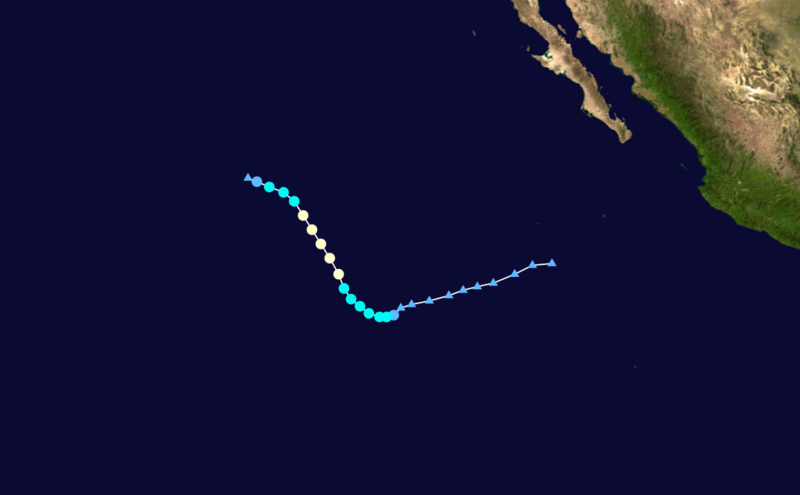 Tropical Storm Lane Forecast Track Saffir-Simpson Scale Color Legend |
| Tropical Cyclone | Lane | ||||||||
| Cyclogenesis Date | 09/15 | ||||||||
| Cyclolysis Date | 09/19 | ||||||||
| Highest Saffir-Simpson Category | Cat 1 | ||||||||
| Maximum 6-hr Sustained Wind | 81 mph (70 kt or 130 km/h) | ||||||||
| Min Pressure | 989 mbar | ||||||||
| Accumulated Cyclone Energy (ACE*) Index (kt2) | 4.2875 x 10⁴ | ||||||||
| Landfall Information (date, location and sustained winds) | |||||||||
| Deaths | |||||||||
| *The (ACE) Index calculations are based on preliminary data. | |||||||||
 Tropical Storm Bolaven Satellite Image |
 Tropical Storm Bolaven Forecast Track Saffir-Simpson Scale Color Legend |
| Tropical Cyclone | Bolaven(Julian) | ||||||||
| Cyclogenesis Date | 09/19 | ||||||||
| Cyclolysis Date | 09/28 | ||||||||
| Highest Saffir-Simpson Category | Cat 4 | ||||||||
| Maximum 6-hr Sustained Wind | 145 mph (125 kt or 200 km/h) | ||||||||
| Min Pressure | 910 mbar | ||||||||
| Accumulated Cyclone Energy (ACE*) Index (kt2) | 28.5000 x 10⁴ | ||||||||
| Landfall Information (date, location and sustained winds) | |||||||||
| Deaths | 88 | ||||||||
| *The (ACE) Index calculations are based on preliminary data. | |||||||||
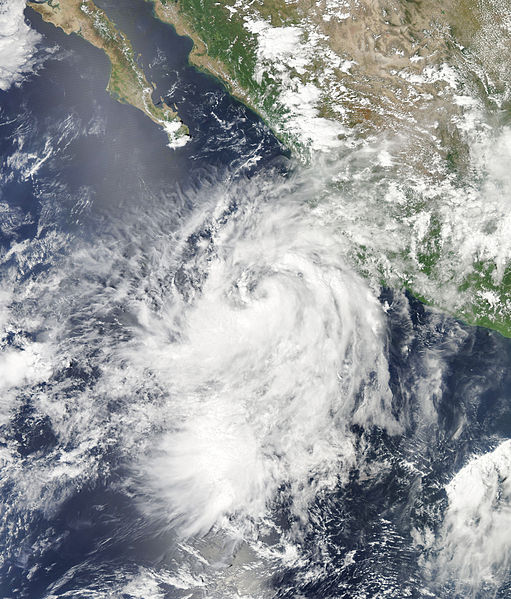
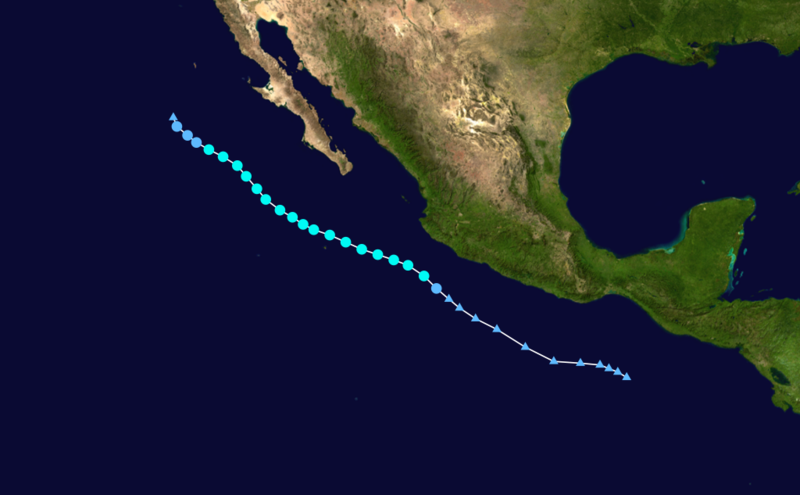
 Tropical Storm Miriam Satellite Image |
 Tropical Storm Miriam Forecast Track Saffir-Simpson Scale Color Legend |
| Tropical Cyclone | Miriam | ||||||||
| Cyclogenesis Date | 09/22 | ||||||||
| Cyclolysis Date | 09/27 | ||||||||
| Highest Saffir-Simpson Category | Cat 3 | ||||||||
| Maximum 6-hr Sustained Wind | 121 mph (105 kt or 194 km/h) | ||||||||
| Min Pressure | 958 mbar | ||||||||
| Accumulated Cyclone Energy (ACE*) Index (kt2) | 9.6600 x 10⁴ | ||||||||
| Landfall Information (date, location and sustained winds) | |||||||||
| Deaths | |||||||||
| *The (ACE) Index calculations are based on preliminary data. | |||||||||
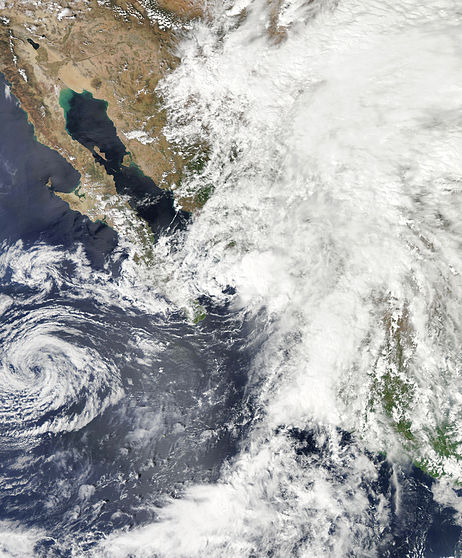 Tropical Storm Norman Satellite Image |
 Tropical Storm Norman Forecast Track Saffir-Simpson Scale Color Legend |
| Tropical Cyclone | Norman | ||||||||
| Cyclogenesis Date | 09/28 | ||||||||
| Cyclolysis Date | 09/28 | ||||||||
| Highest Saffir-Simpson Category | TS | ||||||||
| Maximum 6-hr Sustained Wind | 46 mph (40 kt or 74 km/h) | ||||||||
| Min Pressure | 1000 mbar | ||||||||
| Accumulated Cyclone Energy (ACE*) Index (kt2) | .5650 x 104 | ||||||||
| Landfall Information (date, location and sustained winds) | |||||||||
| Deaths | 1 | ||||||||
| *The (ACE) Index calculations are based on preliminary data. | |||||||||