Note: This report catalogs recent tropical cyclones across the North Atlantic and East Pacific and places each basin’s tropical cyclone activity in a climate-scale context. It is not updated in real time. Users seeking the real time status and forecasts of tropical cyclones should visit The National Hurricane Center.
Atlantic Basin
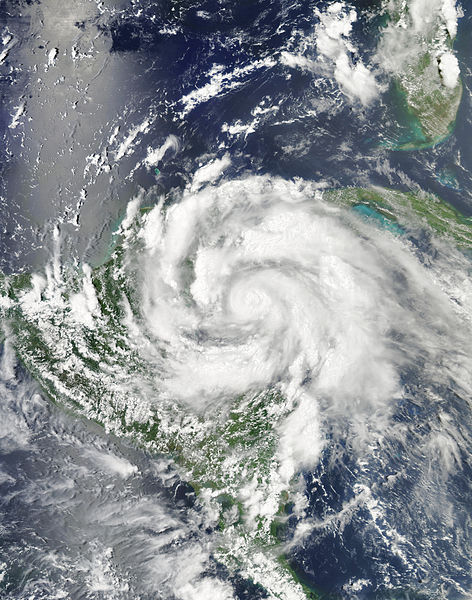 Tropical Storm Ernesto Satellite Image  Tropical Storm Ernesto Track  Saffir-Simpson Scale Color Legend | |||||||||
| Tropical Cyclone | Ernesto | ||||||||
| Cyclogenesis Date | 08/03 | ||||||||
| Cyclolysis Date | 08/10 | ||||||||
| Highest Saffir-Simpson Category | Cat 1 | ||||||||
| Maximum 6-hr Sustained Wind | 86 mph (75 kt or 139 km/h) | ||||||||
| Min Pressure | 980 mbar | ||||||||
| Accumulated Cyclone Energy (ACE*) Index (kt2) | 7.7700 x 10⁴ | ||||||||
| Landfall Information (date, location and sustained winds) | 08/08 - Yucatan Peninsula, Mexico (75 kt or 139 km/h) | ||||||||
| Deaths | 7 | ||||||||
| *The (ACE) Index calculations are based on preliminary data. | |||||||||
 Tropical Storm Florence Satellite Image 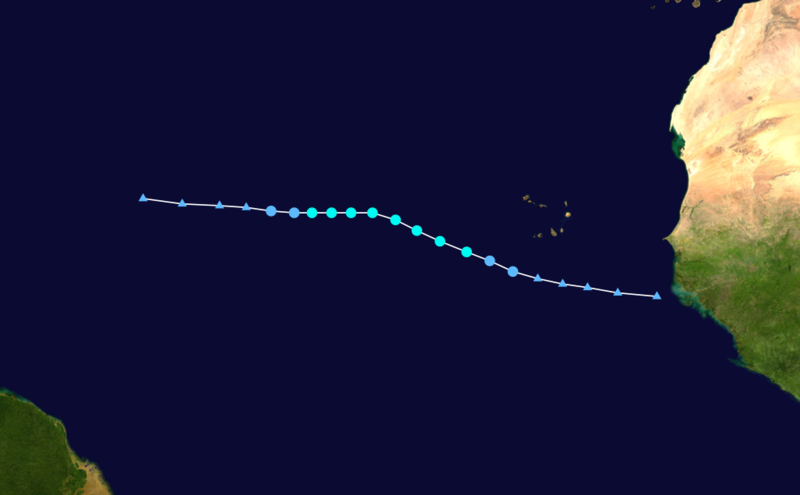 Tropical Storm Florence Track Saffir-Simpson Scale Color Legend | |||||||||
| Tropical Cyclone | Florence | ||||||||
| Cyclogenesis Date | 08/04 | ||||||||
| Cyclolysis Date | 08/06 | ||||||||
| Highest Saffir-Simpson Category | TS | ||||||||
| Maximum 6-hr Sustained Wind | 58 mph (50 kt or 93 km/h) | ||||||||
| Min Pressure | 1009 mbar | ||||||||
| Accumulated Cyclone Energy (ACE*) Index (kt2) | 1.4306 x 10⁴ | ||||||||
| Landfall Information (date, location and sustained winds) | |||||||||
| Deaths | 0 | ||||||||
| *The (ACE) Index calculations are based on preliminary data. | |||||||||
 Tropical Storm Helene Satellite Image 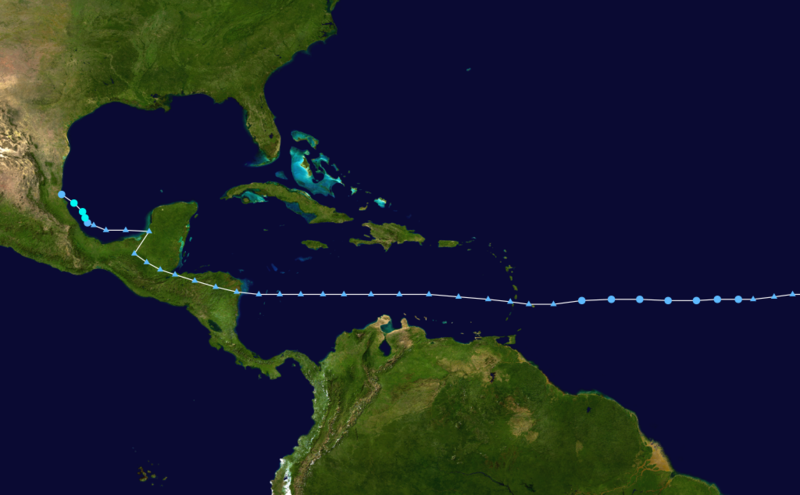 Tropical Storm Helene Track Saffir-Simpson Scale Color Legend | |||||||||
| Tropical Cyclone | Helene | ||||||||
| Cyclogenesis Date | 08/18 | ||||||||
| Cyclolysis Date | 08/18 | ||||||||
| Highest Saffir-Simpson Category | TS | ||||||||
| Maximum 6-hr Sustained Wind | 46 mph (40 kt or 74 km/h) | ||||||||
| Min Pressure | 1004 mbar | ||||||||
| Accumulated Cyclone Energy (ACE*) Index (kt2) | .4050 x 104 | ||||||||
| Landfall Information (date, location and sustained winds) | |||||||||
| Deaths | 0 | ||||||||
| *The (ACE) Index calculations are based on preliminary data. | |||||||||
 Tropical Storm Gordon Satellite Image  Tropical Storm Gordon Track Saffir-Simpson Scale Color Legend | |||||||||
| Tropical Cyclone | Gordon | ||||||||
| Cyclogenesis Date | 08/16 | ||||||||
| Cyclolysis Date | 08/20 | ||||||||
| Highest Saffir-Simpson Category | Cat 2 | ||||||||
| Maximum 6-hr Sustained Wind | 109 mph (95 kt or 176 km/h) | ||||||||
| Min Pressure | 965 mbar | ||||||||
| Accumulated Cyclone Energy (ACE*) Index (kt2) | 8.3025 x 10⁴ | ||||||||
| Landfall Information (date, location and sustained winds) | |||||||||
| Deaths | 0 | ||||||||
| *The (ACE) Index calculations are based on preliminary data. | |||||||||
 Tropical Storm Isaac Satellite Image  Tropical Storm Isaac Track Saffir-Simpson Scale Color Legend | |||||||||
| Tropical Cyclone | Isaac | ||||||||
| Cyclogenesis Date | 08/21 | ||||||||
| Cyclolysis Date | 08/30 | ||||||||
| Highest Saffir-Simpson Category | Cat 1 | ||||||||
| Maximum 6-hr Sustained Wind | 81 mph (70 kt or 130 km/h) | ||||||||
| Min Pressure | 968 mbar | ||||||||
| Accumulated Cyclone Energy (ACE*) Index (kt2) | 8.4350 x 10⁴ | ||||||||
| Landfall Information (date, location and sustained winds) | 08/25 - Haiti (60 kt or 111 km/h) 08/25 - Cuba (50 kt or 93 km/h) 08/28-29 - southeastern Louisiana (70 kt or 130 km/h) |
||||||||
| Deaths | 41 | ||||||||
| *The (ACE) Index calculations are based on preliminary data. | |||||||||
 Tropical Storm Kirk Satellite Image  Tropical Storm Kirk Track Saffir-Simpson Scale Color Legend | |||||||||
| Tropical Cyclone | Kirk | ||||||||
| Cyclogenesis Date | 08/29 | ||||||||
| Cyclolysis Date | 09/02 | ||||||||
| Highest Saffir-Simpson Category | Cat 2 | ||||||||
| Maximum 6-hr Sustained Wind | 104 mph (90 kt or 167 km/h) | ||||||||
| Min Pressure | 970 mbar | ||||||||
| Accumulated Cyclone Energy (ACE*) Index (kt2) | 7.3475 x 10⁴ | ||||||||
| Landfall Information (date, location and sustained winds) | |||||||||
| Deaths | 0 | ||||||||
| *The (ACE) Index calculations are based on preliminary data. | |||||||||
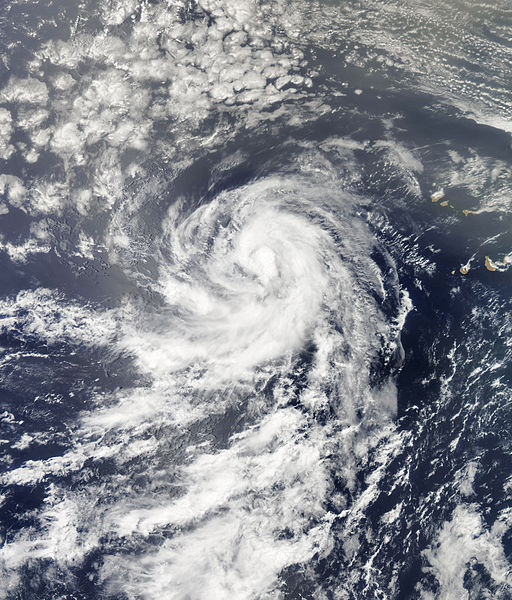
 Tropical Storm Leslie Satellite Image  Tropical Storm Leslie Track Saffir-Simpson Scale Color Legend | |||||||||
| Tropical Cyclone | Leslie | ||||||||
| Cyclogenesis Date | 08/30 | ||||||||
| Cyclolysis Date | 09/11 | ||||||||
| Highest Saffir-Simpson Category | Cat 1 | ||||||||
| Maximum 6-hr Sustained Wind | 75 mph (65 kt or 120 km/h) | ||||||||
| Min Pressure | 985 mbar | ||||||||
| Accumulated Cyclone Energy (ACE*) Index (kt2) | 15.0775 x 10⁴ | ||||||||
| Landfall Information (date, location and sustained winds) | |||||||||
| Deaths | 0 | ||||||||
| *The (ACE) Index calculations are based on preliminary data. | |||||||||
West North Pacific Basin
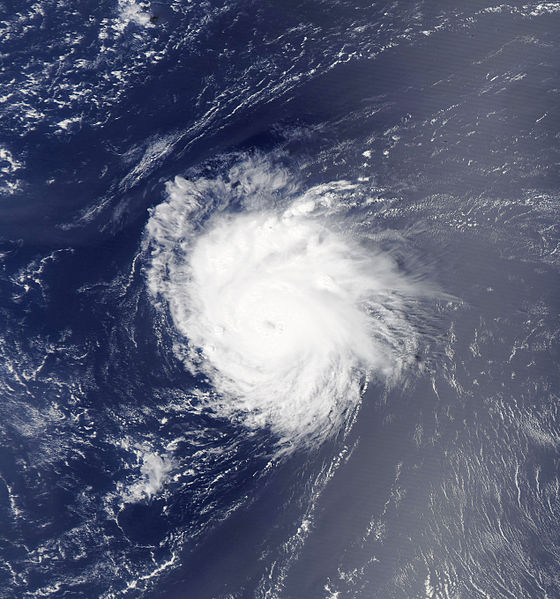
 Tropical Storm Haikui Satellite Image |
 Tropical Storm Haikui Forecast Track Saffir-Simpson Scale Color Legend |
| Tropical Cyclone | Haikui | ||||||||
| Cyclogenesis Date | 08/04 | ||||||||
| Cyclolysis Date | 08/09 | ||||||||
| Highest Saffir-Simpson Category | Cat 1 | ||||||||
| Maximum 6-hr Sustained Wind | 75 mph (65 kt or 120 km/h) | ||||||||
| Min Pressure | 965 mbar | ||||||||
| Accumulated Cyclone Energy (ACE*) Index (kt2) | 5.9700 x 10⁴ | ||||||||
| Landfall Information (date, location and sustained winds) | 08/07 - China (60 kt or 111 km/h) | ||||||||
| Deaths | 19 | ||||||||
| *The (ACE) Index calculations are based on preliminary data. | |||||||||
 Tropical Storm Kirogi Satellite Image |
 Tropical Storm Kirogi Forecast Track Saffir-Simpson Scale Color Legend |
| Tropical Cyclone | Kirogi | ||||||||
| Cyclogenesis Date | 08/05 | ||||||||
| Cyclolysis Date | 08/10 | ||||||||
| Highest Saffir-Simpson Category | TS | ||||||||
| Maximum 6-hr Sustained Wind | 52 mph (45 kt or 83 km/h) | ||||||||
| Min Pressure | 990 mbar | ||||||||
| Accumulated Cyclone Energy (ACE*) Index (kt2) | 3.0325 x 10⁴ | ||||||||
| Landfall Information (date, location and sustained winds) | |||||||||
| Deaths | 0 | ||||||||
| *The (ACE) Index calculations are based on preliminary data. | |||||||||
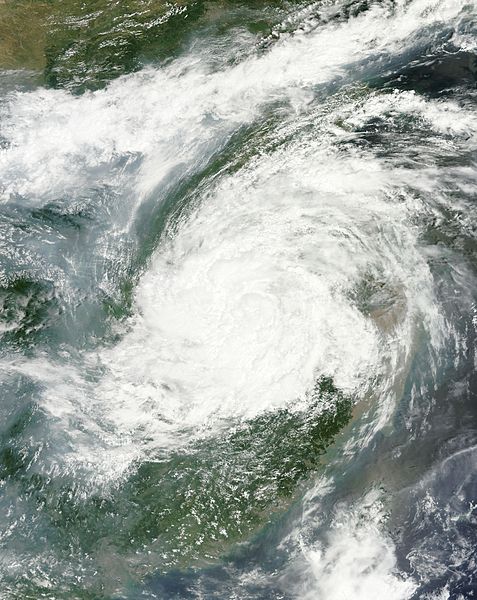
 Tropical Storm Helen Satellite Image |
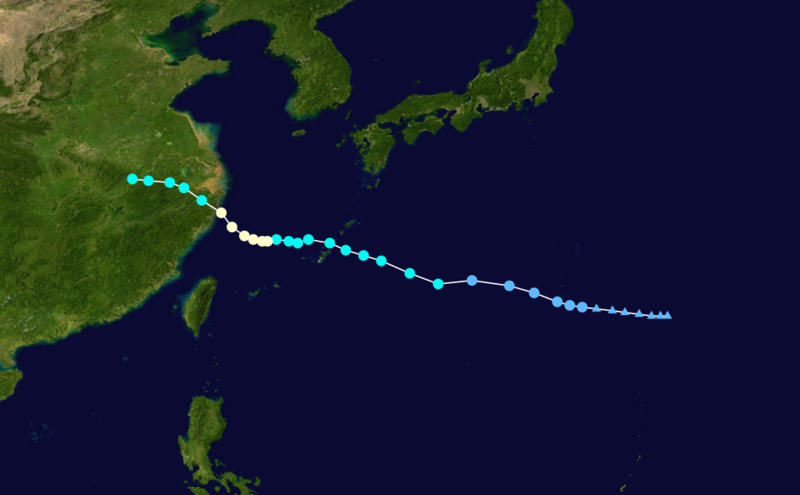
 Tropical Storm Helen Forecast Track Saffir-Simpson Scale Color Legend |
| Tropical Cyclone | Helen(Kai-tak) | ||||||||
| Cyclogenesis Date | 08/13 | ||||||||
| Cyclolysis Date | 08/18 | ||||||||
| Highest Saffir-Simpson Category | Cat 1 | ||||||||
| Maximum 6-hr Sustained Wind | 81 mph (70 kt or 130 km/h) | ||||||||
| Min Pressure | 990 mbar | ||||||||
| Accumulated Cyclone Energy (ACE*) Index (kt2) | 6.1750 x 10⁴ | ||||||||
| Landfall Information (date, location and sustained winds) | 08/14 - Isabela, Philippines (55 kt or 102 km/h) 08/17 - Guangdong, China (70 kt or 130 km/h) 08/17 - Vietnam, Loas (60 kt or 111 km/h) |
||||||||
| Deaths | 40 | ||||||||
| *The (ACE) Index calculations are based on preliminary data. | |||||||||
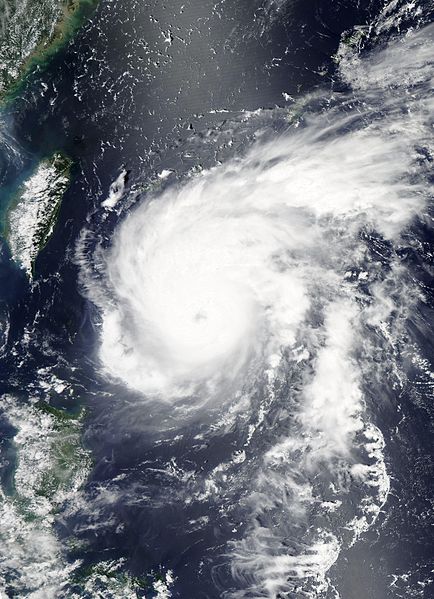 Tropical Storm Igme Satellite Image |
 Tropical Storm Igme Forecast Track Saffir-Simpson Scale Color Legend |
| Tropical Cyclone | Igme(Tembin) | ||||||||
| Cyclogenesis Date | 08/19 | ||||||||
| Cyclolysis Date | 08/30 | ||||||||
| Highest Saffir-Simpson Category | Cat 4 | ||||||||
| Maximum 6-hr Sustained Wind | 132 mph (115 kt or 213 km/h) | ||||||||
| Min Pressure | 945 mbar | ||||||||
| Accumulated Cyclone Energy (ACE*) Index (kt2) | 28.7050 x 10⁴ | ||||||||
| Landfall Information (date, location and sustained winds) | |||||||||
| Deaths | 10 | ||||||||
| *The (ACE) Index calculations are based on preliminary data. | |||||||||
East North Pacific Basin
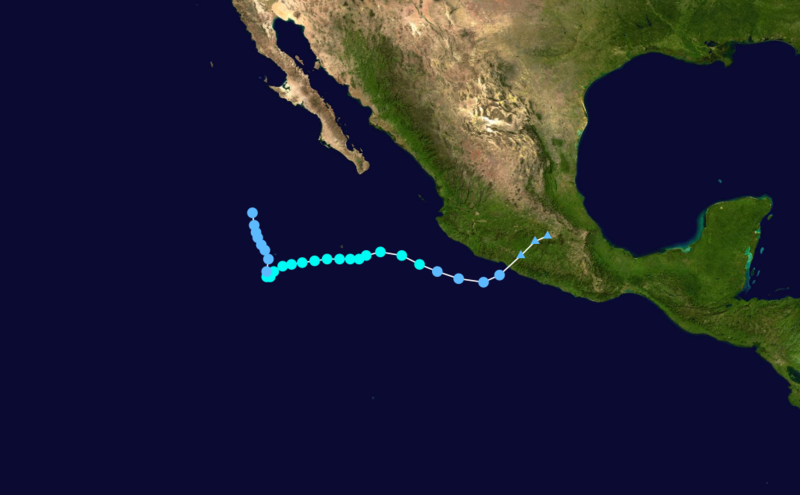
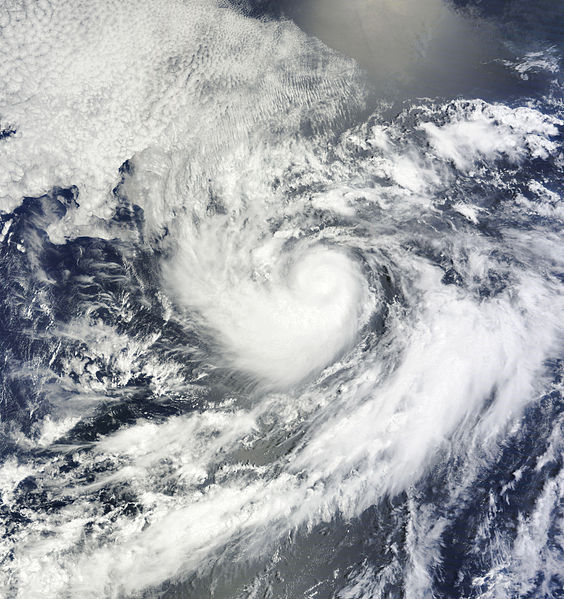 Tropical Storm Gilma Satellite Image |
 Tropical Storm Gilma Forecast Track Saffir-Simpson Scale Color Legend |
| Tropical Cyclone | Gilma | ||||||||
| Cyclogenesis Date | 08/07 | ||||||||
| Cyclolysis Date | 08/11 | ||||||||
| Highest Saffir-Simpson Category | Cat 1 | ||||||||
| Maximum 6-hr Sustained Wind | 81 mph (70 kt or 130 km/h) | ||||||||
| Min Pressure | 984 mbar | ||||||||
| Accumulated Cyclone Energy (ACE*) Index (kt2) | 4.8675 x 10⁴ | ||||||||
| Landfall Information (date, location and sustained winds) | |||||||||
| Deaths | |||||||||
| *The (ACE) Index calculations are based on preliminary data. | |||||||||
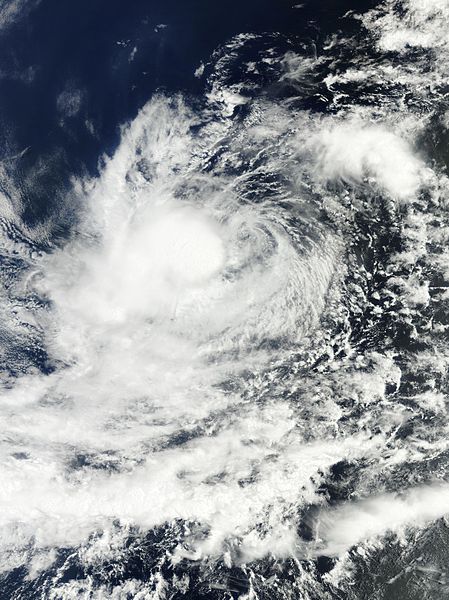 Tropical Storm Hector Satellite Image |
 Tropical Storm Hector Forecast Track Saffir-Simpson Scale Color Legend |
| Tropical Cyclone | Hector | ||||||||
| Cyclogenesis Date | 08/12 | ||||||||
| Cyclolysis Date | 08/15 | ||||||||
| Highest Saffir-Simpson Category | TS | ||||||||
| Maximum 6-hr Sustained Wind | 52 mph (45 kt or 83 km/h) | ||||||||
| Min Pressure | 993 mbar | ||||||||
| Accumulated Cyclone Energy (ACE*) Index (kt2) | 2.3025 x 10⁴ | ||||||||
| Landfall Information (date, location and sustained winds) | |||||||||
| Deaths | |||||||||
| *The (ACE) Index calculations are based on preliminary data. | |||||||||
 Tropical Storm Ileana Satellite Image |
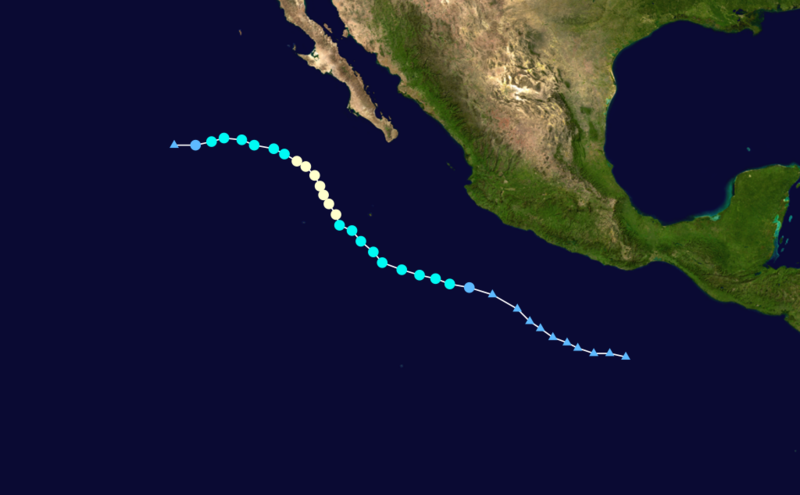 Tropical Storm Ileana Forecast Track Saffir-Simpson Scale Color Legend |
| Tropical Cyclone | Ileana | ||||||||
| Cyclogenesis Date | 08/28 | ||||||||
| Cyclolysis Date | 09/02 | ||||||||
| Highest Saffir-Simpson Category | Cat 1 | ||||||||
| Maximum 6-hr Sustained Wind | 86 mph (75 kt or 139 km/h) | ||||||||
| Min Pressure | 987 mbar | ||||||||
| Accumulated Cyclone Energy (ACE*) Index (kt2) | 6.5900 x 10⁴ | ||||||||
| Landfall Information (date, location and sustained winds) | |||||||||
| Deaths | |||||||||
| *The (ACE) Index calculations are based on preliminary data. | |||||||||