East North Pacific Basin
 Tropical Storm Aletta Satellite Image |
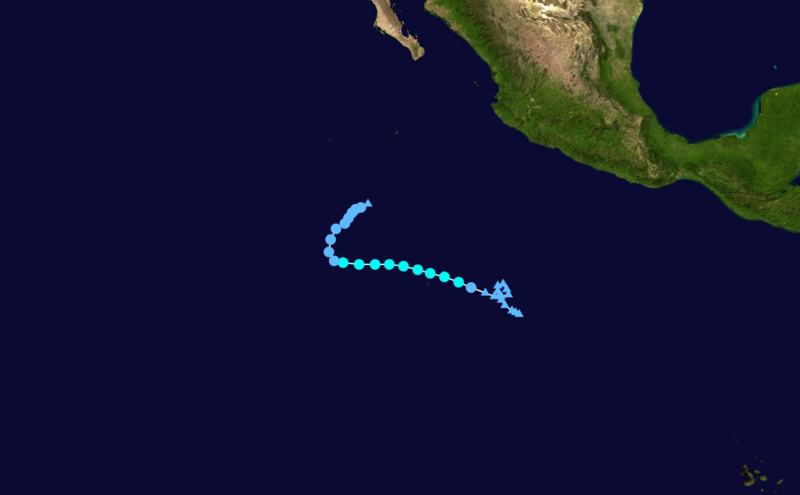 Tropical Storm Aletta Forecast Track  Saffir-Simpson Scale Color Legend |
| Tropical Cyclone | Aletta | ||||||||
| Cyclogenesis Date | 05/15 | ||||||||
| Cyclolysis Date | 05/17 | ||||||||
| Highest Saffir-Simpson Category | TS | ||||||||
| Maximum 6-hr Sustained Wind | 46 mph (40 kt or 74 km/h) | ||||||||
| Min Pressure | 1005 mbar | ||||||||
| Accumulated Cyclone Energy (ACE*) Index (kt2) | 1.1775 x 10⁴ | ||||||||
| Landfall Information (date, location and sustained winds) | |||||||||
| Deaths | 0 | ||||||||
| *The (ACE) Index calculations are based on preliminary data. | |||||||||
 Hurricane Bud Satellite Image |
 Hurricane Bud Forecast Track Saffir-Simpson Scale Color Legend |
| Tropical Cyclone | Bud | ||||||||
| Cyclogenesis Date | 05/22 | ||||||||
| Cyclolysis Date | 05/26 | ||||||||
| Highest Saffir-Simpson Category | Cat 3 | ||||||||
| Maximum 6-hr Sustained Wind | 115 mph (100 kt or 185 km/h) | ||||||||
| Min Pressure | 960 mbar | ||||||||
| Accumulated Cyclone Energy (ACE*) Index (kt2) | 7.5100 x 10⁴ | ||||||||
| Landfall Information (date, location and sustained winds) | |||||||||
| Deaths | 0 | ||||||||
| *The (ACE) Index calculations are based on preliminary data. | |||||||||
Atlantic Basin
Tropical Storm Alberto formed as a tropical depression on May 19th off the North and South Carolina coast along a stationary front. The storm quickly strengthened into a tropical storm with sustained winds of 50 miles per hour. The storm moved to the northeast, just off the coast of the Carolinas, never making landfall. The storm weakened to a tropical depression on the morning of the 22nd, and became extra-tropical after moving over colder water and experiencing strong wind shear. Alberto was an unusual storm because it formed before the official start of the North Atlantic’s tropical cyclone season for the North Atlantic, which begins on June 1st. Alberto was the first named storm during May since tropical storm Arthur in 2008. Only 27 known tropical cyclones, prior to Alberto, had reached tropical storm status before June since 1851.
 Tropical Storm Alberto Satellite Image  Tropical Storm Alberto Track Saffir-Simpson Scale Color Legend | |||||||||
| Tropical Cyclone | Alberto | ||||||||
| Cyclogenesis Date | 05/19 | ||||||||
| Cyclolysis Date | 05/21 | ||||||||
| Highest Saffir-Simpson Category | TS | ||||||||
| Maximum 6-hr Sustained Wind | 58 mph (50 kt or 93 km/h) | ||||||||
| Min Pressure | 995 mbar | ||||||||
| Accumulated Cyclone Energy (ACE*) Index (kt2) | 1.4225 x 10⁴ | ||||||||
| Landfall Information (date, location and sustained winds) | |||||||||
| Deaths | 0 | ||||||||
| *The (ACE) Index calculations are based on preliminary data. | |||||||||
Beryl formed as a subtropical storm off the coast of the Carolinas on May 25th. As the storm moved westward it strengthened and gained more tropical characteristics and became a tropical storm on May 27th, with sustained winds of 70 miles per hour. On May 28th, the storm made landfall near Jacksonville, Florida. Beryl quickly weakened as it moved over northern Florida and into southern Georgia. The tropical depression then moved to the northeast and off the North Carolina Coast, where it was declared extra-tropical. Heavy rainfall was the main impact of Beryl, but the rain was a welcome sight as much of the region had been experiencing drought conditions for over a year. Beryl was another unusual storm, with respect to how early in the year it formed. Beryl marked only the third time that a second tropical cyclone reached tropical storm strength in the North Atlantic since records began in 1851, joining 1908 and 1887. Beryl was also only the eighth tropical storm to make landfall in the U.S. during May.
 Tropical Storm Beryl Satellite Image  Tropical Storm Beryl Track Saffir-Simpson Scale Color Legend | |||||||||
| Tropical Cyclone | Beryl | ||||||||
| Cyclogenesis Date | 05/26 | ||||||||
| Cyclolysis Date | 05/28 | ||||||||
| Highest Saffir-Simpson Category | TS | ||||||||
| Maximum 6-hr Sustained Wind | 69 mph (60 kt or 111 km/h) | ||||||||
| Min Pressure | 992 mbar | ||||||||
| Accumulated Cyclone Energy (ACE*) Index (kt2) | 2.1600 x 10⁴ | ||||||||
| Landfall Information (date, location and sustained winds) | 05/27–near Jackson Beach, Florida (60 kt or 111 km/h) 05/25–05/30 Total Precip (map) |
||||||||
| Deaths | 0 | ||||||||
| *The (ACE) Index calculations are based on preliminary data. | |||||||||
West North Pacific Basin
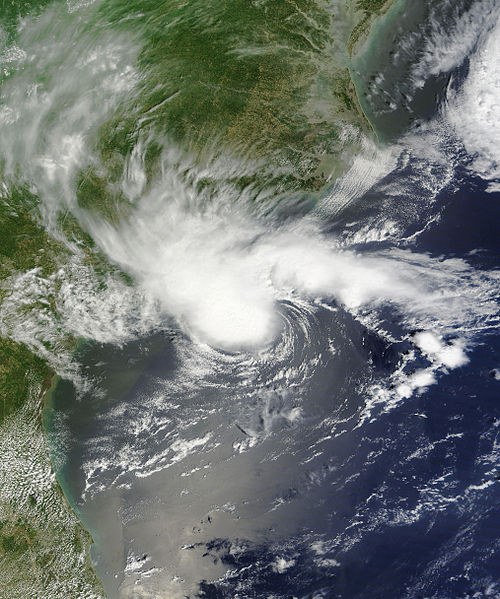
 Tropical Storm Sanvu Satellite Image |
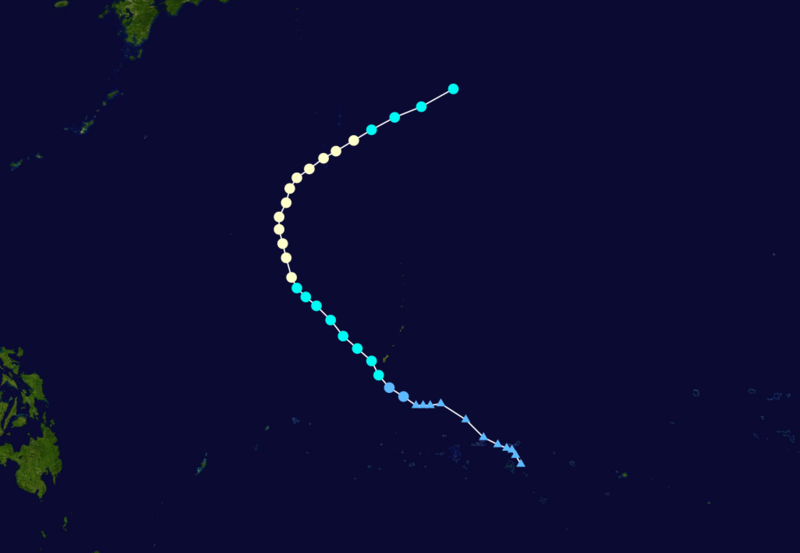 Tropical Storm Sanvu Forecast Track Saffir-Simpson Scale Color Legend |
| Tropical Cyclone | Sanvu | ||||||||
| Cyclogenesis Date | 05/21 | ||||||||
| Cyclolysis Date | 05/27 | ||||||||
| Highest Saffir-Simpson Category | Cat 1 | ||||||||
| Maximum 6-hr Sustained Wind | 92 mph (80 kt or 148 km/h) | ||||||||
| Min Pressure | 975 mbar | ||||||||
| Accumulated Cyclone Energy (ACE*) Index (kt2) | 8.9150 x 10⁴ | ||||||||
| Landfall Information (date, location and sustained winds) | |||||||||
| Deaths | 0 | ||||||||
| *The (ACE) Index calculations are based on preliminary data. | |||||||||