Note: This report catalogs recent tropical cyclones across the North Atlantic and East Pacific and places each basin’s tropical cyclone activity in a climate-scale context. It is not updated in real time. Users seeking the real time status and forecasts of tropical cyclones should visit The National Hurricane Center.
South Indian Basin
 Tropical Storm Chanda Satellite Image |
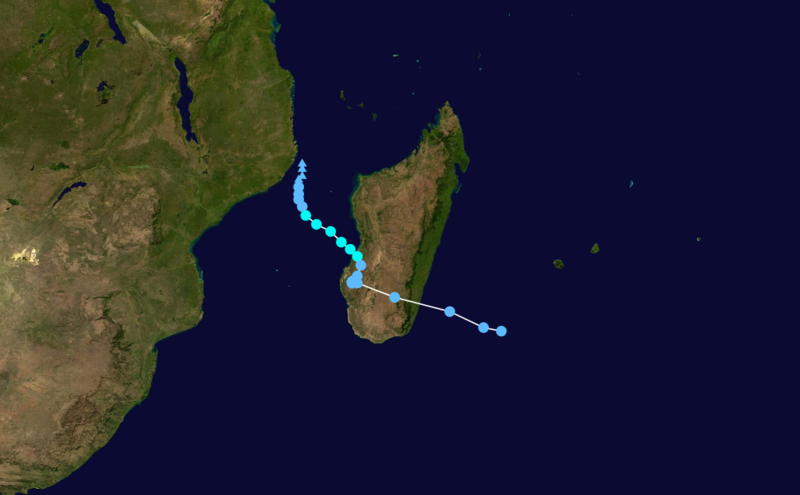 Tropical Storm Chanda Forecast Track  Saffir-Simpson Scale Color Legend |
| Tropical Cyclone | Chanda | ||||||||
| Cyclogenesis Date | 01/07 | ||||||||
| Cyclolysis Date | 01/09 | ||||||||
| Highest Saffir-Simpson Category | TS | ||||||||
| Maximum 6-hr Sustained Wind | 46 mph (40 kt or 74 km/h) | ||||||||
| Min Pressure | 996 mbar | ||||||||
| Accumulated Cyclone Energy (ACE*) Index (kt2) | 1.0550 x 10⁴ | ||||||||
| Landfall Information (date, location and sustained winds) | 01/08 - Madagascar (35 kt or 64 km/h) | ||||||||
| Deaths | 1 | ||||||||
| *The (ACE) Index calculations are based on preliminary data. | |||||||||
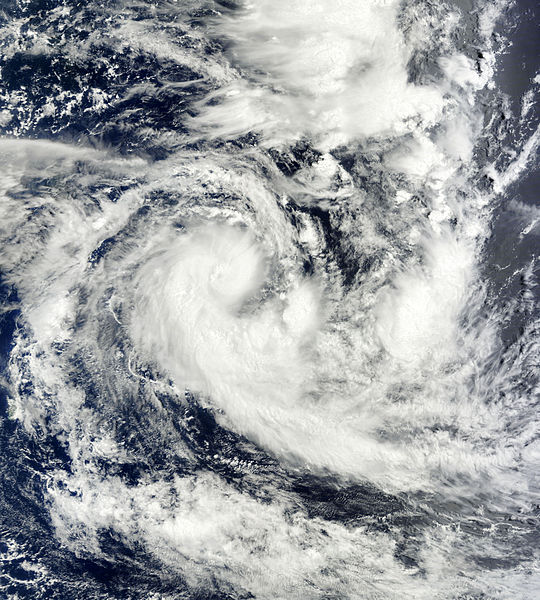 Tropical Storm Ethel Satellite Image |
 Tropical Storm Ethel Forecast Track Saffir-Simpson Scale Color Legend |
| Tropical Cyclone | Ethel | ||||||||
| Cyclogenesis Date | 01/19 | ||||||||
| Cyclolysis Date | 01/23 | ||||||||
| Highest Saffir-Simpson Category | Cat 1 | ||||||||
| Maximum 6-hr Sustained Wind | 86 mph (75 kt or 139 km/h) | ||||||||
| Min Pressure | 985 mbar | ||||||||
| Accumulated Cyclone Energy (ACE*) Index (kt2) | 5.8575 x 10⁴ | ||||||||
| Landfall Information (date, location and sustained winds) | N/A | ||||||||
| Deaths | 1 | ||||||||
| *The (ACE) Index calculations are based on preliminary data. | |||||||||
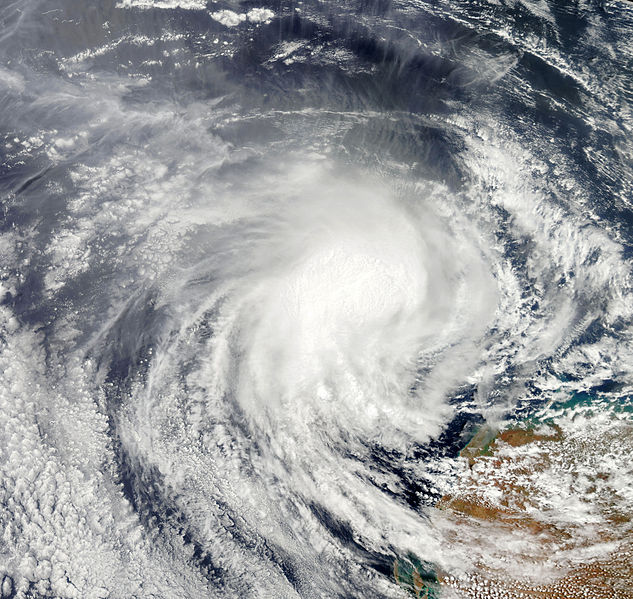
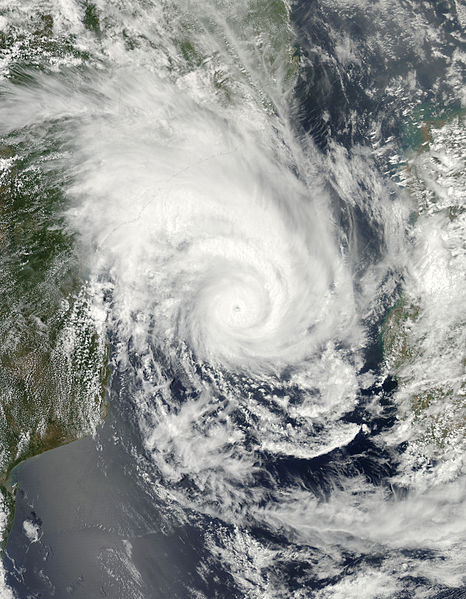 Tropical Storm Funso Satellite Image |
 Tropical Storm Funso Forecast Track Saffir-Simpson Scale Color Legend |
| Tropical Cyclone | Funso | ||||||||
| Cyclogenesis Date | 01/19 | ||||||||
| Cyclolysis Date | 01/23 | ||||||||
| Highest Saffir-Simpson Category | Cat 4 | ||||||||
| Maximum 6-hr Sustained Wind | 138 mph (120 kt or 222 km/h) | ||||||||
| Min Pressure | 936 mbar | ||||||||
| Accumulated Cyclone Energy (ACE*) Index (kt2) | 35.3725 x 10⁴ | ||||||||
| Landfall Information (date, location and sustained winds) | N/A | ||||||||
| Deaths | 40 | ||||||||
| *The (ACE) Index calculations are based on preliminary data. | |||||||||
Australian Basin
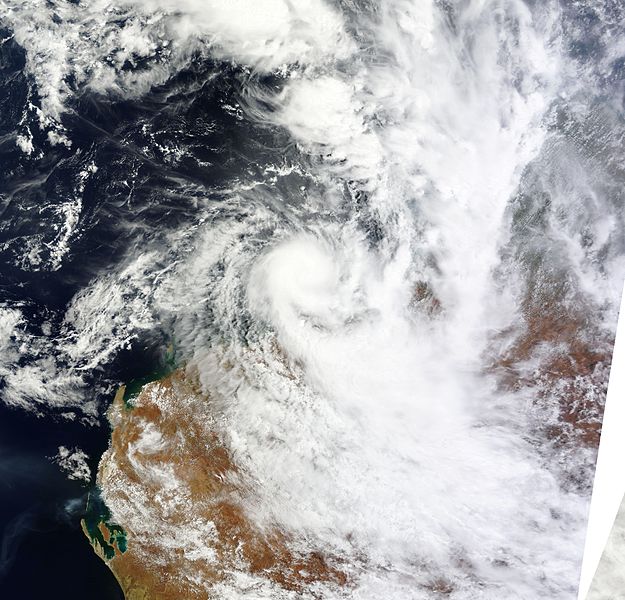 Tropical Storm Heidi Satellite Image  Australian Scale Color Legend |
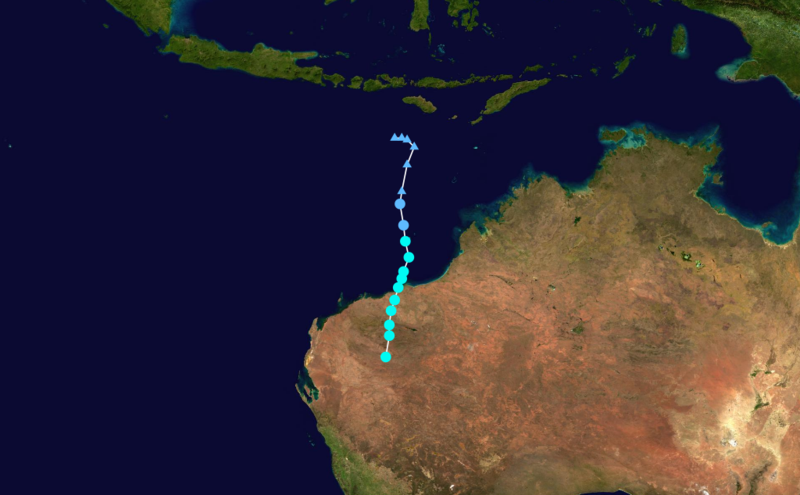 Tropical Storm Heidi Track Saffir-Simpson Scale Color Legend | ||||||||
| Tropical Cyclone | Heidi | ||||||||
| Cyclogenesis Date | 01/10 | ||||||||
| Cyclolysis Date | 01/13 | ||||||||
| Highest Australian Category | Cat 1 | Maximum Gust | 110 km/h | ||||||
| Highest Saffir-Simpson Category | TS | ||||||||
| Maximum 6-hr Sustained Wind | 63 mph (55 kt or 101 km/h) | ||||||||
| Min Pressure | 975 mbar | ||||||||
| Accumulated Cyclone Energy (ACE*) Index (kt2) | 2.0025 x 10⁴ | ||||||||
| Landfall Information (date, location and sustained winds) | 01/12 - Western Australia ( 45 kt or 83 km/h) | ||||||||
| Deaths | N/A | ||||||||
| *The (ACE) Index calculations are based on preliminary data. | |||||||||
 Tropical Storm Iggy Satellite Image Australian Scale Color Legend |
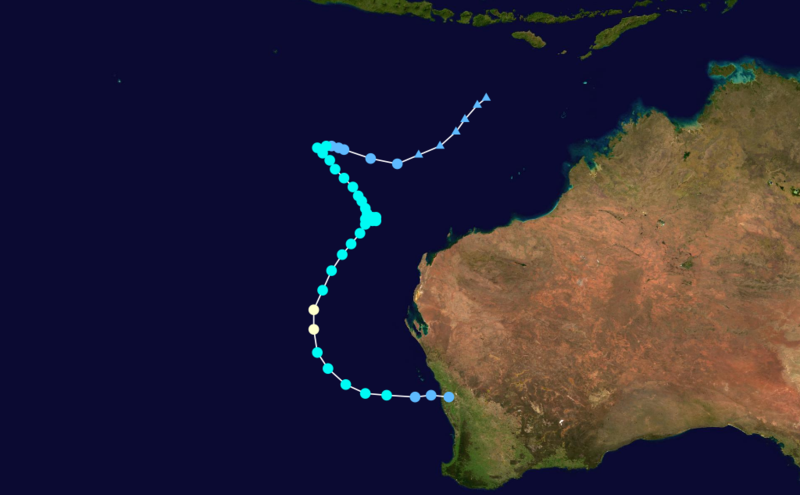 Tropical Storm Iggy Track Saffir-Simpson Scale Color Legend | ||||||||
| Tropical Cyclone | Iggy | ||||||||
| Cyclogenesis Date | 01/25 | ||||||||
| Cyclolysis Date | 02/02 | ||||||||
| Highest Australian Category | Cat 1 | Maximum Gust | 105 km/h | ||||||
| Highest Saffir-Simpson Category | Cat 1 | ||||||||
| Maximum 6-hr Sustained Wind | 63 mph (65 kt or 101 km/h) | ||||||||
| Min Pressure | 970 mbar | ||||||||
| Accumulated Cyclone Energy (ACE*) Index (kt2) | 9.0825 x 10⁴ | <||||||||
| Landfall Information (date, location and sustained winds) | 02/02 - Jurien Bay, Western Australia ( 30 kt or 56 km/h) | ||||||||
| Deaths | 16 | ||||||||
| *The (ACE) Index calculations are based on preliminary data. | |||||||||