Note: This report catalogs recent tropical cyclones across the North Atlantic and East Pacific and places each basin’s tropical cyclone activity in a climate-scale context. It is not updated in real time. Users seeking the real time status and forecasts of tropical cyclones should visit The National Hurricane Center.
West North Pacific Basin
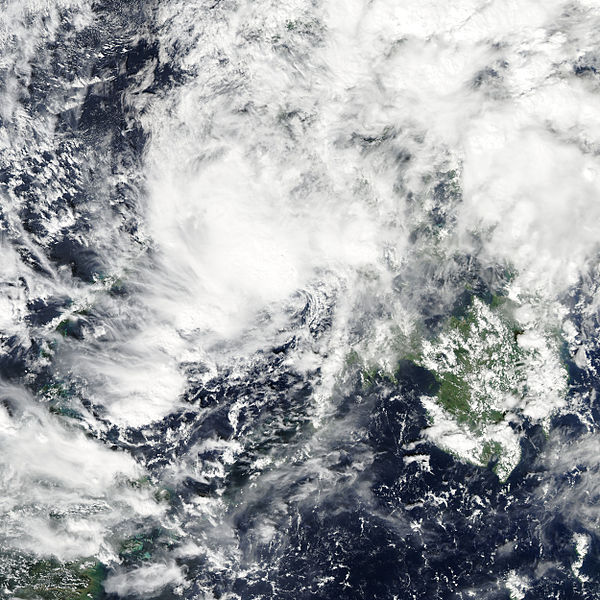 Tropical Storm Washi Satellite Image |
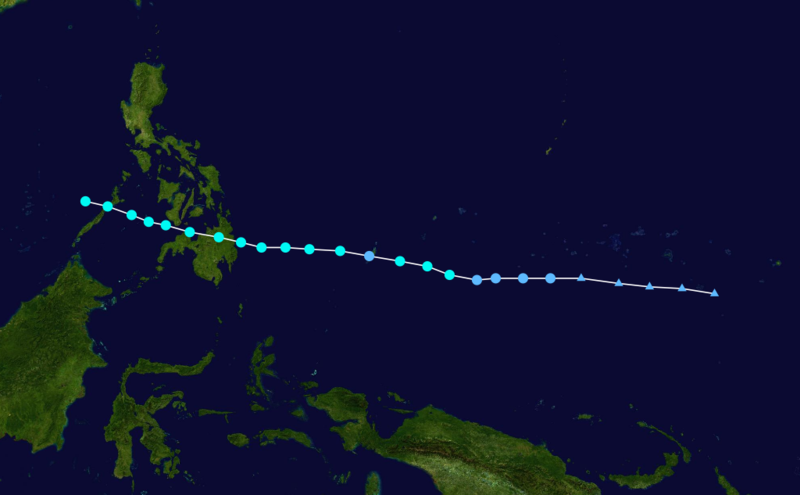 Tropical Storm Washi Forecast Track  Saffir-Simpson Scale Color Legend |
| Tropical Cyclone | Washi(Sendong) | ||||||||
| Cyclogenesis Date | 12/14 | ||||||||
| Cyclolysis Date | 12/19 | ||||||||
| Highest Saffir-Simpson Category | TS | ||||||||
| Maximum 6-hr Sustained Wind | 63 mph (55 kt or 102 km/h) | ||||||||
| Min Pressure | 996 mbar | ||||||||
| Accumulated Cyclone Energy (ACE*) Index (kt2) | 3.7425 x 10⁴ | ||||||||
| Landfall Information (date, location and sustained winds) | N/A | ||||||||
| Deaths | 957 | ||||||||
| *The (ACE) Index calculations are based on preliminary data. | |||||||||
North Indian Basin
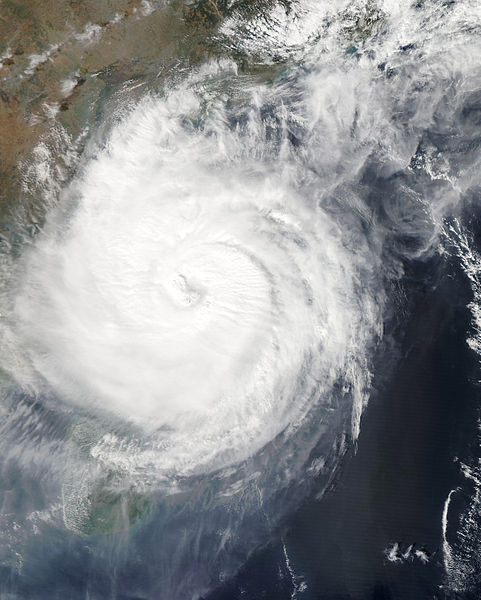 Tropical Storm Thane Satellite Image |
 Tropical Storm Thane Forecast Track Saffir-Simpson Scale Color Legend |
| Tropical Cyclone | Thane | ||||||||
| Cyclogenesis Date | 12/25 | ||||||||
| Cyclolysis Date | 12/30 | ||||||||
| Highest Saffir-Simpson Category | Cat 1 | ||||||||
| Maximum 6-hr Sustained Wind | 92 mph (80 kt or 148 km/h) | ||||||||
| Min Pressure | 976 mbar | ||||||||
| Accumulated Cyclone Energy (ACE*) Index (kt2) | 6.6450 x 10⁴ | ||||||||
| Landfall Information (date, location and sustained winds) | 12/30 –Tamil Nadu, India (65 kt or 120 km /h) | ||||||||
| Deaths | 46 | ||||||||
| *The (ACE) Index calculations are based on preliminary data. | |||||||||
South Indian Basin
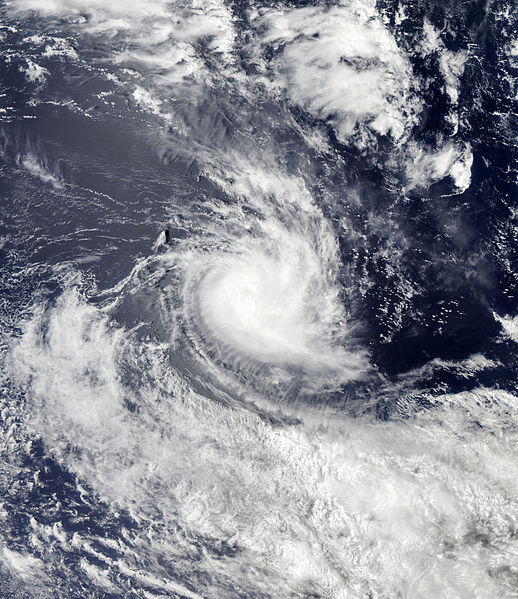
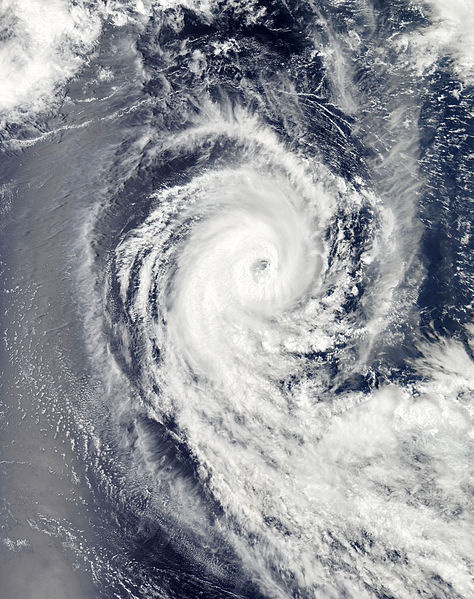 Tropical Storm Benilde Satellite Image |
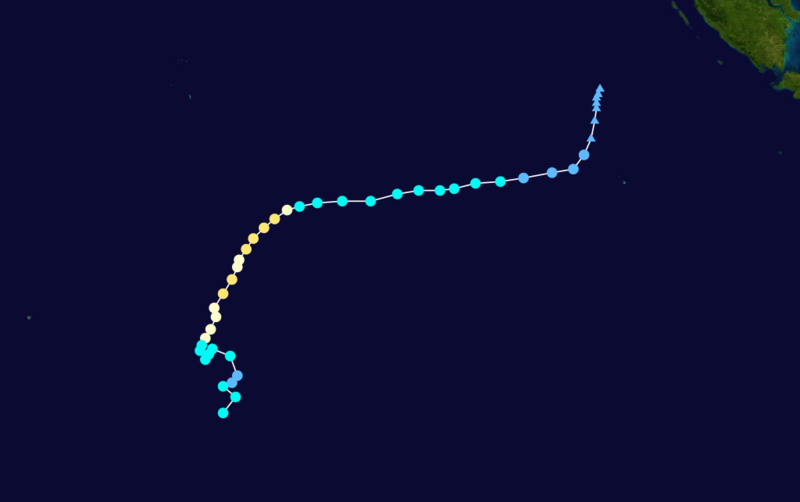 Tropical Storm Benilde Forecast Track Saffir-Simpson Scale Color Legend |
| Tropical Cyclone | Benilde | ||||||||
| Cyclogenesis Date | 12/28 | ||||||||
| Cyclolysis Date | 01/04 | ||||||||
| Highest Saffir-Simpson Category | Cat 2 | ||||||||
| Maximum 6-hr Sustained Wind | 104 mph (90 kt or 167 km/h) | ||||||||
| Min Pressure | 968 mbar | ||||||||
| Accumulated Cyclone Energy (ACE*) Index (kt2) | 11.0225 x 10⁴ | ||||||||
| Landfall Information (date, location and sustained winds) | N/A | ||||||||
| Deaths | 0 | ||||||||
| *The (ACE) Index calculations are based on preliminary data. | |||||||||
Australian Basin
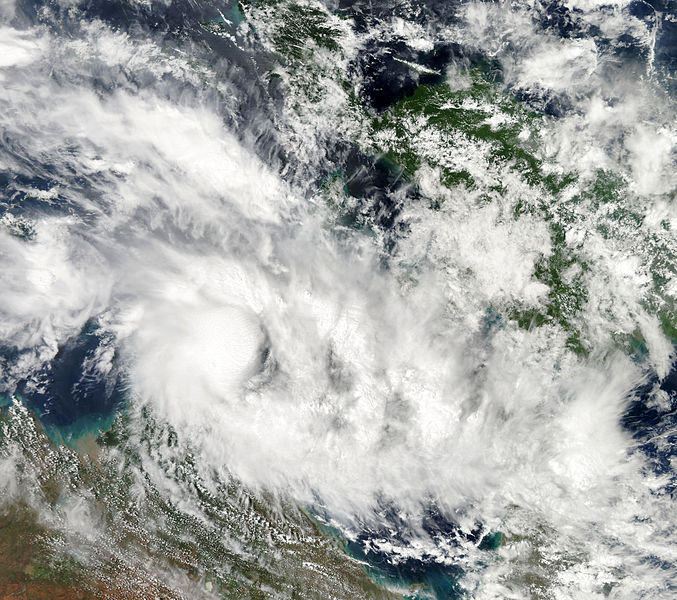
 Tropical Storm Alenga Satellite Image  Australian Scale Color Legend |
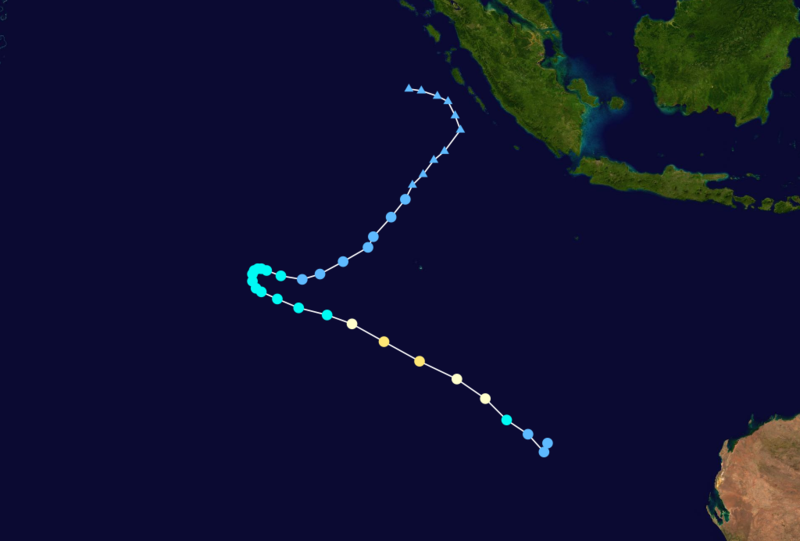 Tropical Storm Alenga Track Saffir-Simpson Scale Color Legend | ||||||||
| Tropical Cyclone | Alenga | ||||||||
| Cyclogenesis Date | 12/05 | ||||||||
| Cyclolysis Date | 12/09 | ||||||||
| Highest Australian Category | Cat 2 | Maximum Gust | 150 km/h | ||||||
| Highest Saffir-Simpson Category | Cat 2 | ||||||||
| Maximum 6-hr Sustained Wind | 109 mph (95 kt or 176 km/h) | ||||||||
| Min Pressure | 968 mbar | ||||||||
| Accumulated Cyclone Energy (ACE*) Index (kt2) | 6.4850 x 10⁴ | ||||||||
| Landfall Information (date, location and sustained winds) | N/A | ||||||||
| Deaths | N/A | ||||||||
| *The (ACE) Index calculations are based on preliminary data. | |||||||||
 Tropical Storm Grant Satellite Image Australian Scale Color Legend |
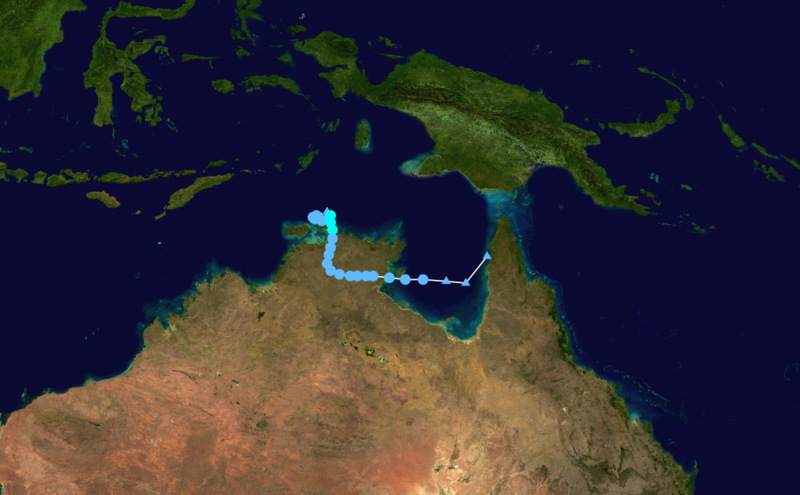 Tropical Storm Grant Track Saffir-Simpson Scale Color Legend | ||||||||
| Tropical Cyclone | Grant | ||||||||
| Cyclogenesis Date | 12/25 | ||||||||
| Cyclolysis Date | 12/25 | ||||||||
| Highest Australian Category | Cat 1 | Maximum Gust | 100 km/h | ||||||
| Highest Saffir-Simpson Category | TS | ||||||||
| Maximum 6-hr Sustained Wind | 46 mph (40 kt or 74 km/h) | ||||||||
| Min Pressure | 978 mbar | ||||||||
| Accumulated Cyclone Energy (ACE*) Index (kt2) | 6.4850 x 10⁴ | ||||||||
| Landfall Information (date, location and sustained winds) | 12/25–Northern Territory (40 kt or 74 km /h) | ||||||||
| Deaths | N/A | ||||||||
| *The (ACE) Index calculations are based on preliminary data. | |||||||||