Note: This report catalogs recent tropical cyclones across the North Atlantic and East Pacific and places each basin’s tropical cyclone activity in a climate-scale context. It is not updated in real time. Users seeking the real time status and forecasts of tropical cyclones should visit The National Hurricane Center.
Australian Basin
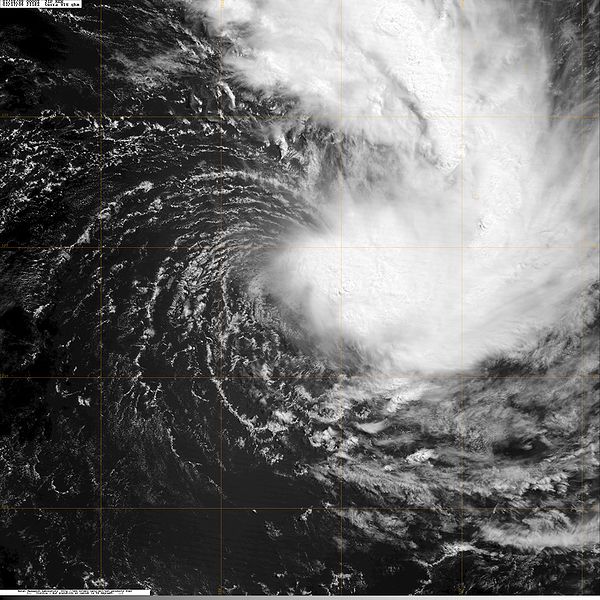
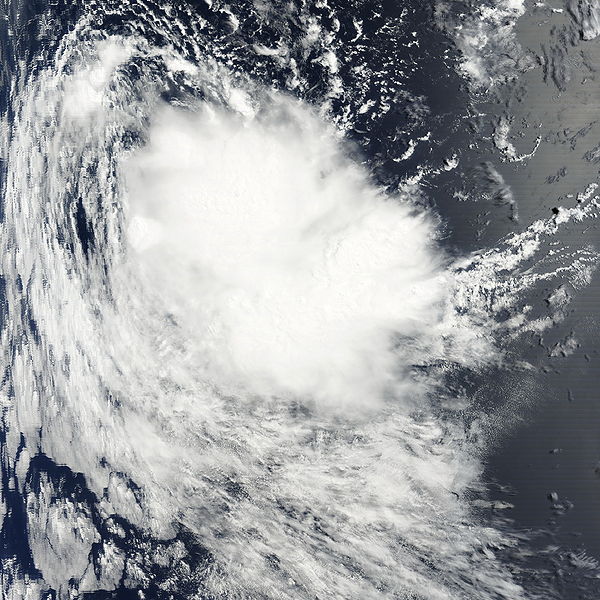 Tropical Storm Gabrielle Satellite Image  Australian Scale Color Legend |
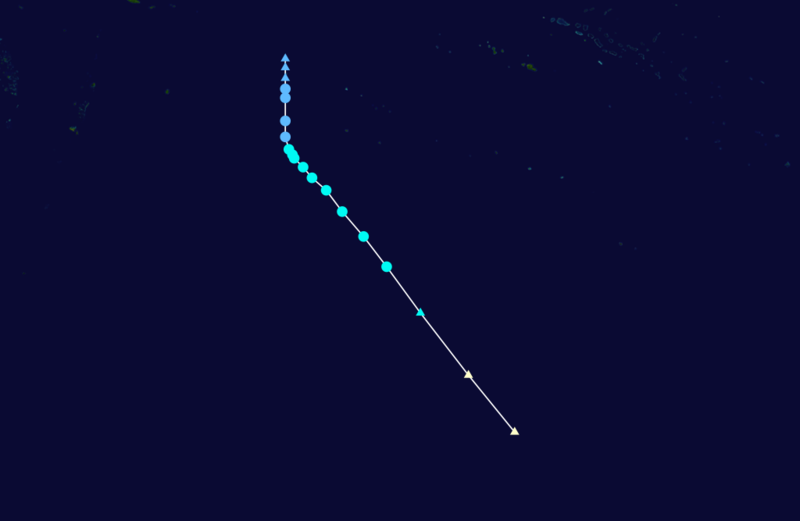
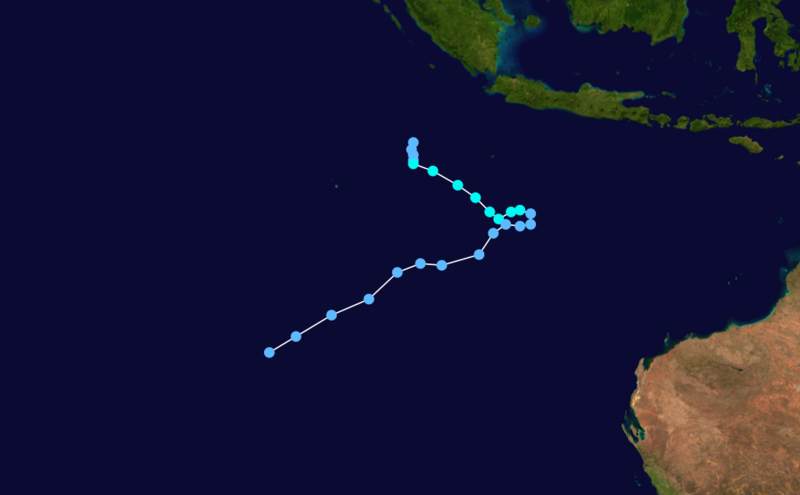 Tropical Storm Gabrielle Track  Saffir-Simpson Scale Color Legend | ||||||||
| Tropical Cyclone | Gabrielle | ||||||||
| Cyclogenesis Date | 03/02 | Cyclolysis Date | 03/04 | ||||||
| Highest Australian Category | Cat 1 | Maximum Gust | 83 km/h | ||||||
| Highest Saffir-Simpson Category | TS | ||||||||
| Maximum 6-hr Sustained Wind | 40 mph (35 kt or 65 km/h) | ||||||||
| Min Pressure | 988 mbar | ||||||||
| Accumulated Cyclone Energy (ACE*) Index (kt2) | 1.1025 x 10⁴ | ||||||||
| Landfall Information (date, location and sustained winds) | N/A | ||||||||
| Deaths | 0 | ||||||||
| *The (ACE) Index calculations are based on preliminary data. | |||||||||
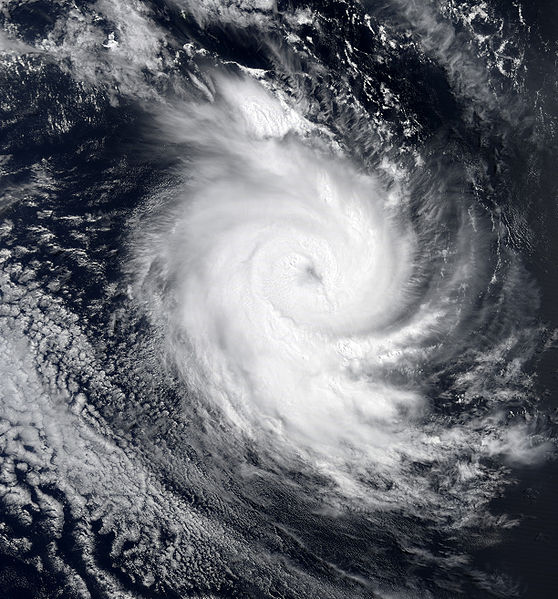
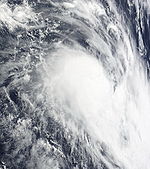
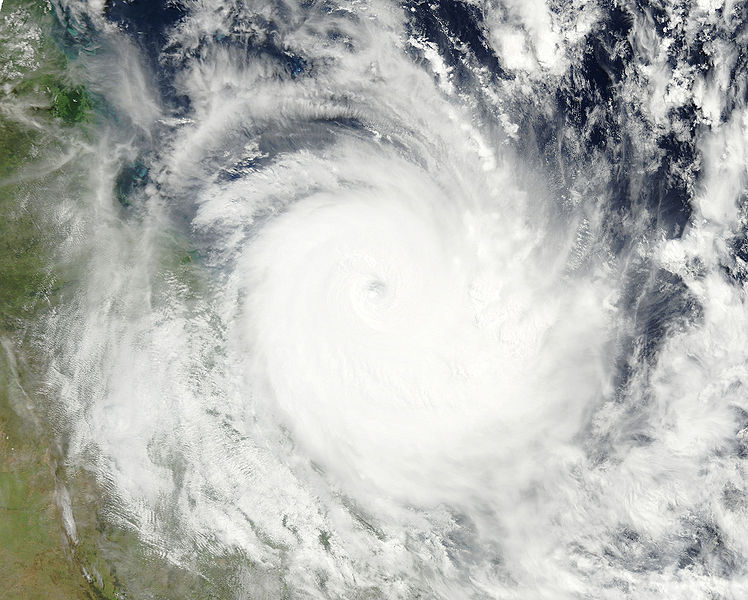 Tropical Storm Hamish Satellite Image Australian Scale Color Legend |
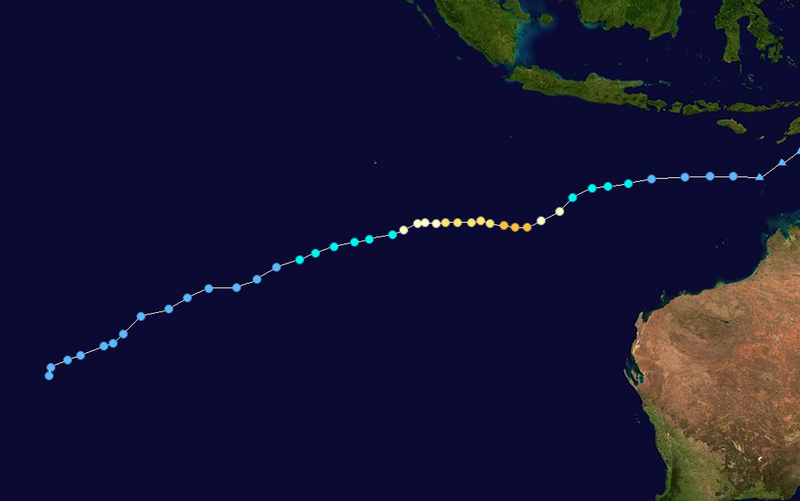
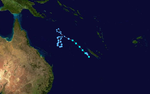
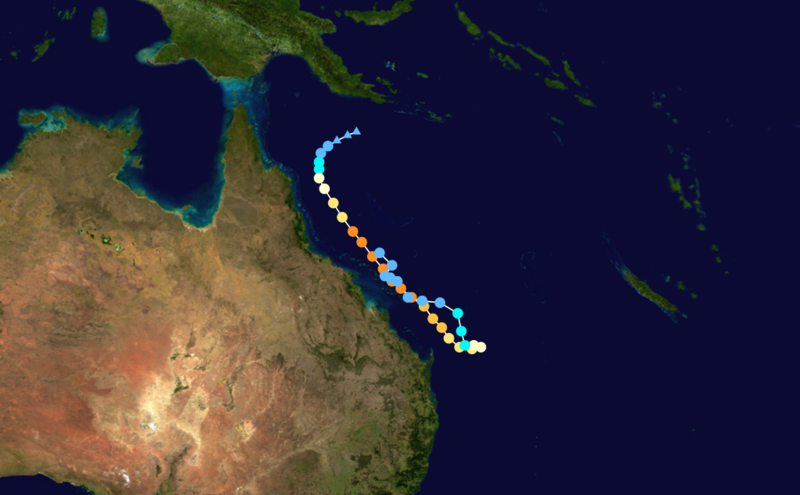 Tropical Storm Hamish Track Saffir-Simpson Scale Color Legend | ||||||||
| Tropical Cyclone | Hamish | ||||||||
| Cyclogenesis Date | 03/06 | Cyclolysis Date | 03/11 | ||||||
| Highest Australian Category | Cat 5 | Maximum Gust | 296 km/h | ||||||
| Highest Saffir-Simpson Category | Cat 4 | ||||||||
| Maximum 6-hr Sustained Wind | 150 mph (130 kt or 241 km/h) | ||||||||
| Min Pressure | 925 mbar | ||||||||
| Accumulated Cyclone Energy (ACE*) Index (kt2) | 21.3794 x 10⁴ | ||||||||
| Landfall Information (date, location and sustained winds) | N/A | ||||||||
| Deaths | 0 | ||||||||
| *The (ACE) Index calculations are based on preliminary data. | |||||||||
 Tropical Storm IIsa Satellite Image Australian Scale Color Legend |
 Tropical Storm IIsa Track Saffir-Simpson Scale Color Legend | ||||||||
| Tropical Cyclone | IIsa | ||||||||
| Cyclogenesis Date | 03/18 | Cyclolysis Date | 03/23 | ||||||
| Highest Australian Category | Cat 4 | Maximum Gust | 232 km/h | ||||||
| Highest Saffir-Simpson Category | Cat 3 | ||||||||
| Maximum 6-hr Sustained Wind | 115 mph (100 kt or 185 km/h) | ||||||||
| Min Pressure | 958 mbar | ||||||||
| Accumulated Cyclone Energy (ACE*) Index (kt2) | 10.9619 x 10⁴ | ||||||||
| Landfall Information (date, location and sustained winds) | N/A | ||||||||
| Deaths | 0 | ||||||||
| *The (ACE) Index calculations are based on preliminary data. | |||||||||
South Pacific Basin
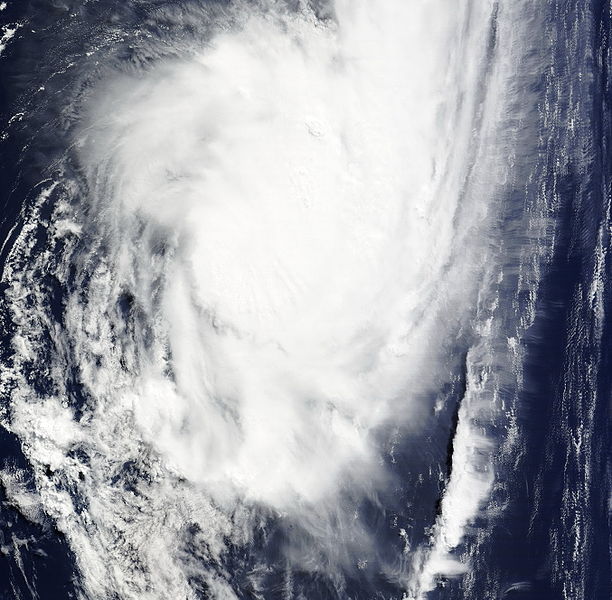 Tropical Storm Joni Satellite Image |
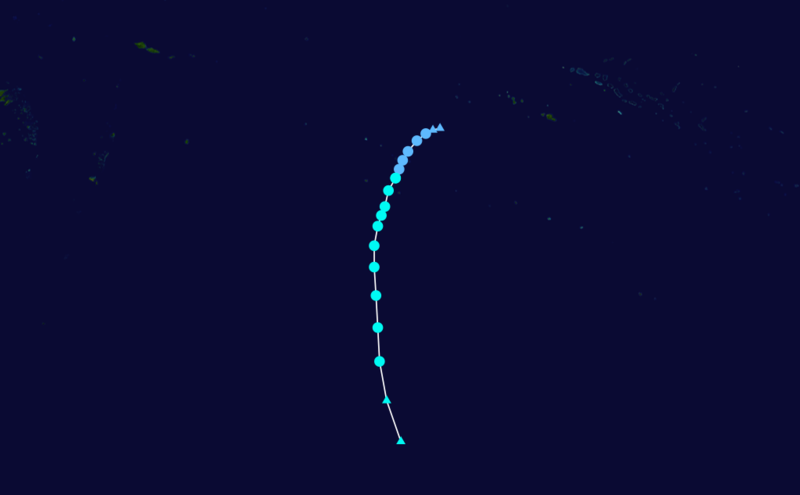 Tropical Storm Joni Track Saffir-Simpson Scale Color Legend | ||||||||
| Tropical Cyclone | Joni | ||||||||
| Cyclogenesis Date | 03/11 | Cyclolysis Date | 03/13 | ||||||
| Highest Saffir-Simpson Category | TS | ||||||||
| Maximum 6-hr Sustained Wind | 63 mph (55 kt or 102 km/h) | ||||||||
| Min Pressure | 980 mbar | ||||||||
| Accumulated Cyclone Energy (ACE*) Index (kt2) | 2.4588 x 10⁴ | ||||||||
| Landfall Information (date, location and sustained winds) | N/A | ||||||||
| Deaths | 0 | ||||||||
| *The (ACE) Index calculations are based on preliminary data. | |||||||||
 Tropical Storm Ken Satellite Image |
 Tropical Storm Ken Track Saffir-Simpson Scale Color Legend | ||||||||
| Tropical Cyclone | Ken | ||||||||
| Cyclogenesis Date | 03/17 | Cyclolysis Date | 03/20 | ||||||
| Highest Saffir-Simpson Category | TS | ||||||||
| Maximum 6-hr Sustained Wind | 52 mph (45 kt or 83 km/h) | ||||||||
| Min Pressure | 985 mbar | ||||||||
| Accumulated Cyclone Energy (ACE*) Index (kt2) | 1.3838 x 10⁴ | ||||||||
| Landfall Information (date, location and sustained winds) | N/A | ||||||||
| Deaths | 0 | ||||||||
| *The (ACE) Index calculations are based on preliminary data. | |||||||||
 Tropical Storm Jasper Satellite Image |
 Tropical Storm Jasper Track Saffir-Simpson Scale Color Legend | ||||||||
| Tropical Cyclone | Jasper | ||||||||
| Cyclogenesis Date | 03/24 | Cyclolysis Date | 03/25 | ||||||
| Highest Saffir-Simpson Category | TS | ||||||||
| Maximum 6-hr Sustained Wind | 52 mph (45 kt or 83 km/h) | ||||||||
| Min Pressure | 985 mbar | ||||||||
| Accumulated Cyclone Energy (ACE*) Index (kt2) | .8256 x 104 | ||||||||
| Landfall Information (date, location and sustained winds) | N/A | ||||||||
| Deaths | 0 | ||||||||
| *The (ACE) Index calculations are based on preliminary data. | |||||||||
South Indian Basin
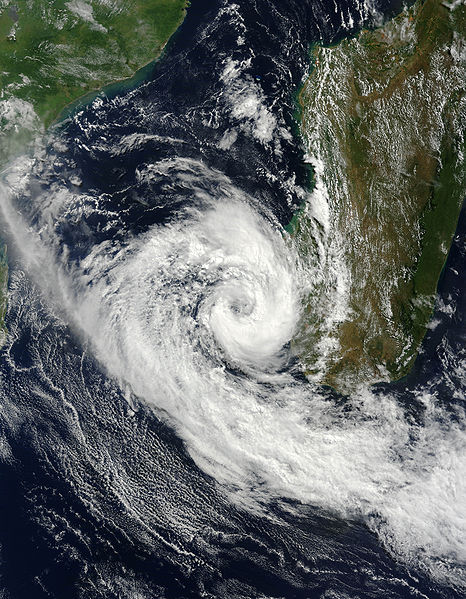 Tropical Storm Izida Satellite Image |
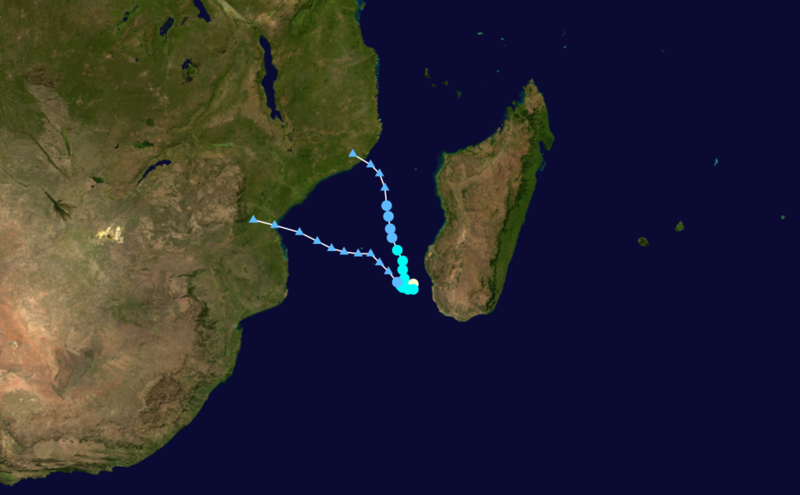 Tropical Storm Izida Track Saffir-Simpson Scale Color Legend | ||||||||
| Tropical Cyclone | Izida | ||||||||
| Cyclogenesis Date | 03/24 | Cyclolysis Date | 03/27 | ||||||
| Highest Saffir-Simpson Category | Cat 1 | ||||||||
| Maximum 6-hr Sustained Wind | 75 mph (65 kt or 120 km/h) | ||||||||
| Min Pressure | 978 mbar | ||||||||
| Accumulated Cyclone Energy (ACE*) Index (kt2) | 2.4363 x 10⁴ | ||||||||
| Landfall Information (date, location and sustained winds) | N/A | ||||||||
| Deaths | 0 | ||||||||
| *The (ACE) Index calculations are based on preliminary data. | |||||||||