Note: This report catalogs recent tropical cyclones across the North Atlantic and East Pacific and places each basin’s tropical cyclone activity in a climate-scale context. It is not updated in real time. Users seeking the real time status and forecasts of tropical cyclones should visit The National Hurricane Center.
South Indian Basin
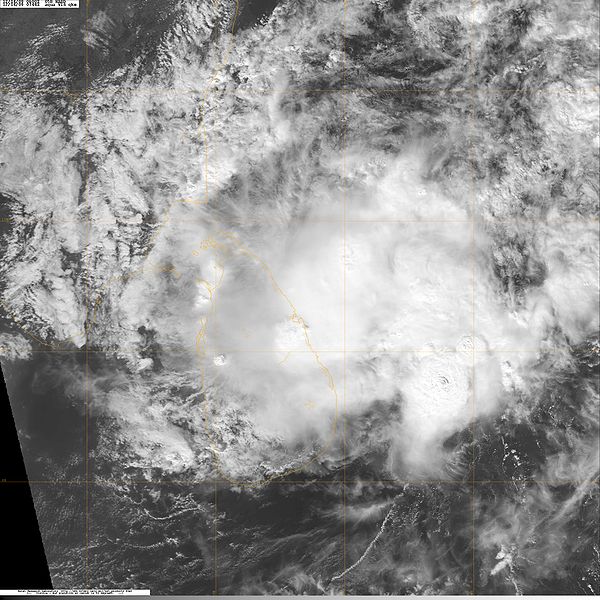
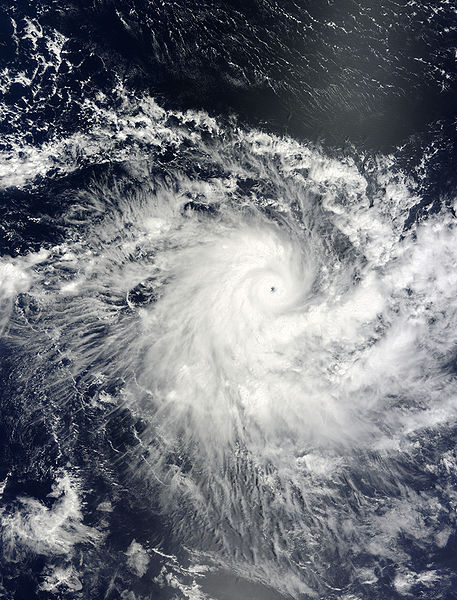 Tropical Storm Cleo Satellite Image |
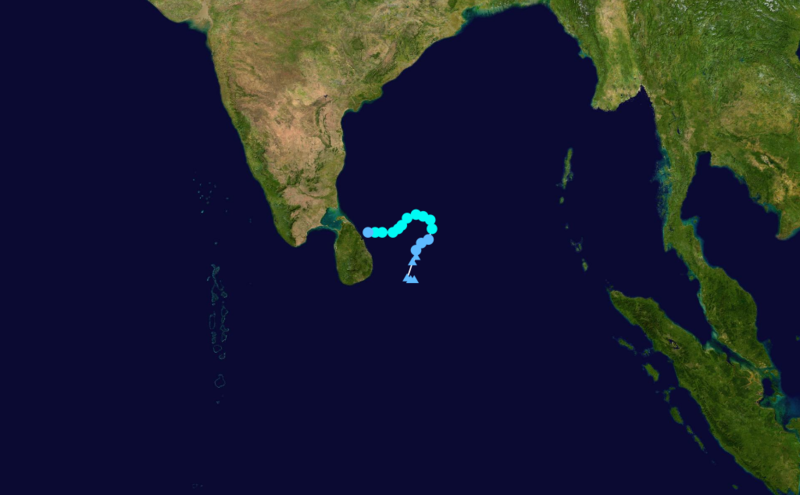
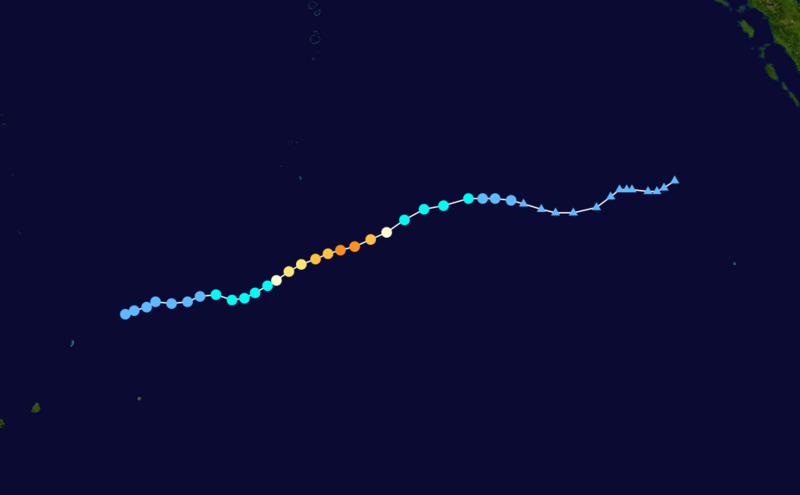 Tropical Storm Cleo Track  Saffir-Simpson Scale Color Legend | ||||||||
| Tropical Cyclone | Cleo | ||||||||
| Cyclogenesis Date | 12/07 | ||||||||
| Cyclolysis Date | 12/11 | ||||||||
| Highest Saffir-Simpson Category | Cat 4 | ||||||||
| Maximum 6-hr Sustained Wind | 132 mph (115 kt or 213 km/h) | ||||||||
| Min Pressure | 927 mbar | ||||||||
| Accumulated Cyclone Energy (ACE*) Index (kt2) | 8.9538 x 10⁴ | ||||||||
| Landfall Information (date, location and sustained winds) | N/A | ||||||||
| Deaths | N/A | ||||||||
| *The (ACE) Index calculations are based on preliminary data. | |||||||||
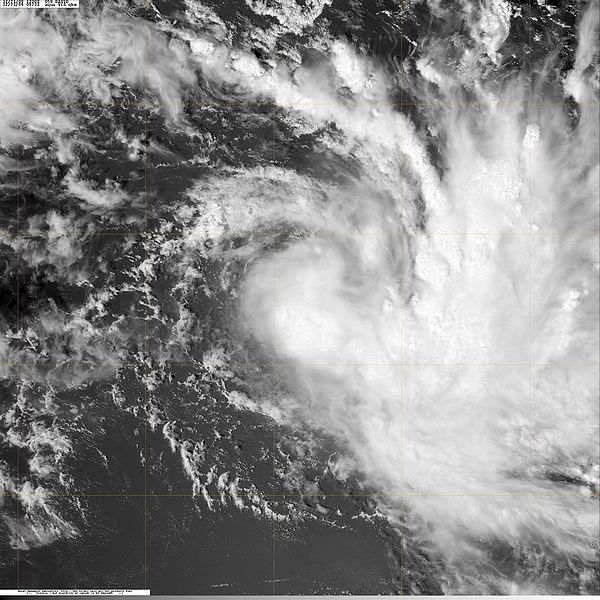 Tropical Storm David Satellite Image |
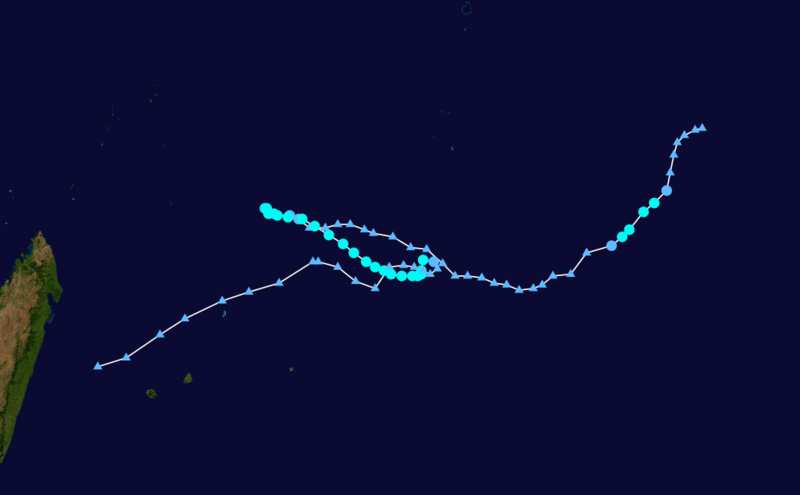 Tropical Storm David Track Saffir-Simpson Scale Color Legend | ||||||||
| Tropical Cyclone | David | ||||||||
| Cyclogenesis Date | 12/20 | ||||||||
| Cyclolysis Date | 12/25 | ||||||||
| Highest Saffir-Simpson Category | TS | ||||||||
| Maximum 6-hr Sustained Wind | 63 mph (55 kt or 102 km/h) | ||||||||
| Min Pressure | 980 mbar | ||||||||
| Accumulated Cyclone Energy (ACE*) Index (kt2) | 4.6906 x 10⁴ | ||||||||
| Landfall Information (date, location and sustained winds) | N/A | ||||||||
| Deaths | N/A | ||||||||
| *The (ACE) Index calculations are based on preliminary data. | |||||||||
North Indian Basin
 Tropical Storm Ward Satellite Image |
 Tropical Storm Ward Track Saffir-Simpson Scale Color Legend | ||||||||
| Tropical Cyclone | Ward | ||||||||
| Cyclogenesis Date | 12/11 | ||||||||
| Cyclolysis Date | 12/13 | ||||||||
| Highest Saffir-Simpson Category | TS | ||||||||
| Maximum 6-hr Sustained Wind | 58 mph (50 kt or 93 km/h) | ||||||||
| Min Pressure | 996 mbar | ||||||||
| Accumulated Cyclone Energy (ACE*) Index (kt2) | 1.7525 x 10⁴ | ||||||||
| Landfall Information (date, location and sustained winds) | N/A | ||||||||
| Deaths | N/A | ||||||||
| *The (ACE) Index calculations are based on preliminary data. | |||||||||
South Pacific Basin
 Tropical Storm Mick Satellite Image |
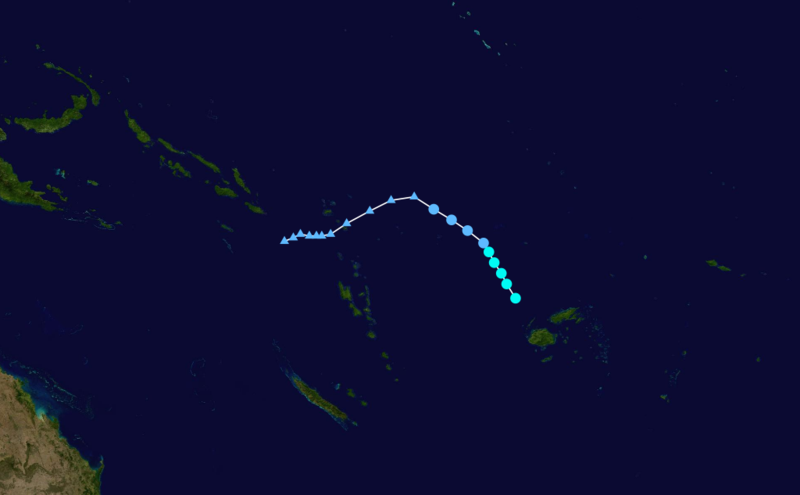 Tropical Storm Mick Track Saffir-Simpson Scale Color Legend | ||||||||
| Tropical Cyclone | Mick | ||||||||
| Cyclogenesis Date | 12/12 | ||||||||
| Cyclolysis Date | 12/15 | ||||||||
| Highest Saffir-Simpson Category | Cat 1 | ||||||||
| Maximum 6-hr Sustained Wind | 75 mph (65 kt or 120 km/h) | ||||||||
| Min Pressure | 975 mbar | ||||||||
| Accumulated Cyclone Energy (ACE*) Index (kt2) | 3.0737 x 10⁴ | ||||||||
| Landfall Information (date, location and sustained winds) | N/A | ||||||||
| Deaths | N/A | ||||||||
| *The (ACE) Index calculations are based on preliminary data. | |||||||||
Australian Basin
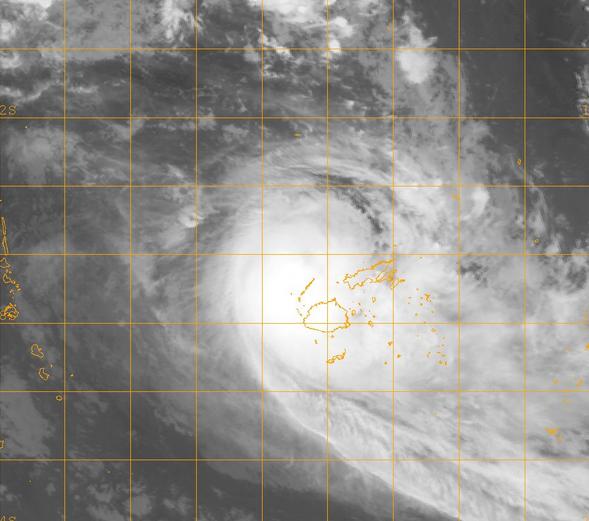
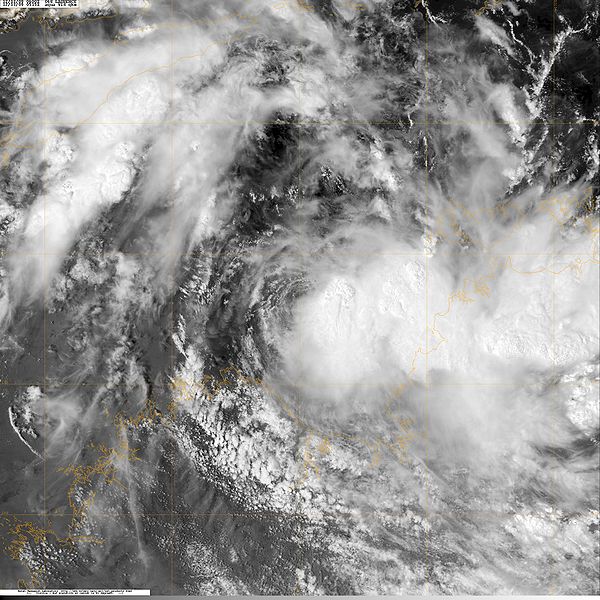 Tropical Storm Laurence Satellite Image  Australian Scale Color Legend |
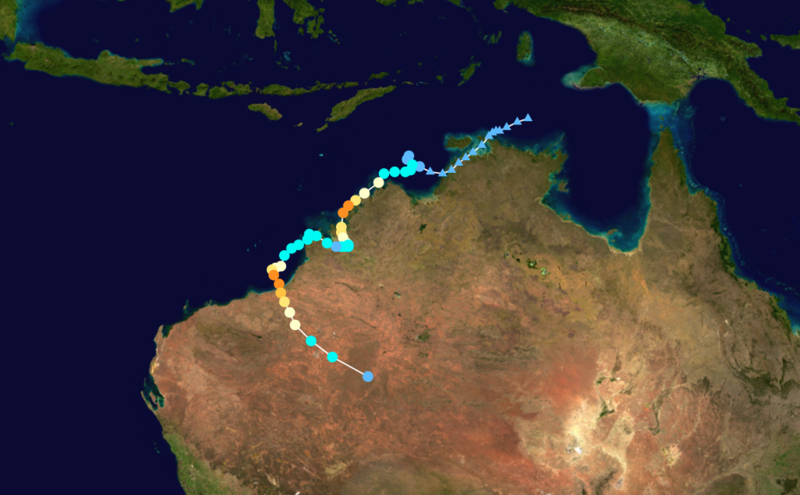 Tropical Storm Laurence Track Saffir-Simpson Scale Color Legend | ||||||||
| Tropical Cyclone | Laurence | ||||||||
| Cyclogenesis Date | 12/13 | Cyclolysis Date | 12/21 | ||||||
| Highest Australian Category | Cat 4 | Maximum Gust | 259 km/h | ||||||
| Highest Saffir-Simpson Category | Cat 3 | ||||||||
| Maximum 6-hr Sustained Wind | 86 mph (115 kt or 213 km/h) | ||||||||
| Min Pressure | 996 mbar | ||||||||
| Accumulated Cyclone Energy (ACE*) Index (kt2) | 11.6444 x 10⁴ | ||||||||
| Landfall Information (date, location and sustained winds) | 12/15 - Mitchell River Nat'l Park, Western Australia (70 kt or 129 km/h 12/16 - Horizontal Fall, Western Australia (100 kt or 185 km/h) 12/21 - near Mandora Station, Western Australia (109 kt or 201 km/h) |
||||||||
| Deaths | N/A | ||||||||
| *The (ACE) Index calculations are based on preliminary data. | |||||||||