Atlantic Basin
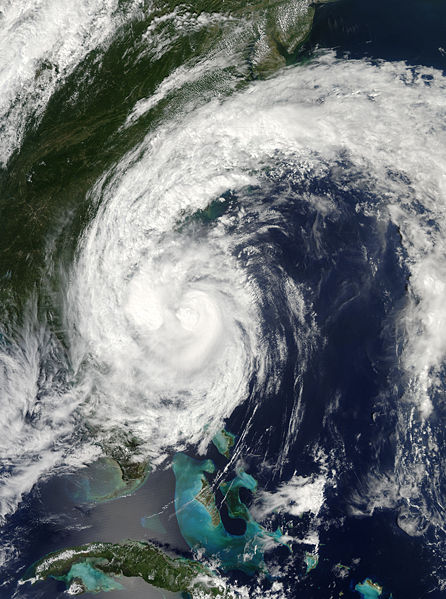 Hurricane Hanna Satellite Image (high resolution - 7.8 mb) |
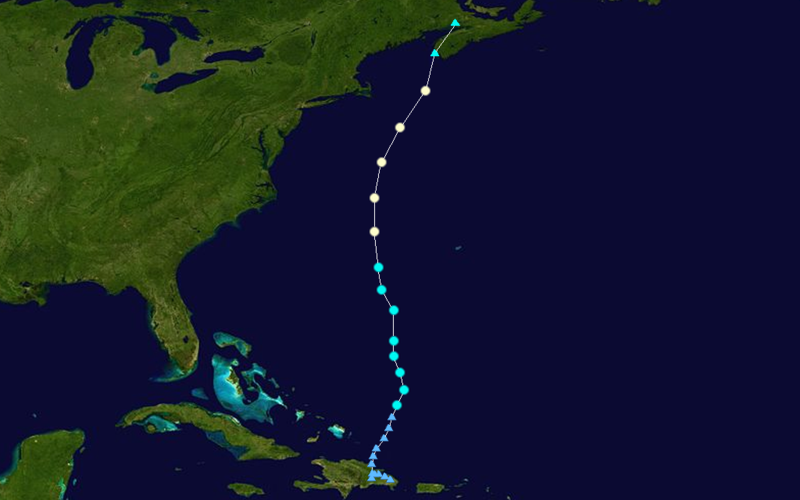
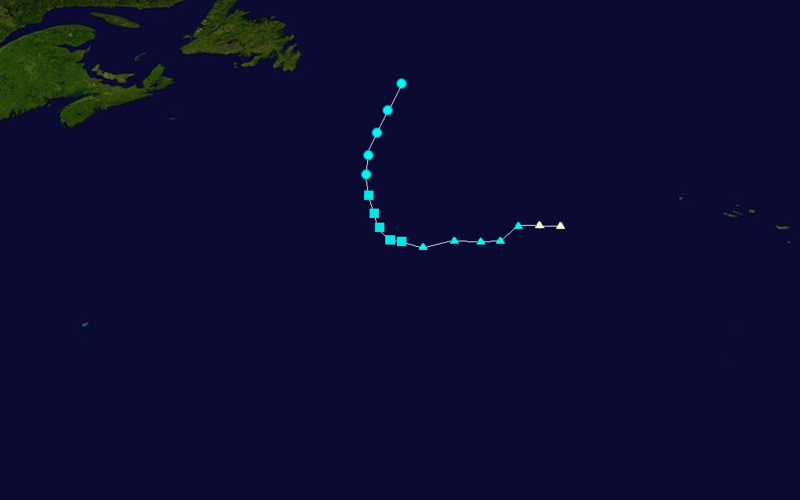
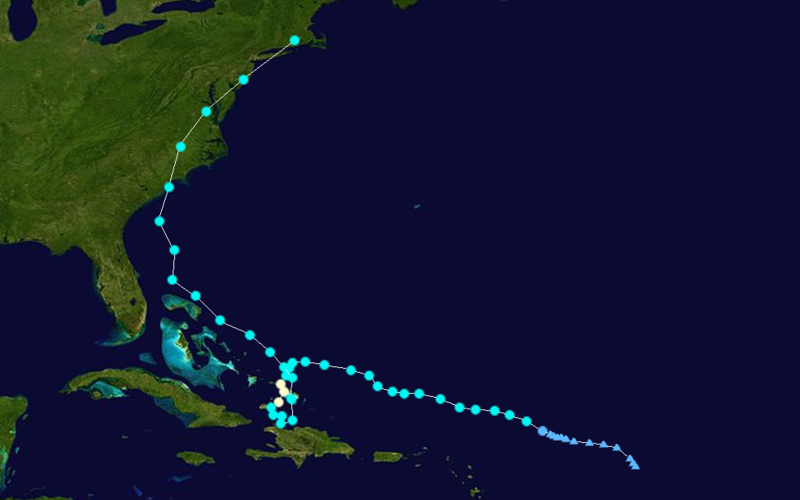 Hurricane Hanna Track  Saffir-Simpson Scale Color Legend |
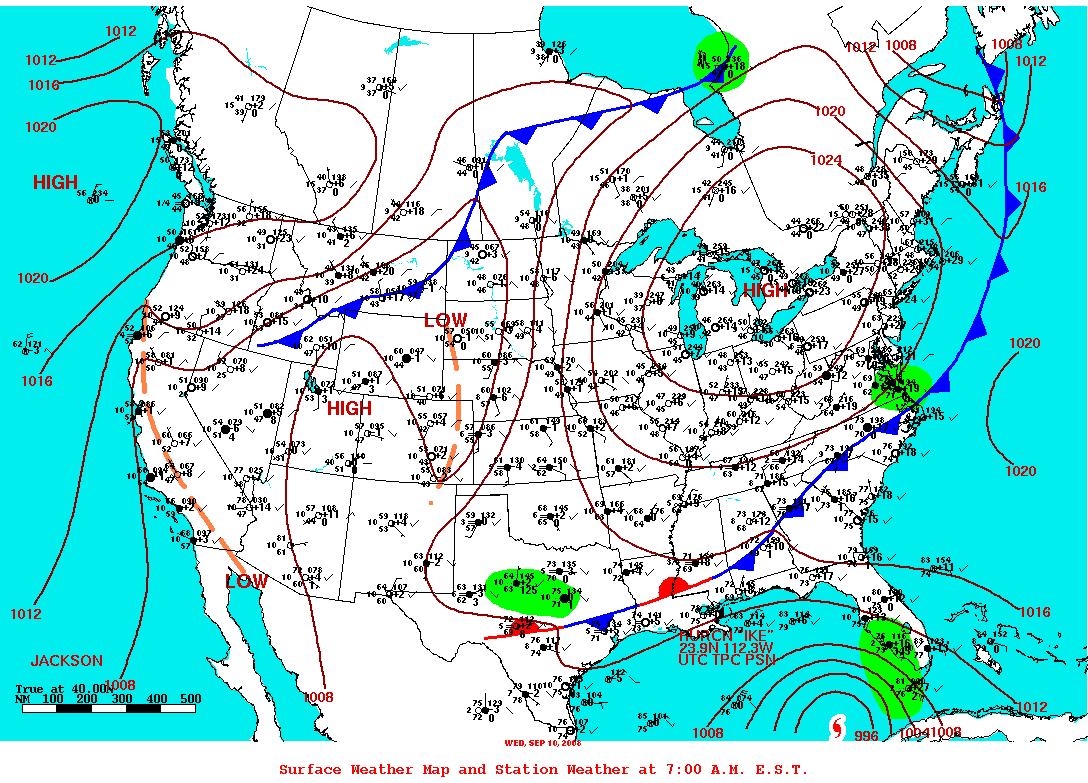
Hanna was officially the eighth named tropical cyclone of the 2008 Atlantic hurricane season on August 28. Influenced by Hurricane Gustav's circulation, Hanna drifted to the south from September 1-September 3. Conditions were favorable enough for the convection around the center to increase and the National Hurricane Center (NHC) upgraded Hanna to a hurricane on the afternoon of September 1, but just two days later the NHC downgraded the storm. After making a counter clockwise loop between the Turks and Caicos Islands, the storm moved from the west-northwest to the north for the next 3 days, and on September 6, Hanna made landfall near the border of the Carolinas as a tropical storm with a pressure of 983 mb and winds 102-111 km/h (55-60 kt or 63-69 mph). After turning northwestward, Hanna moved along the Atlantic Coast states and on September 7, made a 2nd landfall over Long Island. The storm's lowest measured pressure was 978 mb and highest winds were measured at 129 km/h (70 knots or 80 mph). Despite the storm's minimal hurricane status it still caused 536 deaths across Haiti and the U.S. Flooding in northern Haiti was the major cause of deaths and only minor damage was reported in the U.S. More information on the storm's impact on Haiti can be found on the Global Hazards page. More information on Hanna is available from the NOAA National Hurricane Center. | |
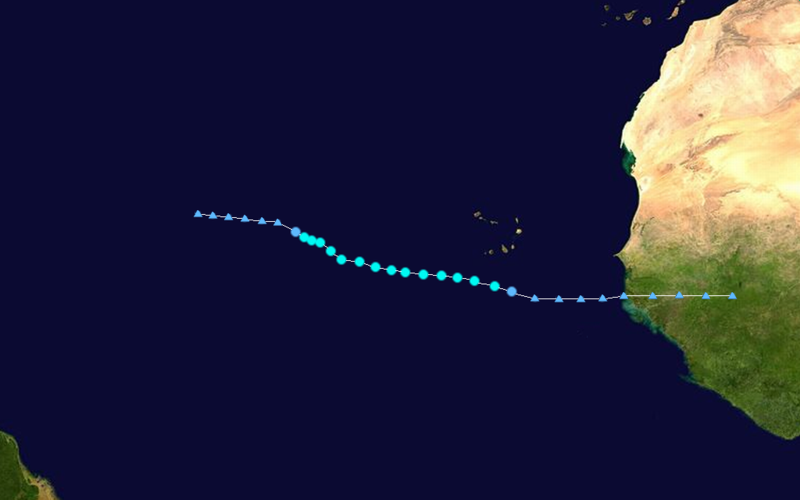
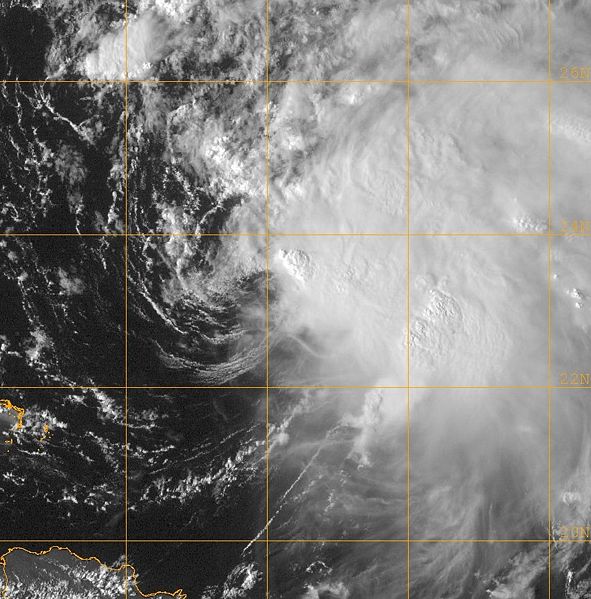
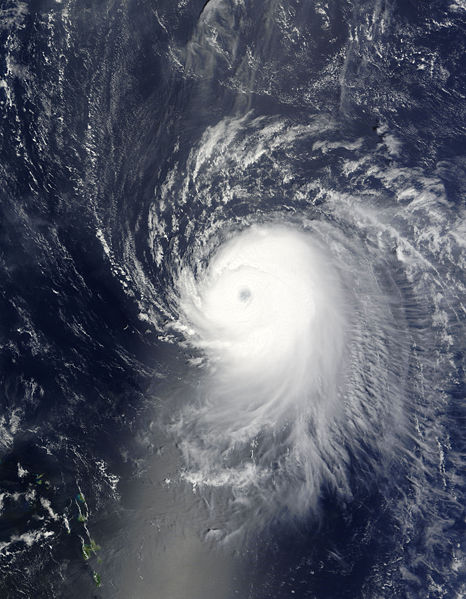 Hurricane Ike Satellite Image (high resolution - 5.6 mb) |
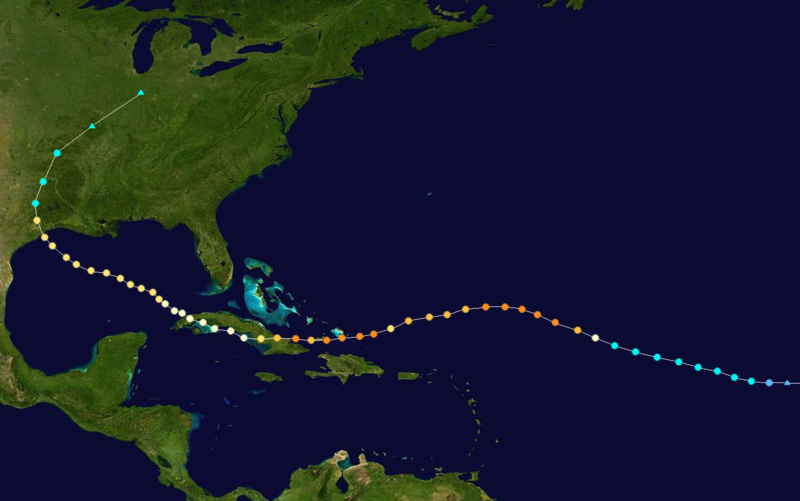 Hurricane Ike Track Saffir-Simpson Scale Color Legend |
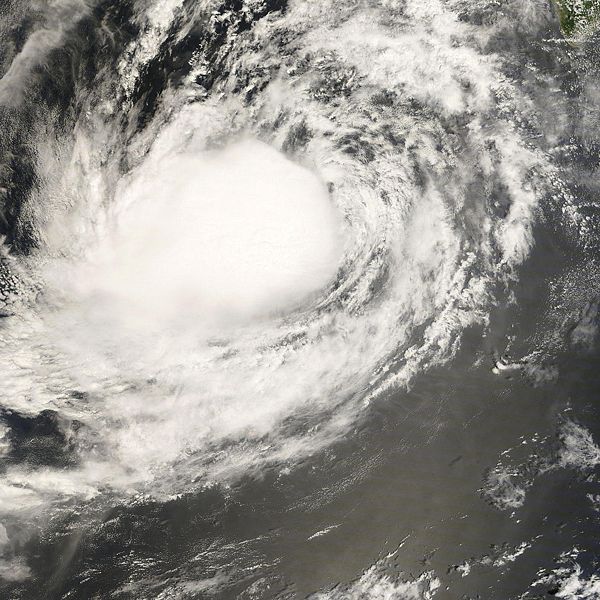
In late August, a well defined tropical disturbance off the coast of Africa slowly tracked westward and eventually became Tropical Storm Ike on September 1. By the afternoon of September 3, Ike had intensified to hurricane status. With the aid of nearly zero vertical wind sheer, a strong low over the northwestern Atlantic and an upper-level trough in control over the eastern Atlantic, Hurricane Ike was able to intensify quickly into a Category 4 storm with a peak intensity of 233 km/h (126 knots or 145 mph) and a pressure of 935 mb. Ike's minimum central pressure of 935 mb, recorded on September 4, is the lowest pressure for the 2008 season. Strong northwesterly sheer on September 5 weakened Ike to a Category 3 storm as it moved westward towards Cuba, but as conditions improved, Ike strengthened back to a Category 4 Hurricane on September 6. Hurricane Ike made landfall in Cuba near Cabo Lucrecia on September 7 with winds estimated at 203-213 km/h (110-115 knots or 127-132 mph). More information on the effects of Ike on Cuba can be found on the Global Hazards page.
| |
 merging with a cold front
 Tropical Storm Josephine Satellite Image |
 Tropical Storm Josephine Track Saffir-Simpson Scale Color Legend |
On September 2, Tropical Depression Josephine formed to the south-southeast of the Cape Verde Islands. Later the same day, Josephine was upgraded to a tropical storm. Conditions were not favorable for strengthening during the next few days, as strong upper level wind shear and dry air dominated the region. Josephine weakened into a depression on September 5 and by the next morning it had deteriorated into a remnant low. Josephine's highest winds were measured at 100 km/h (56 knots or 65 mph) and the storm's lowest pressure was measured at 994 mb. More information on Josephine is available from the NOAA National Hurricane Center. | |
 Hurricane Kyle Satellite Image |
 Hurricane Kyle Track Saffir-Simpson Scale Color Legend |
A low pressure system that plagued Hispaniola and Puerto Rico during the third week of September developed into Tropical Storm Kyle on the 25th. Influenced by a ridge over the central Atlantic and a low pressure area over the eastern U.S., Kyle maintained a swift northerly motion. Despite the strong southwesterly upper level shear, Kyle was able to gain hurricane status on the afternoon of the 27th. As Kyle moved over the cool waters of the North Atlantic, it barely maintained its hurricane intensity. With very little of its convection remaining, Kyle was downgraded to a tropical storm on the evening of September 28, but not before making landfall near Yarmouth, Nova Scotia. Hurricane Kyle's maximum intensity was 129 km/h (70 knots or 80 mph) and 984 mb. More information on Kyle is available from the NOAA National Hurricane Center. | |
 Tropical Storm Laura Image |
 Tropical Storm Laura Track Saffir-Simpson Scale Color Legend |
Tropical Storm Laura was the twelfth named storm of the 2008 Atlantic hurricane season. It formed west of the Azores on September 29 and due to its non-tropical characteristics, was initially declared a subtropical storm. On the afternoon of the 30th, the National Hurricane Center (NHC) determined that the radius of the strongest winds had contracted to 111 km (69 miles), the cloud tops had become colder and it had separated itself from an upper-level low. These factors attributed to the storm's re-classification as a tropical storm. However, by October 1, the NHC determined that Laura's convection had diminished and the cloud pattern was not distinct—reasons enough to downgrade the storm to a remnant low. The extratropical system then traveled to the east eventually bringing heavy wind and rains to the British Isles on October 5. Tropical Storm Laura had a peak sustained wind of 95 km/h (52 knots or 60 mph) and its lowest recorded pressure was 993 mb. More information on Laura is available from the NOAA National Hurricane Center. | |
Pacific Basin
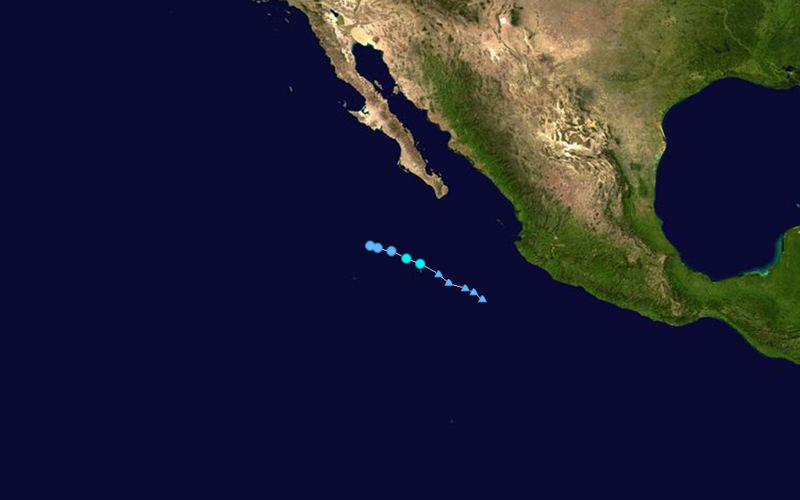
 Tropical Storm Lowell Satellite Image (high resolution) |
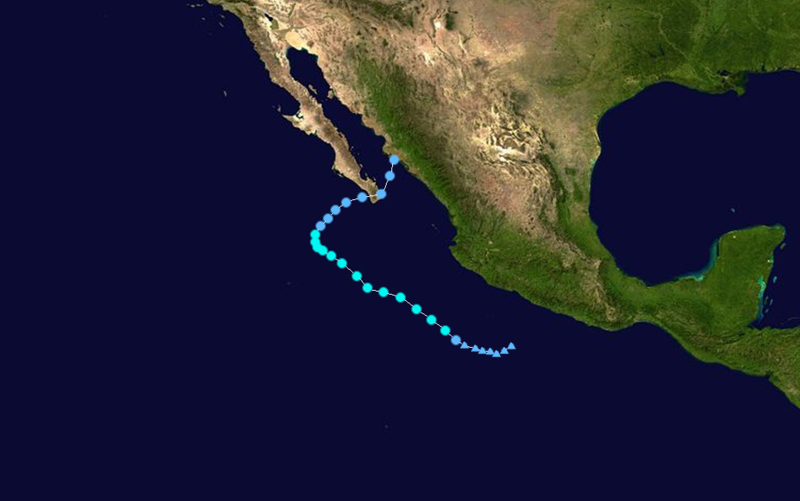 Tropical Storm Lowell Track Saffir-Simpson Scale Color Legend |
Tropical Storm Lowell developed from a large system of thunderstorms southwest of Manzanillo, Mexico on September 6. The storm impacted the southern tip of Baja, California as it moved to the northeast. By September 10, the storm had weakened to a tropical depression and dissipated on September 11. Although the storm did not result in any deaths, it did produce copious amounts of rainfall in the central northern U.S., causing significant flooding and minor damage. The lowest observed pressure was 996 mb and the highest wind speed was 97 km/hr (52 knots or 60 mph). More information on Tropical Storm Lowell is available from the NOAA National Hurricane Center. | |
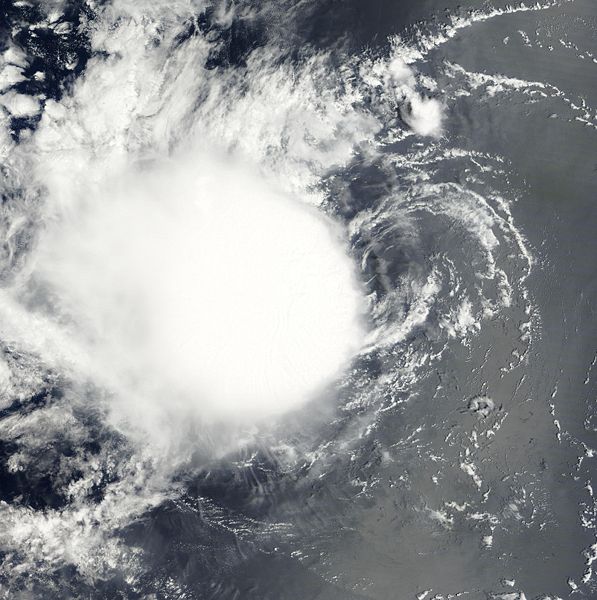 Tropical Storm Karina Satellite Image |
 Tropical Storm Karina Track Saffir-Simpson Scale Color Legend |
Tropical Storm Karina was a short-lived Pacific storm that organized on September 2. It traveled to the northwest, but due to persistent easterly shear the storm could not remain organized. The National Hurricane Center issued the last advisory on Karina on September 3. Its lowest pressure was measured to be 1000 mb and its highest winds were 65 km/hr (35 knots or 40 mph). More information on Tropical Storm Karina is available from the NOAA National Hurricane Center. | |