Atlantic Basin
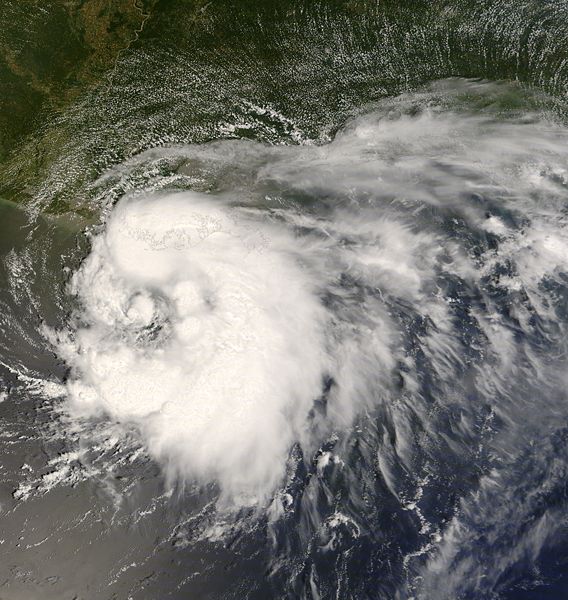 Tropical Storm Edouard Satellite Image (high resolution - 3.6 MB) |
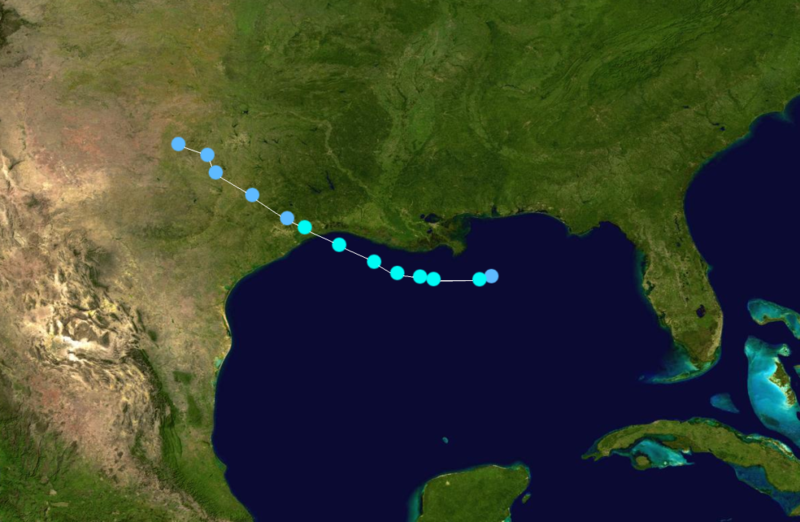 Tropical Storm Edouard Track  Saffir-Simpson Scale Color Legend |
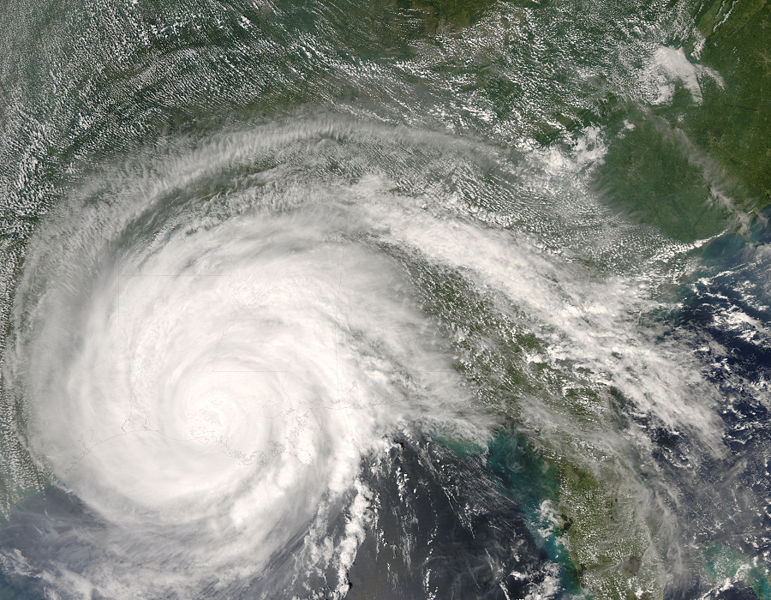
Atlantic Tropical Storm Edouard developed in the northeastern Gulf of Mexico on August 3 and made landfall two days later near Port Arthur, Texas as a strong tropical storm. The system weakened into a tropical depression that afternoon and continued to weaken after moving inland. Edouard had maximum sustained winds of 65 km/hr (35 knots or 40 mph) and a minimum pressure of 997 mb. More information on Edouard is available from the NOAA National Hurricane Center. | |
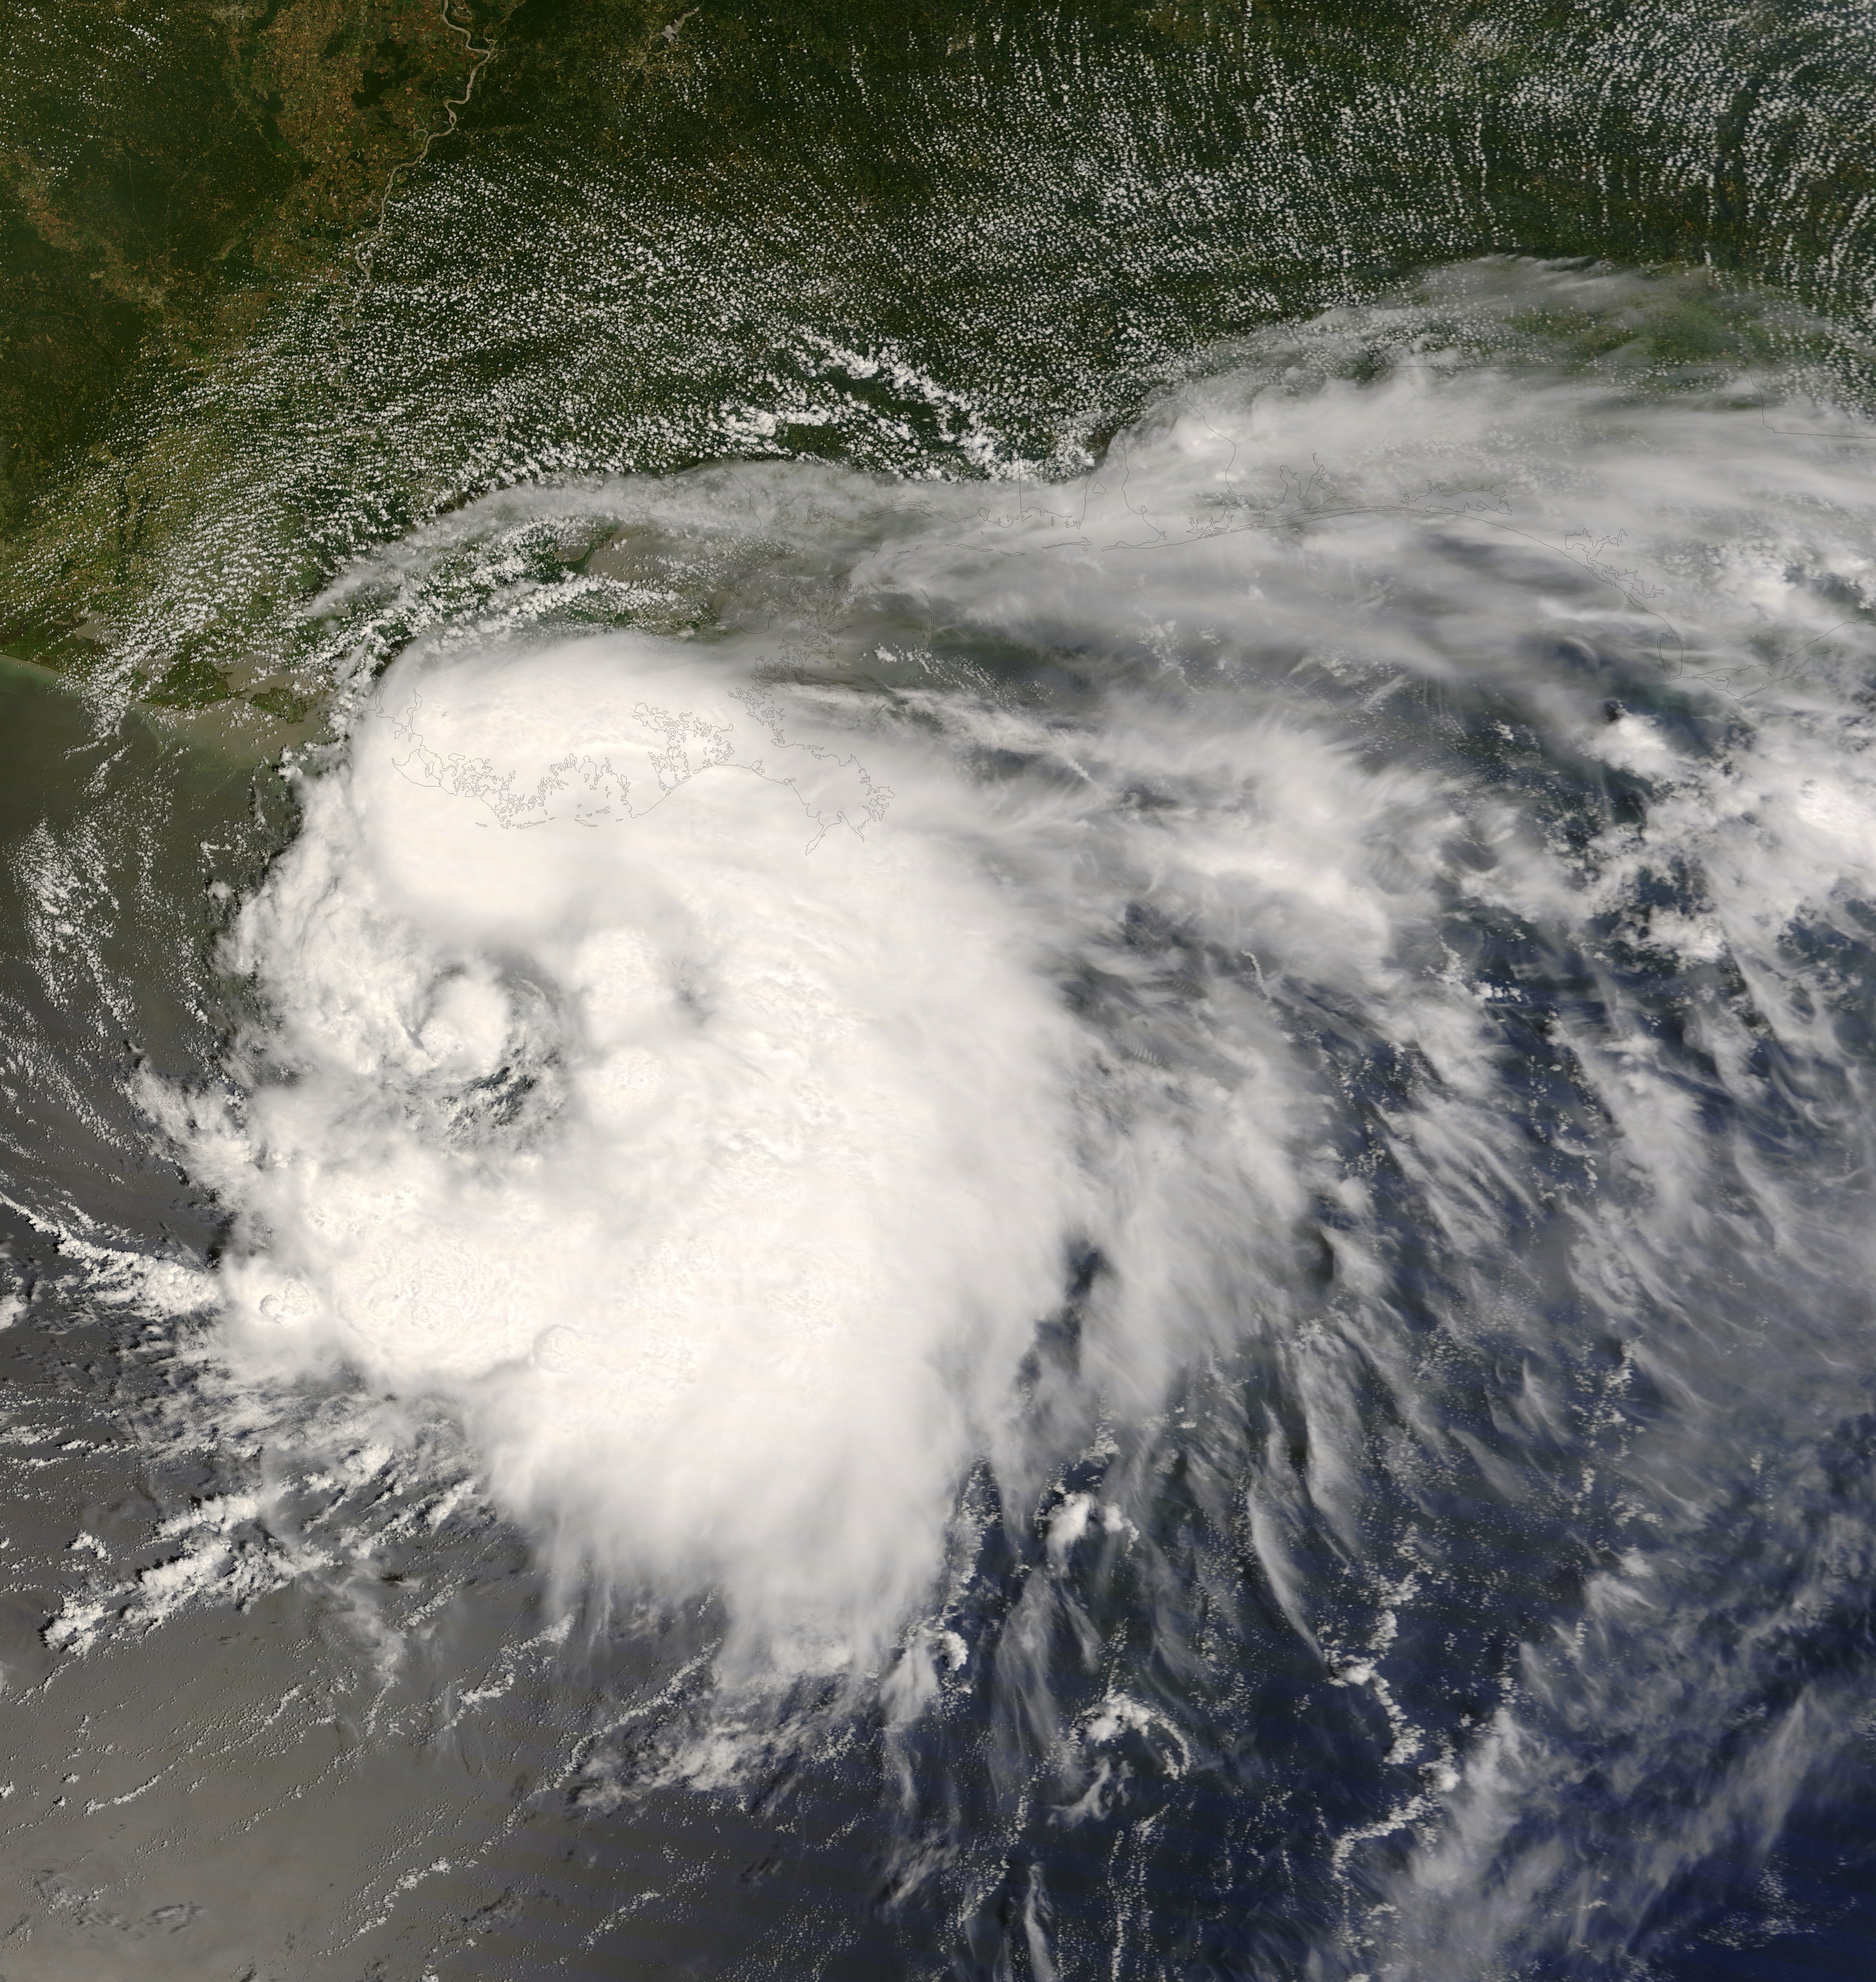
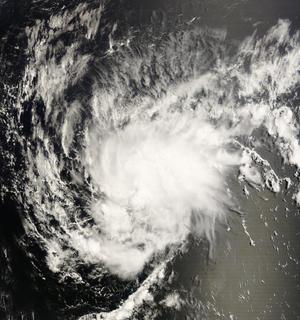
 Tropical Storm Fay Satellite Image (high resolution - 5.3 MB) |
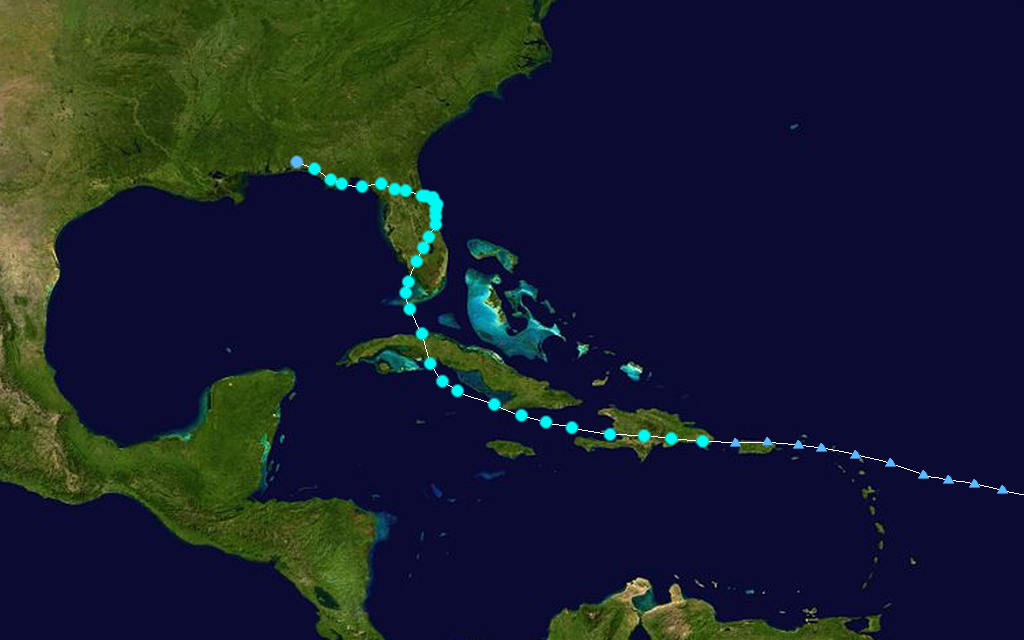 Tropical Storm Fay Track Saffir-Simpson Scale Color Legend |
Tropical Storm Fay began as a westward-moving tropical wave which intensified into a tropical storm on August 15 just east of Hispaniola. Fay first hit Hispaniola and Cuba before moving north to Florida. The storm made landfall in the Florida Keys late on August 18, then hit the Florida peninsula the next morning and slowly tracked north-northeastward into the Atlantic. Tropical Storm Fay made landfall in Florida for the third time near Flagler Beach on the afternoon of August 21. Steered by an upper-level high pressure system, the storm moved west-northwest across Florida, emerging into the northeastern Gulf of Mexico and making its fourth Florida landfall on the morning of August 23 near Carrabelle in the Florida panhandle. Fay was the first storm on record to make four landfalls on the state of Florida (or any state). Parts of Florida received over two feet (610 mm) of rainfall from the slow-moving storm, and Fay produced flood-inducing rains across parts of Alabama, Georgia and the Carolinas for several days. Fay had maximum sustained winds of 65 km/hr (35 knots or 40 mph) and a minimum pressure of 986 mb. More information on Fay is available from the NOAA National Hurricane Center. | |
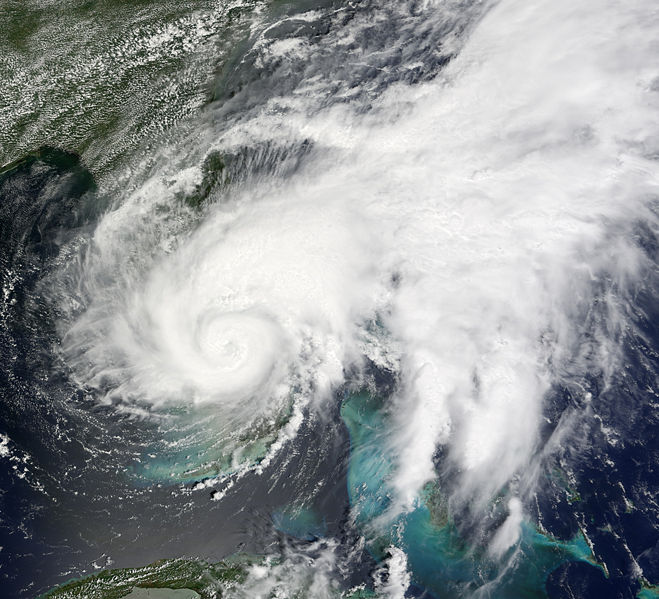
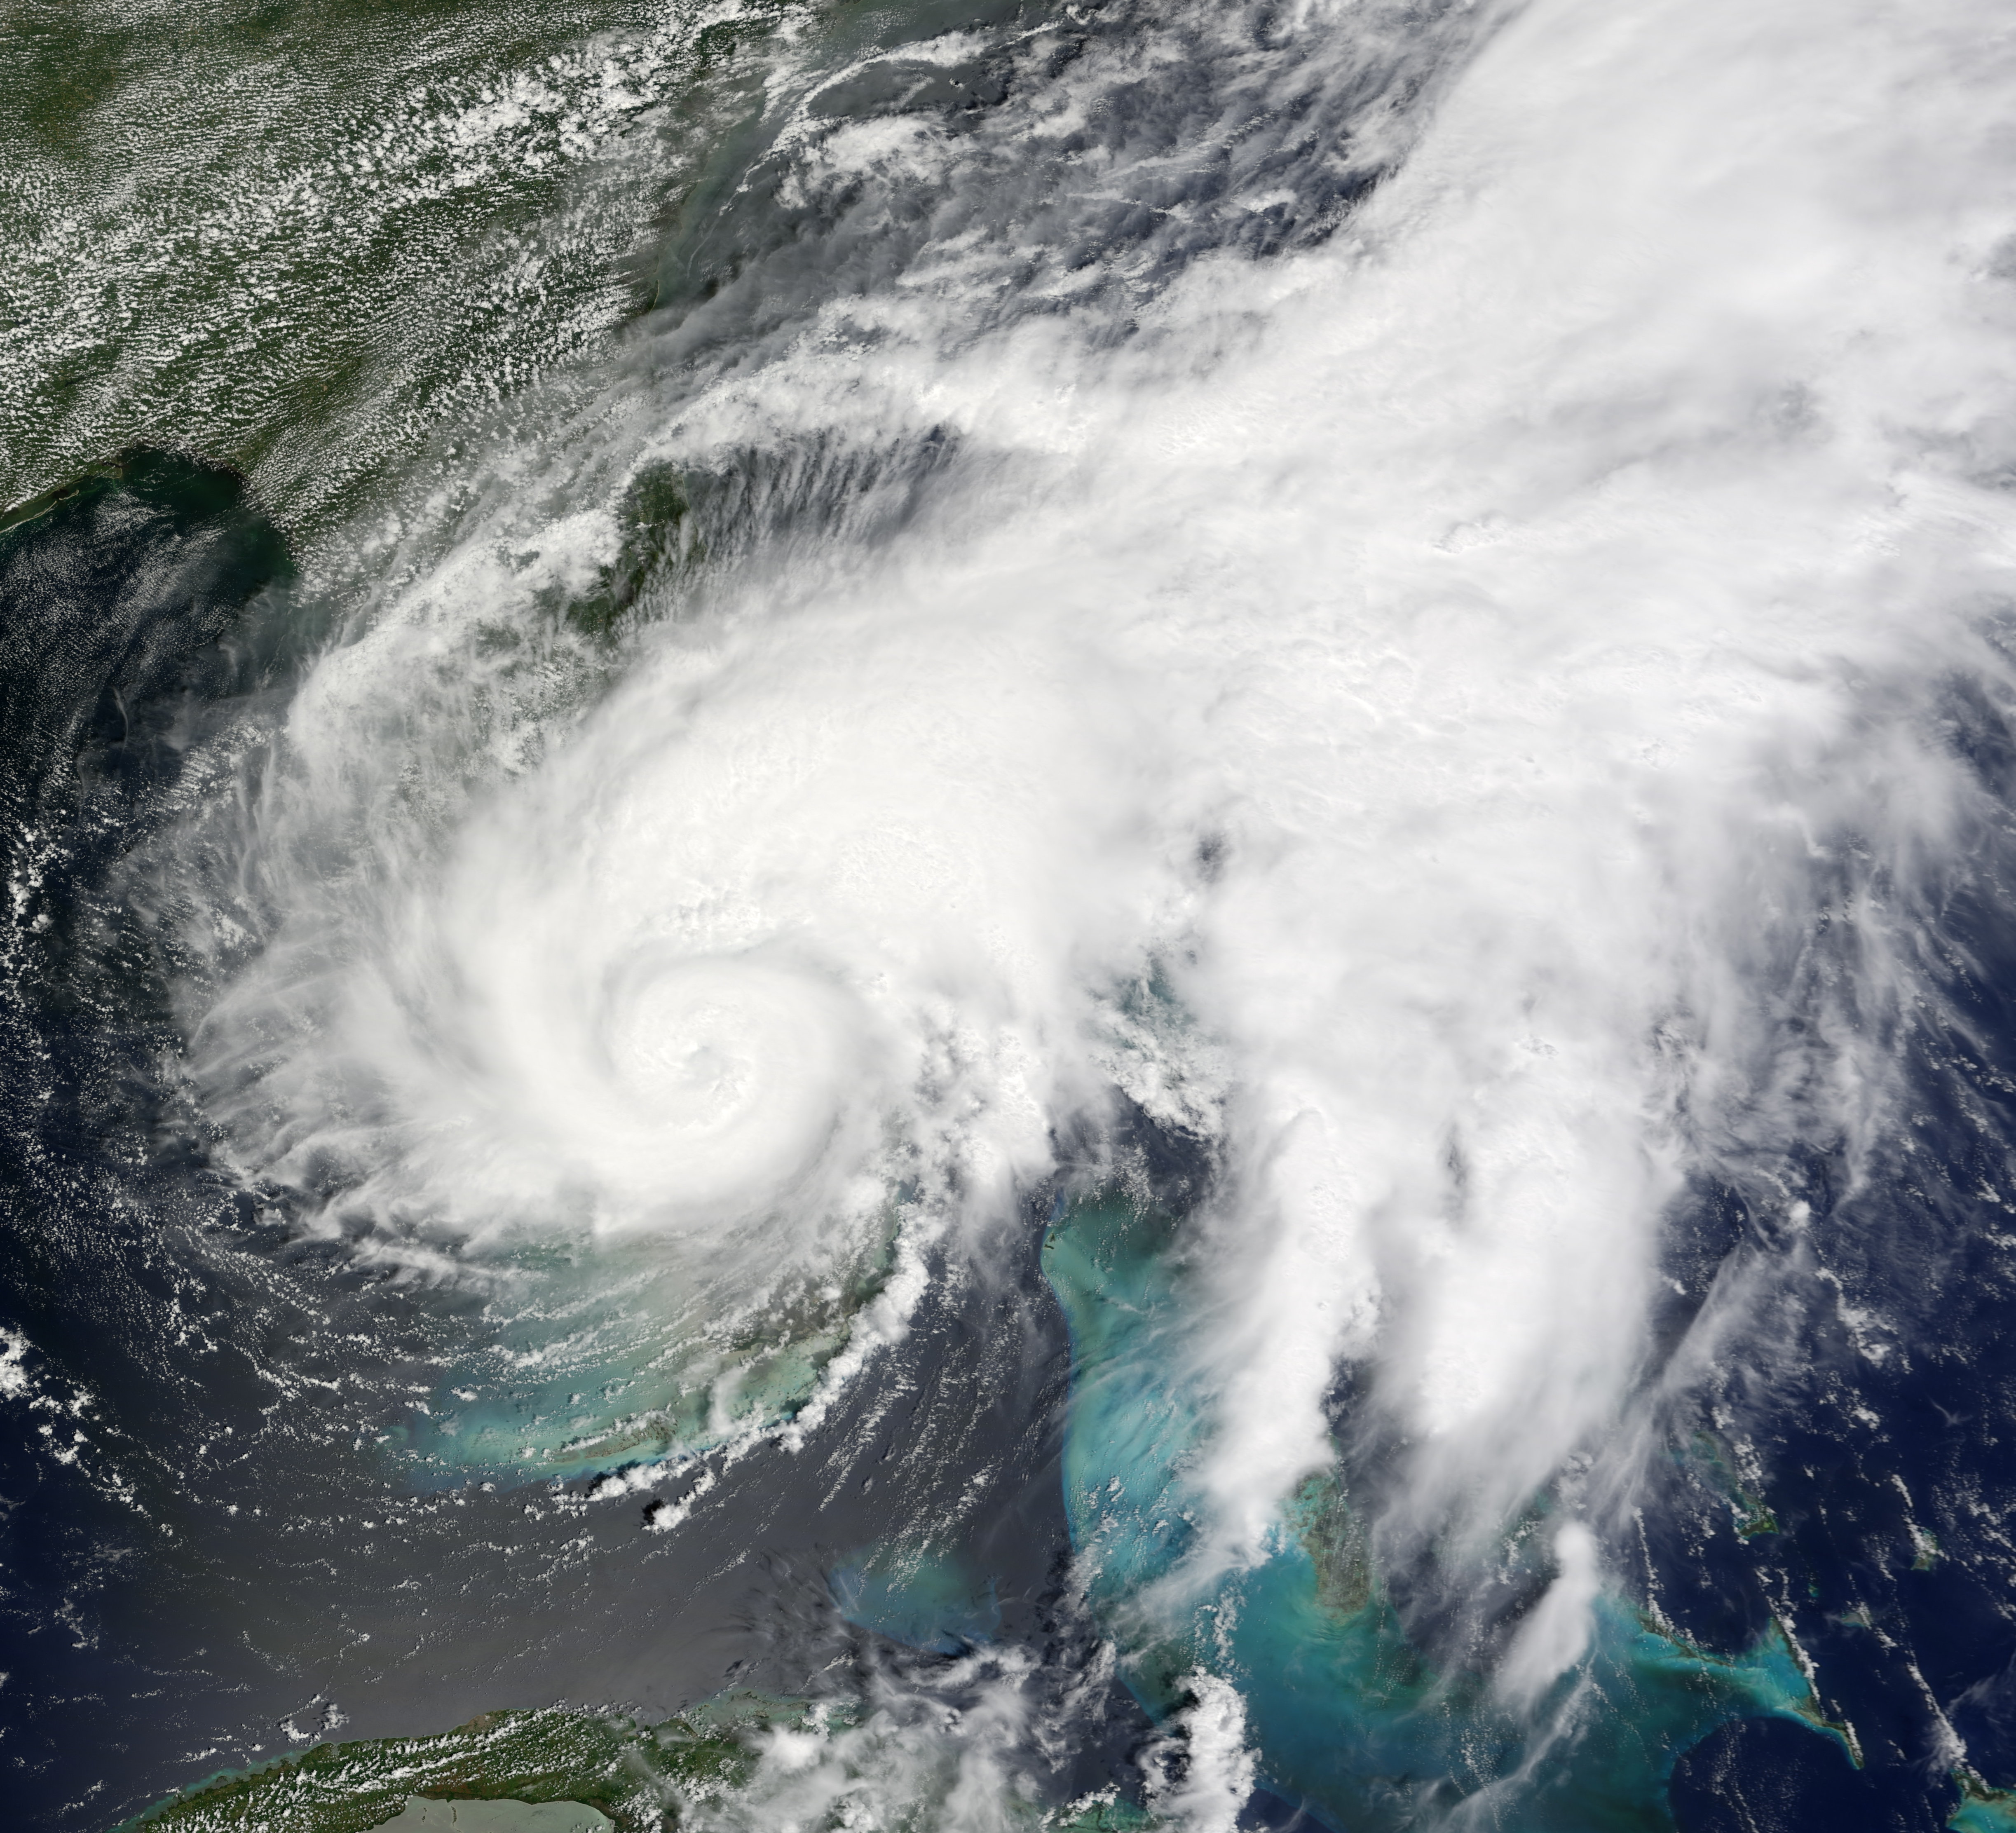
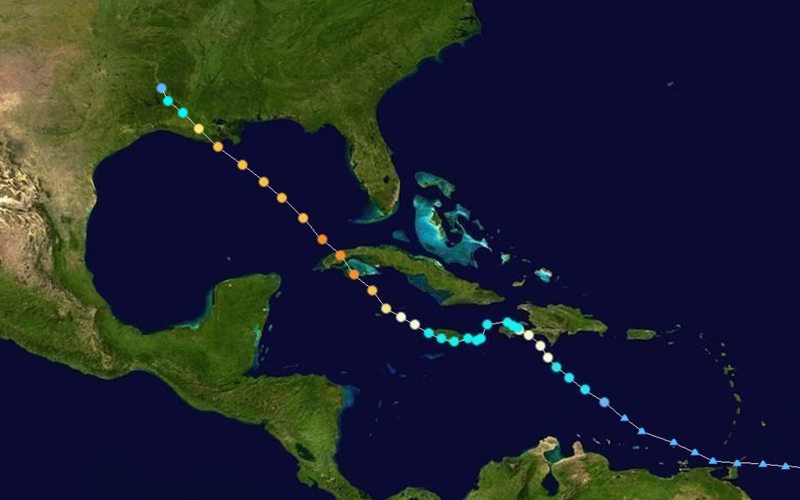
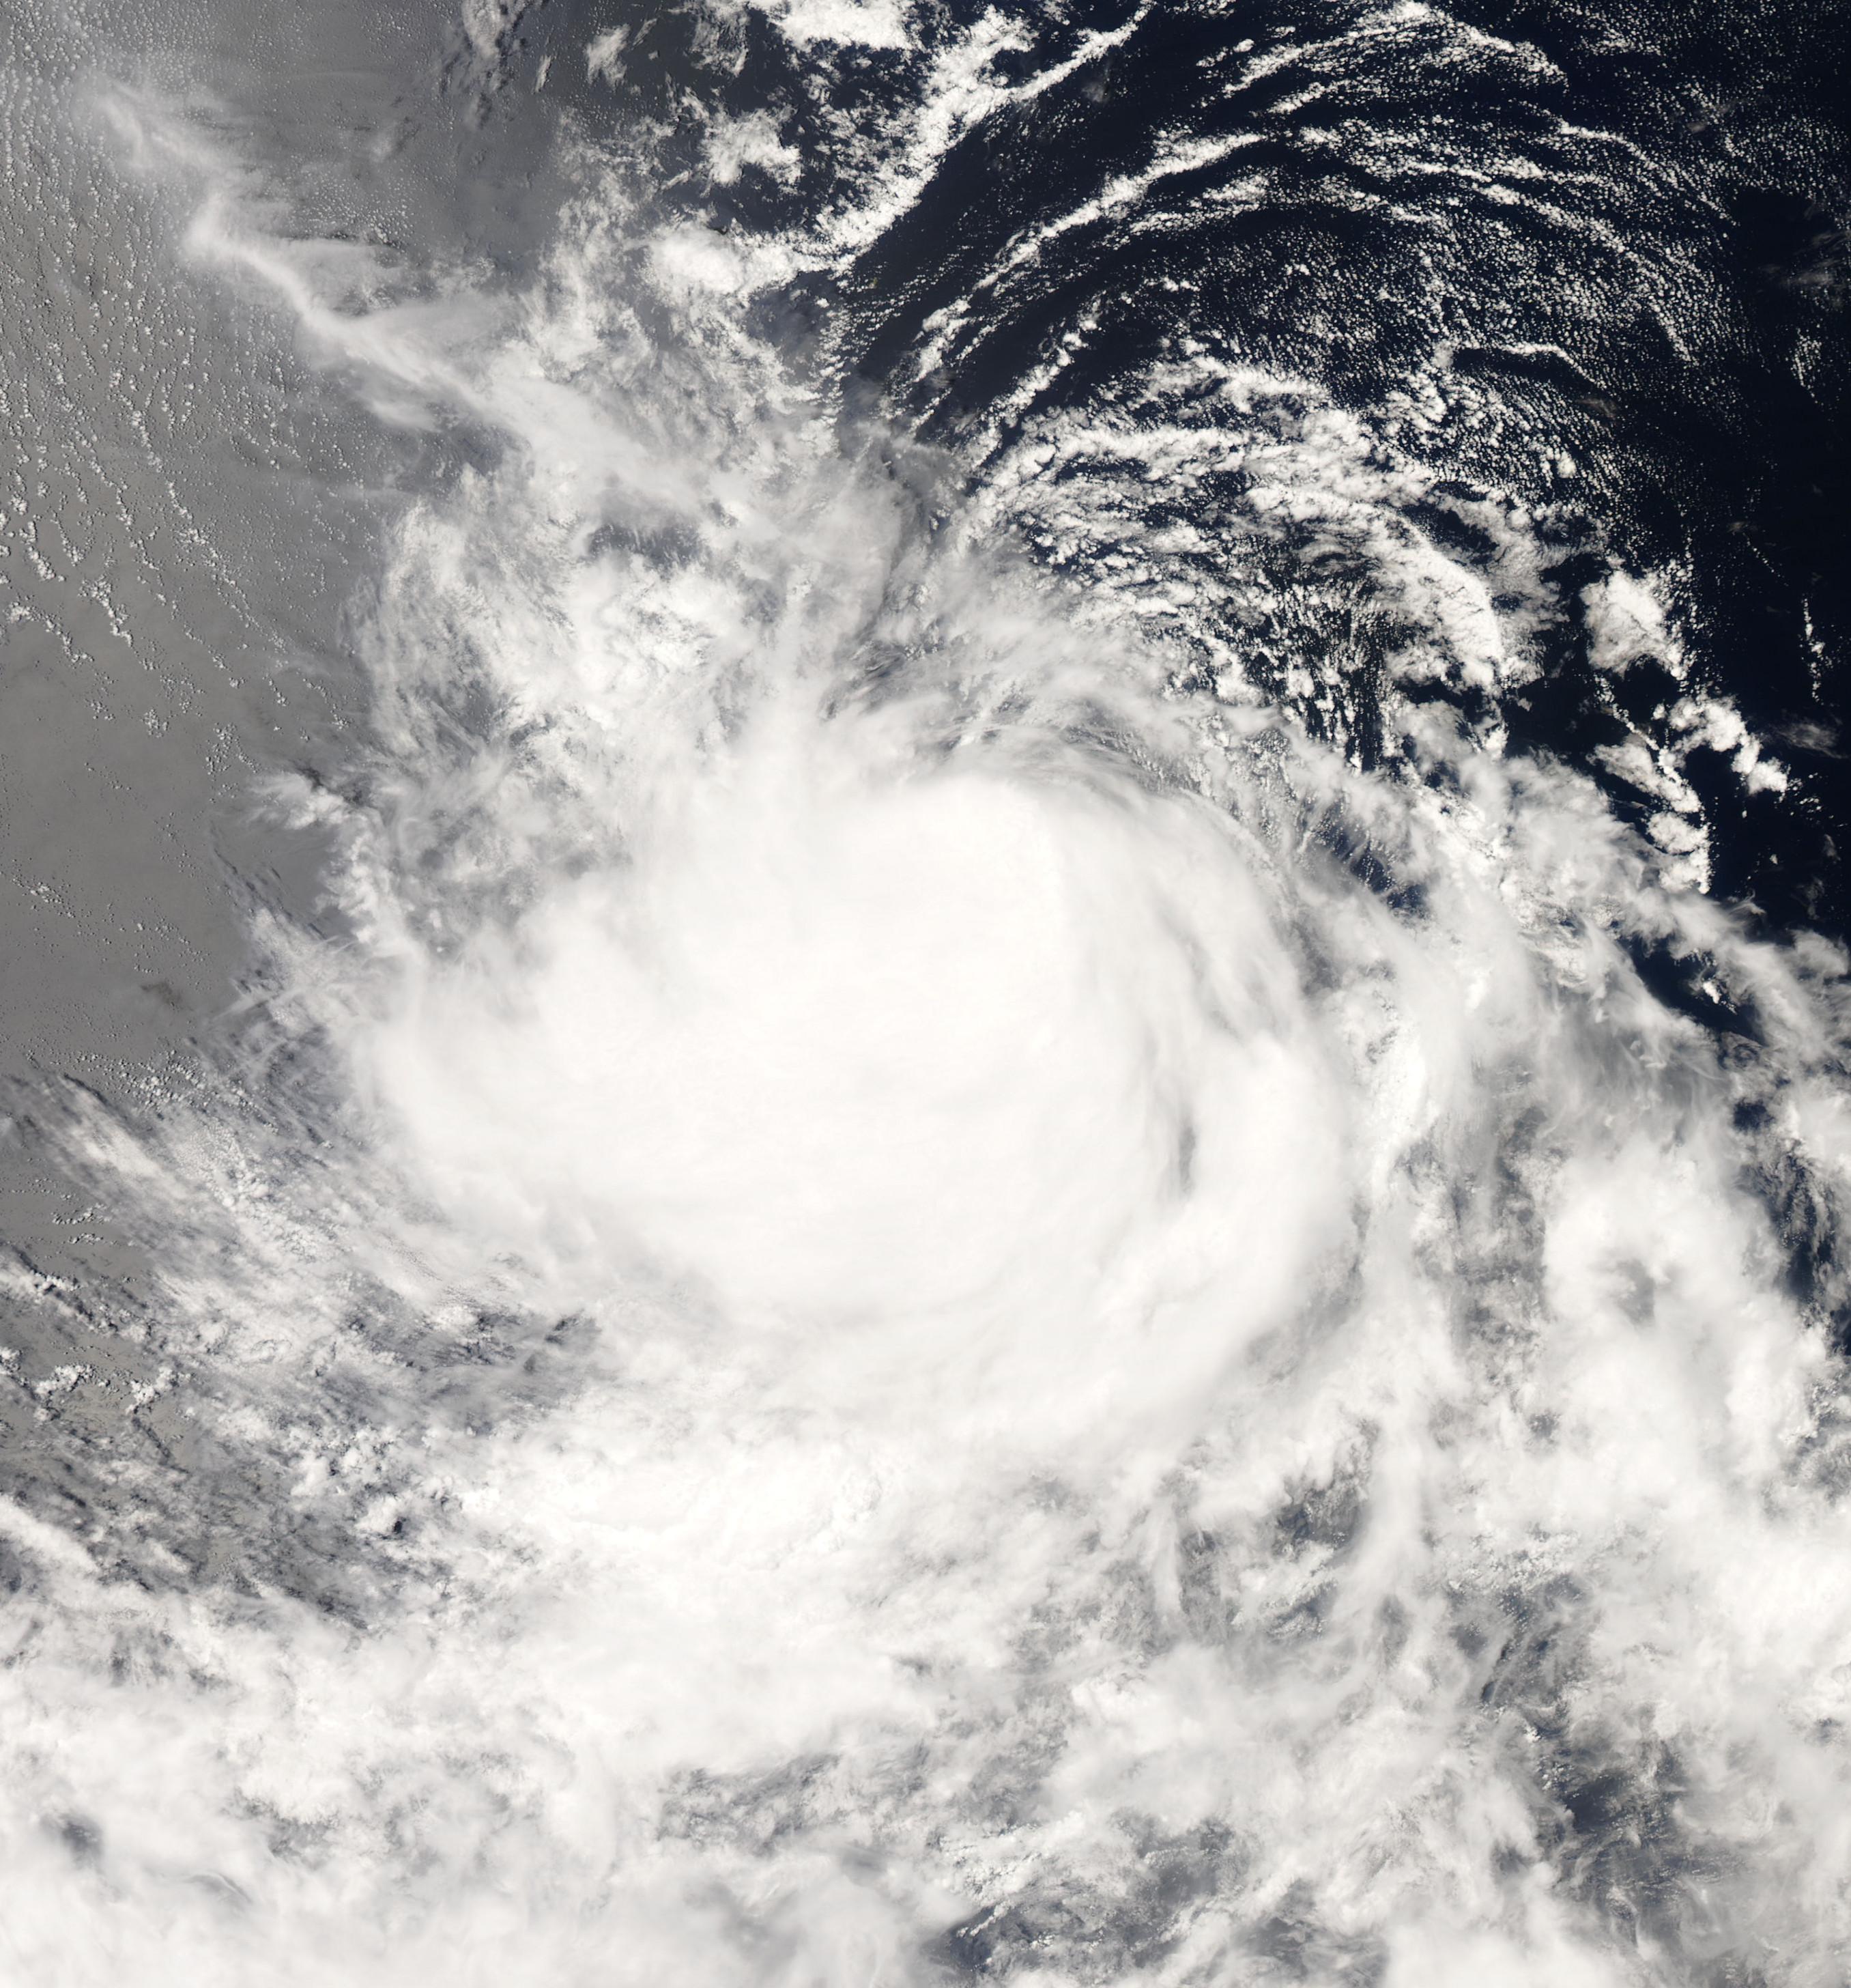
 Hurricane Gustav Satellite Image (high resolution - 6.7 MB) |
 Hurricane Gustav Track Saffir-Simpson Scale Color Legend |
Near the end of August, a tropical disturbance west of the Windward Islands strengthened into first a tropical depression, then a tropical storm on August 25. Early on the 26th, this tropical storm intensified into Hurricane Gustav and made landfall near Jacmel, Haiti later the same day. Gustav briefly weakened to a tropical storm after making landfall and slowed considerably. The storm strengthened again to hurricane strength on August 29 and intensified to Category 4 strength later that afternoon. Hurricane Gustav made landfall on Cuba first on Isla de la Juventude and later near Los Palacios and continued moving northwestward toward the Gulf of Mexico. The hurricane continued this path across the Gulf of Mexico and made landfall near Grand Isle, Louisiana on the morning of September 1. Over 100 deaths in the U.S. and the Caribbean, mostly in Haiti, were attributed to Hurricane Gustav. Gustav had maximum sustained winds of 240 km/hr (130 knots or 150 mph) and a minimum pressure of 941 mb. More information on Gustav is available from the NOAA National Hurricane Center. | |
Pacific Basin
 Tropical Storm Julio Satellite Image (high resolution) |
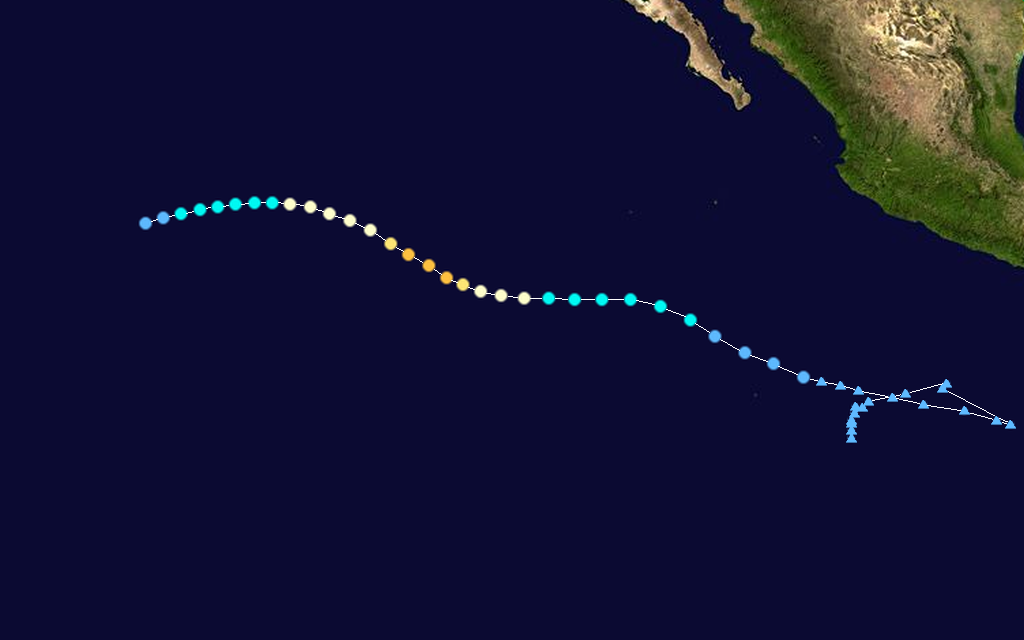
 Tropical Storm Julio Track Saffir-Simpson Scale Color Legend |
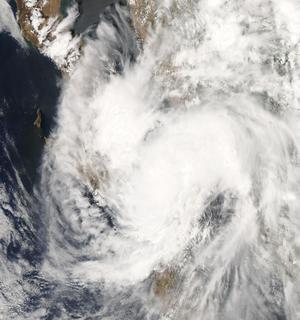
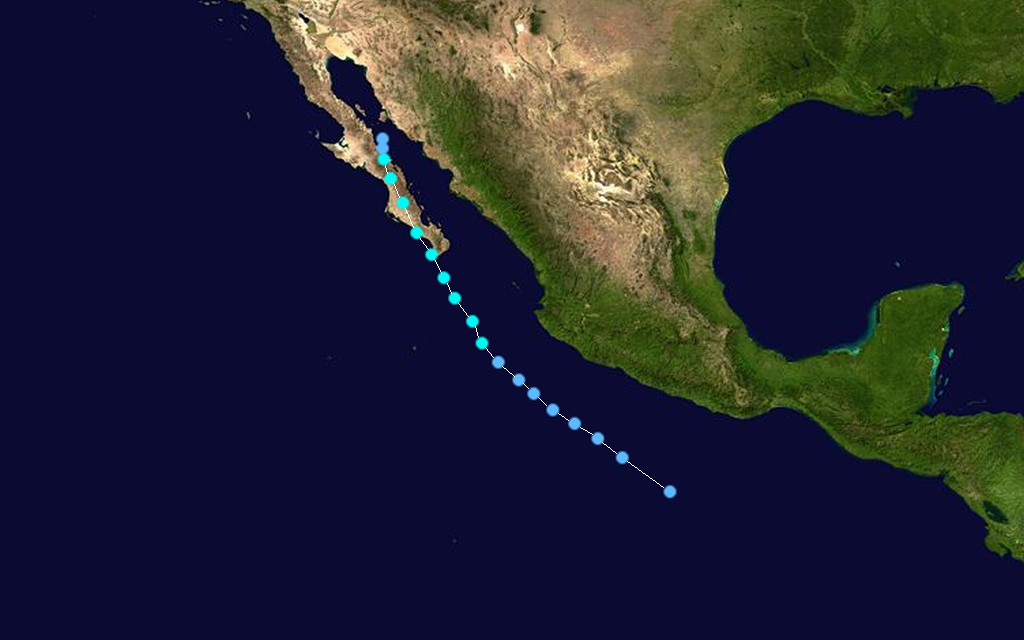
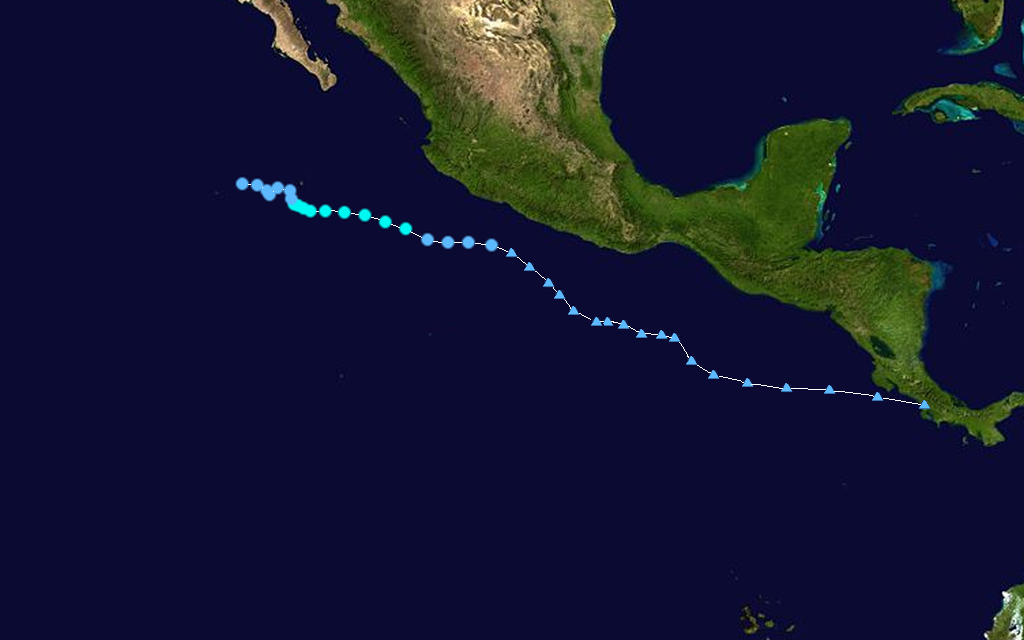
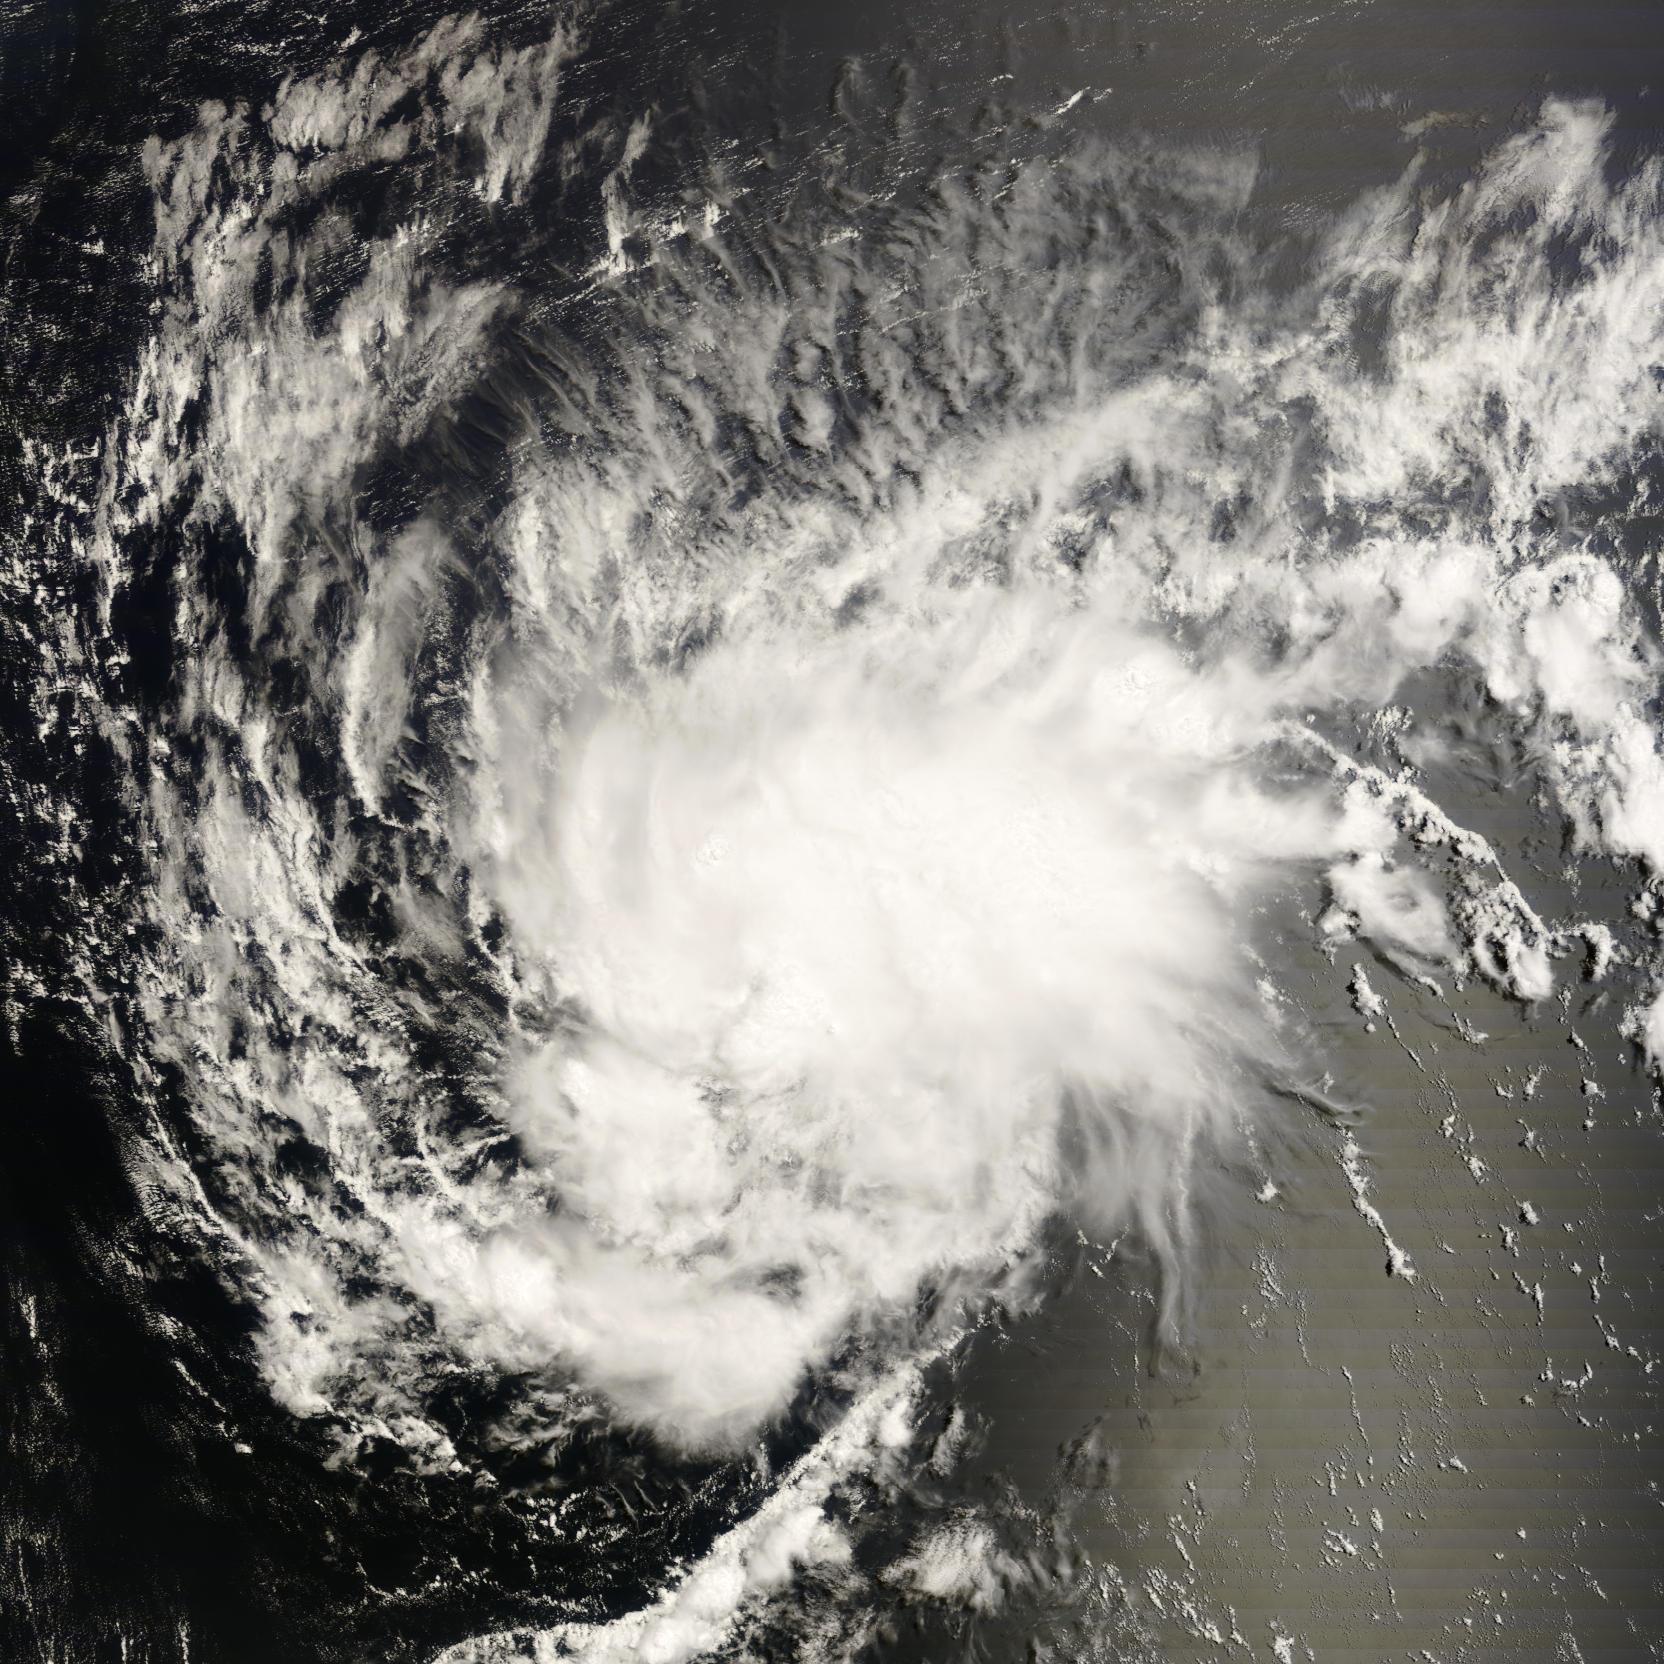
Julio developed from a tropical wave off the coast of Mexico on August 23 and moved northwestward parallel to the coast. Its peak winds reached 85 km/h (50 mph or 43 knots) and its maximum central pressure reached 998 mbar (29.47 inches). On August 24, Julio made landfall in the southern tip of Baja California and quickly weakened, but not before producing heavy rainfall which resulted in locally heavy flooding thus killing two people. More information on Tropical Storm Julio is available from the NOAA National Hurricane Center. | |
 Tropical Storm Iselle Satellite Image (high resolution) |
 Tropical Storm Iselle Track Saffir-Simpson Scale Color Legend |
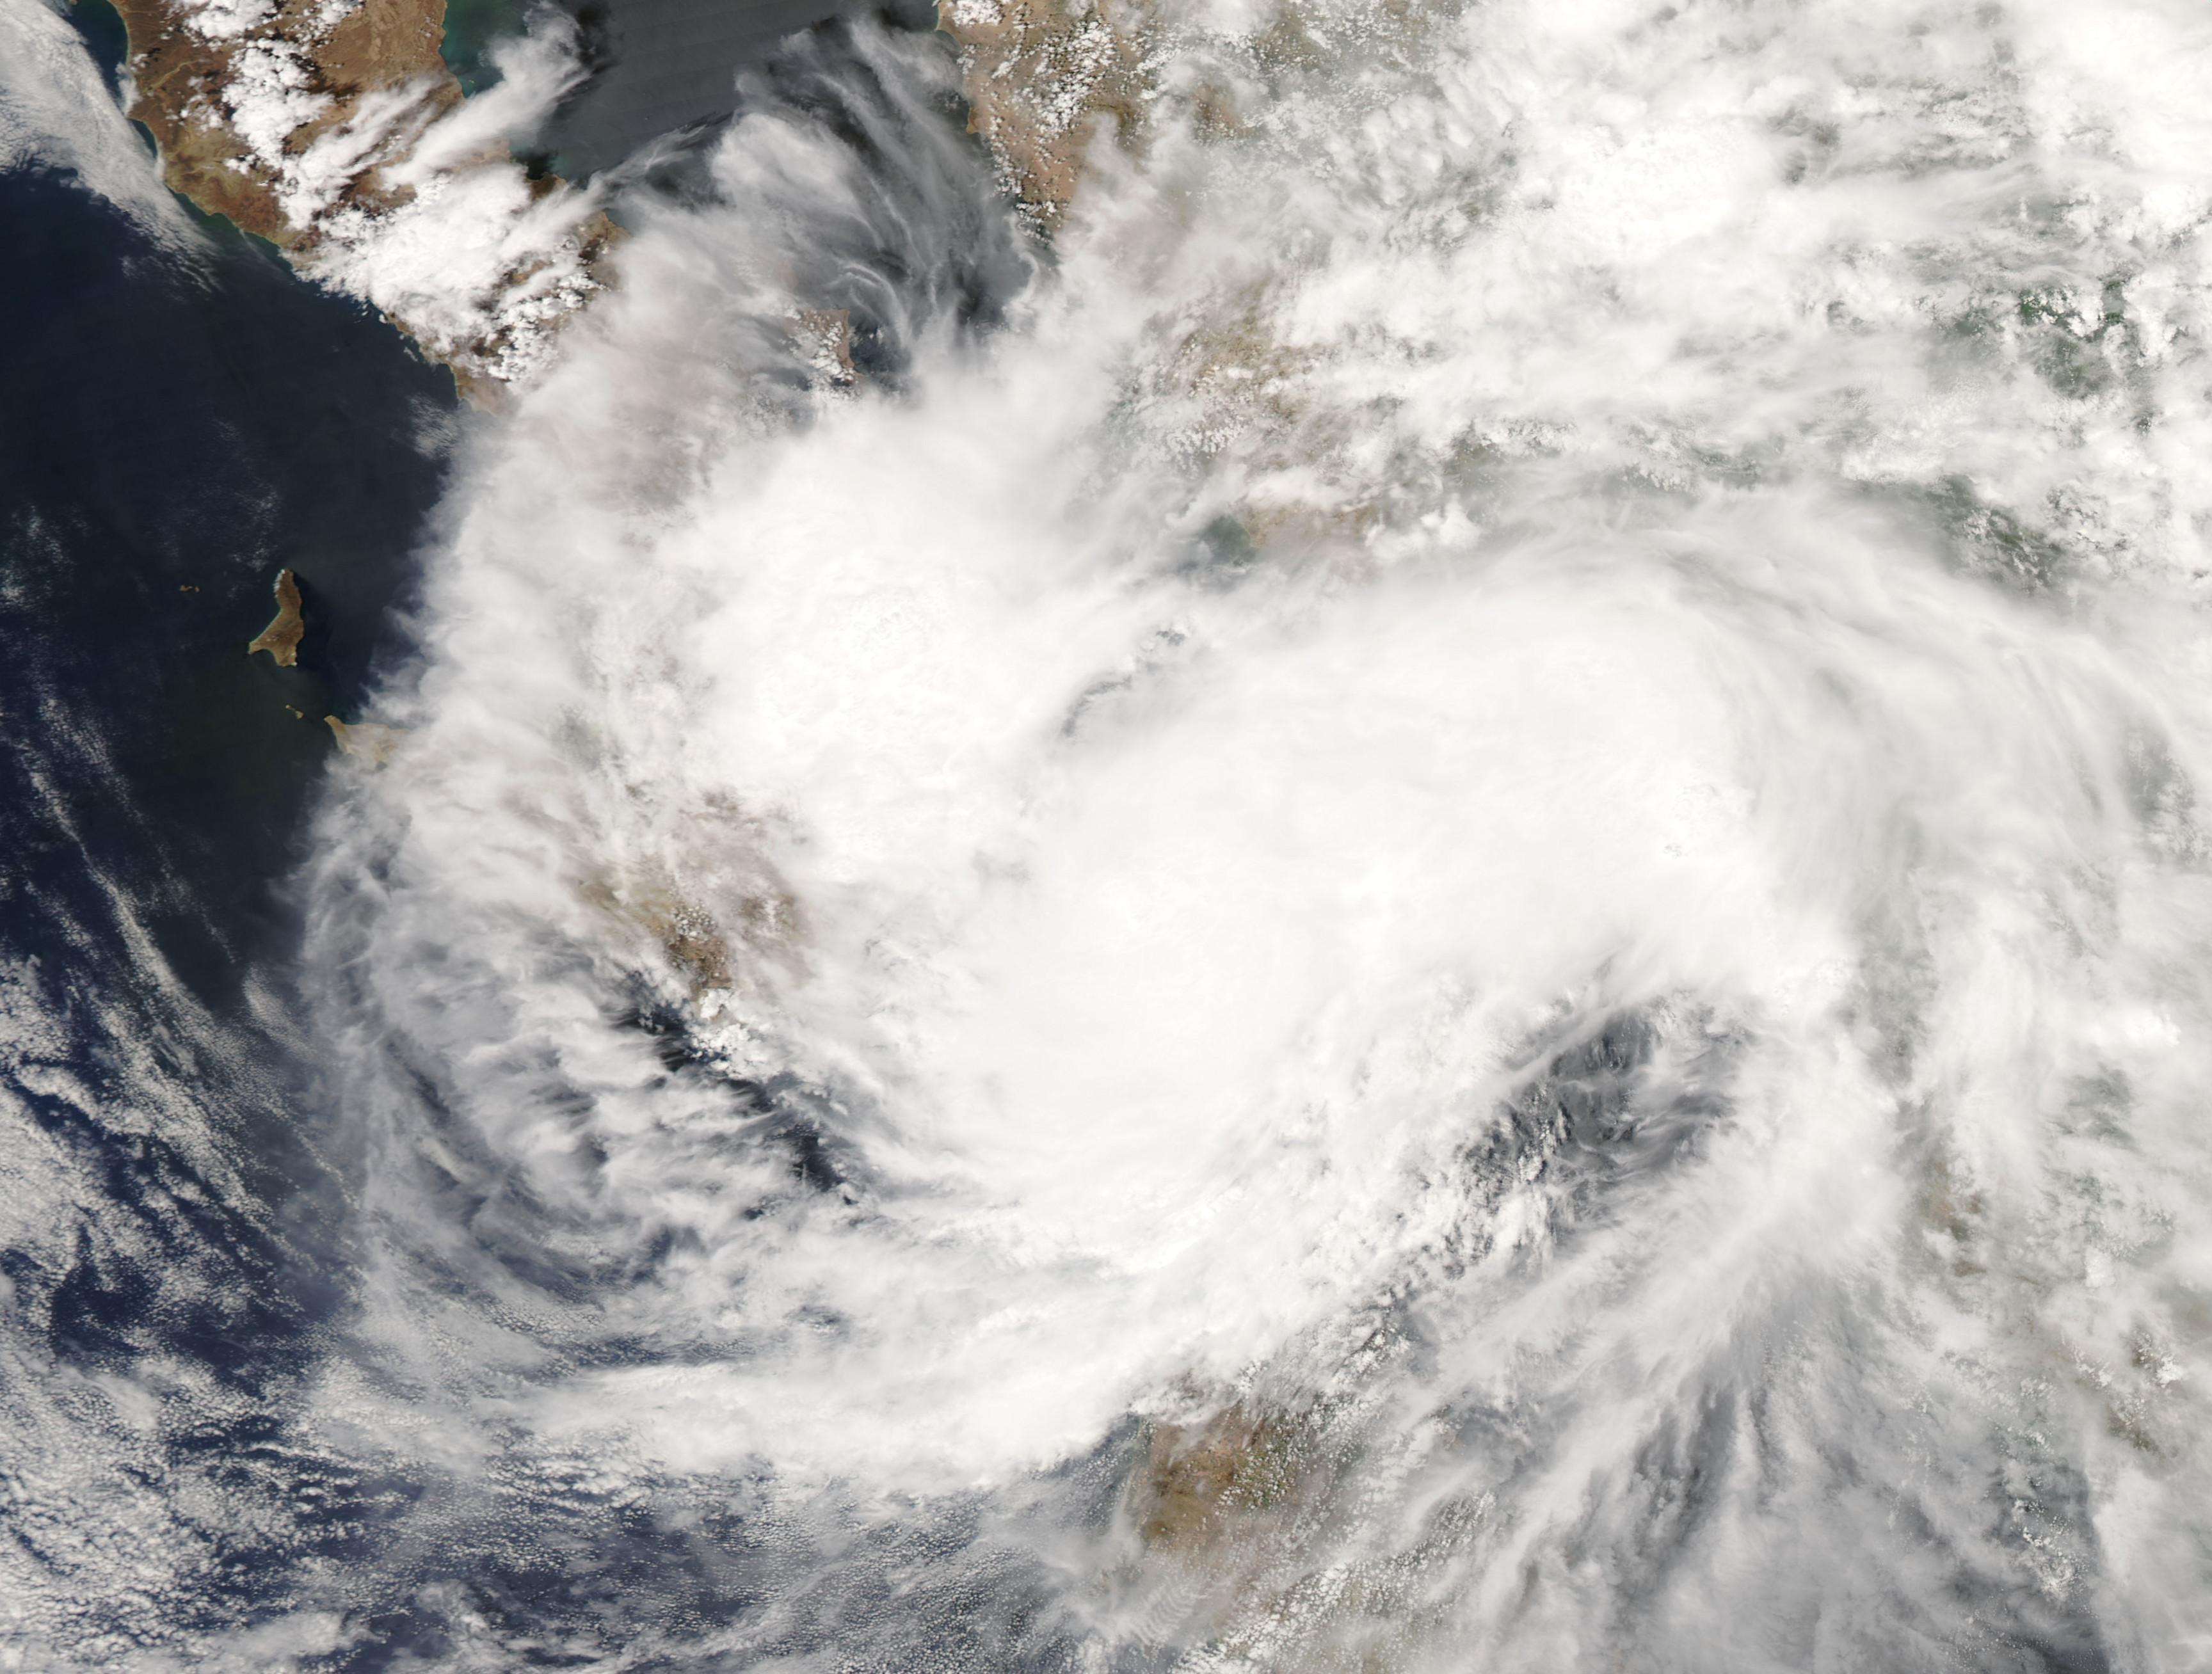
Tropical Storm Iselle developed from a disturbance southwest of Mexico on August 13. As the storm moved to the west-northwest its maximum winds reached 65 km/h (40 mph or 35 knots) and its maximum central pressure reached 999 mbar (29.50 inches). Upper-level conditions were not favorable for development and dissipated on August 16. More information on Tropical Storm Iselle is available from the NOAA National Hurricane Center. | |
 Tropical Kika Satellite Image (high resolution) |
 Tropical Storm Kika Track Saffir-Simpson Scale Color Legend |
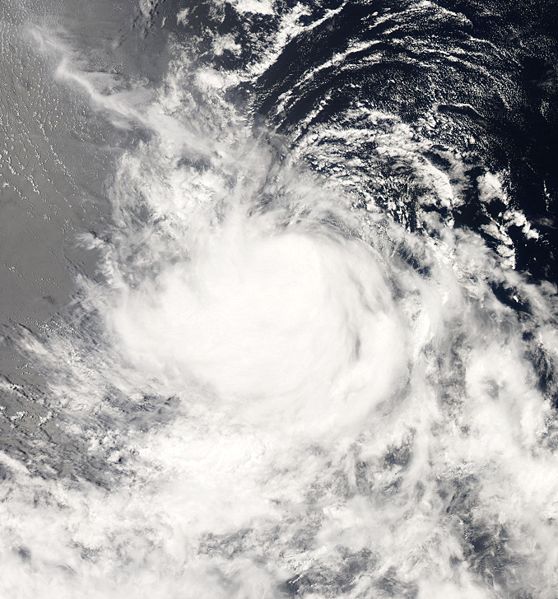
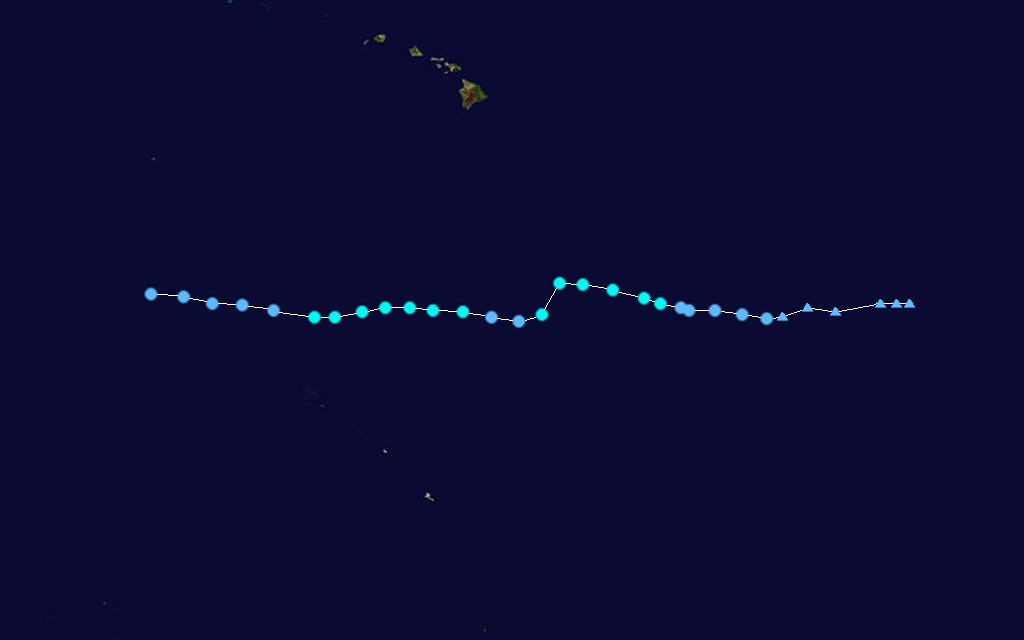
Tropical Storm Kika formed from a disturbance southeast of Hawaii on August 6. Kika moved westward and its peak winds reached 65 km/h (40 mph or 35 knots). On August 8, Kika was downgraded to a tropical depression, but it reintensified to a tropical storm the next day. Maximum central pressure reached 1007 mbar (29.74 inches). The storm was downgraded to a remnant low on August 12, More information on Hurricane Kika is available from the NOAA National Hurricane Center. | |
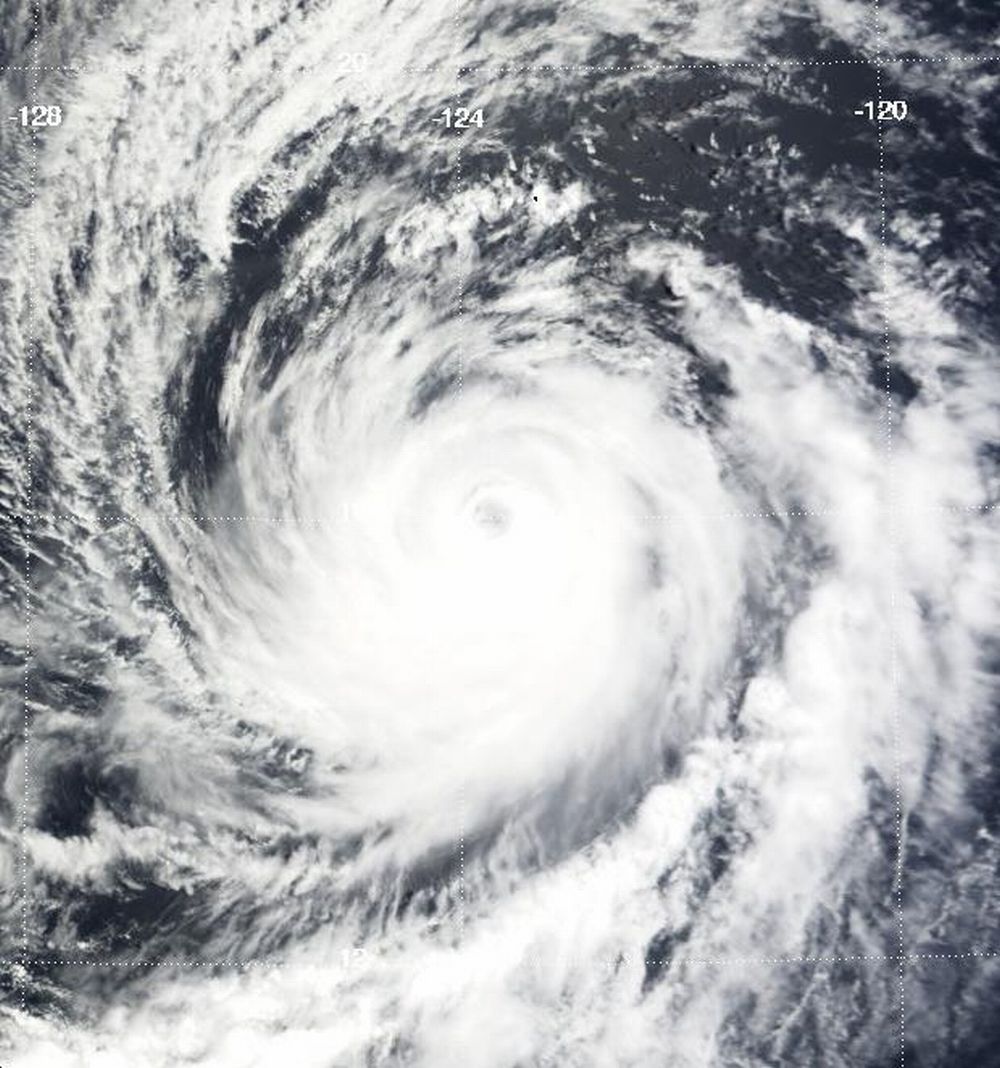
 Hurricane Hernan Satellite Image (high resolution) |
 Hurricane Hernan Track Saffir-Simpson Scale Color Legend |
Hernan formed from a low pressure area southwest of Mexico on August 6 and quickly strengthened into a tropical storm. Hurricane Hernan became the first major hurricane of 2008 in the Pacific Ocean on August 9 when its max winds reached 194 km/h (121 mph or 105 knots). After reaching a maximum central pressure of 956 mbar (28.23 inches), Hernan dissapated over the open waters and the National Hurricane Center issued the final advisory for Hernan on August 12. More information on Hurricane Hernan is available from the NOAA National Hurricane Center. | |