Summary
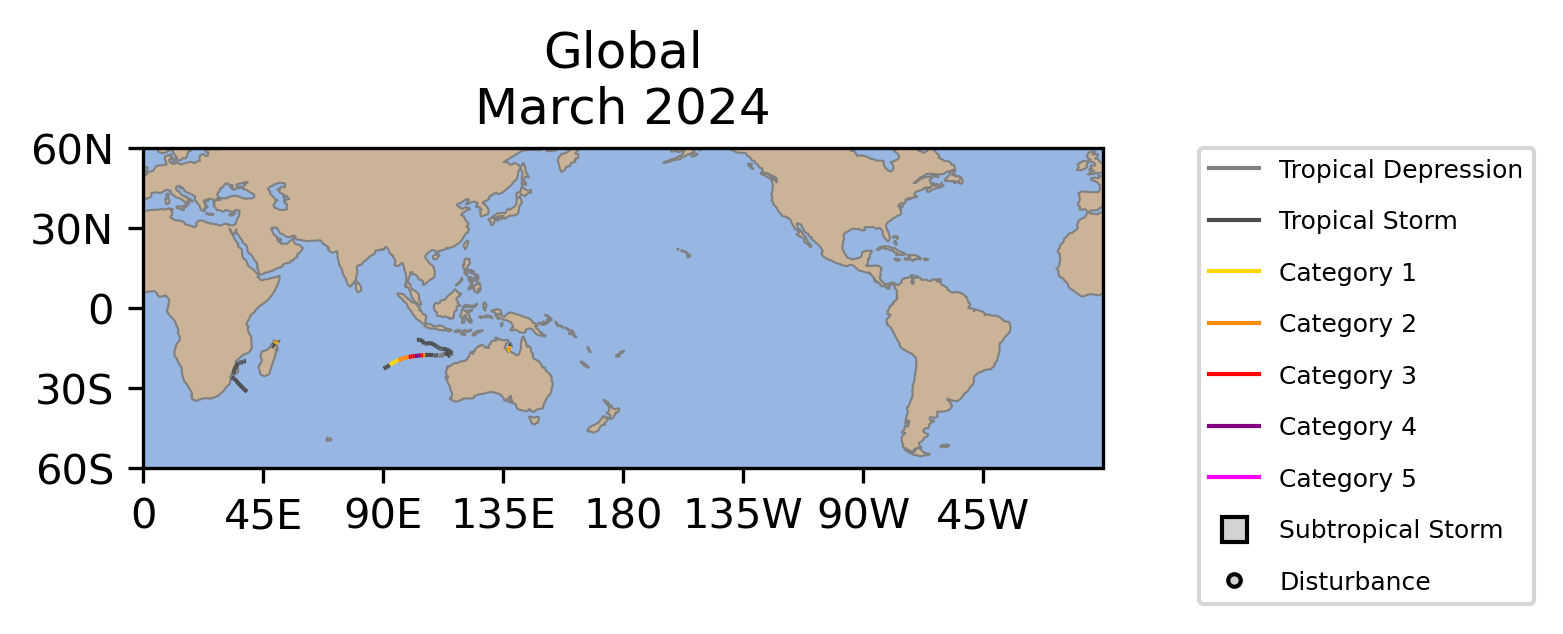
Four named storms occurred across the globe in March, which was below the 1991-2020 average of six. Three of those reached tropical cyclone strength (≥74 mph), and one reached major tropical cyclone strength (≥111 mph). The global accumulated cyclone energy (ACE: an integrated metric of the strength, frequency, and duration of tropical storms) was about 50% of the 1991-2020 average for March.
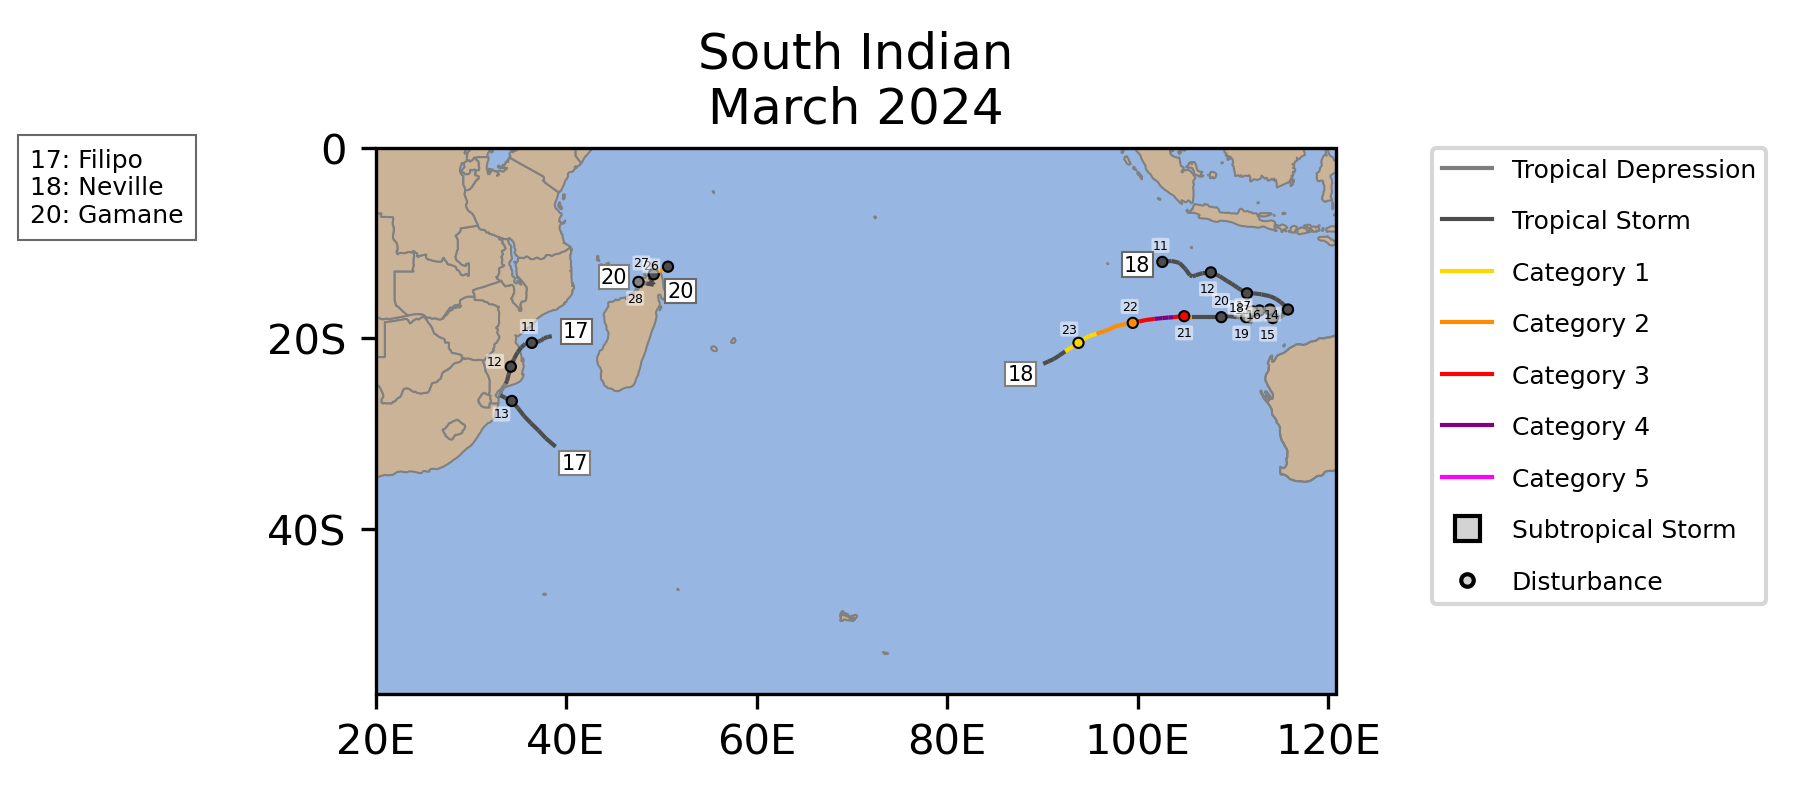
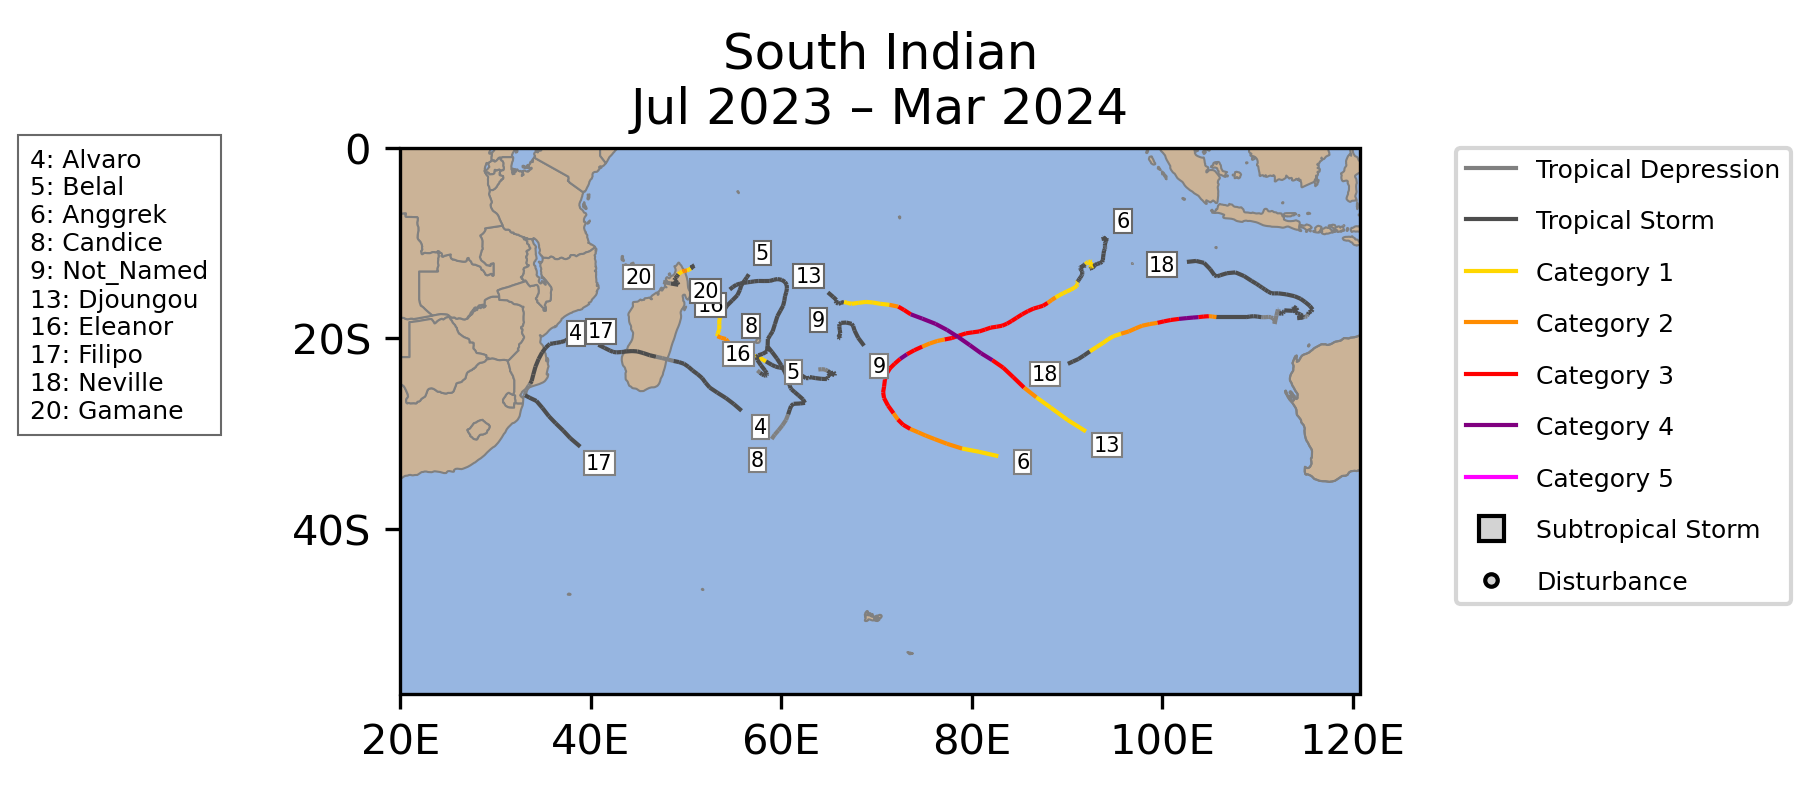
The only major tropical cyclone was Severe Tropical Cyclone Neville in the South Indian Ocean. On average, a major tropical cyclone occurs in the South Indian Ocean eight in every ten Marches. Neville peaked with maximum sustained winds of 130 mph and a minimum central pressure of 948 mb. Neville brought high surf conditions to northwestern Australia as it remained away from land in the South Indian Ocean.
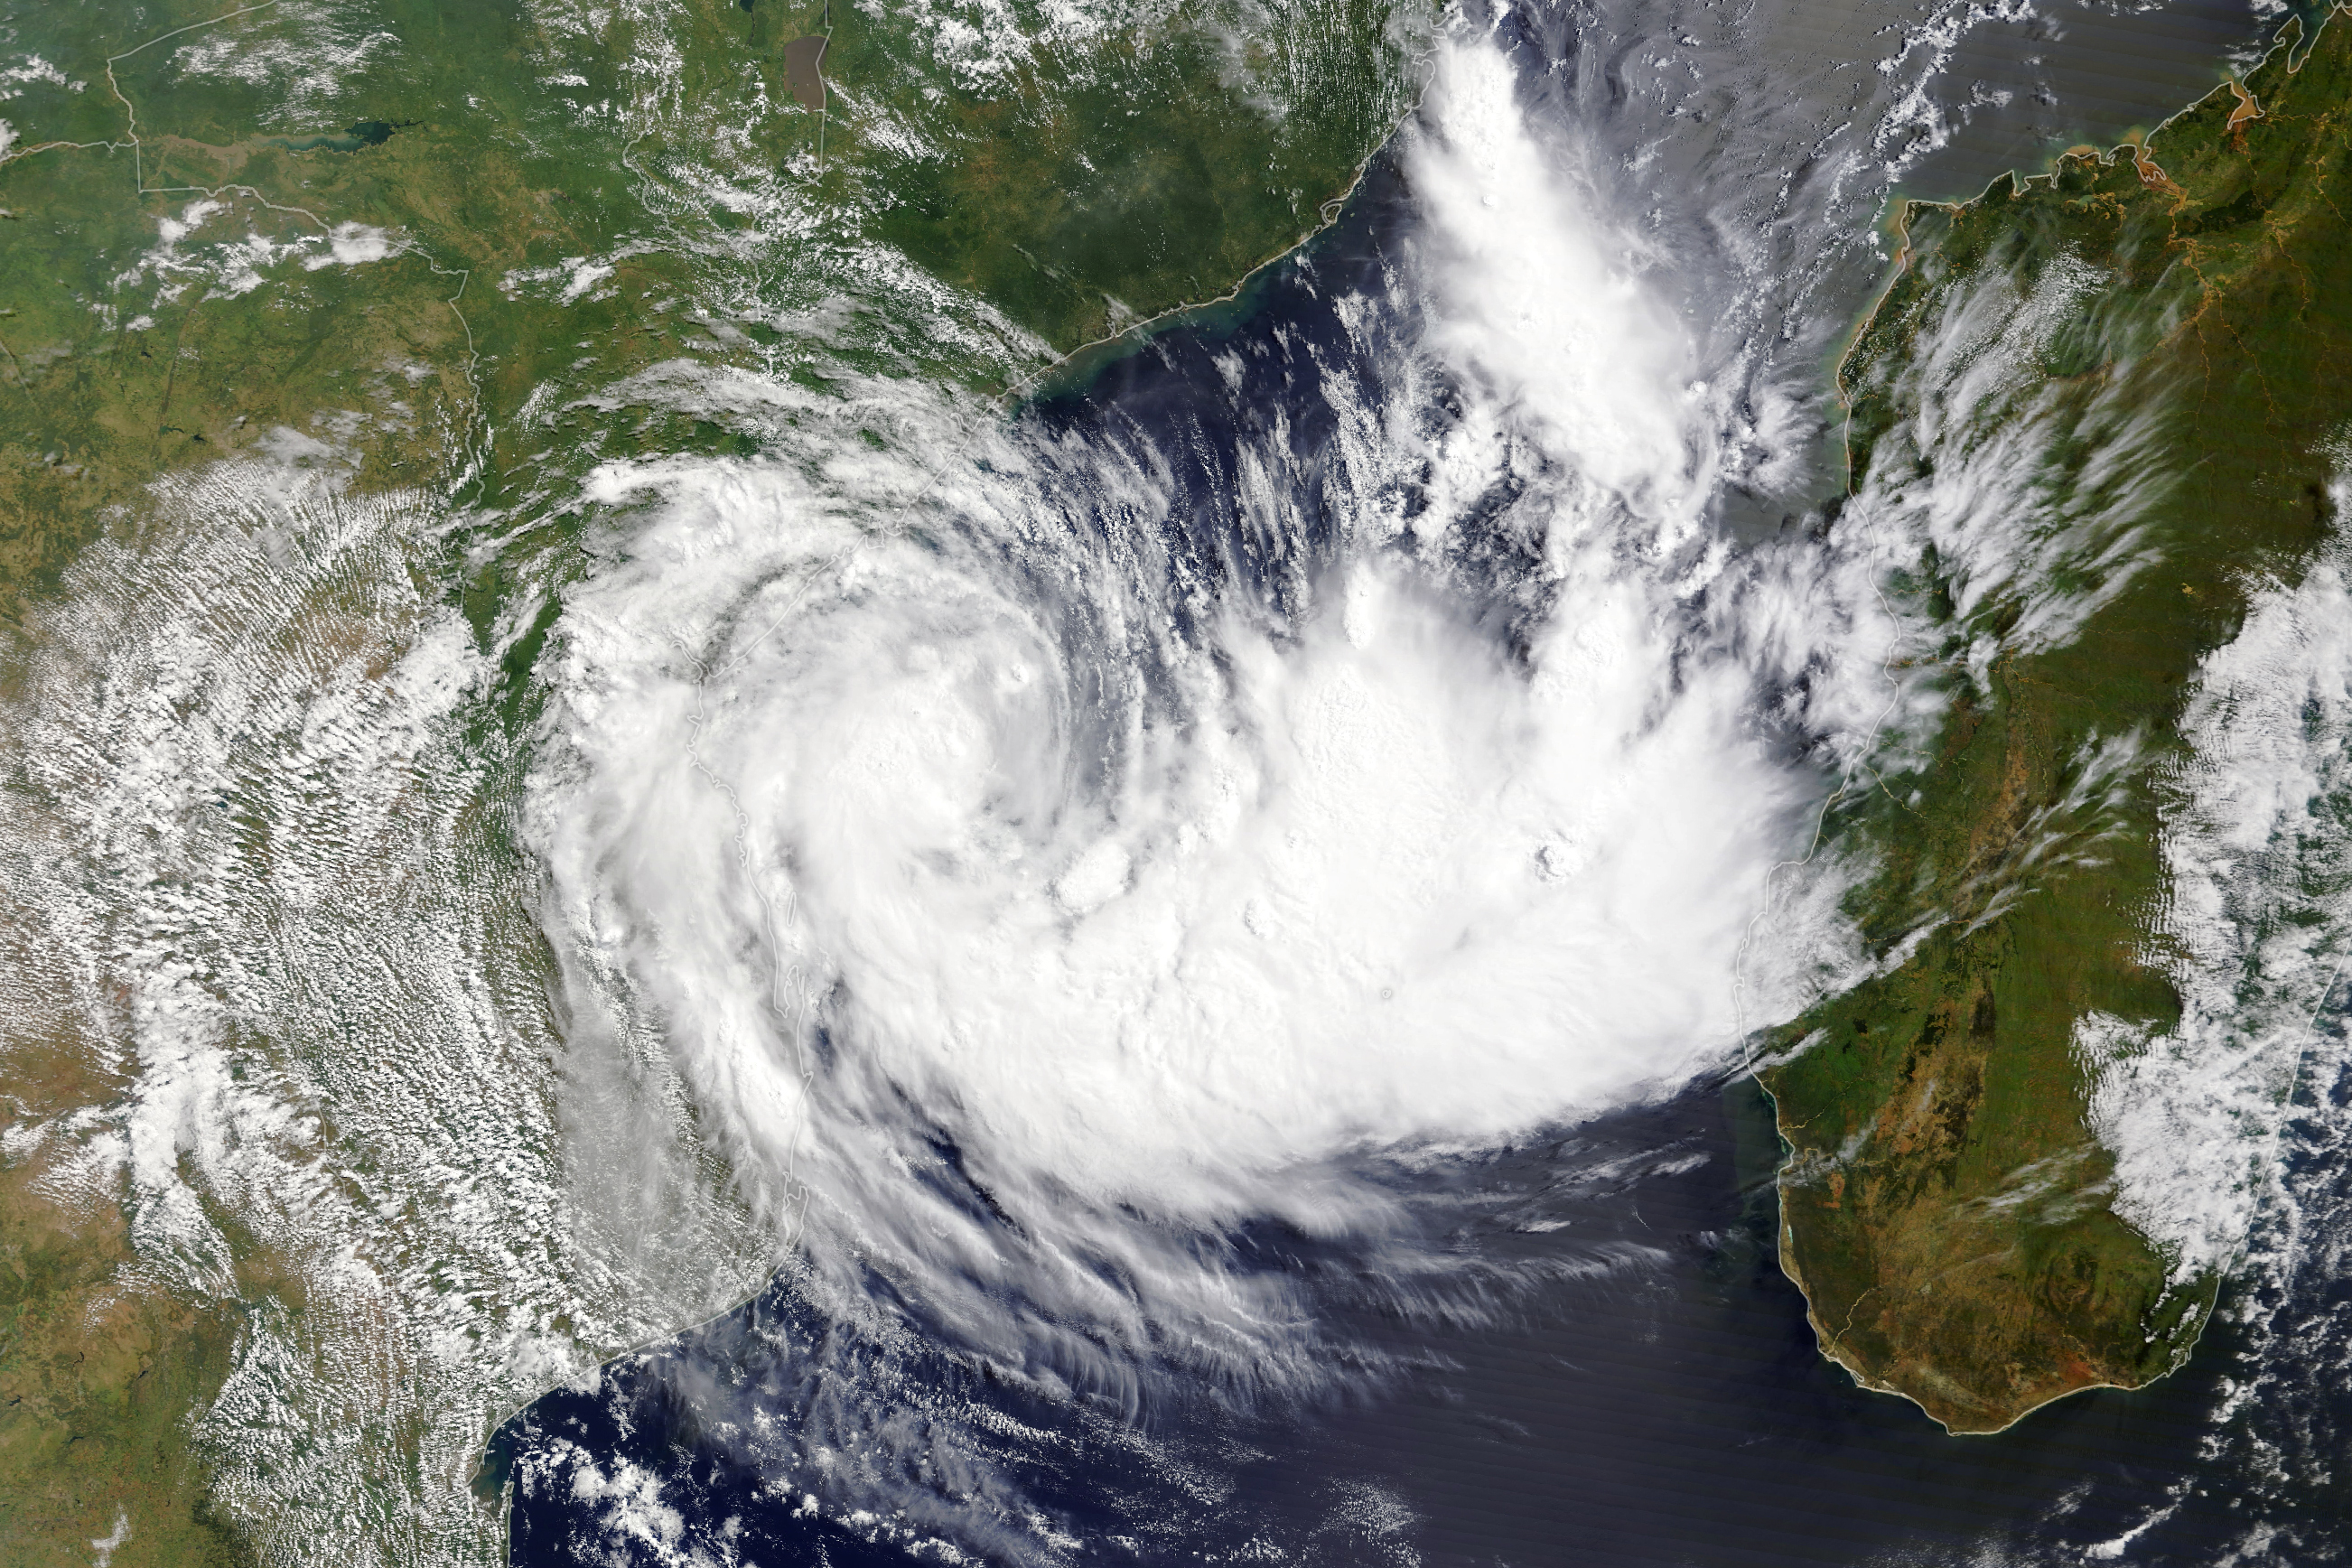
Two other storms occurred in the South Indian Ocean during March. The first was Tropical Storm Filipo, which peaked as a high end tropical storm and made landfall in Mozambique just north of the capital Maputo. Filipo brought strong winds and torrential rains across Mozambique and resulted in multiple fatalities and left thousands displaced. The other storm was Tropical Cyclone Gamane, which peaked with winds of 100 mph and a minimum central pressure of 970 mb. Gamane made landfall in Madagascar and brought strong winds and heavy rains to the island. Gamane resulted in significant destruction across northern Madagascar, causing 18 fatalities and displacing tens of thousands of people.
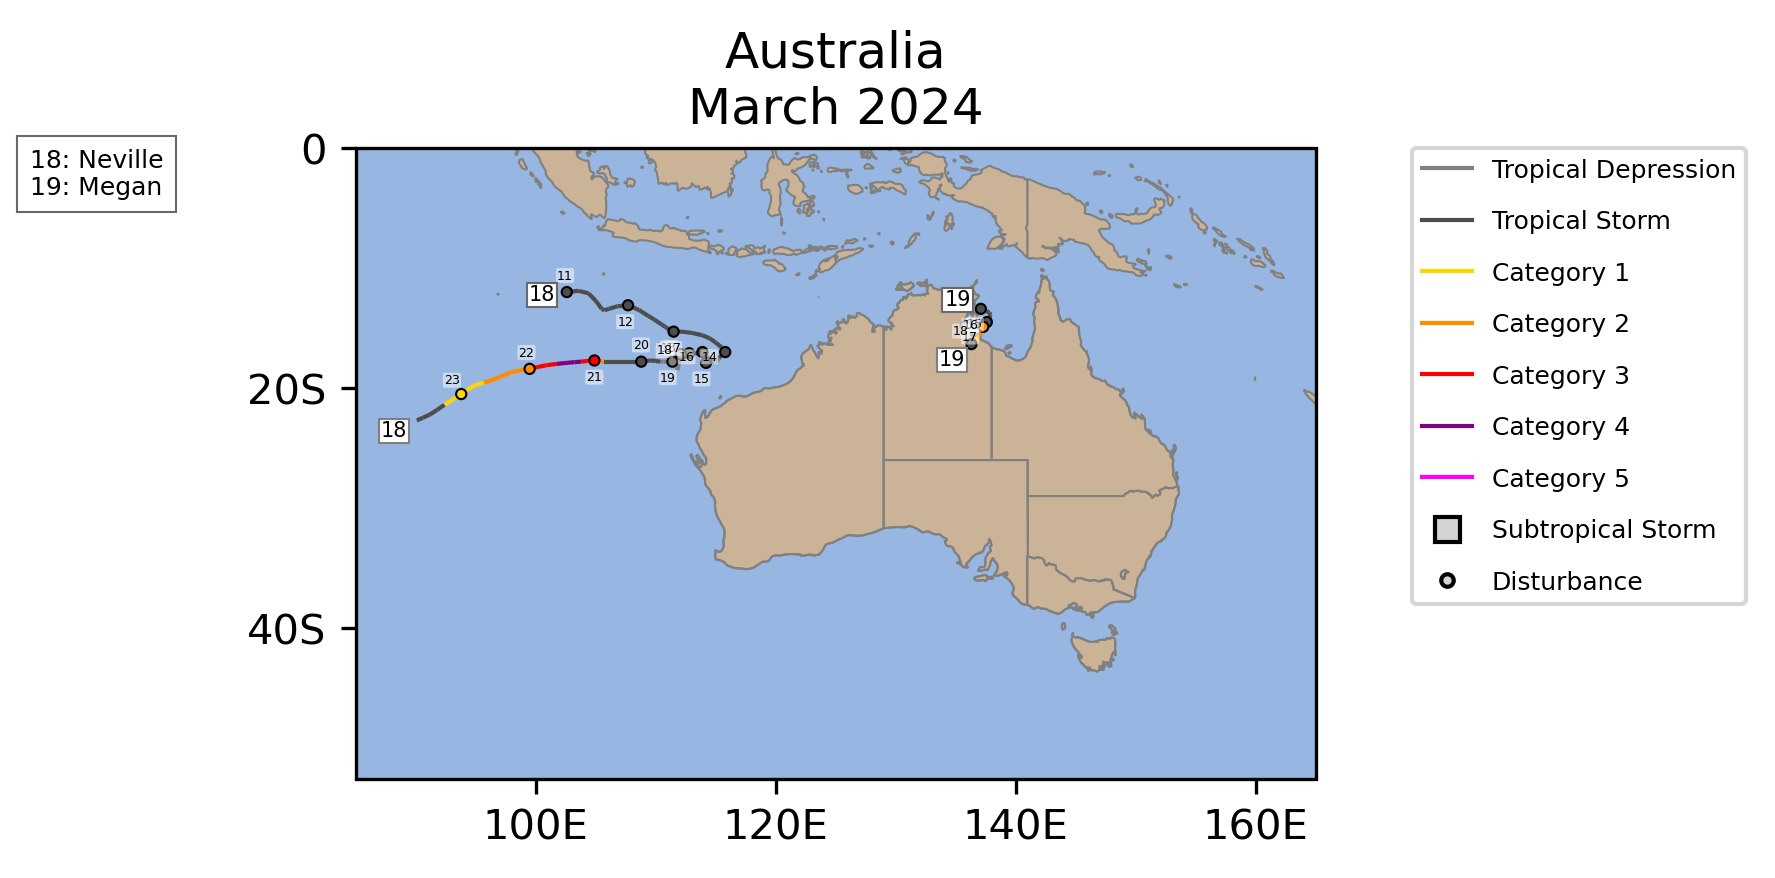
In the Australian region, aside from a close approach from Severe Tropical Cyclone Neville, the only other tropical cyclone that formed was Severe Tropical Cyclone Megan. Megan peaked with winds of 105 mph and a minimum central pressure of 957 mb. Megan formed in the Gulf of Carpentaria and tracked south until it made landfall along the coast of northern Australia. The storm brought heavy rains and strong winds to northern Australia, and resulted in some significant flooding within the communities in the region.
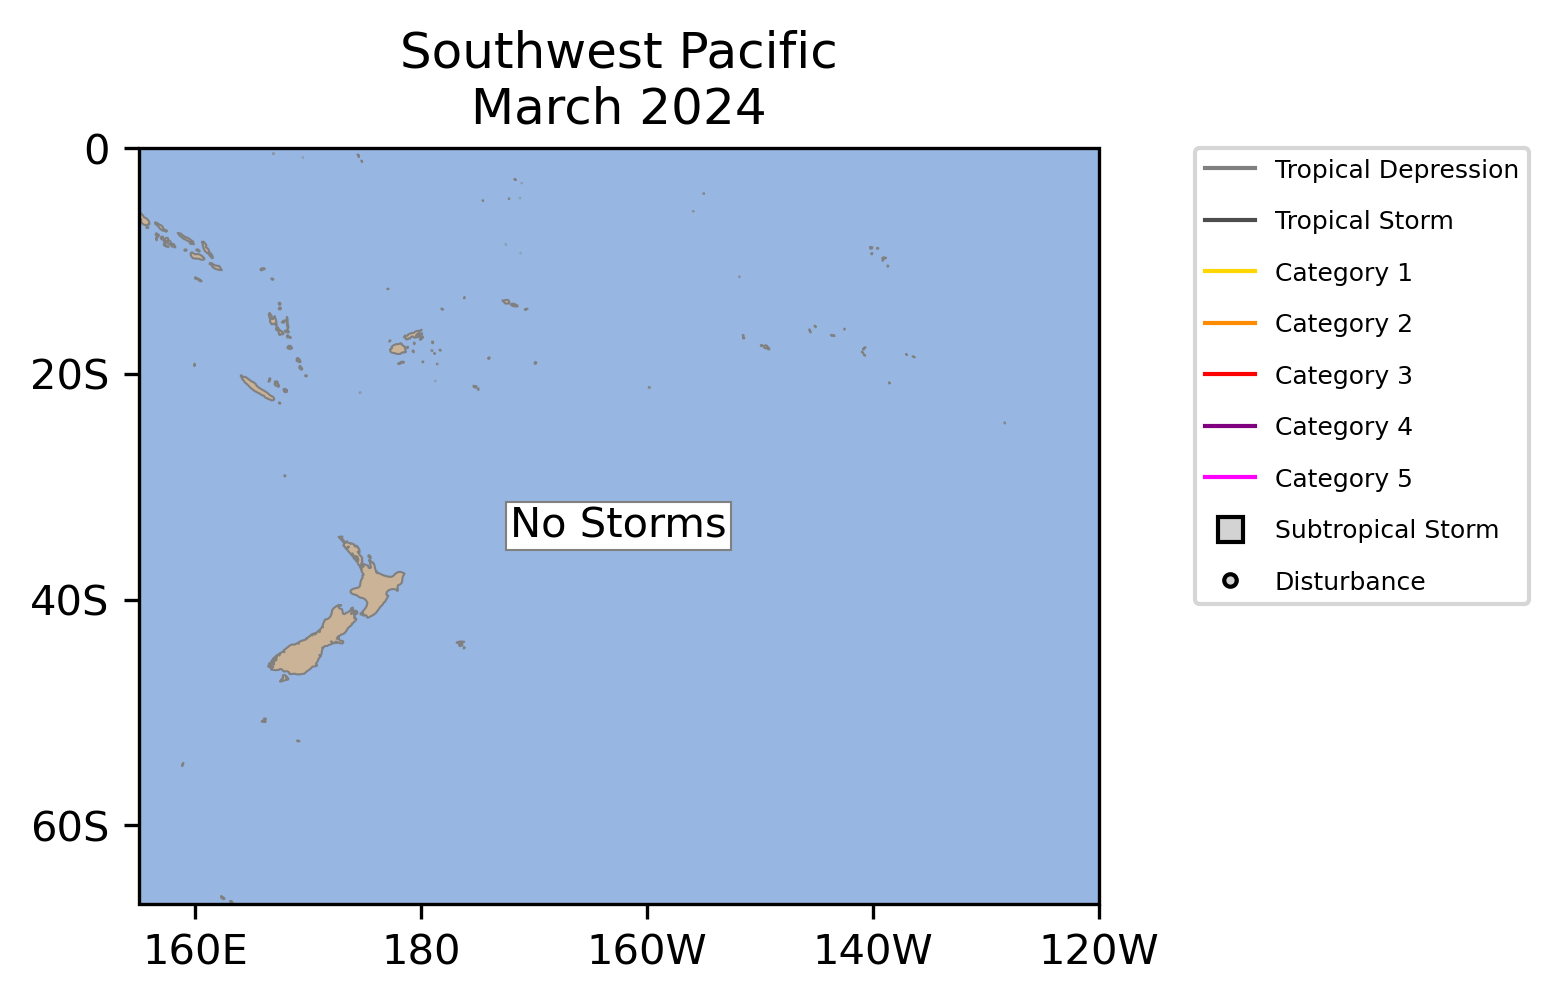
No storms formed in the southwest Pacific during March, which is tied with 6 other Marches as the least active on March record. Additionally, no storms were active in the North Atlantic, East Pacific, West Pacific, or North Indian. The lack of activity is more typical for these basins during the month of February.
North Atlantic
No North Atlantic Tropical Cyclones occurred during March 2024.
| Storm Type | Count | 1991-2020 Mean |
1981-2024 Rank* |
1851-2024 Record |
|---|---|---|---|---|
| Tropical Storm Winds ≥ 39 mph (34 kts) | 0 | 0.0 (0 in 10 Marches) | 1st (tied with 43 other Marches) | 1 (1908) |
| Hurricane Winds ≥ 74 mph (64 kts) | 0 | 0.0 (0 in 10 Marches) | 1st (tied with 43 other Marches) | 1 (1908) |
| Major Hurricane Winds ≥ 111 mph (96 kts) | 0 | 0.0 (0 in 10 Marches) | 1st (tied with 43 other Marches) | 0 |
| Accumulated Cyclone Energy ACE×10⁴ kt² | 0.0 | 0.0 (0 in 10 Marches) | 1st (tied with 43 other Marches) | 5.8 (1908) |
| Storm Type | Count | 1991-2020 Mean |
1981-2024 Rank* |
1851-2024 Record |
|---|---|---|---|---|
| Tropical Storm Winds ≥ 39 mph (34 kts) | 0 | 0.1 (1 in 10 seasons) | 4th (tied with 40 other seasons) | 1 (9 seasons) |
| Hurricane Winds ≥ 74 mph (64 kts) | 0 | 0.0 (0 in 10 seasons) | 2nd (tied with 42 other seasons) | 1 (1908, 1938, 1955, 2016) |
| Major Hurricane Winds ≥ 111 mph (96 kts) | 0 | 0.0 (0 in 10 seasons) | 1st (tied with 43 other seasons) | 0 |
| Accumulated Cyclone Energy ACE×10⁴ kt² | 0.0 | 0.3 (3 in 10 seasons) | 3rd (tied with 41 other seasons) | 6.5 (1955) |
East Pacific
No East Pacific Tropical Cyclones occurred during March 2024.
| Storm Type | Count | 1991-2020 Mean |
1981-2024 Rank* |
1949-2024 Record |
|---|---|---|---|---|
| Tropical Storm Winds ≥ 39 mph (34 kts) | 0 | 0.0 (0 in 10 Marches) | 2nd (tied with 42 other Marches) | 1 (1992) |
| Hurricane Winds ≥ 74 mph (64 kts) | 0 | 0.0 (0 in 10 Marches) | 1st (tied with 43 other Marches) | 0 |
| Major Hurricane Winds ≥ 111 mph (96 kts) | 0 | 0.0 (0 in 10 Marches) | 1st (tied with 43 other Marches) | 0 |
| Accumulated Cyclone Energy ACE×10⁴ kt² | 0.0 | 0.0 (0 in 10 Marches) | 2nd (tied with 42 other Marches) | 0.6 (1992) |
| Storm Type | Count | 1991-2020 Mean |
1981-2024 Rank* |
1949-2024 Record |
|---|---|---|---|---|
| Tropical Storm Winds ≥ 39 mph (34 kts) | 0 | 0.1 (1 in 10 seasons) | 4th (tied with 40 other seasons) | 2 (1992) |
| Hurricane Winds ≥ 74 mph (64 kts) | 0 | 0.1 (1 in 10 seasons) | 3rd (tied with 41 other seasons) | 1 (1992, 2016) |
| Major Hurricane Winds ≥ 111 mph (96 kts) | 0 | 0.0 (0 in 10 seasons) | 2nd (tied with 42 other seasons) | 1 (1992) |
| Accumulated Cyclone Energy ACE×10⁴ kt² | 0.0 | 0.8 (8 in 10 seasons) | 4th (tied with 40 other seasons) | 13.9 (1992) |
West Pacific
No West Pacific Tropical Cyclones occurred during March 2024.
| Storm Type | Count | 1991-2020 Mean |
1981-2024 Rank* |
1945-2024 Record |
|---|---|---|---|---|
| Tropical Storm Winds ≥ 39 mph (34 kts) | 0 | 0.5 (5 in 10 Marches) | 16th (tied with 28 other Marches) | 3 (1982) |
| Typhoon Winds ≥ 74 mph (64 kts) | 0 | 0.2 (2 in 10 Marches) | 9th (tied with 35 other Marches) | 1 (15 Marchs) |
| Major Typhoon Winds ≥ 111 mph (96 kts) | 0 | 0.1 (1 in 10 Marches) | 6th (tied with 38 other Marches) | 1 (9 Marchs) |
| Accumulated Cyclone Energy ACE×10⁴ kt² | 0.0 | 3.1 | 16th (tied with 28 other Marches) | 30.2 (2002) |
| Storm Type | Count | 1991-2020 Mean |
1981-2024 Rank* |
1945-2024 Record |
|---|---|---|---|---|
| Tropical Storm Winds ≥ 39 mph (34 kts) | 0 | 1.1 | 30th (tied with 14 other seasons) | 5 (1965) |
| Typhoon Winds ≥ 74 mph (64 kts) | 0 | 0.4 (4 in 10 seasons) | 16th (tied with 28 other seasons) | 3 (2015) |
| Major Typhoon Winds ≥ 111 mph (96 kts) | 0 | 0.2 (2 in 10 seasons) | 9th (tied with 35 other seasons) | 2 (1953, 2015) |
| Accumulated Cyclone Energy ACE×10⁴ kt² | 0.0 | 5.8 | 30th (tied with 14 other seasons) | 44.7 (1958) |

North Indian
No North Indian Tropical Cyclones occurred during March 2024.
| Storm Type | Count | 1991-2020 Mean |
1981-2024 Rank* |
1972-2024 Record |
|---|---|---|---|---|
| Tropical Storm Winds ≥ 39 mph (34 kts) | 0 | 0.0 (0 in 10 Marches) | 3rd (tied with 41 other Marches) | 1 (1994, 2022) |
| Cyclone Winds ≥ 74 mph (64 kts) | 0 | 0.0 (0 in 10 Marches) | 1st (tied with 43 other Marches) | 0 |
| Major Cyclone Winds ≥ 111 mph (96 kts) | 0 | 0.0 (0 in 10 Marches) | 1st (tied with 43 other Marches) | 0 |
| Accumulated Cyclone Energy ACE×10⁴ kt² | 0.0 | 0.0 (0 in 10 Marches) | 3rd (tied with 41 other Marches) | 0.8 (1994) |
| Storm Type | Count | 1991-2020 Mean |
1981-2024 Rank* |
1972-2024 Record |
|---|---|---|---|---|
| Tropical Storm Winds ≥ 39 mph (34 kts) | 0 | 0.2 (2 in 10 seasons) | 11th (tied with 33 other seasons) | 1 (10 seasons) |
| Cyclone Winds ≥ 74 mph (64 kts) | 0 | 0.0 (0 in 10 seasons) | 1st (tied with 43 other seasons) | 0 |
| Major Cyclone Winds ≥ 111 mph (96 kts) | 0 | 0.0 (0 in 10 seasons) | 1st (tied with 43 other seasons) | 0 |
| Accumulated Cyclone Energy ACE×10⁴ kt² | 0.0 | 0.2 (2 in 10 seasons) | 11th (tied with 33 other seasons) | 1.8 (1987) |
South Indian
| Name |
Maximum CategoryMax Cat |
Dates >39 mph |
Maximum Sustained Winds | Minimum Central Pressure |
|---|---|---|---|---|
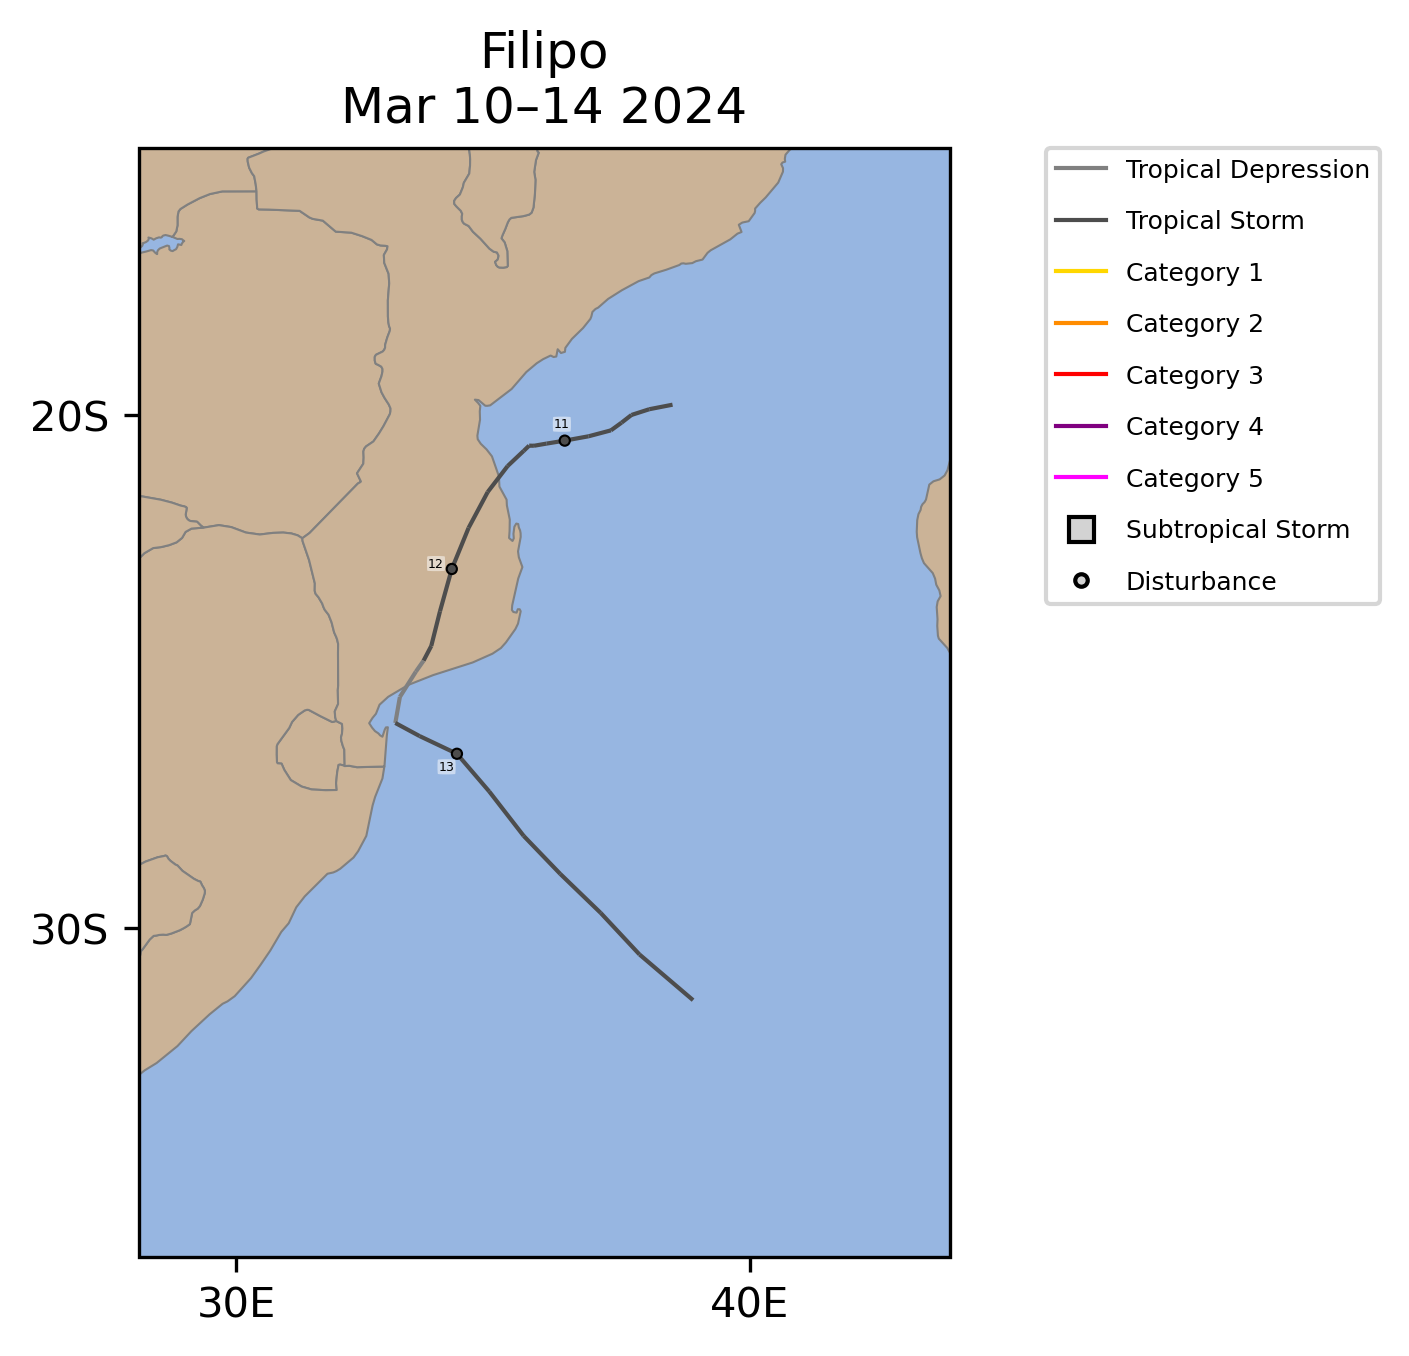 | TS | March 10Mar 10-14 | 70 mph | 990 mb |
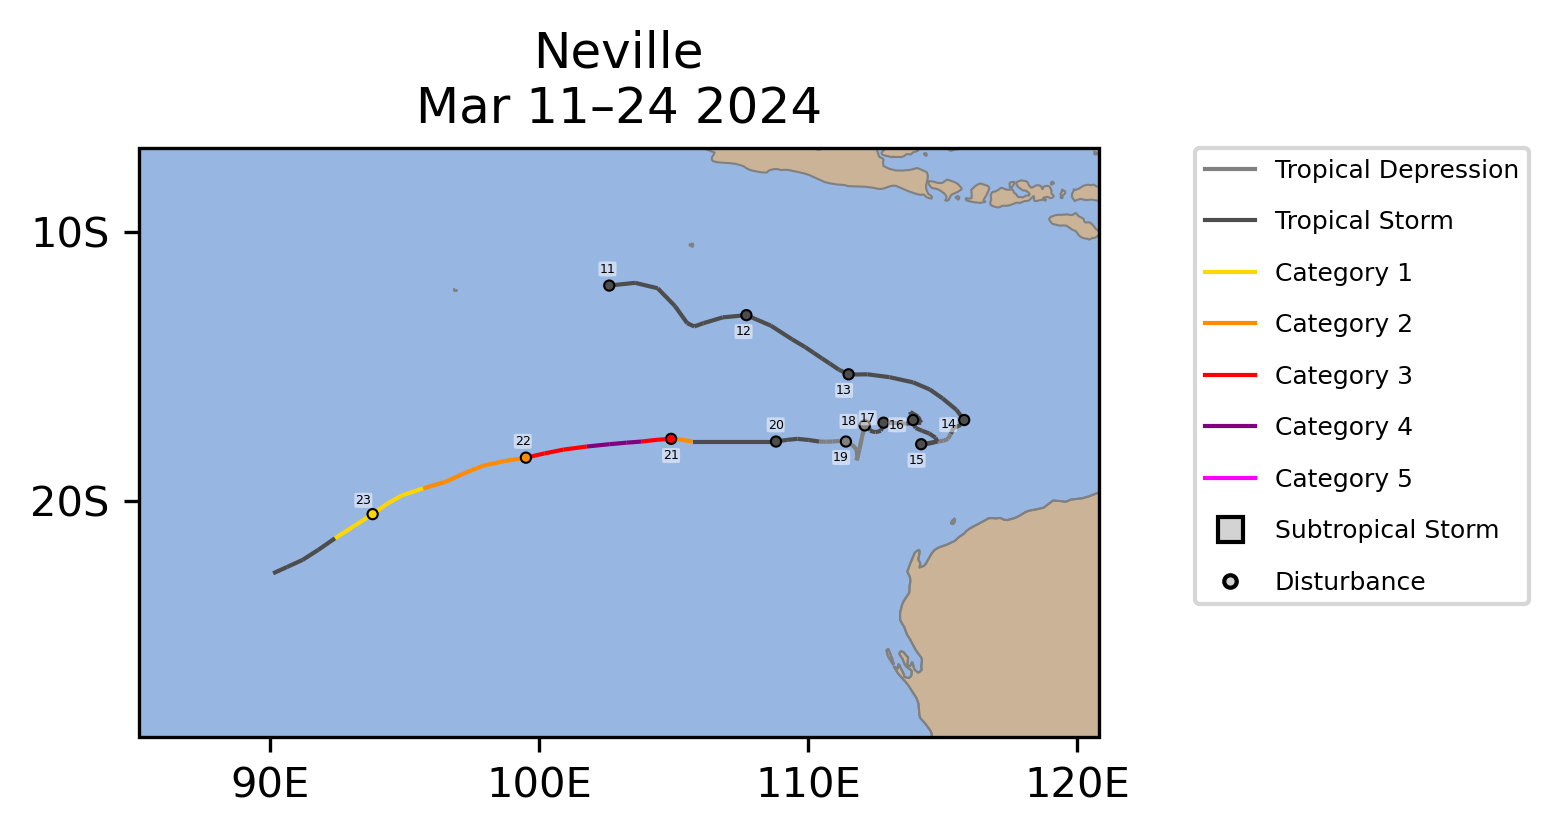 | 4 | March 11Mar 11-24 | 130 mph† | 948 mb† |
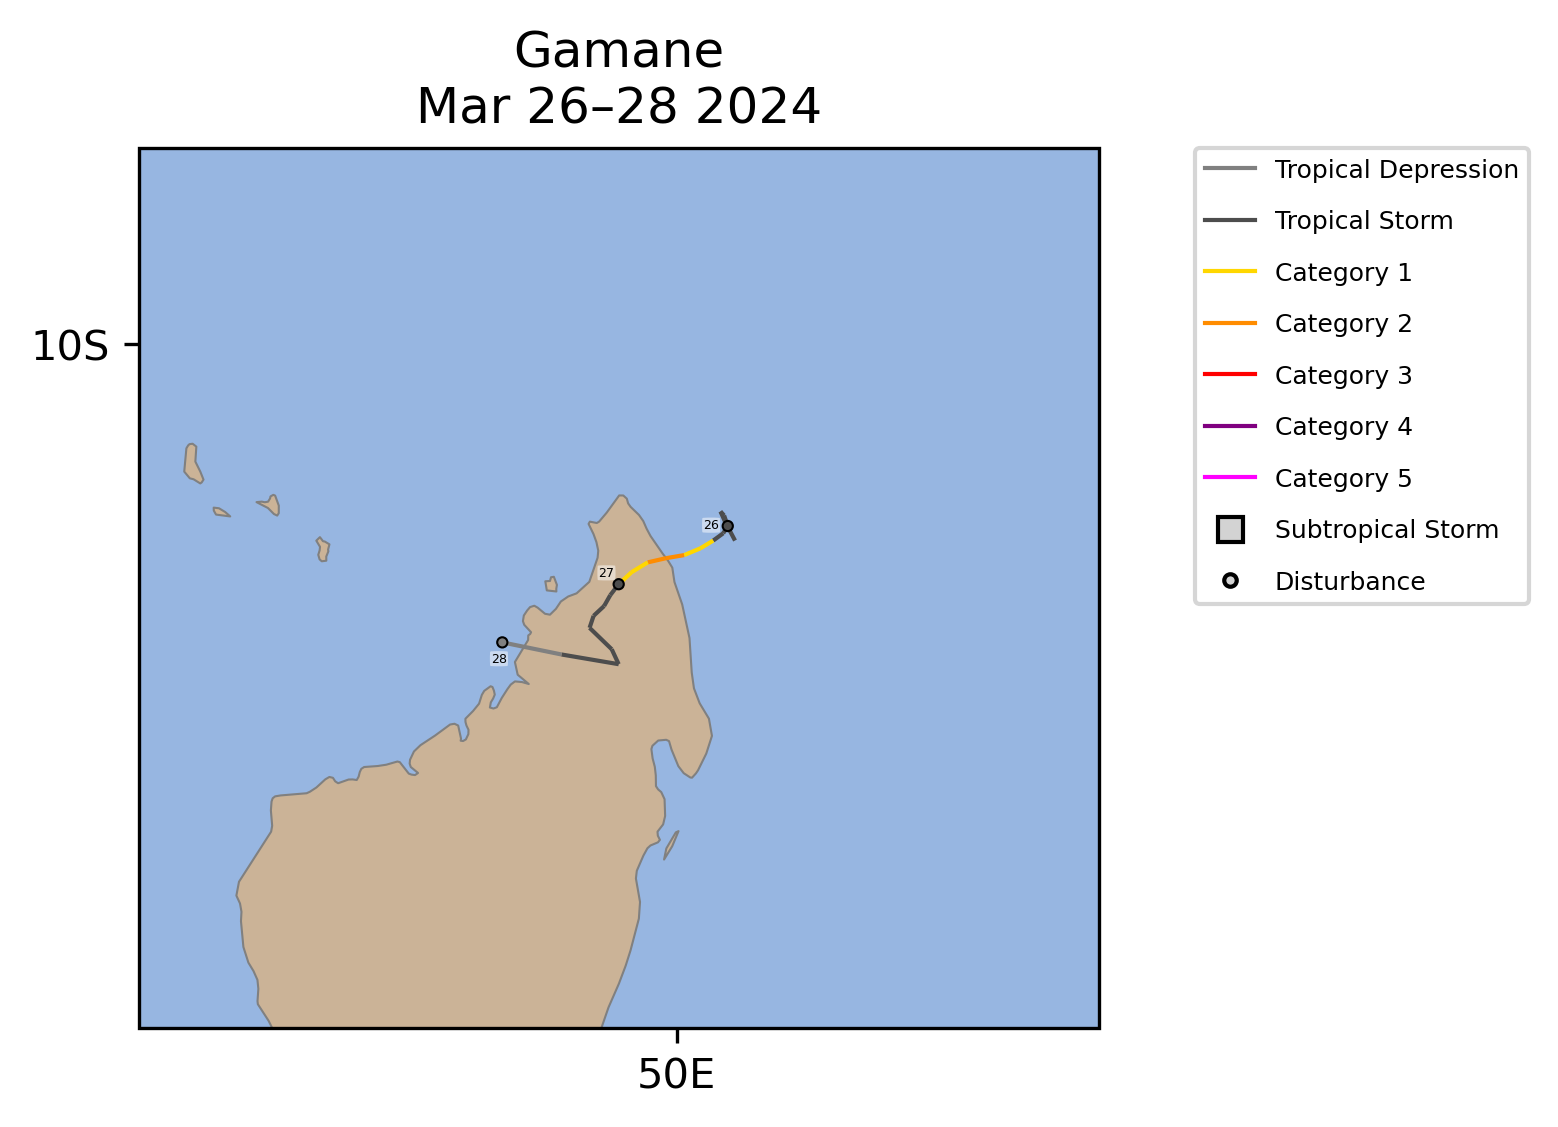 | 2 | March 26Mar 26-28 | 100 mph | 970 mb |
| †Value occurred in the South Indian | ||||
| Storm Type | Count | 1991-2020 Mean |
1981-2024 Rank* |
1956-2024 Record |
|---|---|---|---|---|
| Tropical Storm Winds ≥ 39 mph (34 kts) | 3 | 2.2 | 4th (tied with 14 other Marches) | 5 (1994) |
| Cyclone Winds ≥ 74 mph (64 kts) | 1 | 1.4 | 17th (tied with 21 other Marches) | 4 (2019) |
| Major Cyclone Winds ≥ 111 mph (96 kts) | 0 | 0.8 (8 in 10 Marches) | 24th (tied with 20 other Marches) | 3 (2019) |
| Accumulated Cyclone Energy ACE×10⁴ kt² | 6.5 | 19.0 | 33rd | 71.2 (1994) |
| Storm Type | Count | 1991-2020 Mean |
1981-2024 Rank* |
1956-2024 Record |
|---|---|---|---|---|
| Tropical Storm Winds ≥ 39 mph (34 kts) | 10 | 9.2 | 12th (tied with 8 other seasons) | 15 (1997) |
| Cyclone Winds ≥ 74 mph (64 kts) | 4 | 5.2 | 27th (tied with 6 other seasons) | 9 (1994, 1997, 2019) |
| Major Cyclone Winds ≥ 111 mph (96 kts) | 2 | 3.1 | 27th (tied with 6 other seasons) | 8 (2019) |
| Accumulated Cyclone Energy ACE×10⁴ kt² | 60.9 | 81.3 | 30th | 161.4 (1994) |
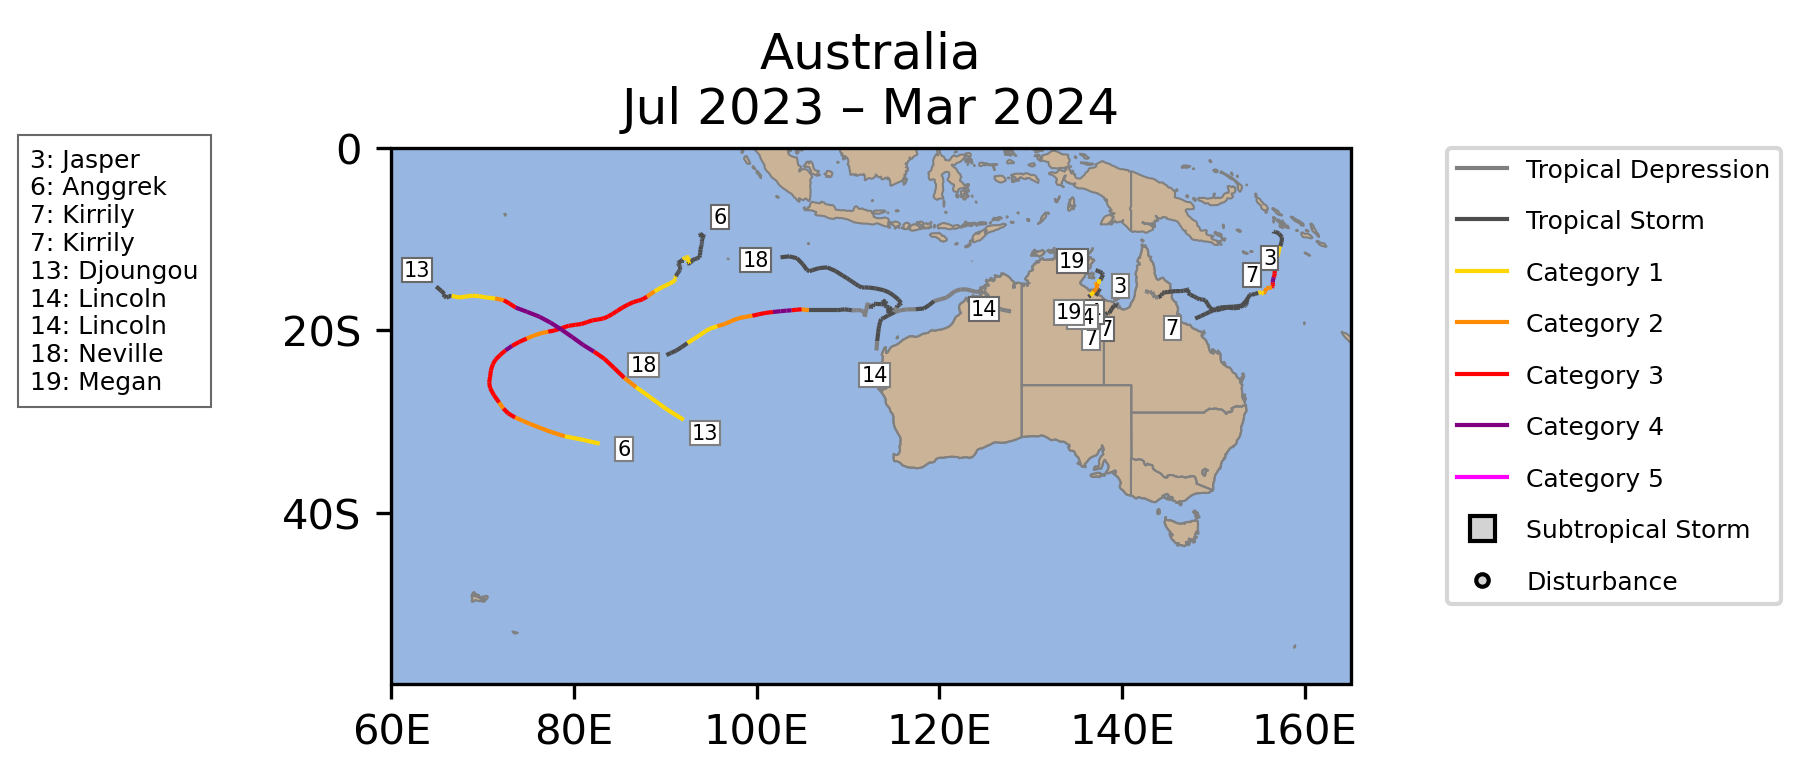
Australia
| Name |
Maximum CategoryMax Cat |
Dates >39 mph |
Maximum Sustained Winds | Minimum Central Pressure |
|---|---|---|---|---|
| 4 | March 11Mar 11-24 | 130 mph | 948 mb |
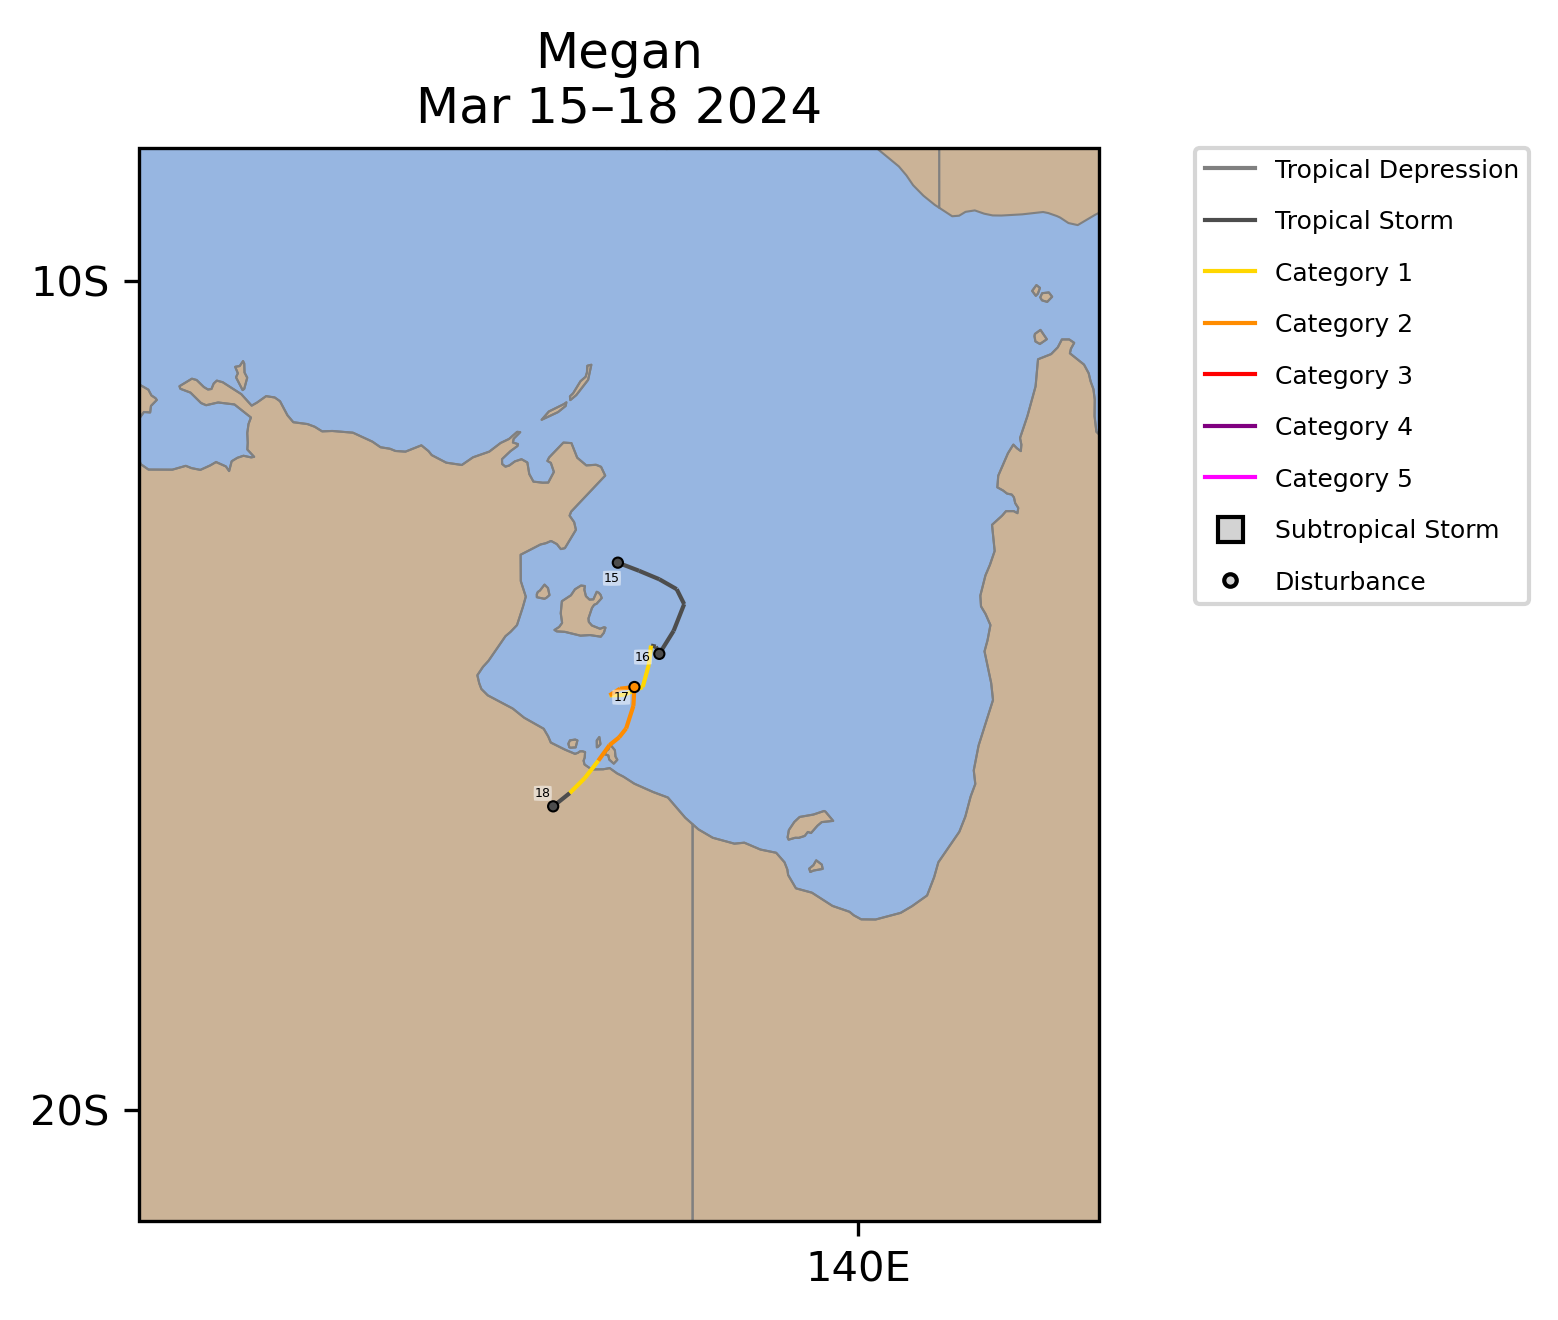 | 2 | March 15Mar 15-18 | 105 mph | 957 mb |
| Storm Type | Count | 1991-2020 Mean |
1981-2024 Rank* |
1956-2024 Record |
|---|---|---|---|---|
| Tropical Storm Winds ≥ 39 mph (34 kts) | 2 | 2.5 | 18th (tied with 16 other Marches) | 5 (1999, 2004) |
| Tropical Cyclone Winds ≥ 74 mph (64 kts) | 2 | 1.5 | 8th (tied with 10 other Marches) | 4 (2006) |
| Major Tropical Cyclone Winds ≥ 111 mph (96 kts) | 1 | 1.0 | 10th (tied with 16 other Marches) | 3 (1999, 2004, 2006, 2019) |
| Accumulated Cyclone Energy ACE×10⁴ kt² | 19.8 | 19.5 | 16th | 54.8 (2005) |
| Storm Type | Count | 1991-2020 Mean |
1981-2024 Rank* |
1956-2024 Record |
|---|---|---|---|---|
| Tropical Storm Winds ≥ 39 mph (34 kts) | 9 | 8.7 | 20th (tied with 3 other seasons) | 17 (1999) |
| Tropical Cyclone Winds ≥ 74 mph (64 kts) | 5 | 3.9 | 8th (tied with 7 other seasons) | 8 (1996) |
| Major Tropical Cyclone Winds ≥ 111 mph (96 kts) | 2 | 2.0 | 12th (tied with 11 other seasons) | 4 (1992, 1999, 2006, 2015) |
| Accumulated Cyclone Energy ACE×10⁴ kt² | 54.2 | 48.1 | 14th | 98.4 (1999) |
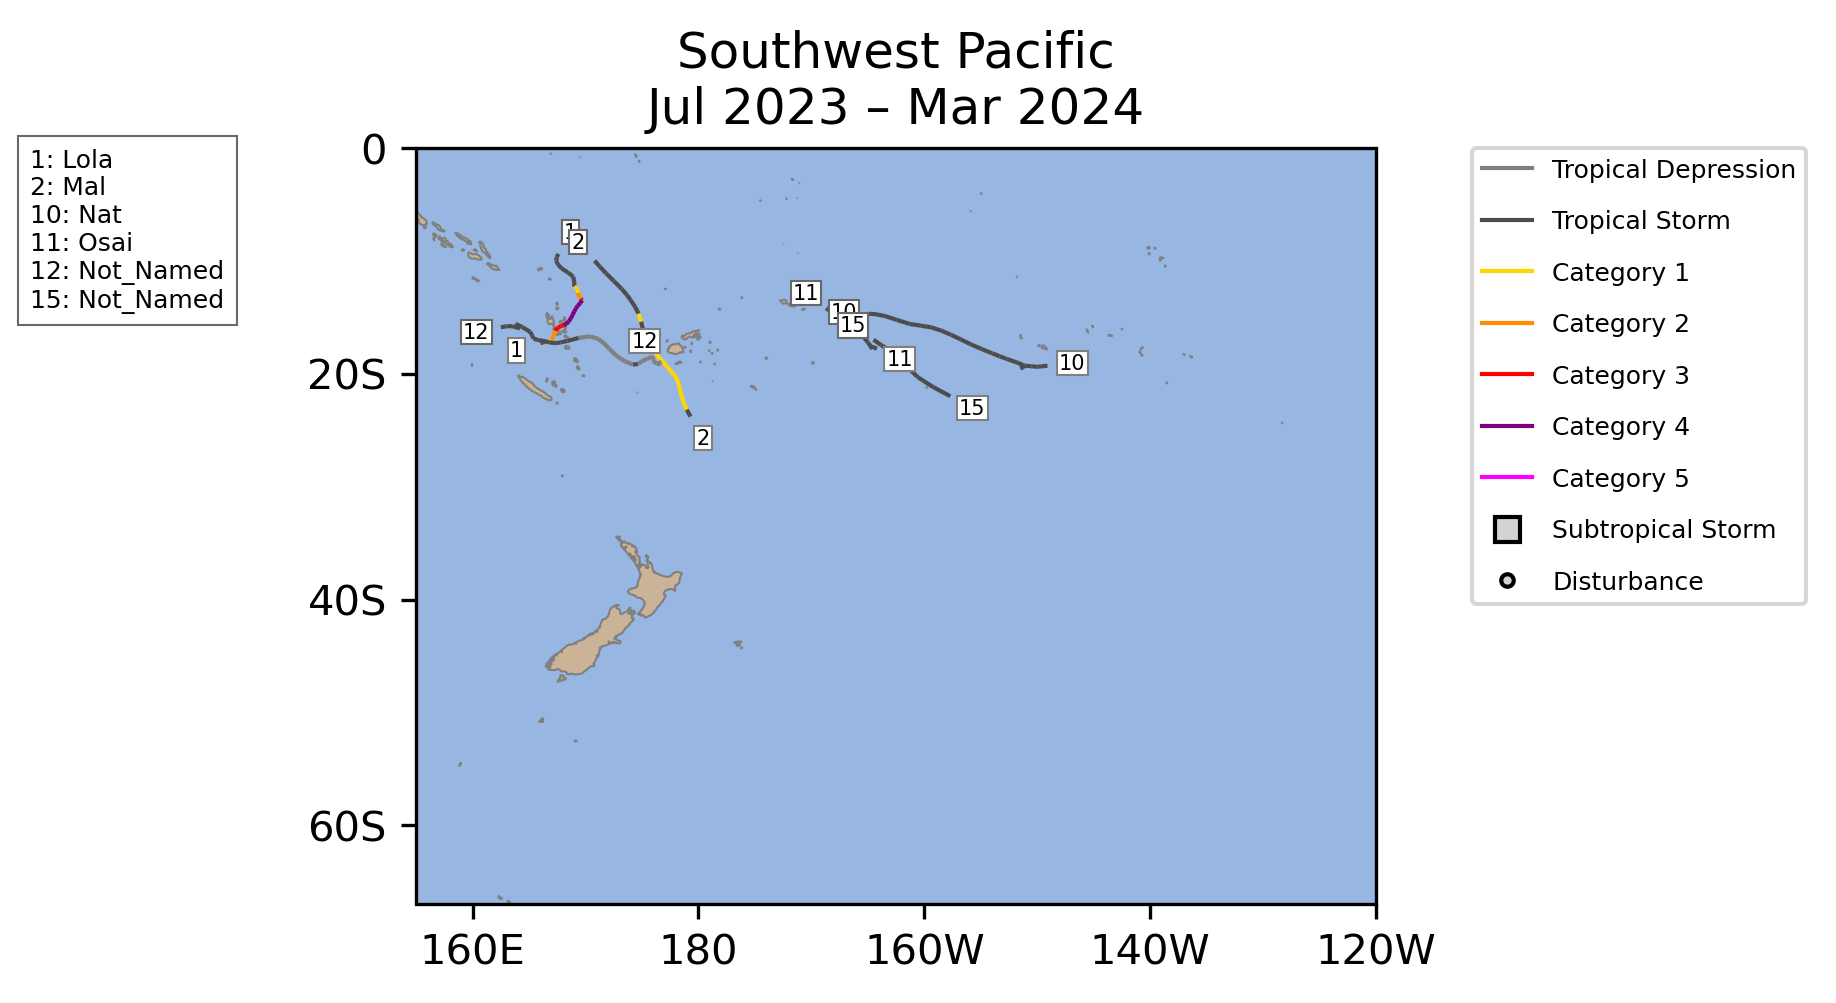
Southwest Pacific
No Southwest Pacific Tropical Cyclones occurred during March 2024.
| Storm Type | Count | 1991-2020 Mean |
1981-2024 Rank* |
1956-2024 Record |
|---|---|---|---|---|
| Tropical Storm Winds ≥ 39 mph (34 kts) | 0 | 1.6 | 38th (tied with 6 other Marches) | 4 (1980, 1983, 1992) |
| Tropical Cyclone Winds ≥ 74 mph (64 kts) | 0 | 0.9 (9 in 10 Marches) | 28th (tied with 16 other Marches) | 4 (1983) |
| Major Tropical Cyclone Winds ≥ 111 mph (96 kts) | 0 | 0.5 (5 in 10 Marches) | 18th (tied with 26 other Marches) | 2 (5 Marchs) |
| Accumulated Cyclone Energy ACE×10⁴ kt² | 0.0 | 11.2 | 38th (tied with 6 other Marches) | 45.2 (1992) |
| Storm Type | Count | 1991-2020 Mean |
1981-2024 Rank* |
1956-2024 Record |
|---|---|---|---|---|
| Tropical Storm Winds ≥ 39 mph (34 kts) | 6 | 6.2 | 16th (tied with 5 other seasons) | 14 (1998) |
| Tropical Cyclone Winds ≥ 74 mph (64 kts) | 2 | 3.4 | 24th (tied with 11 other seasons) | 10 (1998) |
| Major Tropical Cyclone Winds ≥ 111 mph (96 kts) | 1 | 1.8 | 20th (tied with 13 other seasons) | 6 (2003) |
| Accumulated Cyclone Energy ACE×10⁴ kt² | 22.4 | 45.7 | 27th | 118.1 (1992) |
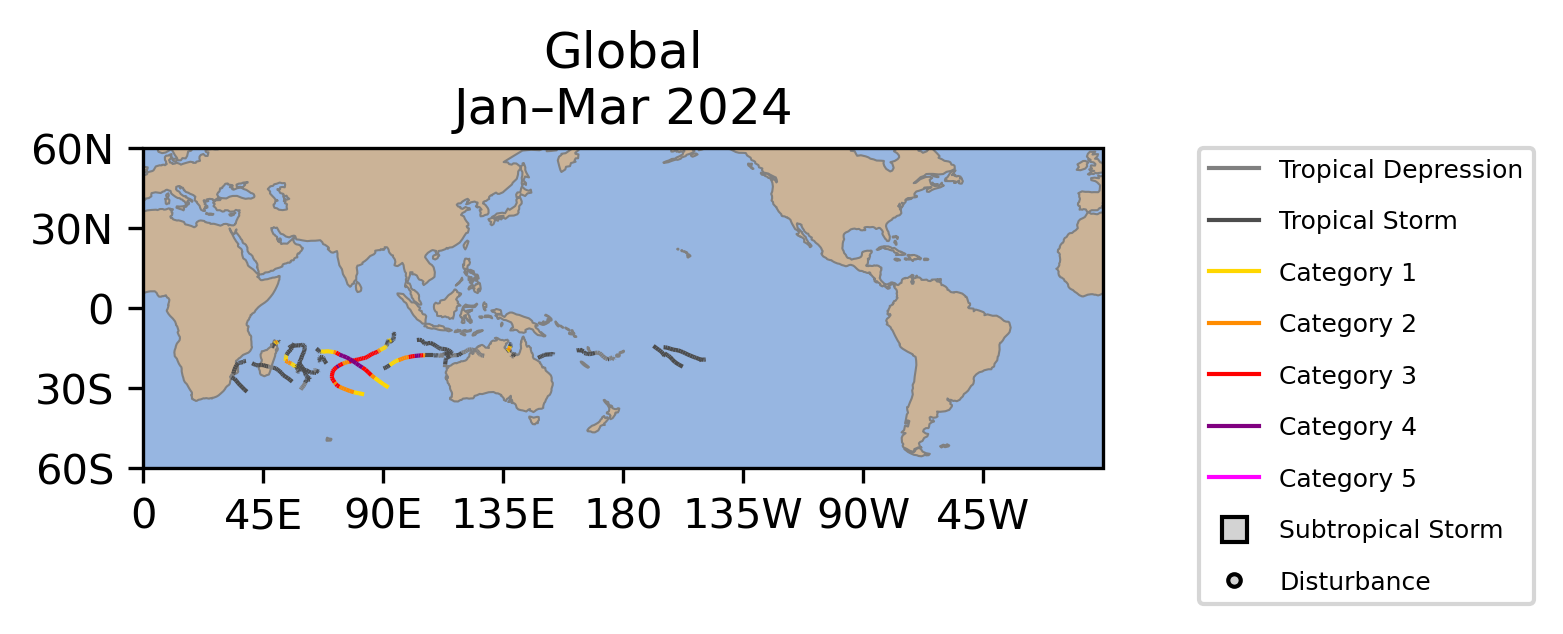
Global
| Name |
Maximum CategoryMax Cat |
Dates >39 mph |
Maximum Sustained Winds | Minimum Central Pressure |
|---|---|---|---|---|
| TS | March 10Mar 10-14 | 70 mph | 990 mb |
| 4 | March 11Mar 11-24 | 130 mph | 948 mb |
| 2 | March 15Mar 15-18 | 105 mph | 957 mb |
| 2 | March 26Mar 26-28 | 100 mph | 970 mb |
| Storm Type | Count | 1991-2020 Mean |
1981-2024 Rank* |
1972-2024 Record |
|---|---|---|---|---|
| Tropical Storm Winds ≥ 39 mph (34 kts) | 4 | 6.1 | 33rd (tied with 5 other Marches) | 10 (1994) |
| Tropical Cyclone Winds ≥ 74 mph (64 kts) | 3 | 3.7 | 23rd (tied with 12 other Marches) | 7 (2007, 2019) |
| Major Tropical Cyclone Winds ≥ 111 mph (96 kts) | 1 | 2.4 | 28th (tied with 11 other Marches) | 6 (2019) |
| Accumulated Cyclone Energy ACE×10⁴ kt² | 26.2 | 52.9 | 33rd | 116.0 (2019) |
| Storm Type | Count | 1991-2020 Mean |
1981-2024 Rank* |
1972-2024 Record |
|---|---|---|---|---|
| Tropical Storm Winds ≥ 39 mph (34 kts) | 19 | 17.9 | 12th (tied with 9 other seasons) | 26 (1986) |
| Tropical Cyclone Winds ≥ 74 mph (64 kts) | 6 | 9.6 | 38th (tied with 4 other seasons) | 14 (1994) |
| Major Tropical Cyclone Winds ≥ 111 mph (96 kts) | 3 | 5.4 | 35th (tied with 2 other seasons) | 10 (1994, 2019) |
| Accumulated Cyclone Energy ACE×10⁴ kt² | 103.0 | 144.5 | 34th | 264.0 (1994) |
Data Description
The data in this report are derived from NCEI's IBTrACS dataset (Knapp et al. 2010; Schreck et al. 2014). IBTrACS tropical cyclone track and intensity data from agencies and sources around the globe. In this report, data from NOAA's National Hurricane Center (NHC) are used for the North Atlantic and East Pacific. The other basins use data from the U.S. Military's Joint Typhoon Warning Center (JTWC).
Historical values use the "best track" data that have been analyzed by forecasters after the season using all available data. Operational procedures and observing systems have changed with time and between regions, which makes these data heterogeneous. Intensity data are generally the most reliable since the early 1970s in the Atlantic (Landsea and Franklin 2013) and since the mid-1980s in other regions (Chu et al. 2002). The number of short-lived storms (≤2 days) has also increased since around 2000 due to improvements in observations and analysis techniques (Landsea et al. 2010).
Values for the current year are provisional values from the operational forecast advisories. IBTrACS obtains these from NCEP's TC Vitals, the NCAR Tropical Cyclone Guidance Project, and NHC provisional data. These values are subject to change during the post-season best track analysis. They also only include 6-hourly storm fixes, which means they may miss special advisories at landfall, peak intensity, etc.
The tropical cyclone seasons in the Southern Hemisphere begin in July and end in June, while the Northern Hemisphere seasons are counted from January to December. Storms are counted in all basins, months, and years in which they occur, which means some storms may appear more than once. However, the global totals only include each storm one time.
References
- Chu, J.-H., C. R. Sampson, A. S. Levine, and E. Fukada, 2002: The joint typhoon warning center tropical cyclone best-tracks, 1945–2000. Naval Research Laboratory, Reference Number NRL/MR/7540-02-16, 22 pp., https://www.metoc.navy.mil/jtwc/products/best-tracks/tc-bt-report.html.
- Knapp, K. R., M. C. Kruk, D. H. Levinson, H. J. Diamond, and C. J. Neumann, 2010: The International Best Track Archive for Climate Stewardship (IBTrACS). Bull. Amer. Meteor. Soc., 91, 363–376, https://doi.org/10.1175/2009BAMS2755.1.
- Landsea, C. W., and J. L. Franklin, 2013: Atlantic Hurricane database uncertainty and presentation of a new database format. Mon. Wea. Rev., 141, 3576–3592, https://doi.org/10.1175/MWR-D-12-00254.1.
- ——, G. A. Vecchi, L. Bengtsson, and T. R. Knutson, 2010: Impact of duration thresholds on Atlantic tropical cyclone counts. J. Climate, 23, 2508–2519, https://doi.org/10.1175/2009JCLI3034.1.
- Schreck, C. J., K. R. Knapp, and J. P. Kossin, 2014: The Impact of Best Track Discrepancies on Global Tropical Cyclone Climatologies using IBTrACS. Mon. Wea. Rev., 142, 3881–3899, https://doi.org/10.1175/MWR-D-14-00021.1.