Visit:NCEI U.S. Tornadoes
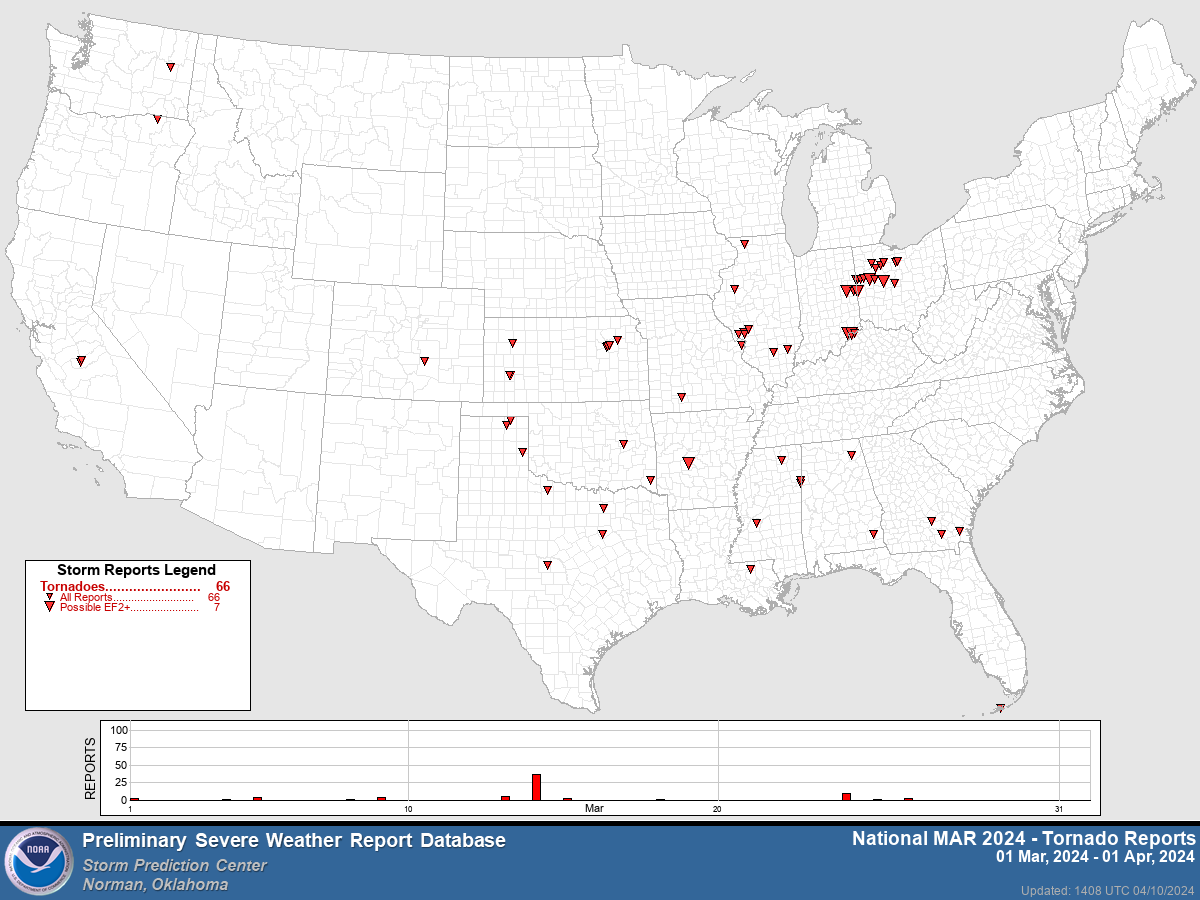
According to preliminary data from NOAA's Storm Prediction Center, during March, there were 66 preliminary tornado reports. This was below the 1991-2020 average of 80.1 tornadoes for the month of March and was the lowest count for March since 2018. There were no tornadoes reported for more than half of the days in the month. The 2023 year-to-date U.S. preliminary tornado count is 163, which is below the 1991-2020 year-to-date average of 155.6. Each of the last four years (2020-2023) have had higher year-to-date tornado counts than 2024. The following summary details the main tornado event that occurred during mid-March.
March 13-14 produced as many as 41 tornadoes across portions of the Midwest and Ohio River Valley, resulting in significant damage and loss of life. These tornado impacts were mostly concentrated across southwestern Illinois, eastern Indiana and northwestern Ohio. This cluster of tornadoes included at least ten EF-0, eight EF-1, seven EF-2, two EF-3 and several EF-U (unrated) tornadoes. An EF-3 tornado with maximum winds of 165 mph tracked from west of Selma, Indiana into Ohio, with a path length of 25.03 miles and maximum width of 700 yards. The counties of Auglaize and Logan in Ohio were also impacted by an EF-3 tornado with winds as high as 155 mph. These tornadoes damaged many homes, businesses, vehicles and other infrastructure while also causing three fatalities and more than 60 injuries.
Did You Know?
Tornado Count
Final monthly tornado counts are typically less than the preliminary count. This can be due to some phenomena being inaccurately reported as tornadic activity or a single tornado being reported multiple times. Tornado accounts are reported to the local National Weather Service forecast offices who are responsible for going into the field and verifying each tornado reported. This process often takes several months to complete. Once all reports have been investigated, the final count is published by the Storm Prediction Center (SPC).
The Tornado Monthly Climate Reports are written using the preliminary numbers because the final data is not available at the time of production. Historically, for every 100 preliminary tornado reports, at least 65 tornadoes are confirmed. An error bar is depicted on the tornado count graphic representing this uncertainty in the preliminary tornado count.
The following U.S. studies performed by SPC meteorologists offer deeper context and discussion regarding the frequency and distribution of tornado intensity climatologies:
-
Edwards, R., H. E. Brooks, and H. Cohn, 2021: Changes in tornado climatology accompanying the Enhanced
Fujita scale. J. Appl. Meteor. Climatol., 60, 1465-1482
DOI: 10.1175/JAMC-D-21-0058.1. - Mccarthy, Daniel & Schaefer, Joseph. (2004). Tornado trends over the past thirty years. paper presented at 14th Conference on Applied Meteorology.