Note: This Synoptic Discussion describes recent weather events and climate anomalies in relation to the phenomena that cause the weather. These phenomena include the jet stream, fronts and low pressure systems that bring precipitation, high pressure systems that bring dry weather, and the mechanisms which control these features — such as El Niño, La Niña, and other oceanic and atmospheric drivers (PNA, NAO, AO, and others). The report may contain more technical language than other components of the State of the Climate series.
Summary
January 2015 was characterized by an active jet stream with a strong meridional flow over the contiguous United States (CONUS). Vigorous short-wave troughs moving in this flow generated areas of precipitation in parts of the country. The dominant long-wave upper-level circulation pattern kept much of the CONUS drier than normal with a reduced snow cover, but the overall national drought footprint changed little during the month. Monthly temperatures averaged warmer than normal in the West beneath a long-wave ridge and cooler than normal in the East beneath a long-wave trough. The upper-level circulation pattern, and temperature and precipitation patterns, suggest that the weather and climate of January 2015 were influenced very strongly by conditions in the North Pacific. See below for details.
Synoptic Discussion
 Animation of daily upper-level circulation for the month. In the Northern Hemisphere, January marks the mid-point of climatological winter, which is the time of year when the sun angle and solar heating reach their minimum and an expanded circumpolar vortex forces the jet stream to migrate southward. In January 2015, the long-wave jet stream pattern consisted of an upper-level ridge over the western CONUS and a trough in the East. The ridge kept temperatures warmer than normal and deflected Pacific weather systems away from the drought-stricken West, with several western states having the top ten warmest and top ten driest January in the 1895-2015 record. The northerly flow over central North America, associated with the trough, funneled cold Canadian and Arctic air masses into the central and eastern CONUS, especially during the first half of the month. The northerly flow also kept Gulf of Mexico moisture out of the central to eastern CONUS, resulting in below-normal precipitation for January and a decreasing snow cover throughout the month. |
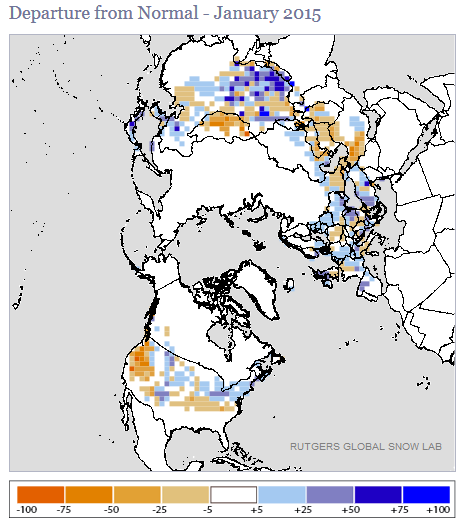
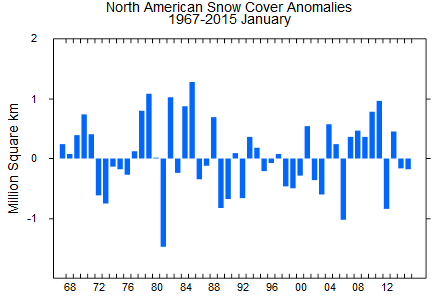
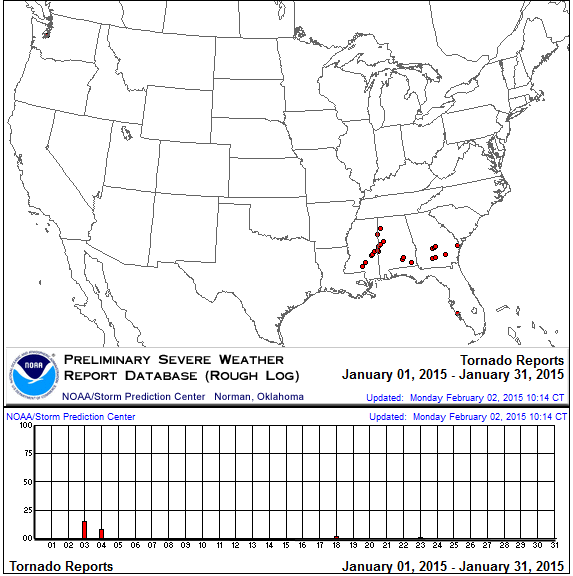
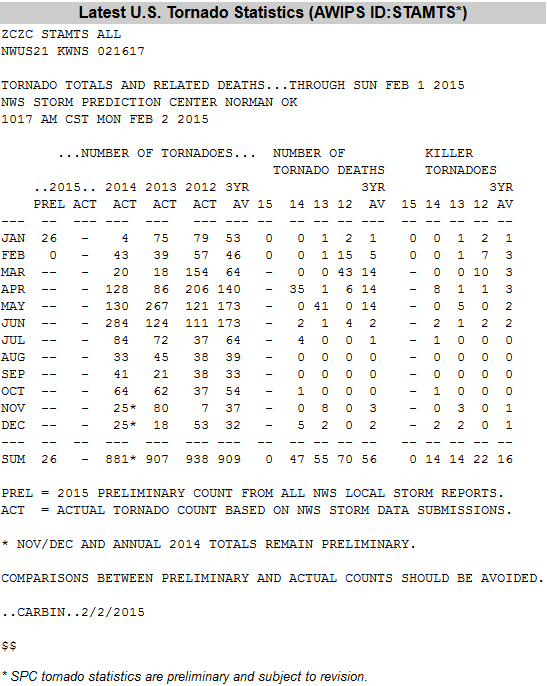
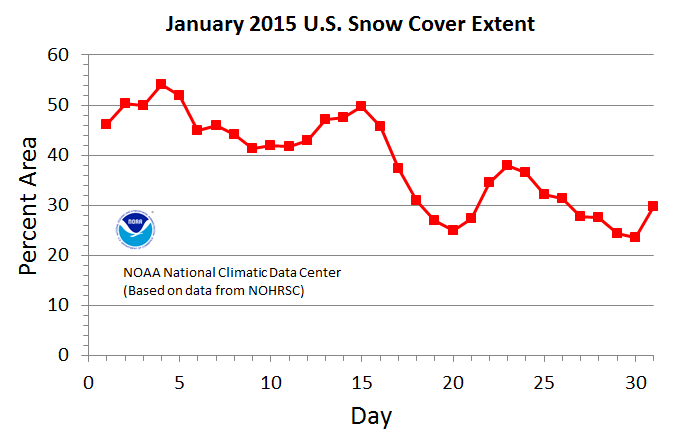
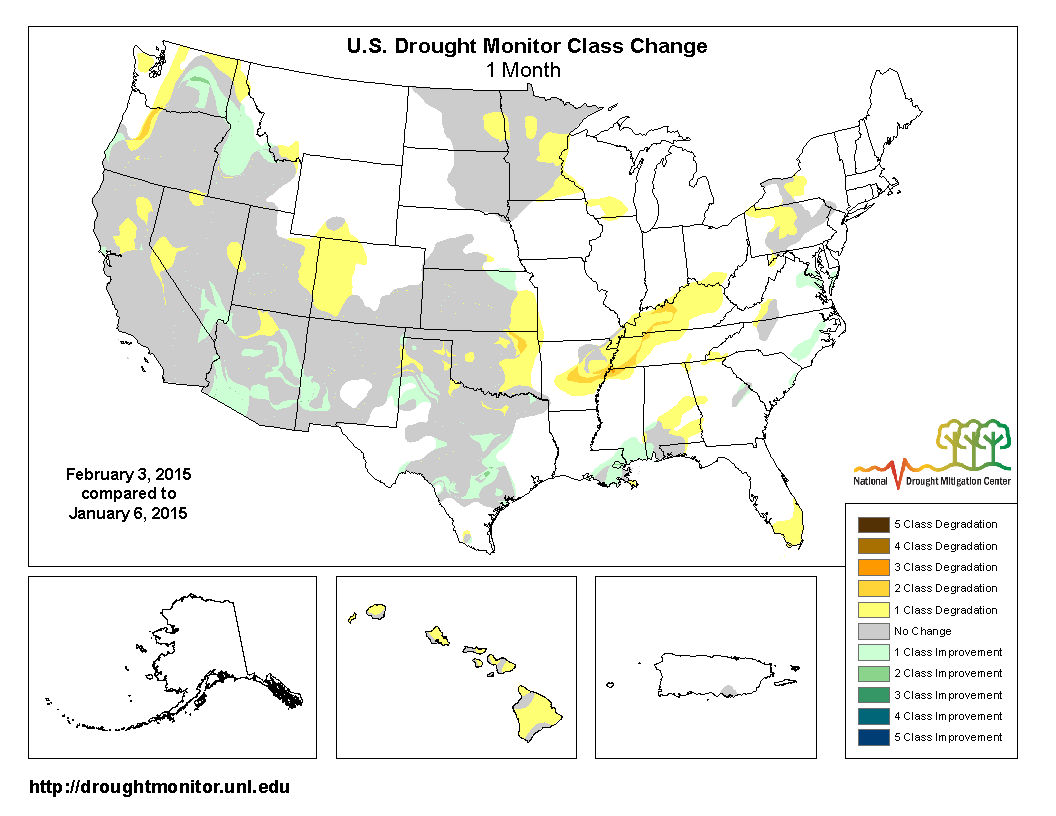
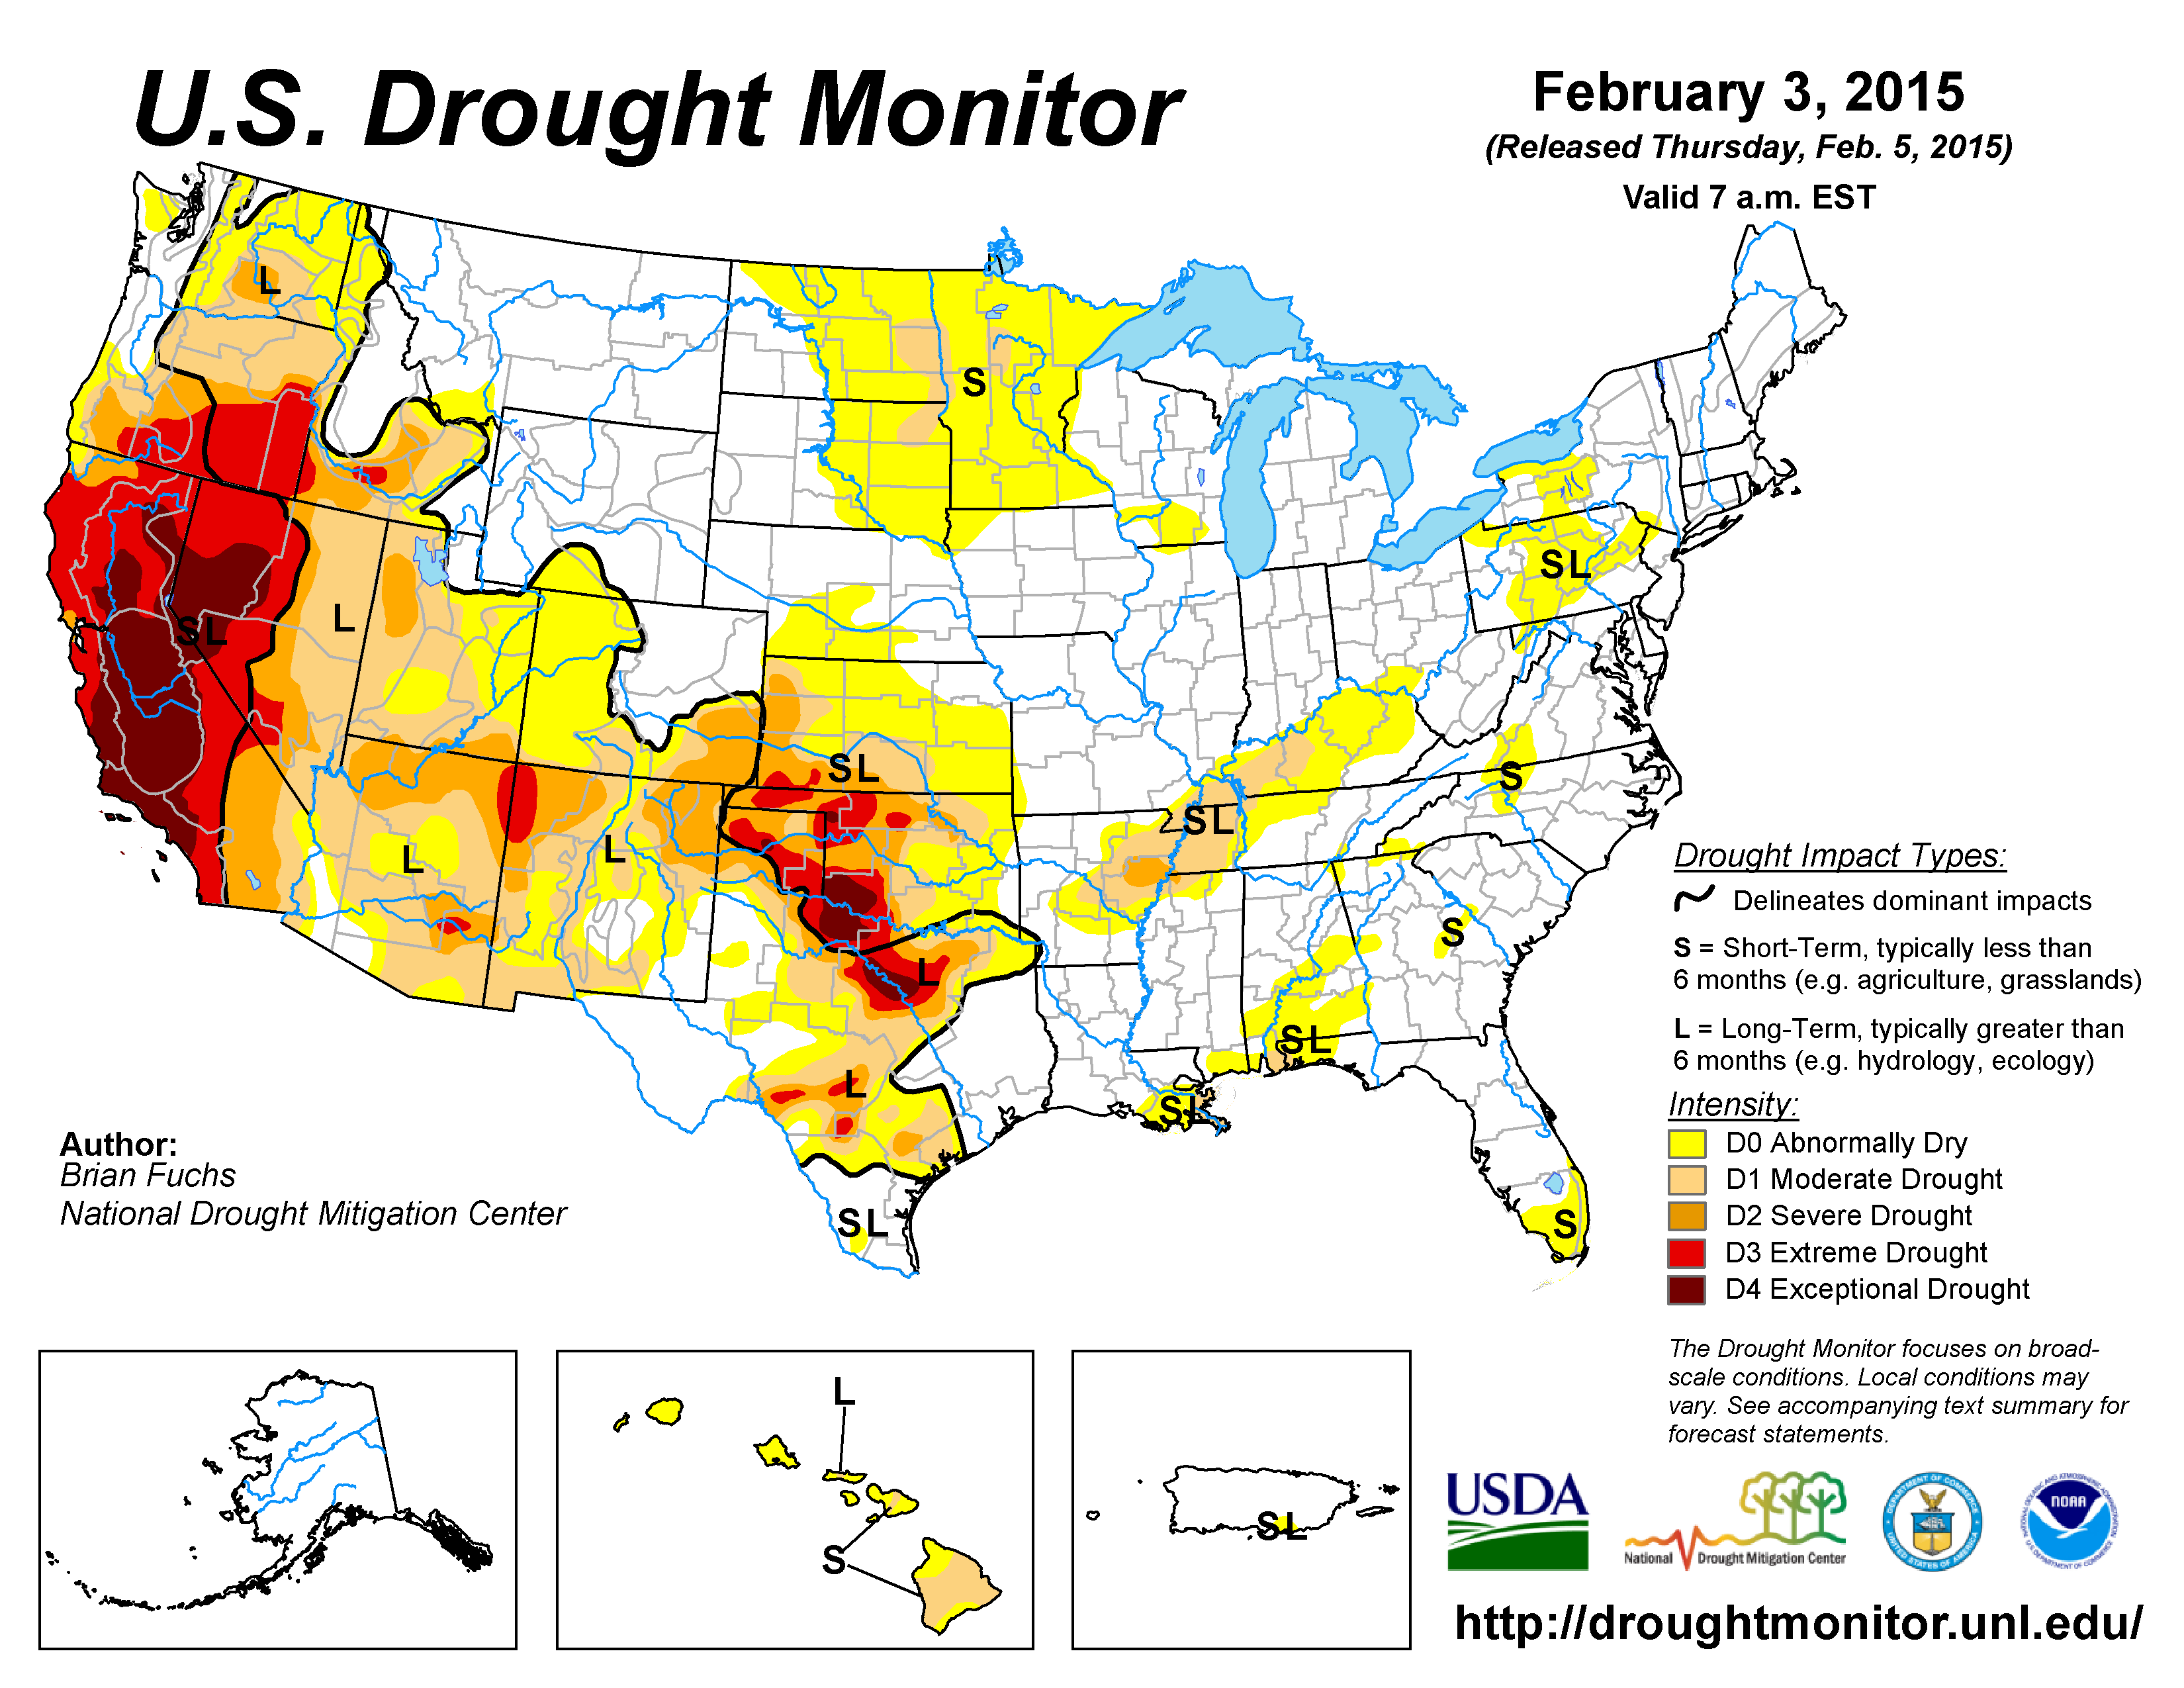
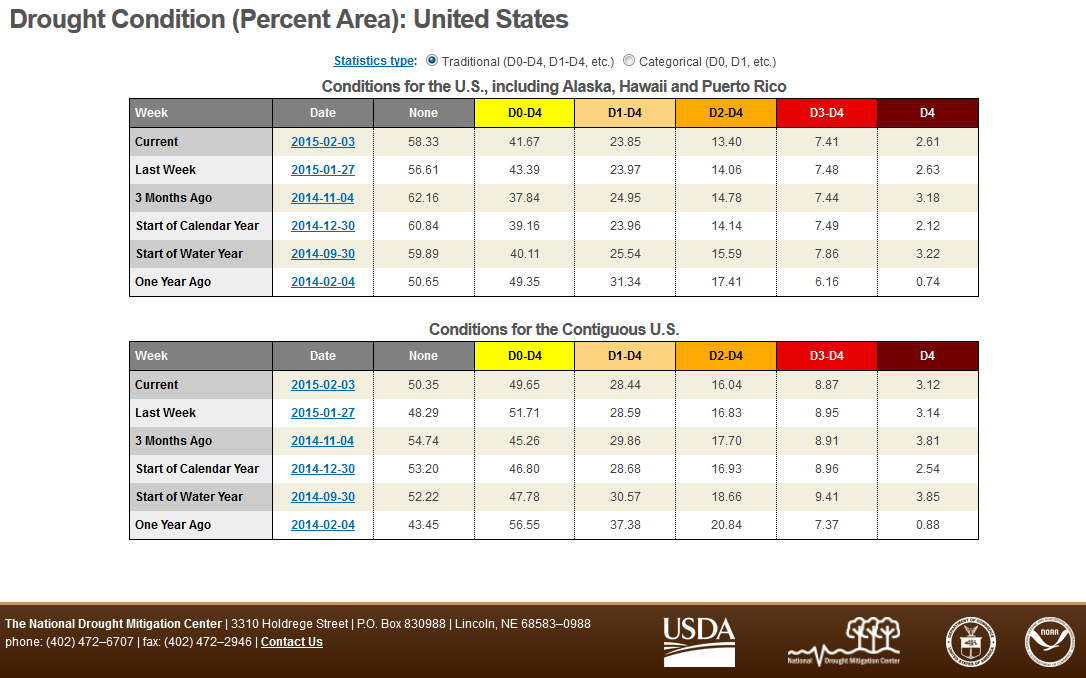
 Animation of daily surface fronts and pressure systems for the month. The long-wave circulation pattern shifted at mid-month, with the ridge/trough pattern being replaced by a more zonal/westerly flow. This blocked the cold Canadian air masses and allowed milder Pacific air masses to move across the central and eastern CONUS, which warmed the national temperature as seen in the month-to-date temperature anomaly progression through the month (January 1st through the 5th, 11th, 17th, 25th, and 29th). By the end of the month, there were 3,499 record warm daily high (1,906) and low (1,593) temperature records, which is more than four times as many (775) record cold daily high (441) and low (334) temperature records. This was reflected in the national monthly average temperature which ranked January 2015 as the 24th warmest January in the 1895-2015 record. It was also reflected in the REDTI (Residential Energy Demand Temperature Index) for January 2015, which ranked as the 53rd lowest January value in the 121-year record. This near-average rank indicated that energy was still needed to heat homes in the heavily-populated East which remained cold while the central and western parts of the country warmed. Parts of the CONUS received above-normal precipitation thanks to energetic short-wave troughs and lows moving in the upper-level flow. Some of these systems had enough moisture and below-freezing air to generate snow storms, but they weren't enough to bring the monthly snow cover area above average, with January 2015 ranking as the 18th least snowy January for the CONUS in the 1967-2015 satellite snow cover record. A potent storm system triggered an outbreak of tornadoes across the Southeast during the 3rd-4th, but the overall circulation pattern generally inhibited severe weather with the preliminary monthly total of 26 tornadoes below the January average of 35. The January precipitation pattern had little effect on the overall national drought footprint, with 28.4 percent of the CONUS experiencing moderate to exceptional drought at the end of January, slightly less than at the end of December. |
 Monthly upper-level circulation pattern and anomalies. When integrated across the month, the atmospheric circulation indicated a pattern of above-normal 500-mb heights (stronger-than-normal long-wave ridge) over the eastern North Pacific and western North America extending into the central CONUS, with below-normal 500-mb heights over eastern Canada extending across the far northern North Atlantic. |
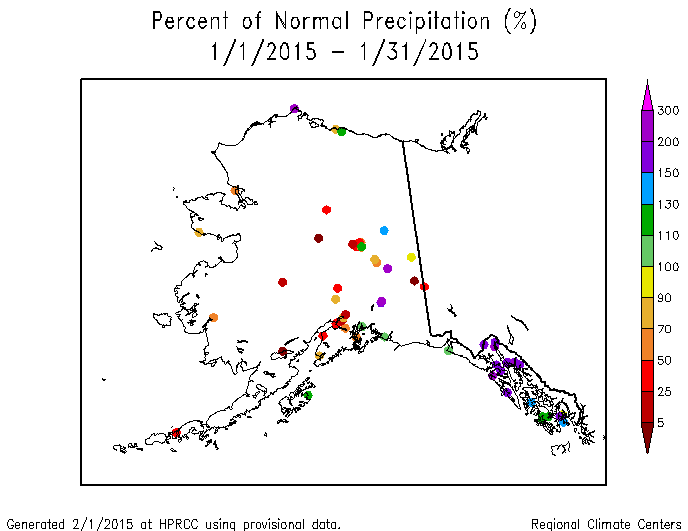
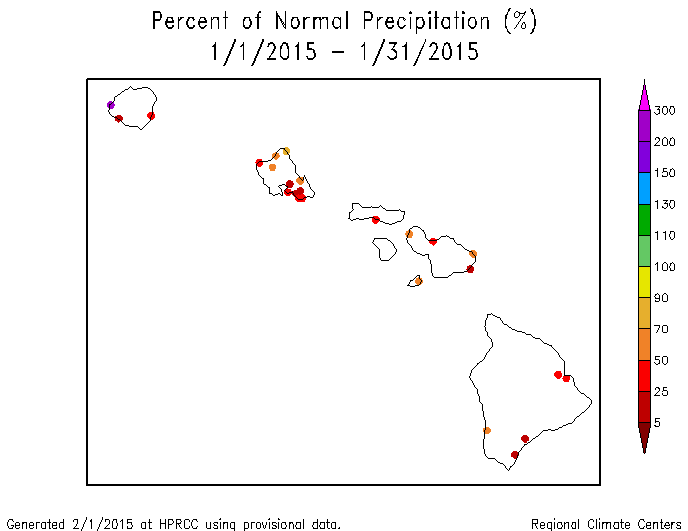
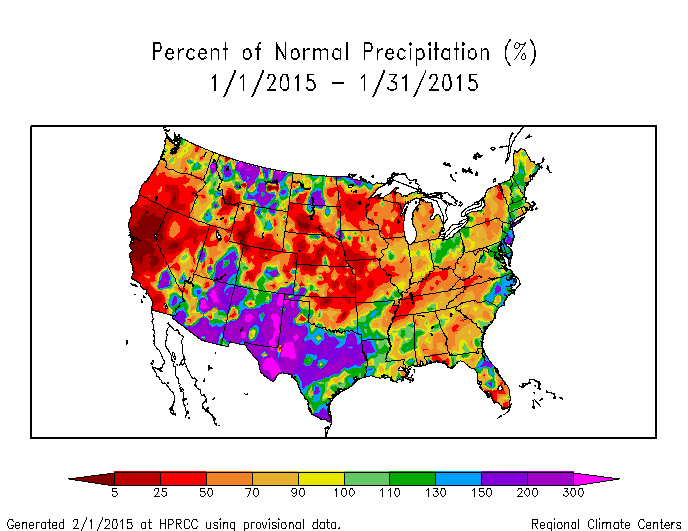 Map of monthly precipitation anomalies. Parts of the Northern Rockies and High Plains, Southwest and Southern Plains, and coastal Mid-Atlantic to Northeast were wetter than normal during January 2015. Precipitation was below normal across much of the rest of the CONUS, especially in the West and Central Plains to Midwest. January was drier than normal across much of Alaska and the Hawaiian Islands. |
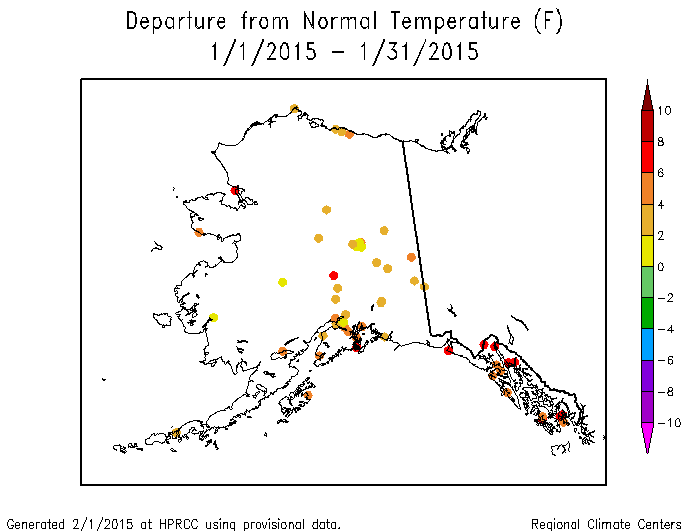
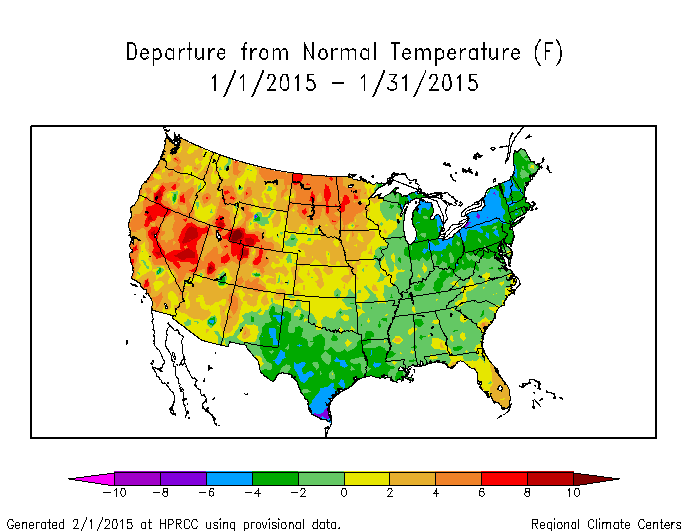 Map of monthly temperature anomalies. January 2015 temperatures averaged warmer than normal across the western and north central CONUS, southern Florida, and Alaska. Temperatures were colder than normal from the Southern Plains to Northeast. |
Global Linkages: The upper-level circulation anomaly pattern over North America was part of a long-wave pattern that stretched across the Northern Hemisphere. This pattern consisted of ridges (with positive 500-mb height anomalies) over the central North Atlantic and western North America, with the North American ridge extending across the Bering Strait into Siberia. Troughs (with negative 500-mb height anomalies) were centered over the central North Pacific, north central Siberia, and northeastern North America stretching across the far northern North Atlantic into northern Europe. The above-normal 500-mb heights were reflected by above-normal temperatures at the surface over western North America to eastern Asia, while the below-normal 500-mb heights were reflected by near- to below-normal temperatures over northeast North America and north central Siberia.
Atmospheric Drivers
Subtropical highs, and fronts and low pressure systems moving in the mid-latitude storm track flow, are influenced by the broadscale atmospheric circulation. The circulation of the atmosphere can be analyzed and categorized into specific patterns. The Tropics, especially the equatorial Pacific Ocean, provides abundant heat energy which largely drives the world's atmospheric and oceanic circulation. The following describes several of these modes or patterns of the atmospheric circulation, their drivers, the temperature and precipitation patterns (or teleconnections) associated with them, and their index values this month:
-
El Niño Southern Oscillation (ENSO)
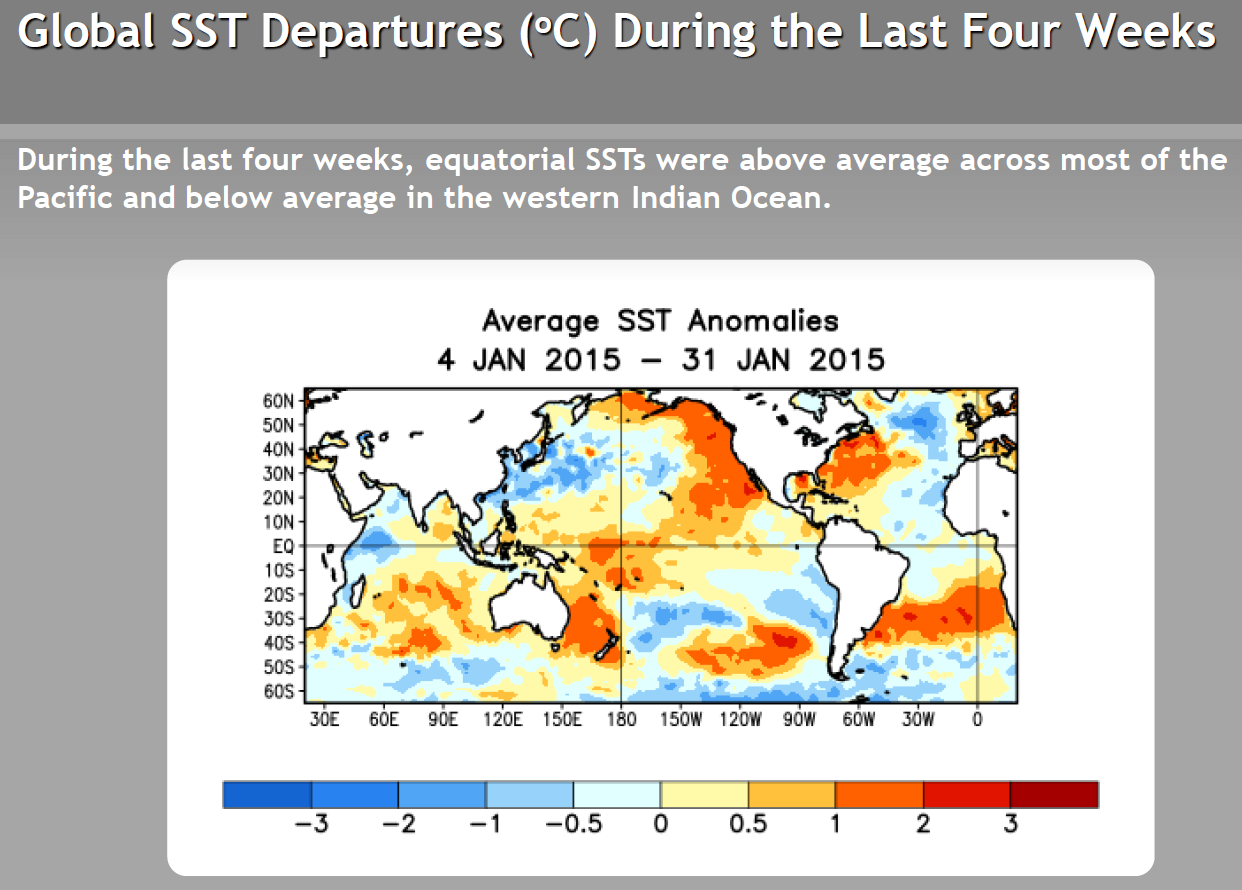
- Description: Oceanic and atmospheric conditions in the tropical Pacific Ocean can influence weather across the globe. ENSO is characterized by two extreme modes: El Niño (warmer-than-normal sea surface temperature [SST] anomalies in the tropical Pacific) and La Niña (cooler-than-normal SST anomalies), with the absence of either of these modes termed "ENSO-neutral" conditions.
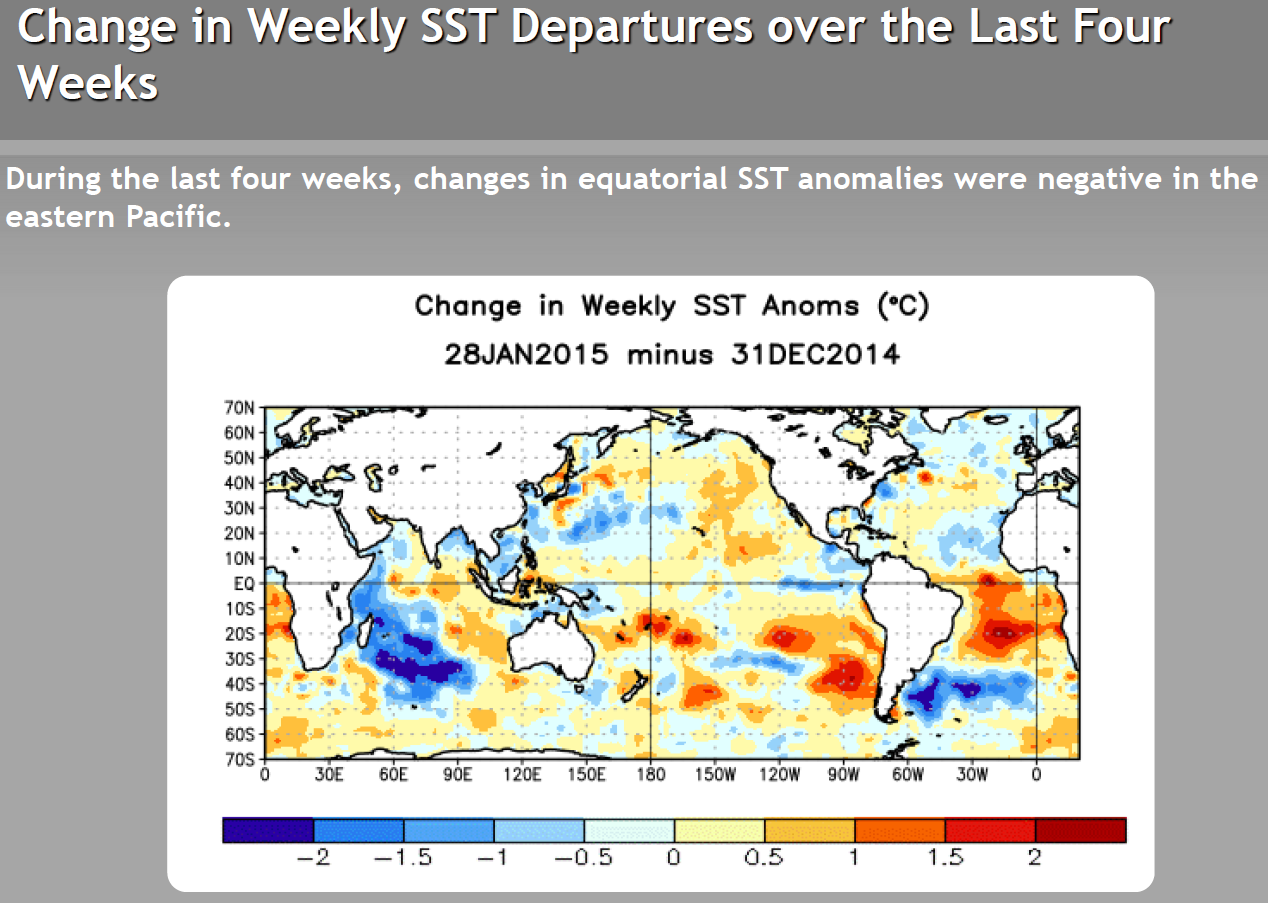
- Status: Ocean surface temperatures and some other features across the tropical Pacific were characteristic of borderline El Niño conditions, but collectively, the combined atmosphere and oceanic state remained ENSO-neutral during January.
- Teleconnections (influence on weather): To the extent teleconnections are known, while in a neutral state, ENSO normally is not a player in the month's weather. Historical data has been analyzed by NOAA to show typical temperature and precipitation patterns associated with El Niño and La Niña ENSO episodes. Teleconnections are not available for ENSO-neutral conditions at that NOAA web site. If an El Niño were happening during January, the typical precipitation pattern would consist of wetter-than-normal conditions along the Gulf of Mexico, Atlantic, and Pacific coasts, and drier-than-normal conditions across the Northwest to Northern Rockies, and Central Plains to Great Lakes. The typical temperature pattern would consist of below-normal temperatures across most of the southern tier and east coast states and above-normal temperatures in the Northwest.
- Comparison to Observed: The January 2015 temperature anomaly pattern shows agreement with the pattern expected with an El Niño but the warm anomalies are not as intense. The precipitation anomaly pattern shows some agreement in the interior West and Plains to Great Lakes, but not the West Coast or Southeast.
-
Madden-Julian Oscillation (MJO)
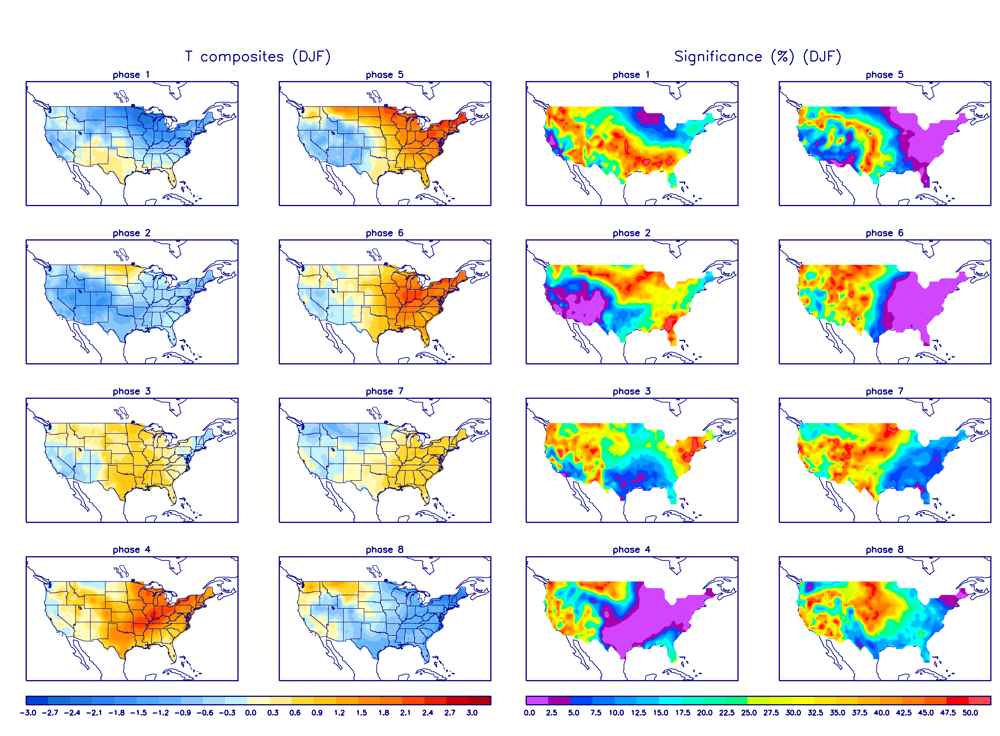
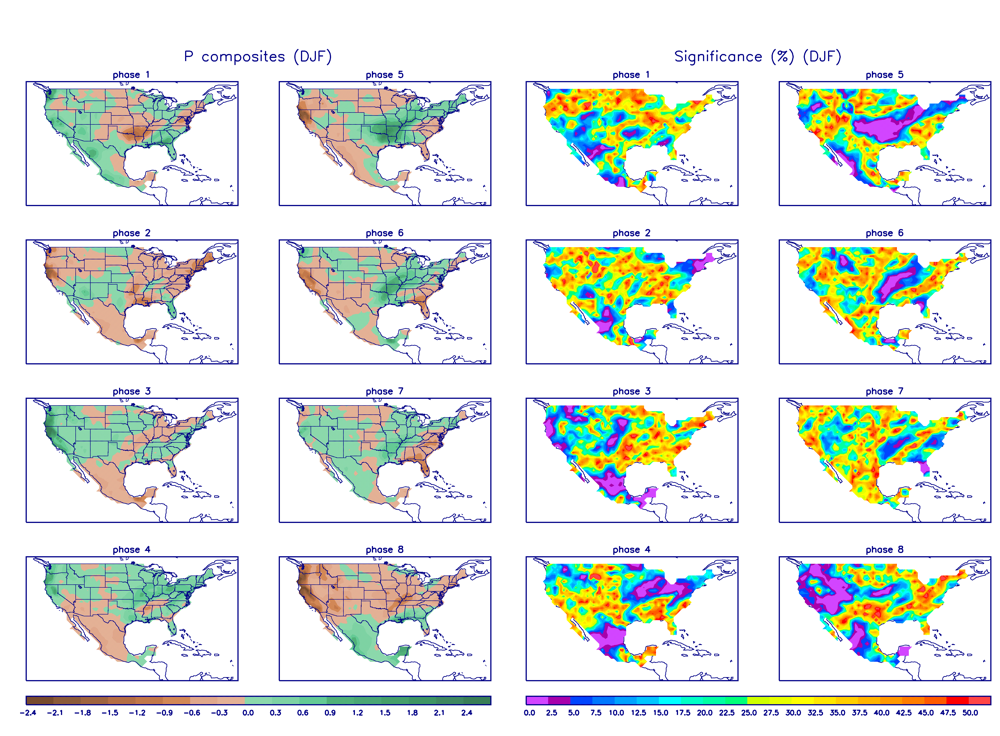
- Description: The MJO is a tropical disturbance or "wave" that propagates eastward around the global tropics with a cycle on the order of 30-60 days. It is characterized by regions of enhanced and suppressed tropical rainfall. One of its indices is a phase diagram which illustrates the phase (1-8) and amplitude of the MJO on a daily basis. The MJO is categorized into eight "phases" depending on the pattern of the location and intensity of the regions of enhanced and suppressed tropical rainfall. The MJO can enter periods of little or no activity, when it becomes neutral or incoherent and has little influence on the weather. Overall, the MJO tends to be most active during ENSO-neutral years, and is often absent during moderate-to-strong El Niño and La Niña episodes.
- Status: The MJO started the month in phase 5, passed through phases 6 and 7 before becoming incoherent near the end of the month, then transitioned back into phase 6 on the last day of the month. The MJO indices appeared to be influenced by other modes of coherent subseasonal tropical variability, including Kelvin and Rossby waves (MJO updates for January 5, 12, 19, 26, and February 2).
- Teleconnections (influence on weather): The MJO's temperature and precipitation teleconnections to U.S. weather depend on time of year and MJO phase. To the extent teleconnections are known, the December-February teleconnections for temperature are shown here and for precipitation are shown here.
- Comparison to Observed: The MJO is transitory and can change phases (modes) within a month, so it is more closely related to weekly weather patterns than monthly. The January 2015 monthly temperature and precipitation anomaly patterns do not match what is expected for MJO phases 6 through 8, but there is some similarity in the precipitation patterns in some areas at the weekly time scale.
- The Pacific/North American (PNA) pattern
- Description: The PNA teleconnection pattern is associated with strong fluctuations in the strength and location of the East Asian jet stream. PNA-related blocking of the jet stream flow in the Pacific can affect weather downstream over North America, especially the West and especially in the winter half of the year.
- Status: The daily PNA index was positive for most of the month, averaging slightly positive for the month as a whole. The 3-month-averaged index has been positive during the last half of 2014 after a long run of mostly negative for the previous two to three years.
- Teleconnections (influence on weather): To the extent teleconnections are known, for a positive PNA, the temperature teleconnection map for this time of year (January on the teleconnection maps) shows warmer-than-normal temperatures in Alaska, western Canada, and the west coast of the U.S., and cooler-than-normal temperatures for the Southern Plains to Atlantic Coast of the CONUS. The precipitation teleconnection map shows drier-than-normal weather in the Pacific Northwest to Central Rockies and much of the country along and east of the Mississippi River. The upper-level circulation anomaly teleconnections show above-normal heights over western Canada and the western CONUS, and below-normal heights over the southeastern and eastern CONUS and much of the central to western North Pacific.
- Comparison to Observed: The January 2015 temperature and precipitation anomaly patterns show strong agreement with those expected with a positive PNA. The upper-level circulation anomaly pattern agrees over western North America but not elsewhere.
- The Arctic Oscillation (AO) pattern
- Description: The AO teleconnection pattern relates upper-level circulation over the Arctic to circulation features over the Northern Hemisphere mid-latitudes and is most active during the cold season.
- Status: The daily AO index was near zero to mostly positive throughout the month, averaging positive for the month. The 3-month-averaged index was positive in January, recovering from the dominance of the negative monthly values for the last several months.
- Teleconnections (influence on weather): To the extent teleconnections are known, a positive AO this time of year (December-February) is typically associated with dry conditions in the Southeast and Northeast, wet conditions in the Tennessee Valley and Pacific Northwest coast, above-normal temperatures east of the Rocky Mountains, near normal temperatures in the West, and upper-level circulation anomalies which are below normal across the Arctic into the northwestern North America, and above normal over the eastern CONUS, North Atlantic and North Pacific.
- Comparison to Observed: The January 2015 monthly temperature anomaly pattern is warmer than normal in the Northern Plains where the AO teleconnections are warm, but there is no agreement elsewhere. The upper-level circulation anomaly pattern agrees over northeast Canada to southern Greenland but does not match everywhere else. The precipitation anomaly pattern does not match.
- The North Atlantic Oscillation (NAO) pattern
- Description: The NAO teleconnection pattern relates upper-level circulation over the North Atlantic Ocean to circulation features over the Northern Hemisphere mid-latitudes.
- Status: The daily NAO index was positive throughout the month, averaging positive for the month. The 3-month-averaged index was positive.
- Teleconnections (influence on weather): To the extent teleconnections are known, a positive NAO during this time of year (January on the teleconnection maps) is associated with drier-than-normal conditions in parts of the West (although the teleconnections are weak for precipitation), warmer-than-normal temperatures east of the Rockies, no temperature correlation across the West, positive upper-level circulation anomalies across the North Atlantic and most of the CONUS, and negative upper-level circulation anomalies over the Canadian Archipelago and Greenland.
- Comparison to Observed: The January 2015 precipitation anomaly pattern agrees with that for a positive NAO over the Far West (but there is little correlation elsewhere). The monthly temperature anomaly pattern is opposite that expected with a positive NAO. The upper-level circulation anomaly pattern agrees over the North Atlantic but not over North America.
- The West Pacific (WP) pattern
- Description: The WP teleconnection pattern is a primary mode of low-frequency variability over the North Pacific and reflects zonal and meridional variations in the location and intensity of the (East Asian) jet stream in the western Pacific.
- Status: The monthly WP index was slightly negative for the month, and the three-month average WP index was near zero after being negative for the last 12 to 18 months.
- Teleconnections (influence on weather): To the extent teleconnections are known, a negative WP during this time of year (January on the maps) is typically associated with above-normal temperatures in the West, below-normal temperatures in the Midwest to Northeast, drier-than-normal conditions from the Southern Plains to Midwest, and above-normal circulation anomalies over the western CONUS and above-normal circulation anomalies over the eastern CONUS to southeastern Canada (although the precipitation and circulation teleconnections are weak).
- Comparison to Observed: The January 2015 monthly temperature anomaly pattern matches that expected for a negative WP over the CONUS. The precipitation anomaly pattern agrees where teleconnections exist. The upper-level circulation anomaly pattern agrees over the western CONUS but not eastern CONUS.
- The Tropical/Northern Hemisphere (TNH) pattern
- Description: The TNH teleconnection pattern reflects large-scale changes in both the location and eastward extent of the Pacific jet stream, and also in the strength and position of the climatological mean Hudson Bay Low, and is dominant in the winter months. The pattern significantly modulates the flow of marine air into North America, as well as the southward transport of cold Canadian air into the north-central United States.
- Status: The TNH index was near zero (but slightly positive) during January.
- Teleconnections (influence on weather): To the extent teleconnections are known, a positive TNH is typically associated with colder-than-normal temperatures for much of the country, drier-than-normal conditions in the West, and slightly wetter-than-normal conditions in the Tennessee Valley. The upper-level circulation anomalies for a positive TNH are below-normal 500-mb geopotential heights over the eastern two-thirds of Canada and the north central U.S., and above-normal heights over the northeastern Pacific and Gulf of Mexico into the western North Atlantic.
- Observed: The January 2015 monthly precipitation anomaly pattern agrees with that for a positive TNH in the western CONUS, and the upper-level circulation anomaly pattern matches over eastern Canada, but both do not match elsewhere. The temperature anomaly pattern is opposite that expected with a positive TNH.
- The East Pacific-North Pacific (EP-NP) pattern
- Description: The EP-NP teleconnection pattern relates SST and upper-level circulation patterns (geopotential height anomalies) over the eastern and northern Pacific to temperature, precipitation, and circulation anomalies downstream over North America. Its influence during the winter is not as strong as during the other three seasons.
- Status: The magnitude of the warmth of the SSTs in the northeastern North Pacific increased slightly this month, with the January SST pattern still showing above-normal SSTs along the North American coast and near-normal to slightly cooler-than-normal SSTs to the west. The monthly EP-NP index was positive during January, keeping the 3-month running mean well in positive territory.
- Teleconnections (influence on weather): To the extent teleconnections are known, a positive EP-NP index during this time of year (between October and April on the maps) is typically associated with colder-than-normal temperatures east of the Rockies, warmer-than-normal temperatures across the extreme West Coast and in Alaska, drier-than-normal conditions in the Northwest and wetter than normal in southern Alaska (although the precipitation teleconnections are very weak), above-normal upper-level circulation anomalies (stronger upper-level ridge) over Alaska and western Canada and into the western CONUS, and below-normal upper-level circulation anomalies (stronger upper-level trough) over the northeastern CONUS and eastern Canada.
- Comparison to Observed: The January 2015 upper-level circulation anomaly pattern agrees very well with a positive EP-NP pattern, with the above-normal anomalies spread even further into the CONUS. The January temperature anomaly pattern generally matches, although the warm and cold temperature anomalies are spread further east than indicated on the teleconnection maps. The precipitation anomaly pattern shows some agreement but few teleconnections exist.
Examination of these circulation indices and their teleconnection patterns, and comparison to observed January 2015 temperature, precipitation, and circulation anomaly patterns, suggest that the weather over the CONUS in January reflected influences from the Pacific. The EP-NP, WP, and PNA teleconnection indices had the strongest agreement with the January observations. Elements of the circulation anomalies matched the teleconnections for the PNA and WP, but had the best agreement with the EP-NP. The temperature anomaly pattern appeared to be a combination of those expected from the PNA, WP, and EP-NP. Elements of the NAO and TNH could be seen in the circulation anomaly pattern, so they may have had some influence but it would have been minor. Precipitation correlations are weak, but the WP and PNA appeared to have the greatest influence, with possible influence from the TNH and NAO and even the MJO on a weekly time scale. ENSO was officially neutral because of the disconnect between the oceanic and atmospheric indicators. There was some agreement between the January temperature and precipitation anomaly patterns and those expected with an El Niño, but the similarity could simply be coincidence and due to other factors.
This month illustrates how the weather and climate anomaly patterns can reflect the influence of one primary atmospheric driver (or mode of atmospheric variability), as seen in the temperature and circulation patterns, with other drivers exerting a limited influence.