Note: This Synoptic Discussion describes recent weather events and climate anomalies in relation to the phenomena that cause the weather. These phenomena include the jet stream, fronts and low pressure systems that bring precipitation, high pressure systems that bring dry weather, and the mechanisms which control these features — such as El Niño, La Niña, and other oceanic and atmospheric drivers (PNA, NAO, AO, and others). The report may contain more technical language than other components of the State of the Climate series.
Summary
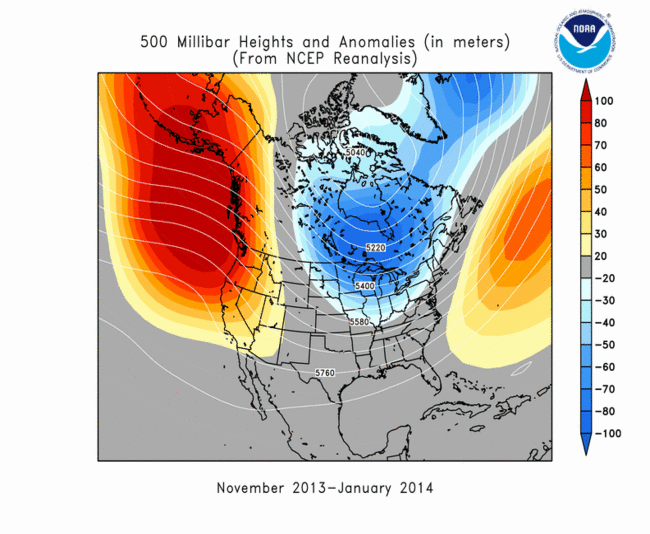
The January 2014 circulation pattern over North America was a continuation of the pattern seen in December and consisted of a dominant upper-level ridge over the eastern North Pacific and western North America with a trough over eastern North America. This pattern is most closely associated with the positive phase of the East Pacific-North Pacific mode of circulation, whose teleconnections include colder-than-normal temperatures across the United States east of the Rockies and warmer-than-normal temperatures along the West Coast, although signs of the influence of other modes of circulation were evident. The combination of cold and moist air masses produced frequent winter storm systems east of the Rockies, while deficient precipitation and snow pack in the West intensified drought conditions. See below for details.
Synoptic Discussion
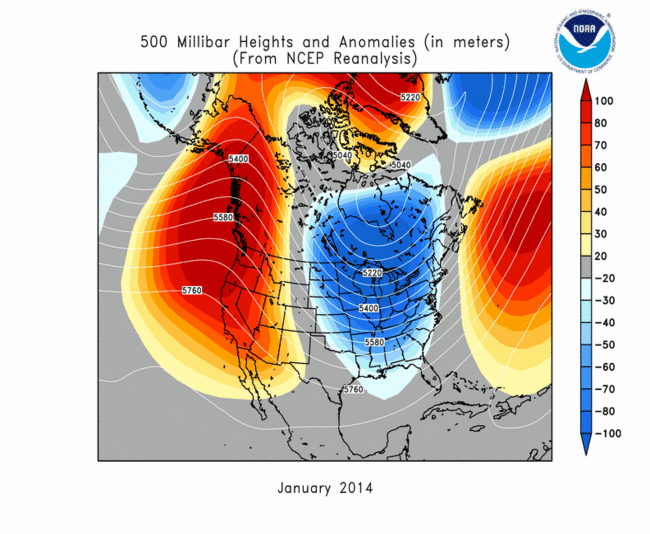
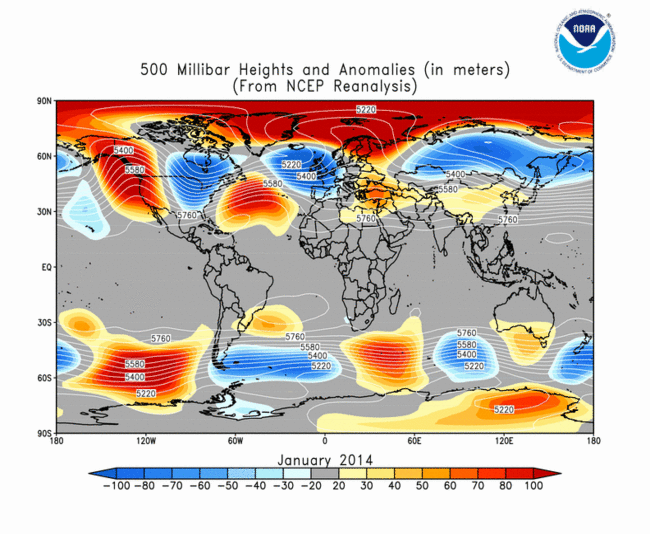
Monthly upper-level circulation pattern and anomalies.
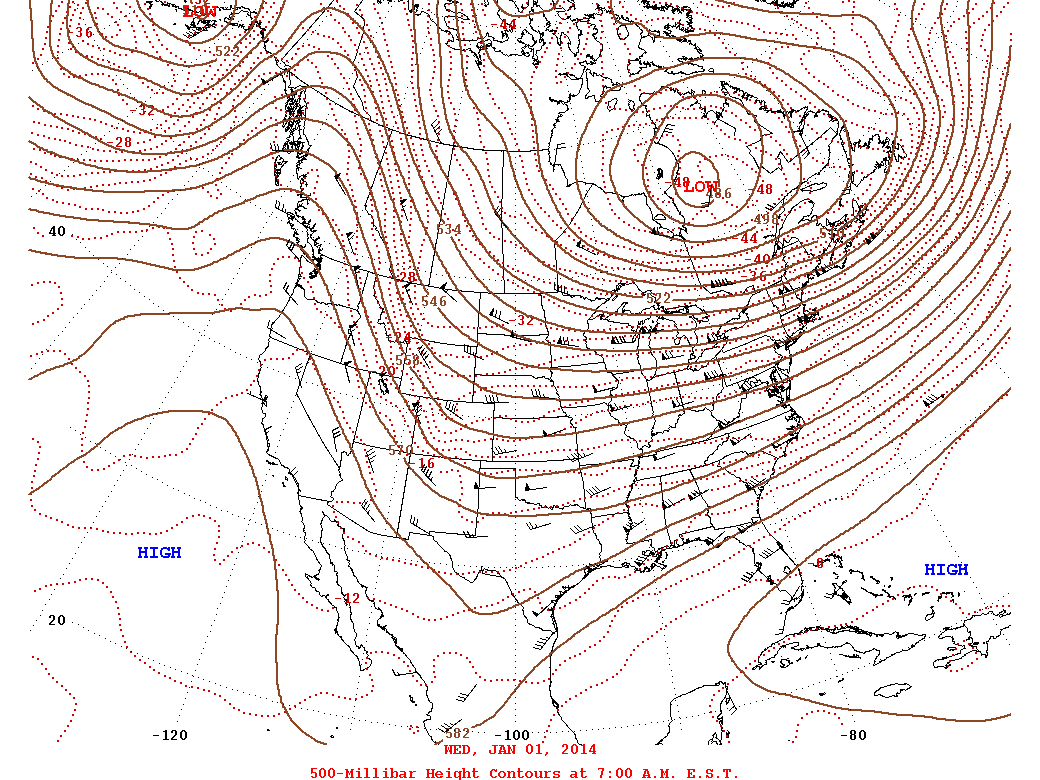
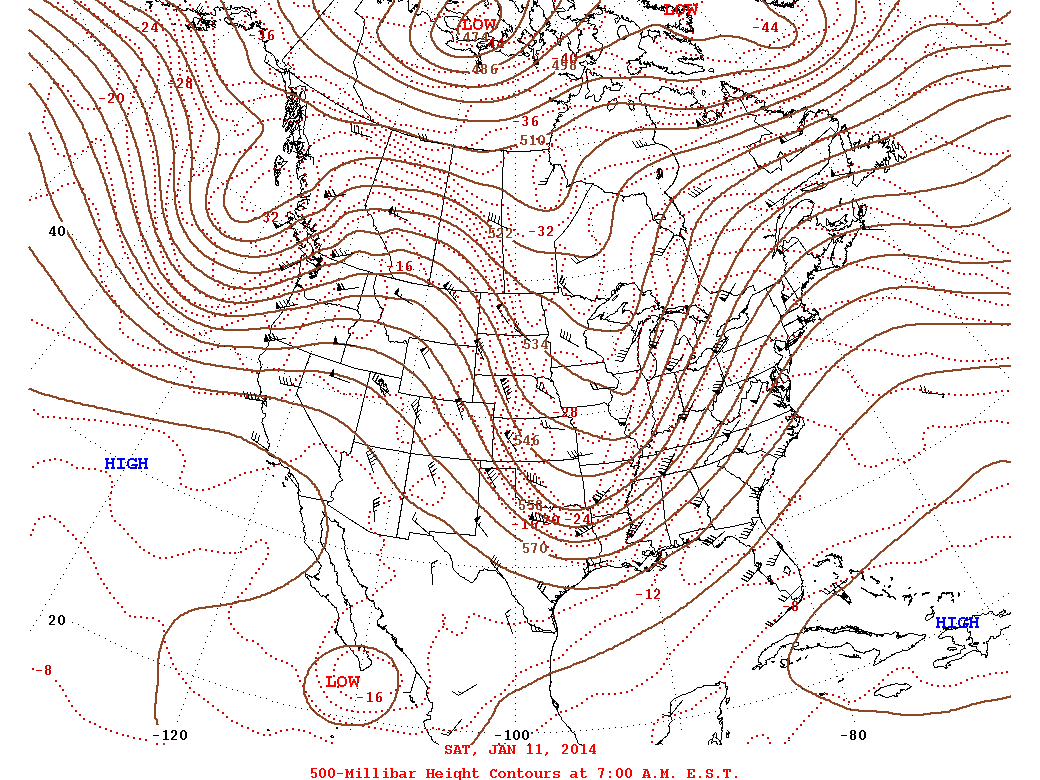
In the Northern Hemisphere, January is deep in the midst of climatological winter which is the time of year when the jet stream and circumpolar vortex are most active and furthest south, spreading polar and arctic air masses from the north across the United States. The upper-level circulation consisted of a long-wave ridge over the eastern North Pacific and western coast of North America, and a long-wave trough over eastern North America, with many wiggles, or short-wave troughs and ridges, migrating through the flow. When integrated across the month, the circulation produced a pattern of above-normal 500-mb heights (stronger-than-normal long-wave ridge) in the eastern North Pacific Ocean and western North America, from Alaska to California. Below-normal 500-mb heights (stronger-than-normal long-wave trough) dominated eastern North America.
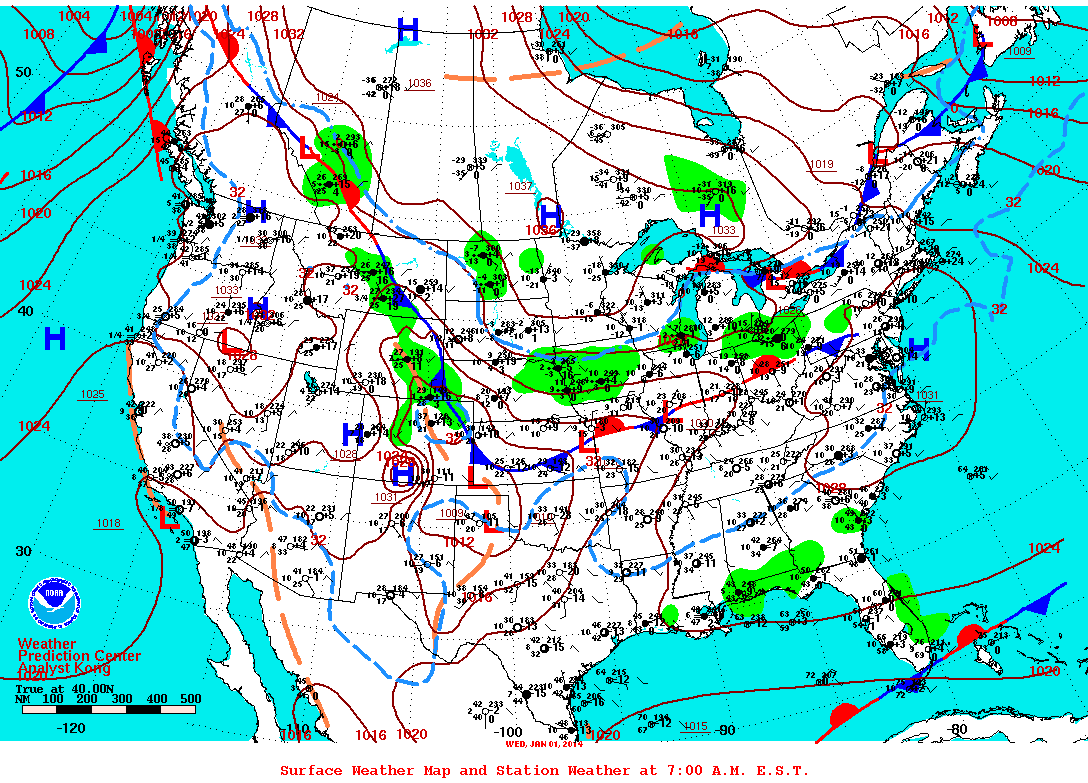
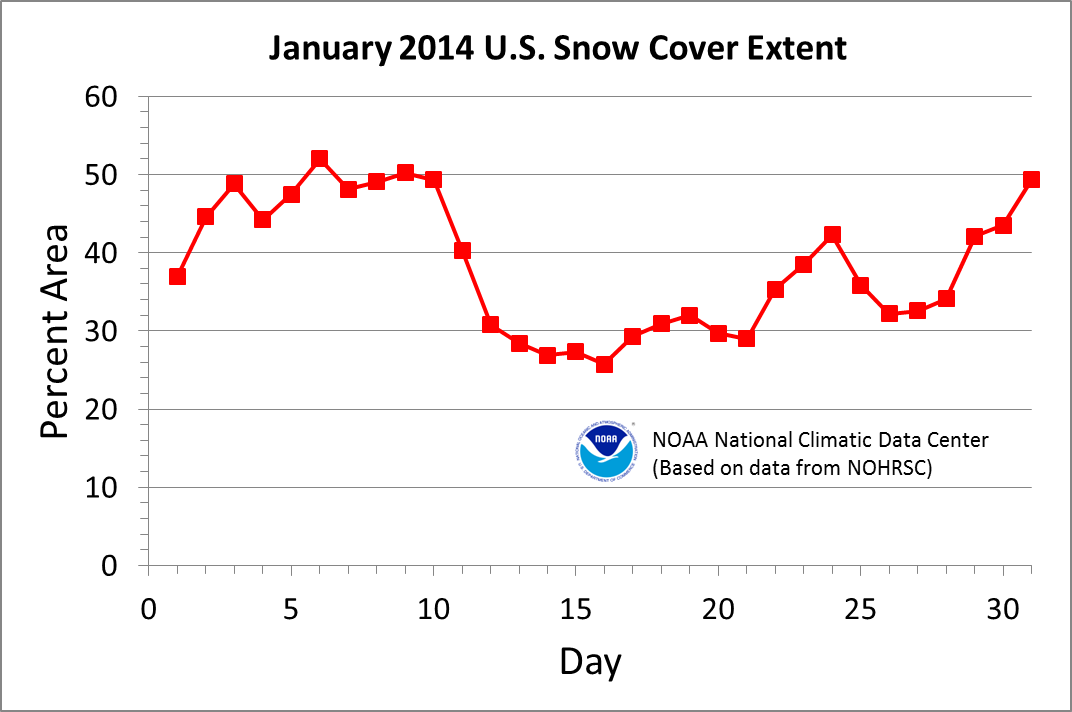
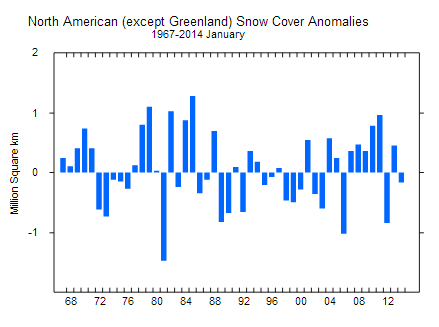
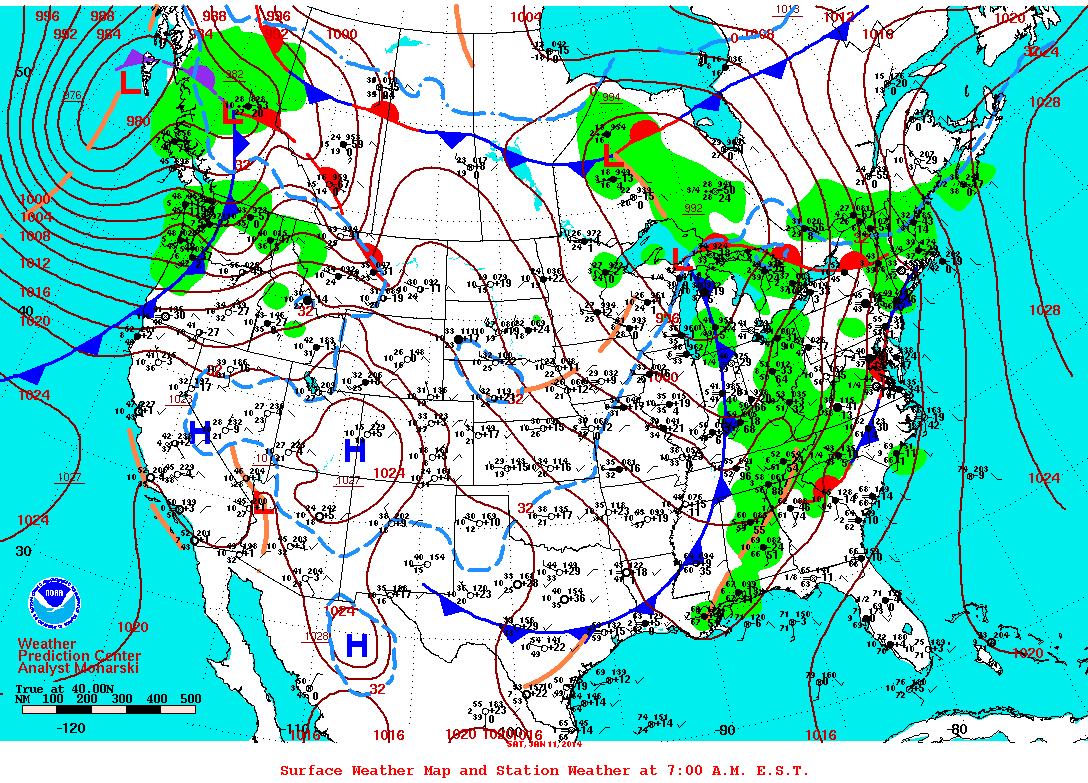
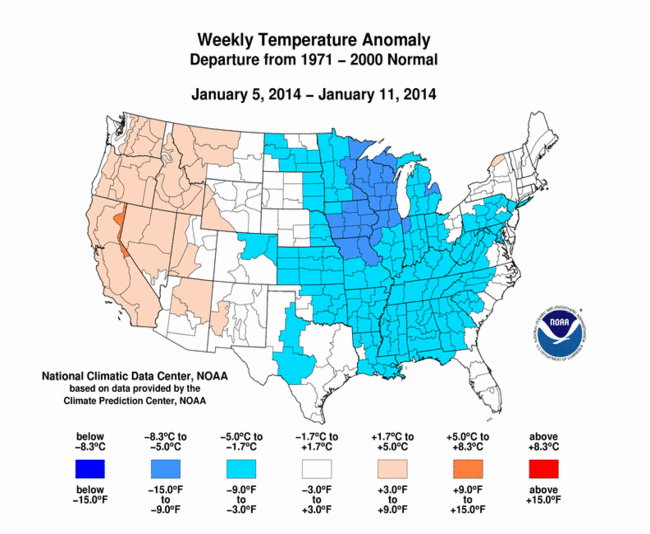
For January 2014, the jet stream was very active with several upper-level short-wave troughs bringing another month of cold and wet weather to parts of the country. Low pressure systems with strong cold fronts accompanied these short-wave troughs. These systems drew in moisture from the Gulf of Mexico to produce areas of precipitation as they moved east of the Rockies. Where the moisture was entrained into sub-freezing air, wintry precipitation occurred. Several snowstorms expanded snow cover across the Lower 48 States, but the snow cover was light in some cases and quickly melted as warmer air displaced the cold air masses before the next snowstorm traversed the region, expanding the snow cover area again. The snow coverage peaked at 52.0 percent of the contiguous U.S. (CONUS) on January 6th, reached a low of 25.7 percent on the 16th, and ended the month at 49.4 percent, according to daily data from the National Weather Service's National Operational Hydrologic Remote Sensing Center. When integrated across the month, based on the 1967-2014 satellite snow cover record analyzed by the Rutgers University Global Snow Lab, January 2014 ranked as the 16th smallest (least extensive) January snow cover for the CONUS and 19th smallest for North America.
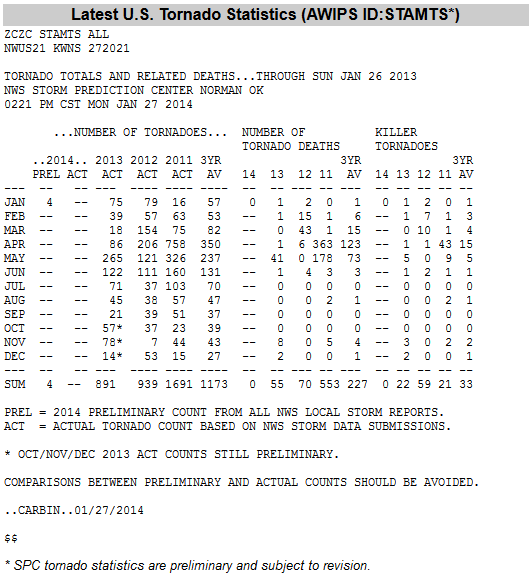
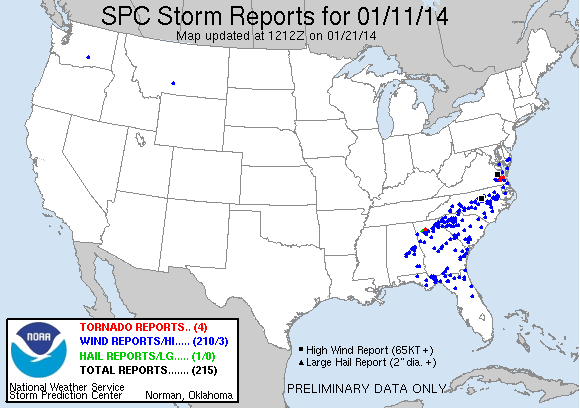
The short-wave trough on the 11th triggered four tornadoes and other severe weather along its associated cold front in the Southeast. But the dominance of cold dry air masses otherwise inhibited the occurrence of violent weather during the month, with the monthly total (preliminary) count of four tornadoes comparing to the climatological average of 35 for January.
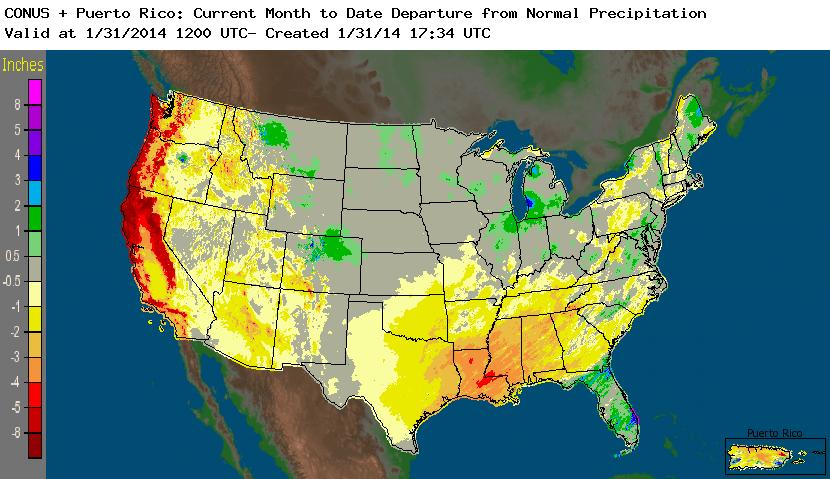
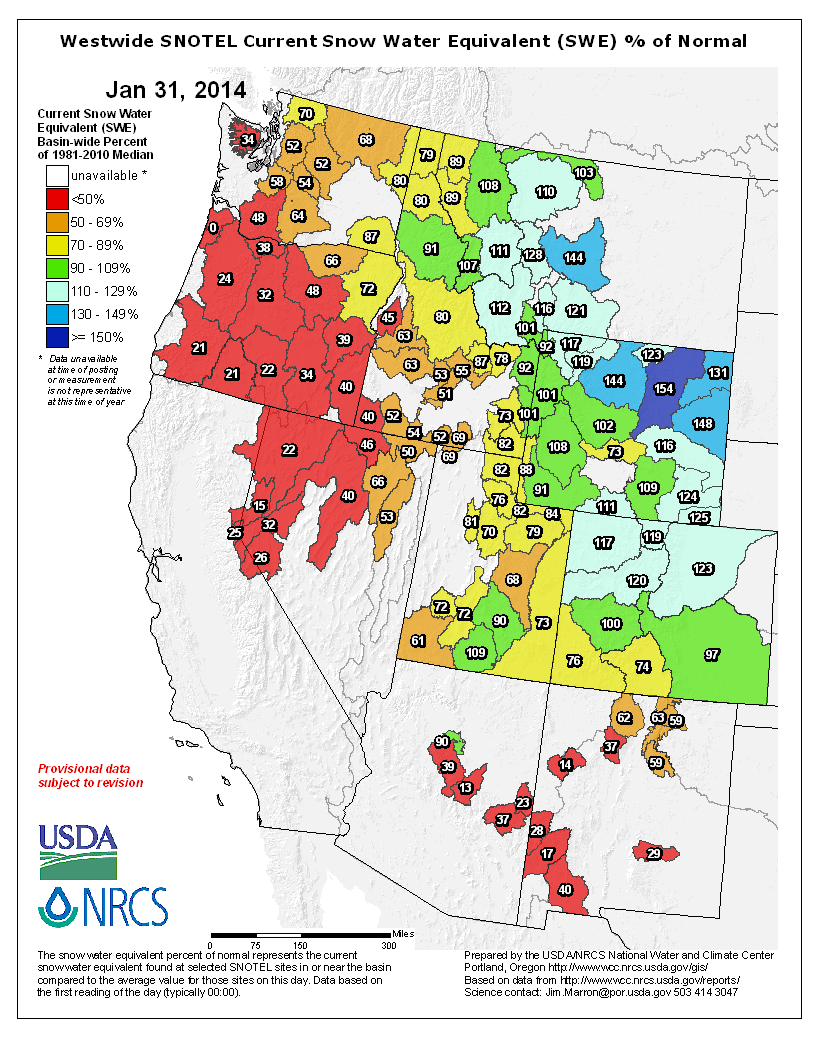
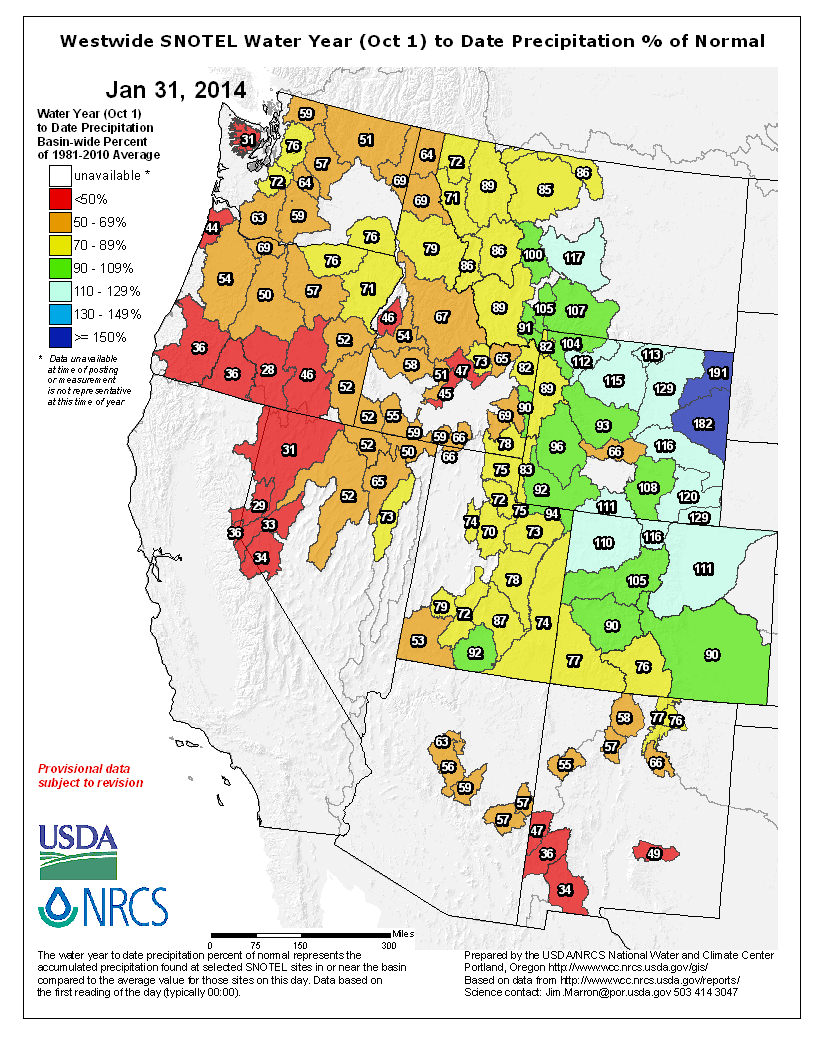
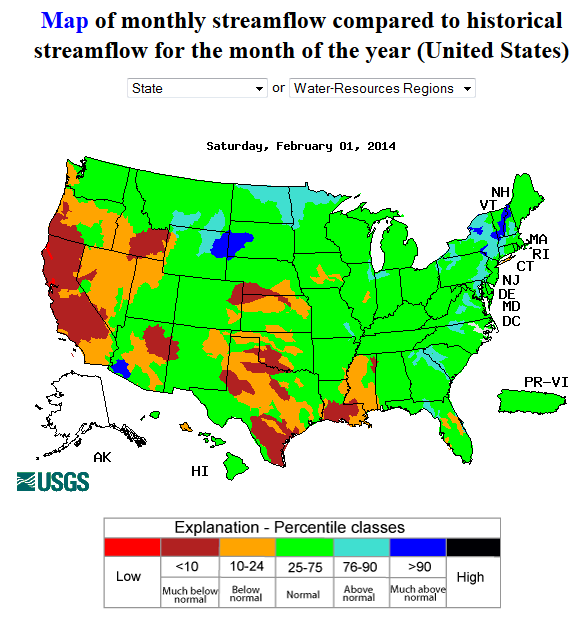
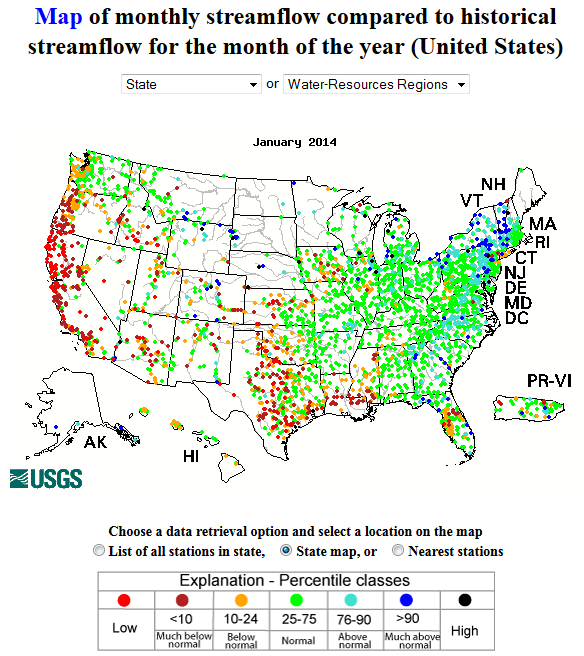
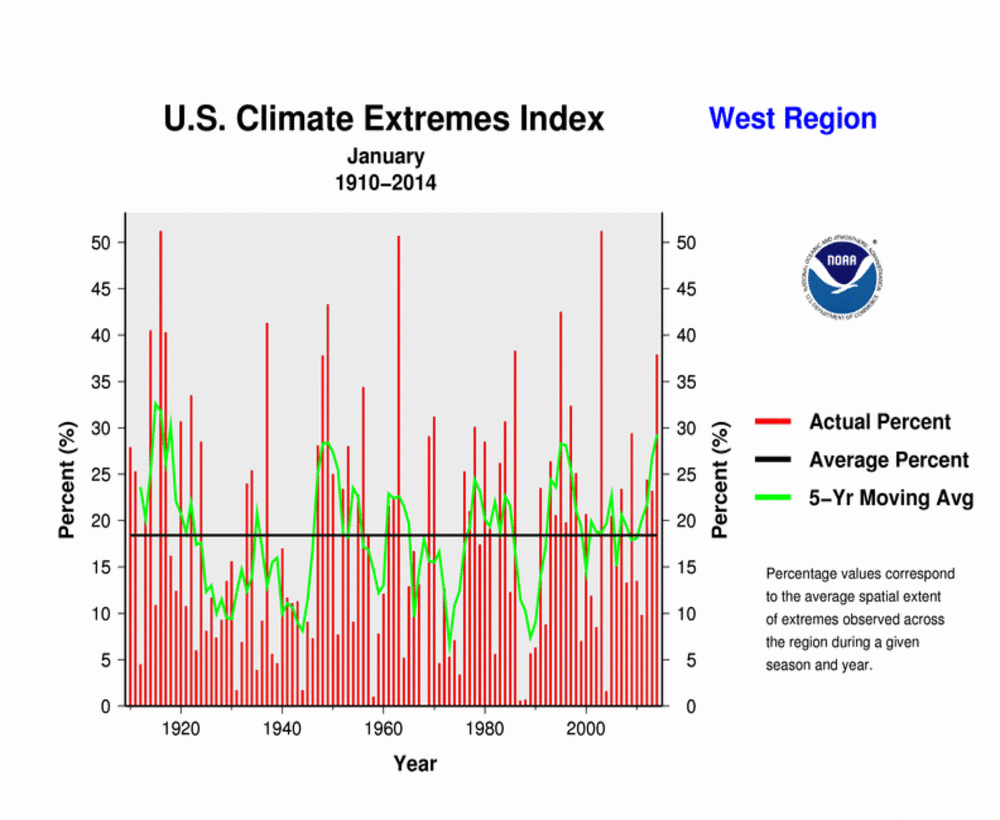
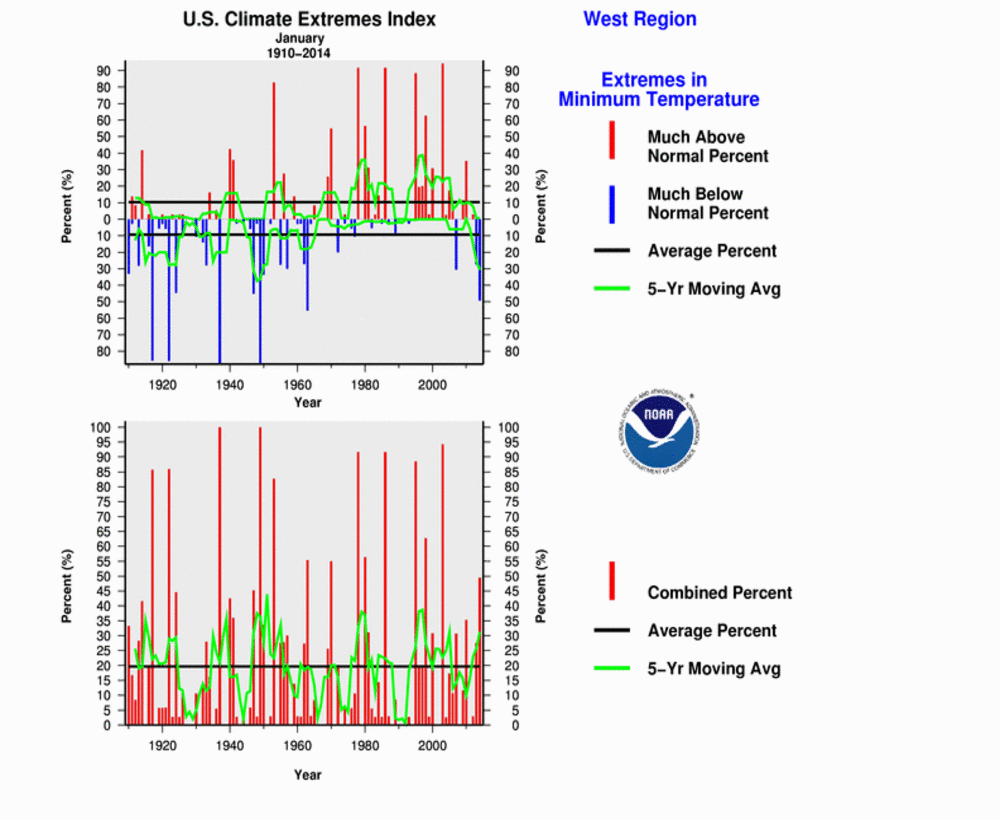
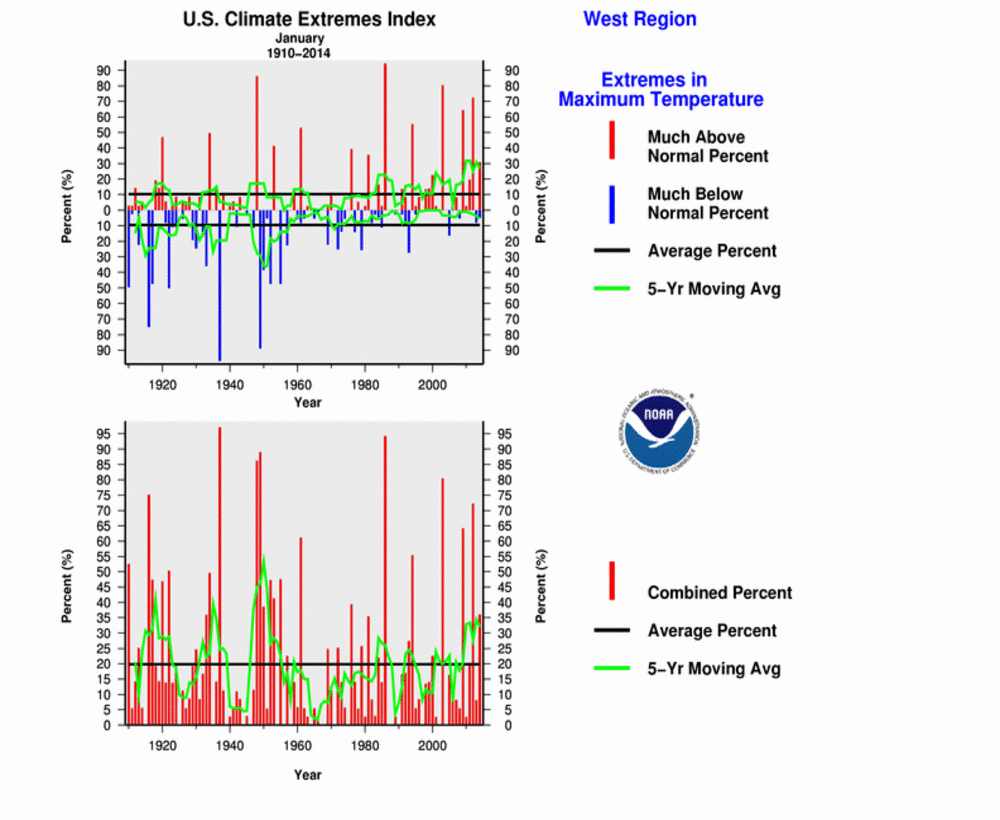
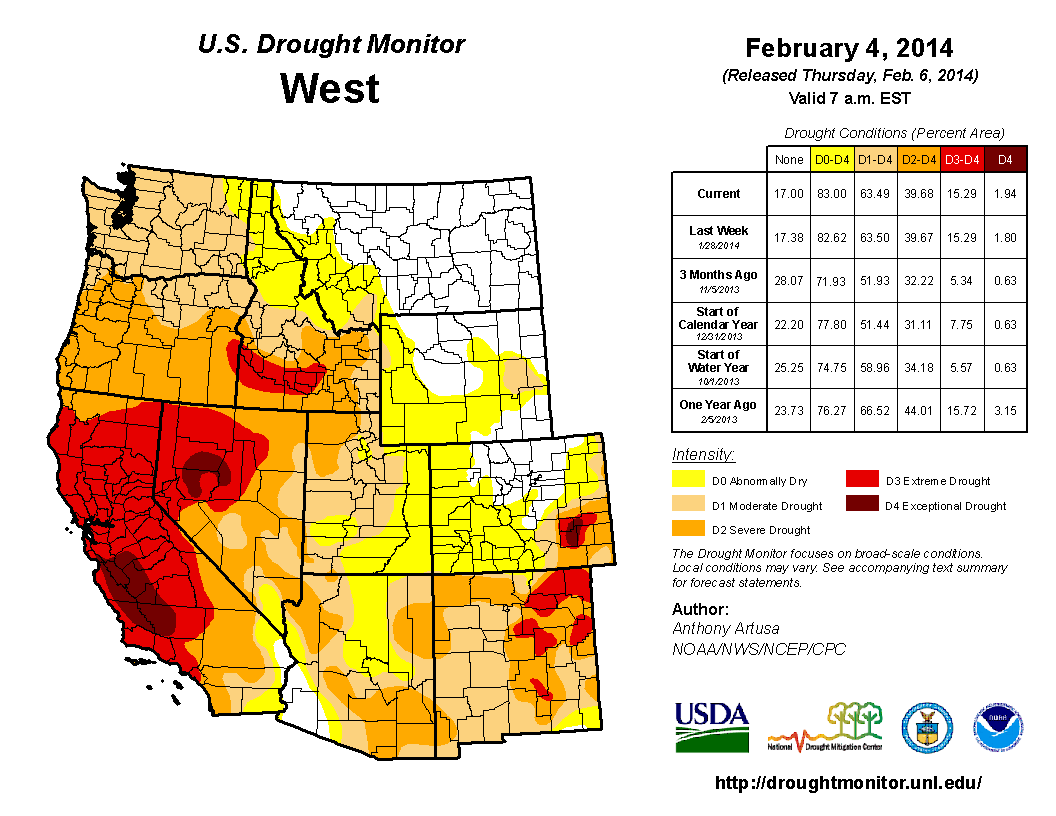
The upper-level long-wave ridge over the eastern North Pacific redirected weather systems into Alaska and created a northwesterly flow in the circulation over the western CONUS which inhibited the formation of massive winter storms in the West for most of January. A short-wave trough broke through the ridge near the end of the month, bringing welcome rain and snow to the West, but the precipitation was not enough to make up for deficits which had accumulated throughout January, which is normally one of the wettest months of the year. As a result, both total precipitation and the mountain snowpack over the western U.S. were well below normal, both for the month and the water year to date (which began October 1), and streamflow was well below normal, especially along the West Coast where record low values were observed. The dry air and clear skies contributed to enhanced heating during the day and cooling during the night. The Climate Extremes Index (CEI) for the West ranked tenth biggest in the 1910-2014 record for January due to the dryness (most extreme drought area component, eighth most extreme days without precipitation component), cold nighttime temperatures (sixth most extreme cold minimum temperature component), and warm daytime temperatures (13th most extreme warm maximum temperature component).
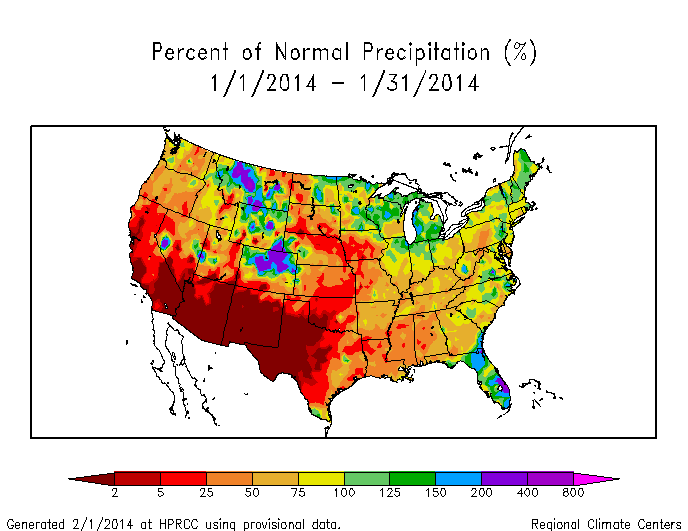
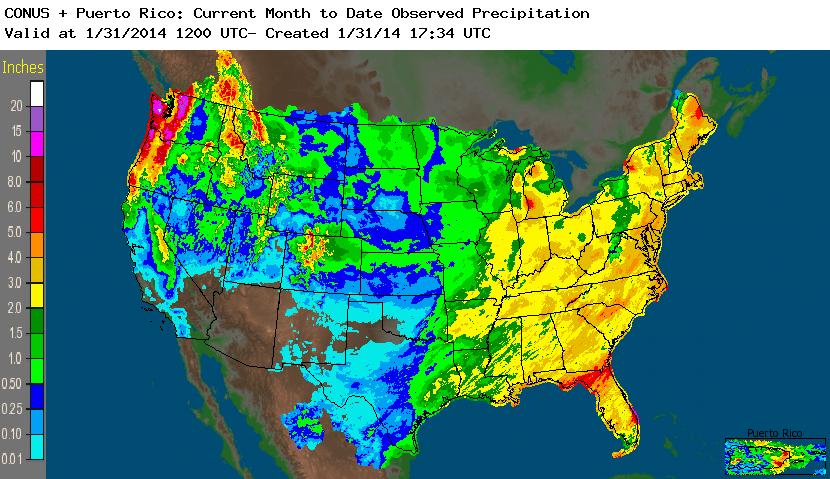
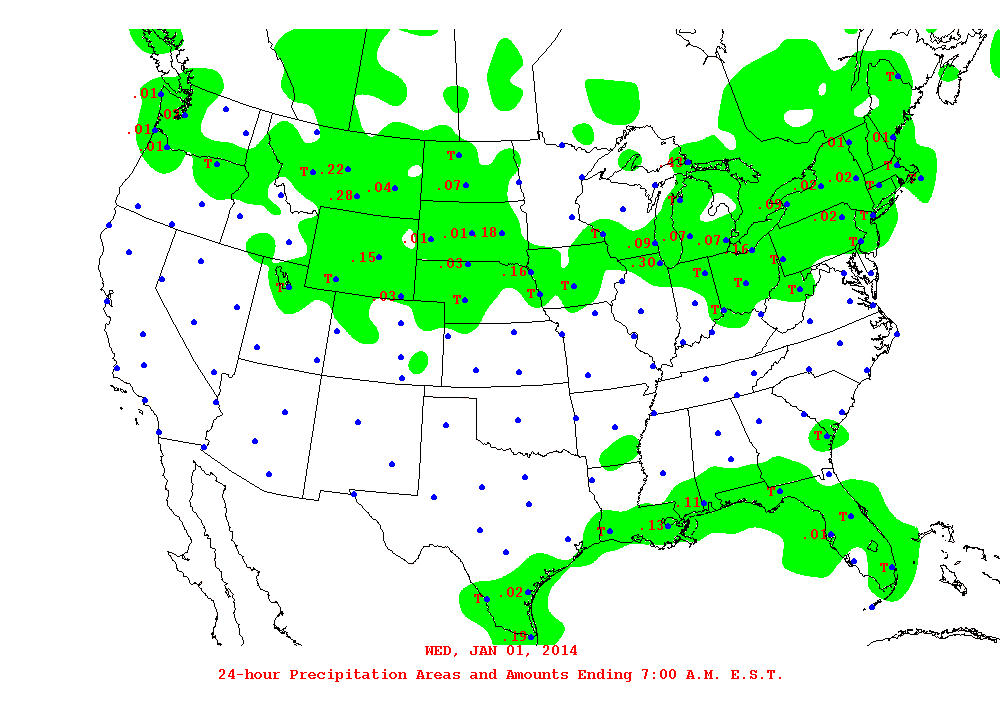
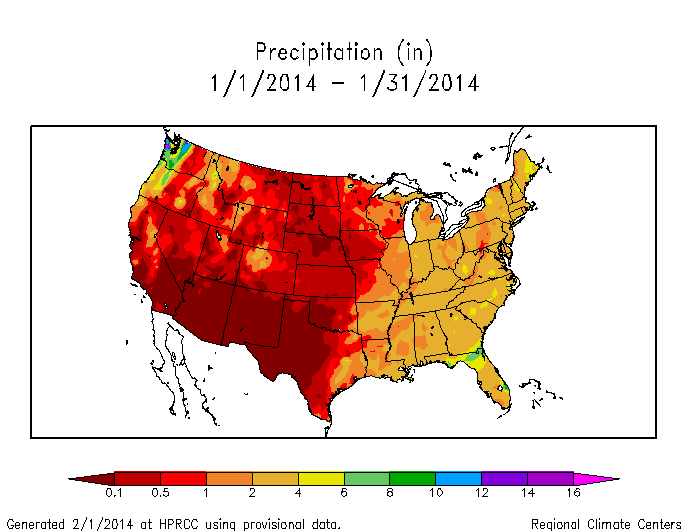
Map of monthly precipitation anomalies.
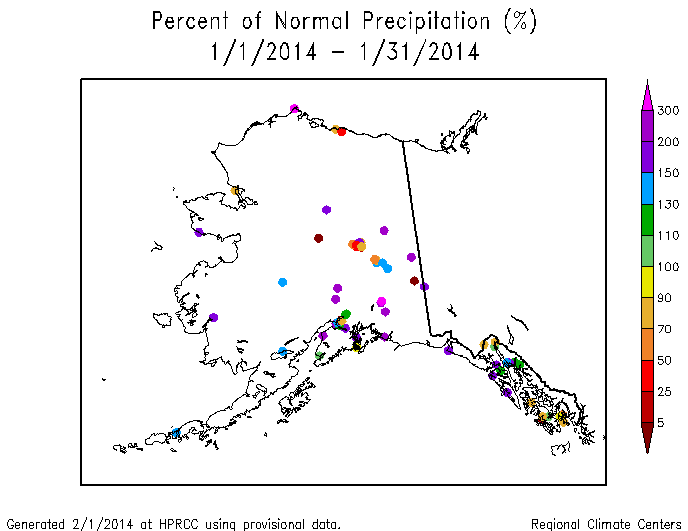
The storm track resulted in only a few areas with above-normal precipitation: the High Plains and eastern slopes of the Rockies from Montana to Colorado, the Great Lakes region, and parts of the East Coast. Essentially no precipitation fell across much of the Southwest into the Southern Plains, and monthly precipitation was below normal across the rest of the West and Great Plains, and much of the Deep South, Ohio Valley, and Appalachian chain. Most of Alaska was wetter than normal.
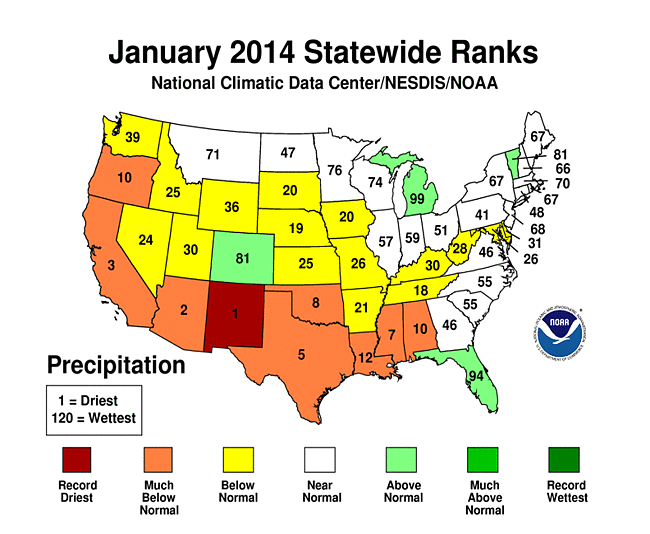
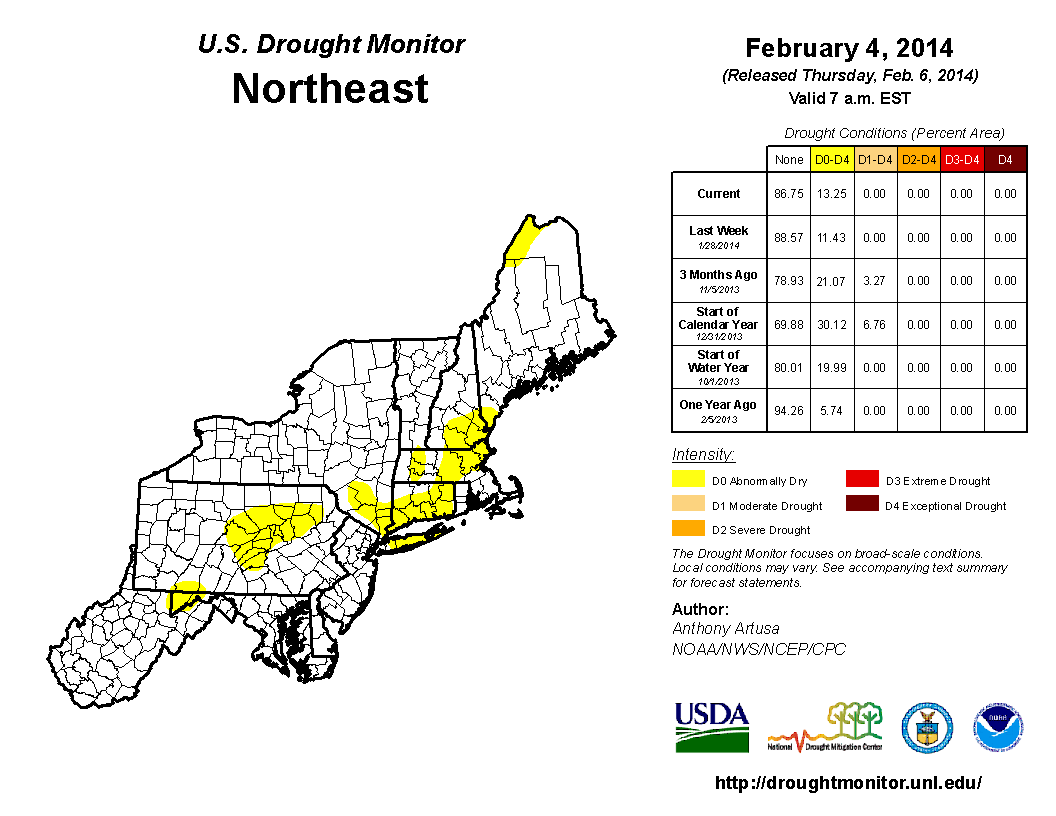
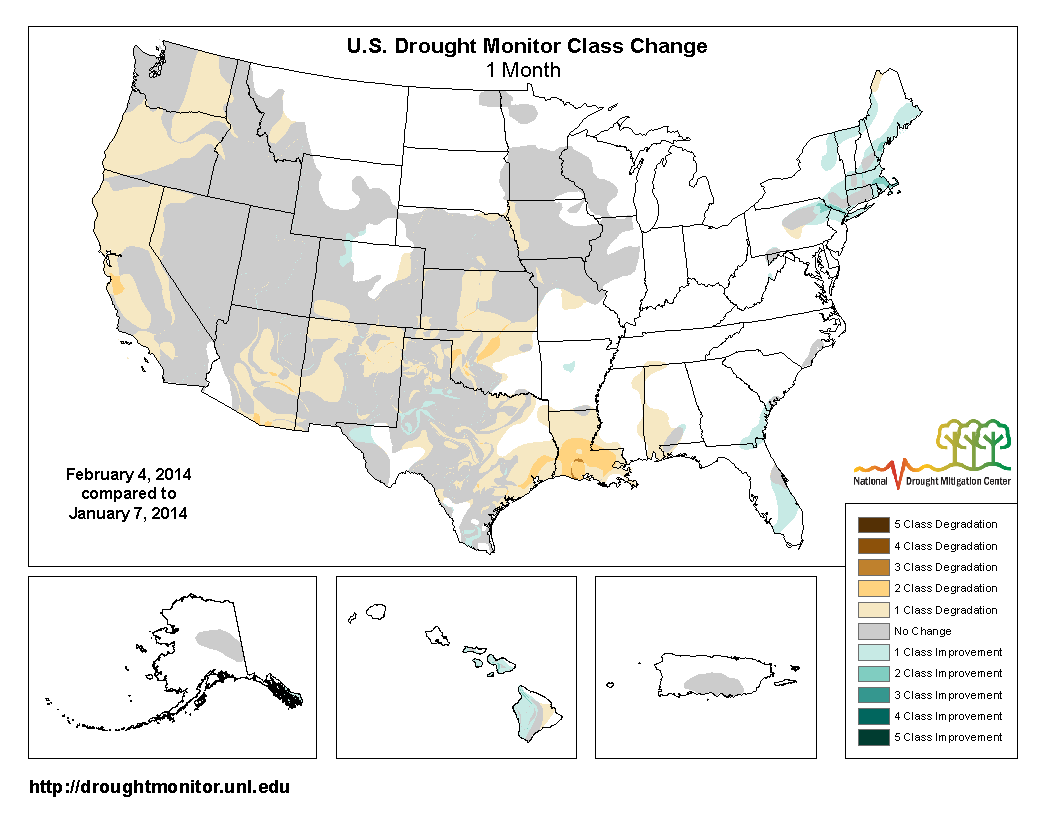
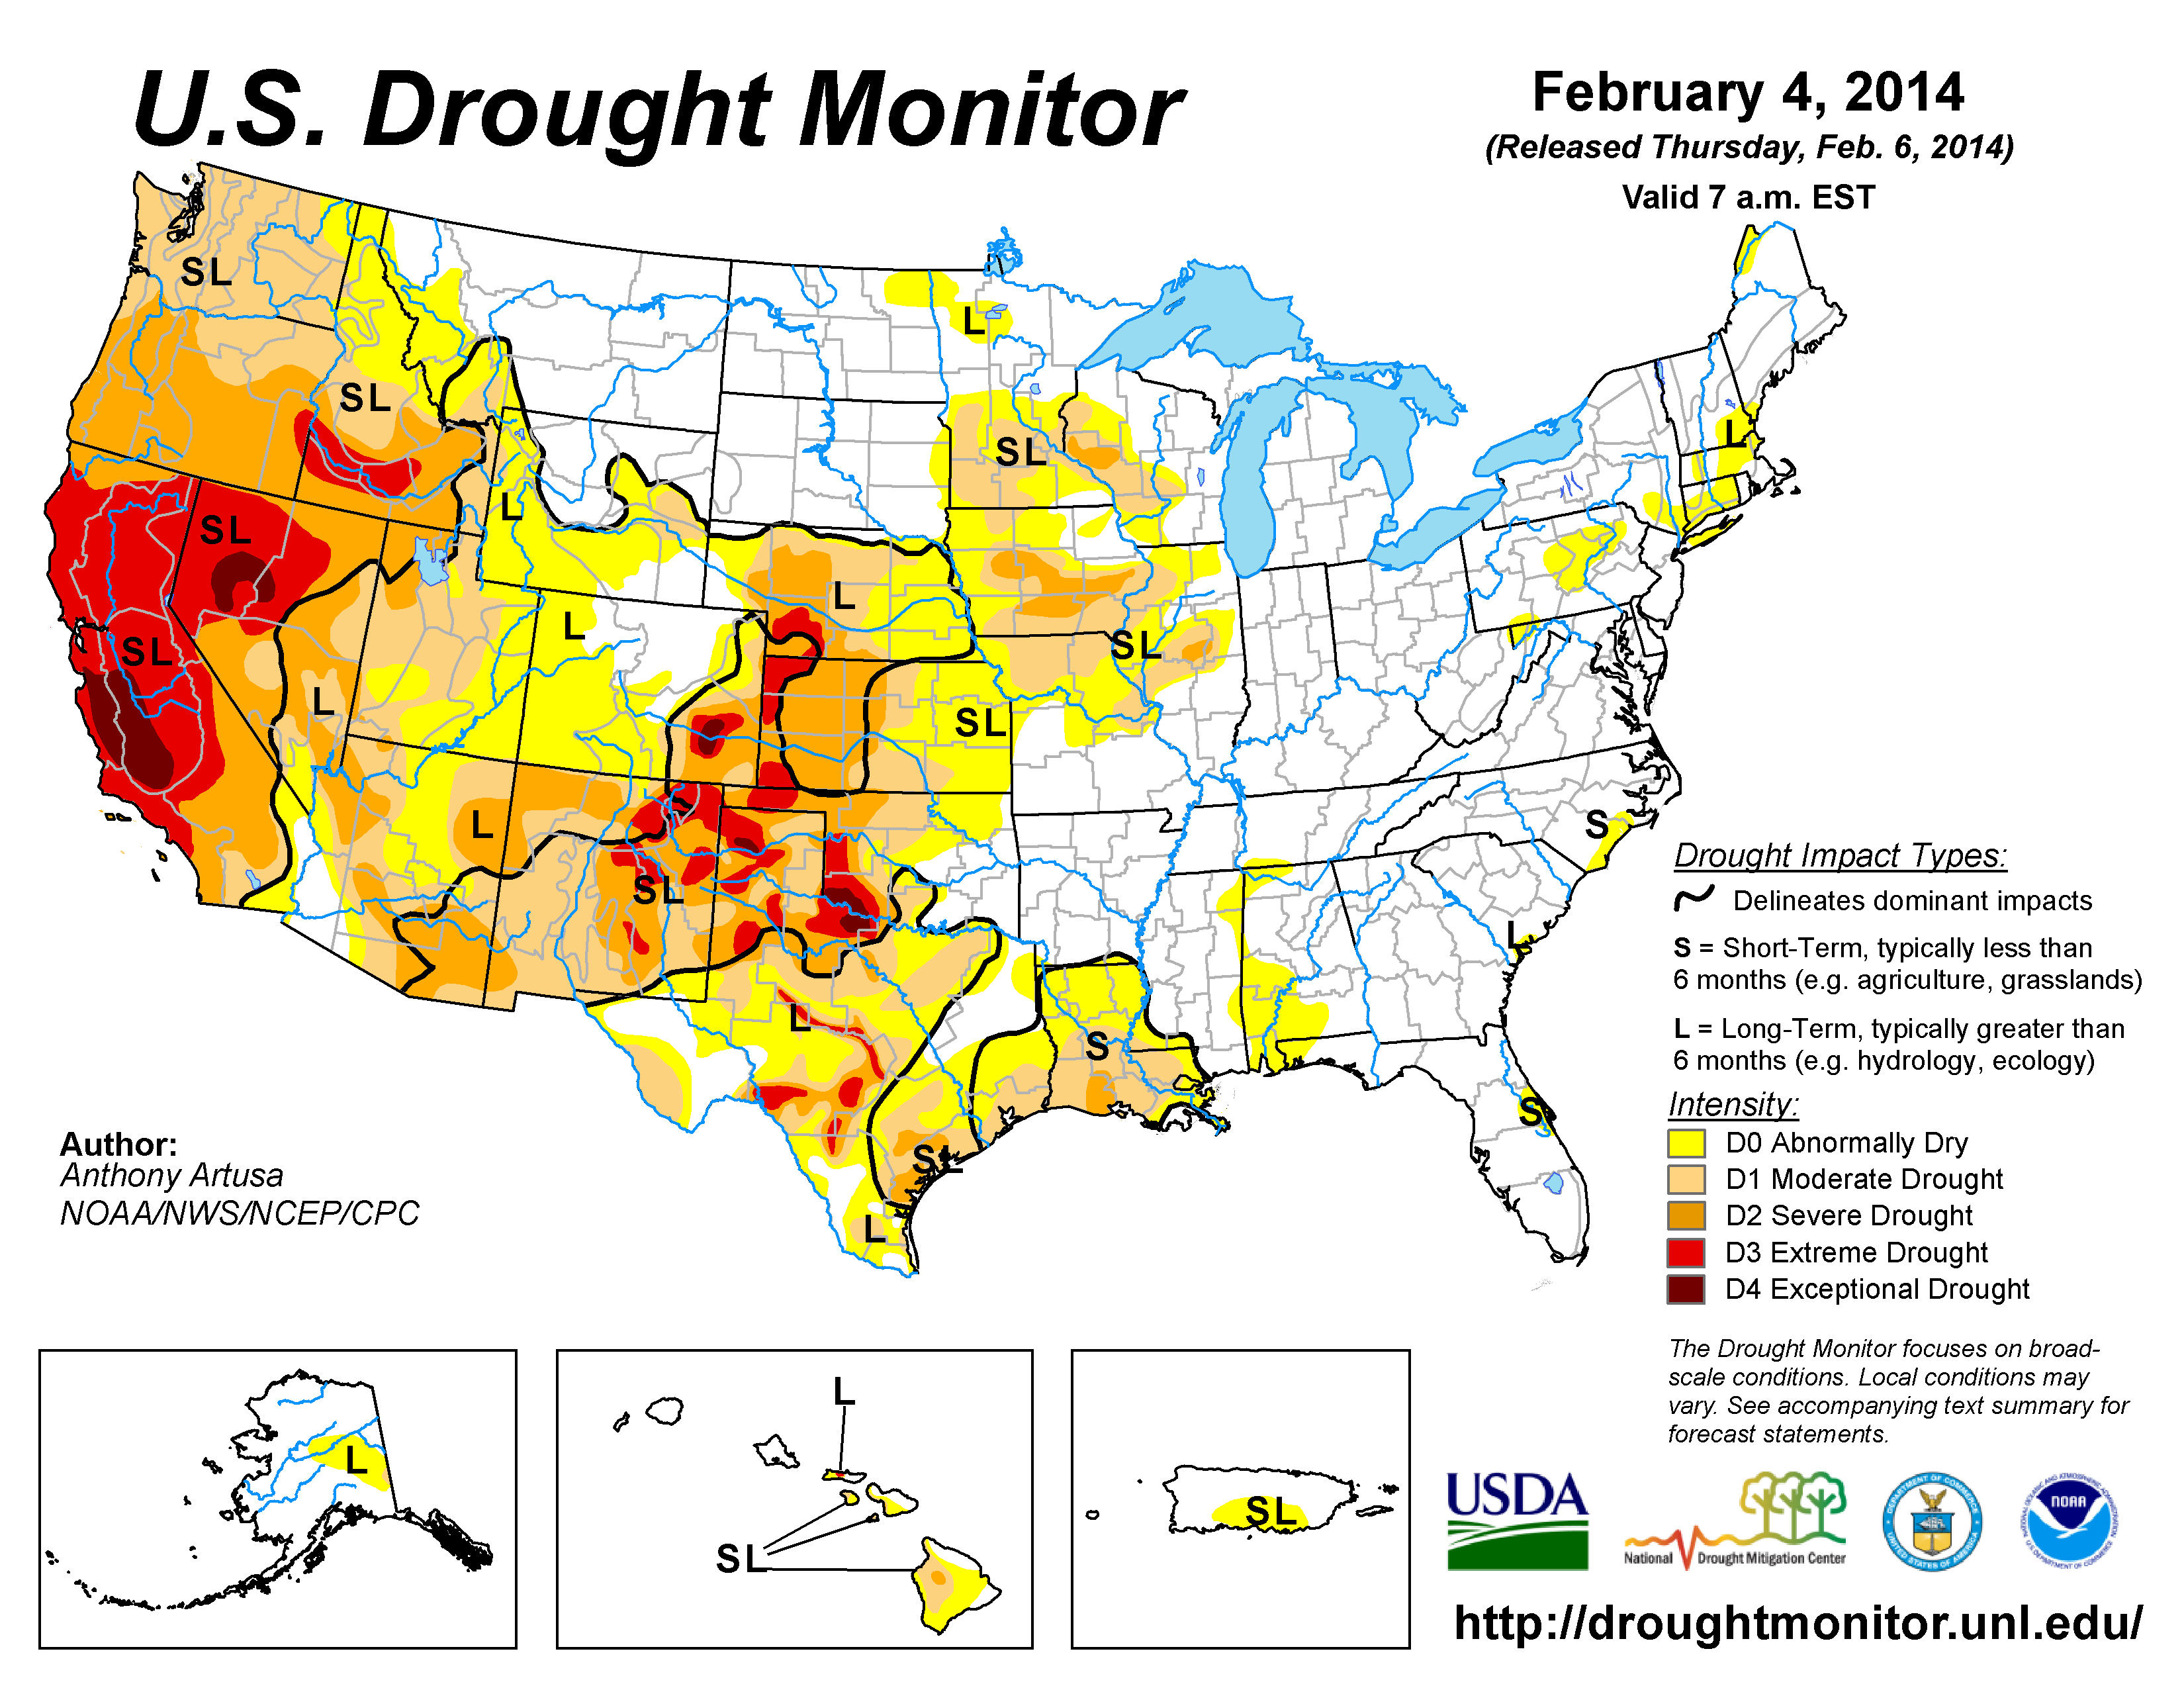
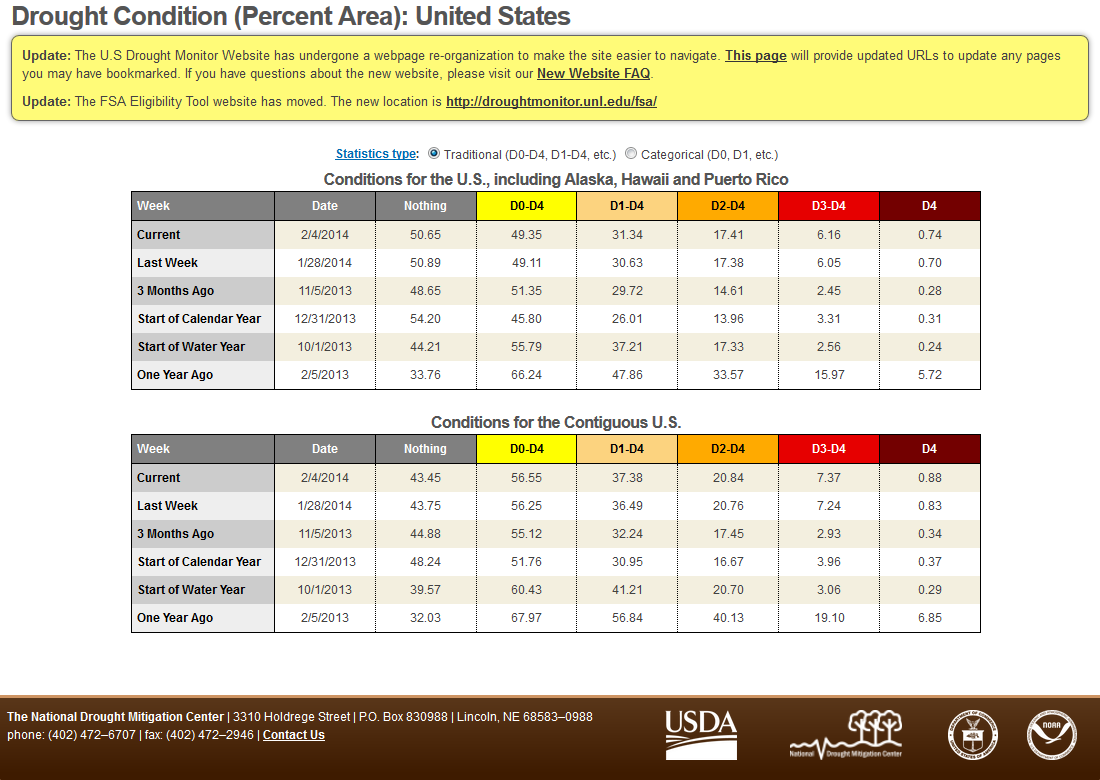
When integrated across the country, January 2014 ranked as the fifth driest January in the 1895-2014 record. Eight states in the West and South had the tenth driest, or drier, January, including New Mexico which ranked driest on record. Seventeen other states (mostly in the western and central U.S.) ranked in the driest third of the historical record, while only four ranked in the wettest third of the historical record. The precipitation eliminated drought in the Northeast, but January's dryness expanded drought in the Central and Southern Plains and West. On balance, the national drought footprint expanded to 31.3 percent of the U.S. as a whole (according to U.S. Drought Monitor statistics).
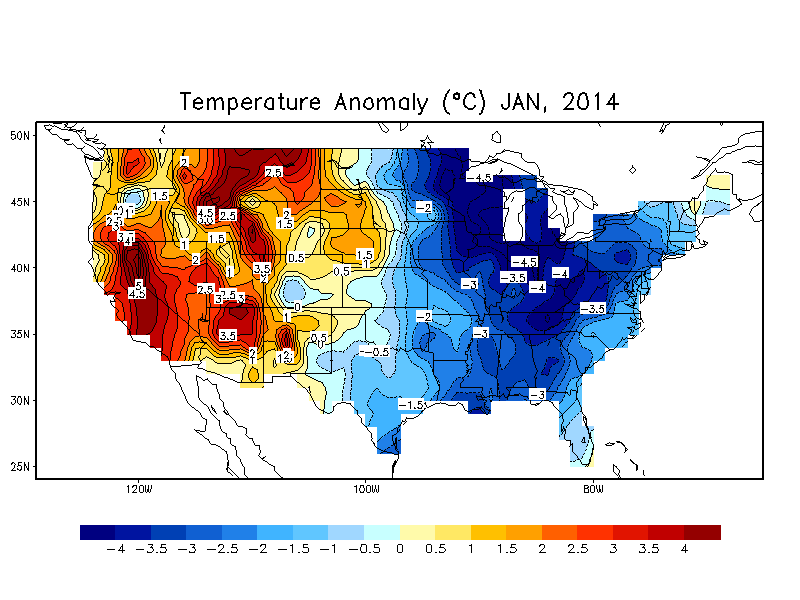
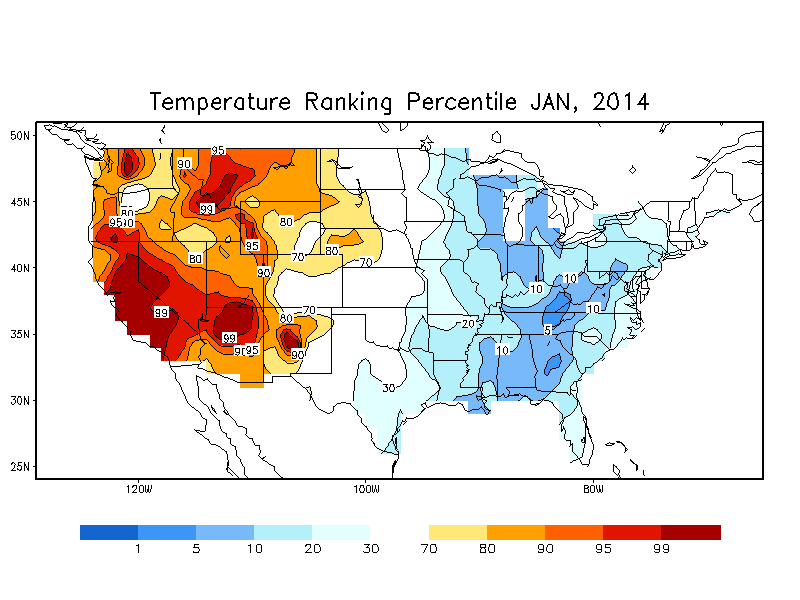
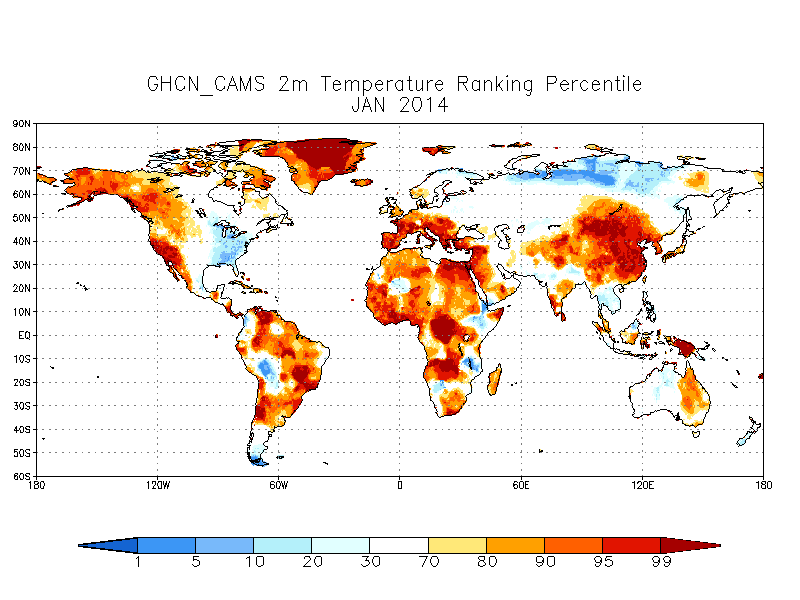
Map of monthly temperature anomalies.
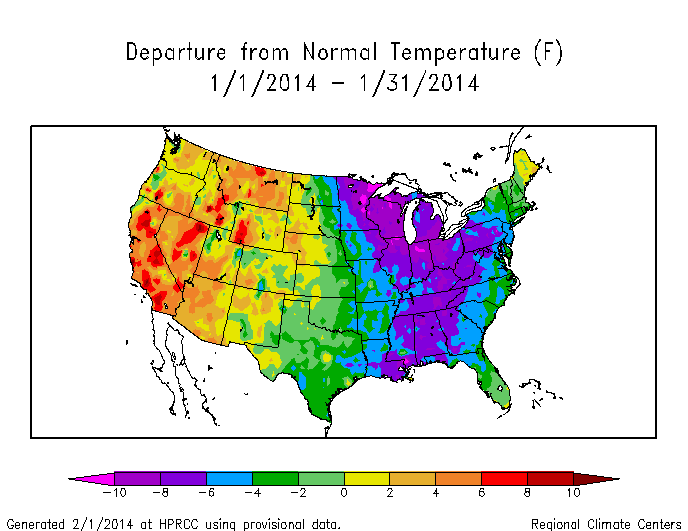
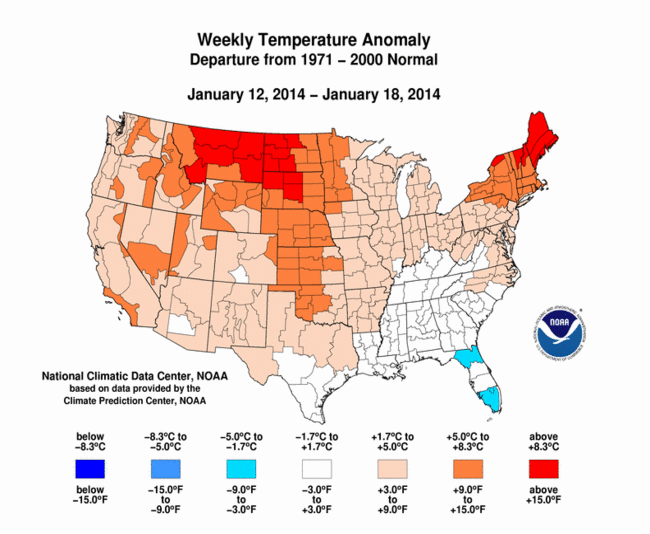
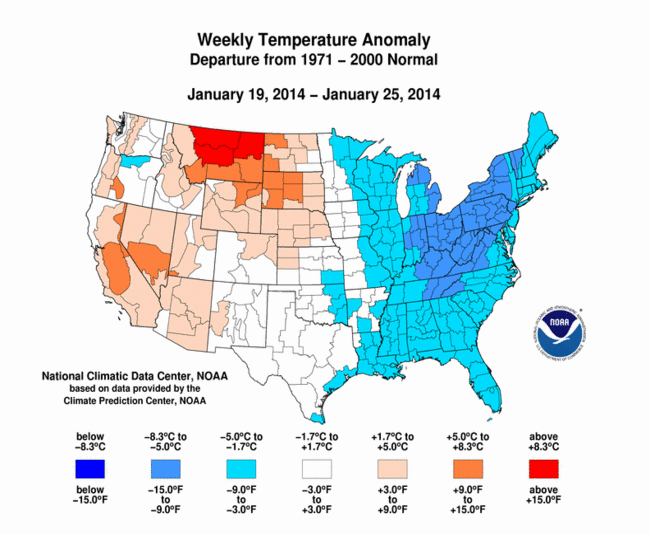
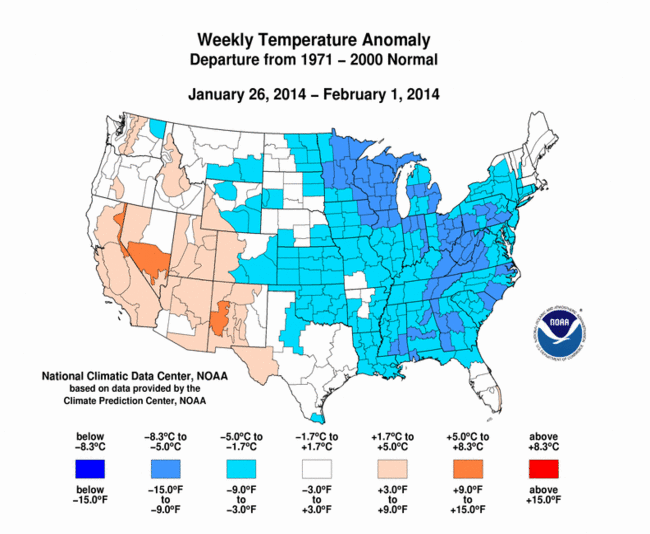
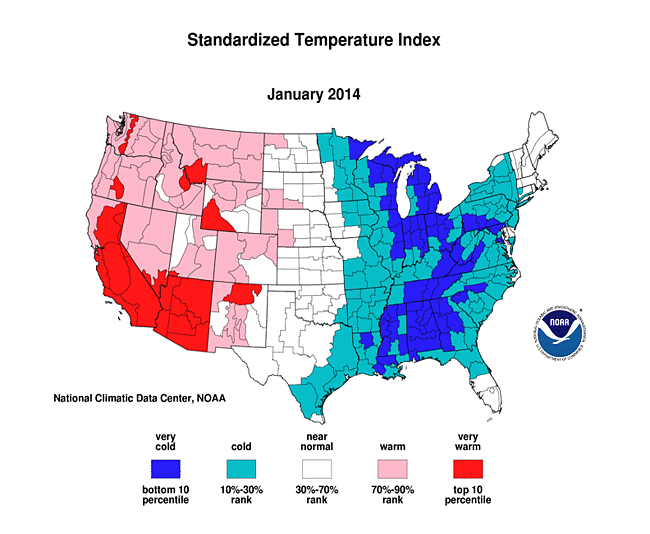
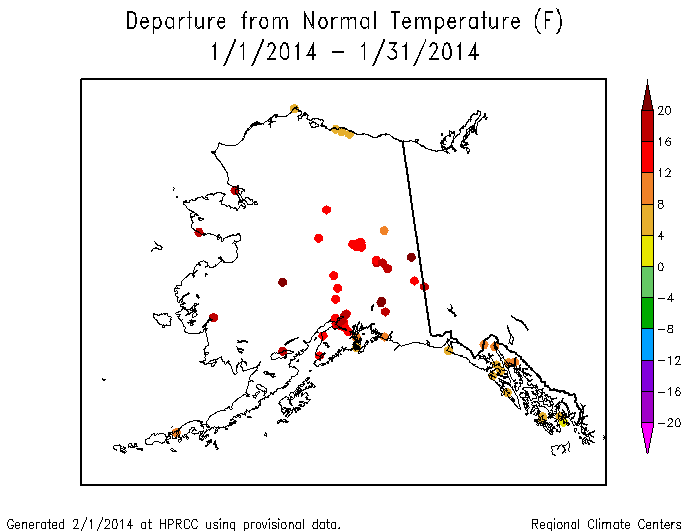
The long-wave circulation pattern (ridge over eastern North Pacific and western North America, trough over eastern North America) set the stage for cold weather by establishing a long northwesterly flow in the upper atmosphere which extended into the high northern Arctic regions. Each short-wave trough in the northwesterly flow dragged cold fronts along with it. These fronts spread colder-than-normal air into the U.S. east of the Rockies, with many of the fronts reaching as far south as Florida and into Mexico. A few Pacific fronts moved across the West, but the western U.S. was dominated by dry high pressure with sunny skies and warmer-than-normal temperatures. East of the Rockies, warmer, southerly air masses, associated with upper-level ridges, followed the troughs and cold fronts, especially at mid-month (weeks 1, 2, 3, 4, 5). When integrated across the month, January 2014 averaged colder than normal across the eastern half of the CONUS and warmer than normal across the western half. Temperatures in Alaska averaged warmer than normal under the influence of the upper-level ridge.
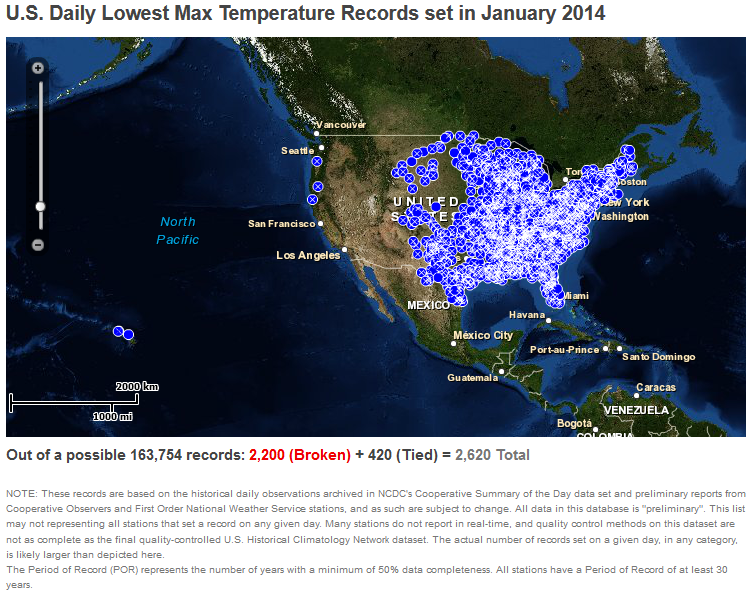
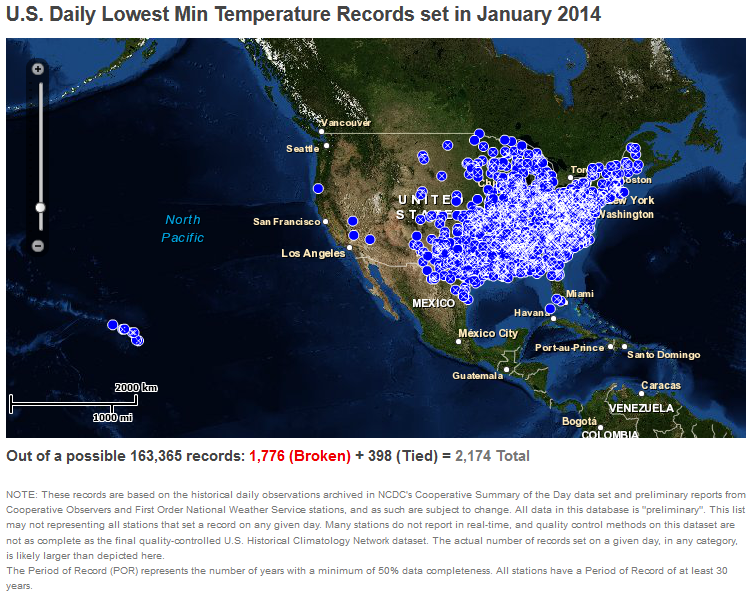
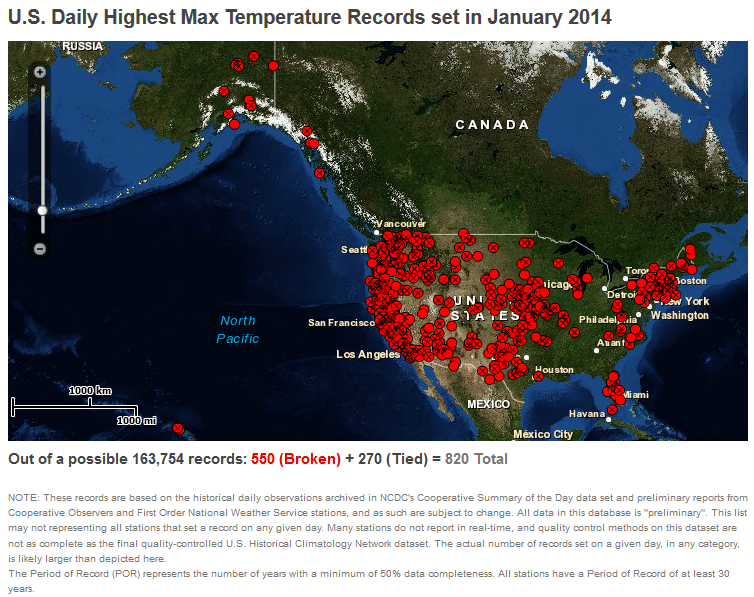
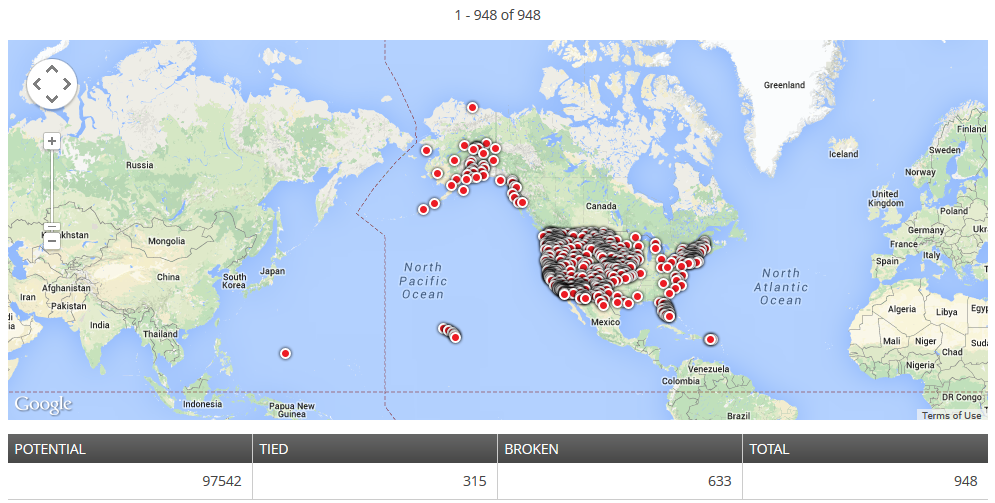
When the temperatures associated with the warm western ridge and cold eastern trough are integrated across the CONUS, January 2014 ranked near the middle of the historical record at 53rd coldest January. Twenty-nine states, mostly along and east of the Mississippi River, ranked in the coldest third of the historical record, with nine of them ranking in the top ten coldest category. Only ten states (all in the West) had January temperatures in the warmest third of the historical record, with three in the top ten warmest category. Likewise, there were more than two and a half times as many record cold daily highs (2620) and lows (2174, or a total of 4794) as record warm daily highs (820) and lows (948, or a total of 1768). The dominance of colder-than-normal temperatures over the high-population centers of the central and eastern U.S. resulted in a national Residential Energy Demand Temperature Index (REDTI) for January 2014 that tied with 1930 and 1988 as the 17th largest January REDTI in the 1895-2014 record. In comparison, January 1977 had the largest January national REDTI. The circulation pattern during the 1976-77 winter was similar to that of the 2013-14 winter — long-wave ridge over the west and trough over the east — with January 1977 ranking as the second coldest and 14th driest January in the 120-year record.
The upper-level circulation over North America in January is an example of an interconnected and amplified meridional pattern — the stronger-than-normal long-wave ridge over the eastern North Pacific and western North America contributed to a shift southward of the circumpolar vortex and amplification of the downstream eastern North America trough. Since the atmospheric circulation is interconnected around the world, the meridional pattern can be seen in the global circulation anomalies — positive 500-mb height anomalies over the North polar region are a sign of the southward shift of the polar vortex, while the regularly-spaced pattern of paired above-normal and below-normal height anomalies over North America, the North Atlantic/Western Europe, and Eurasia reflect an amplified meridional wave pattern at mid-latitudes around the world. This was manifested at the surface in the temperatures — over North America and Asia, temperatures were colder than normal beneath the upper-level troughs and warmer than normal beneath the upper-level ridges.
Atmospheric Drivers
Subtropical highs, and cold fronts and low pressure systems moving in the storm track flow, are influenced by the broadscale atmospheric circulation. The circulation of the atmosphere can be analyzed and categorized into specific patterns. The tropics, especially the equatorial Pacific Ocean, provides abundant heat energy which drives the world's atmospheric and oceanic circulation. The following describes several of these modes or patterns of the atmospheric circulation, their drivers, the temperature and precipitation patterns (or teleconnections) associated with them, and their index values this month:
-
El Niño Southern Oscillation (ENSO)
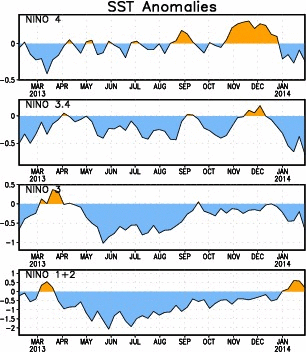
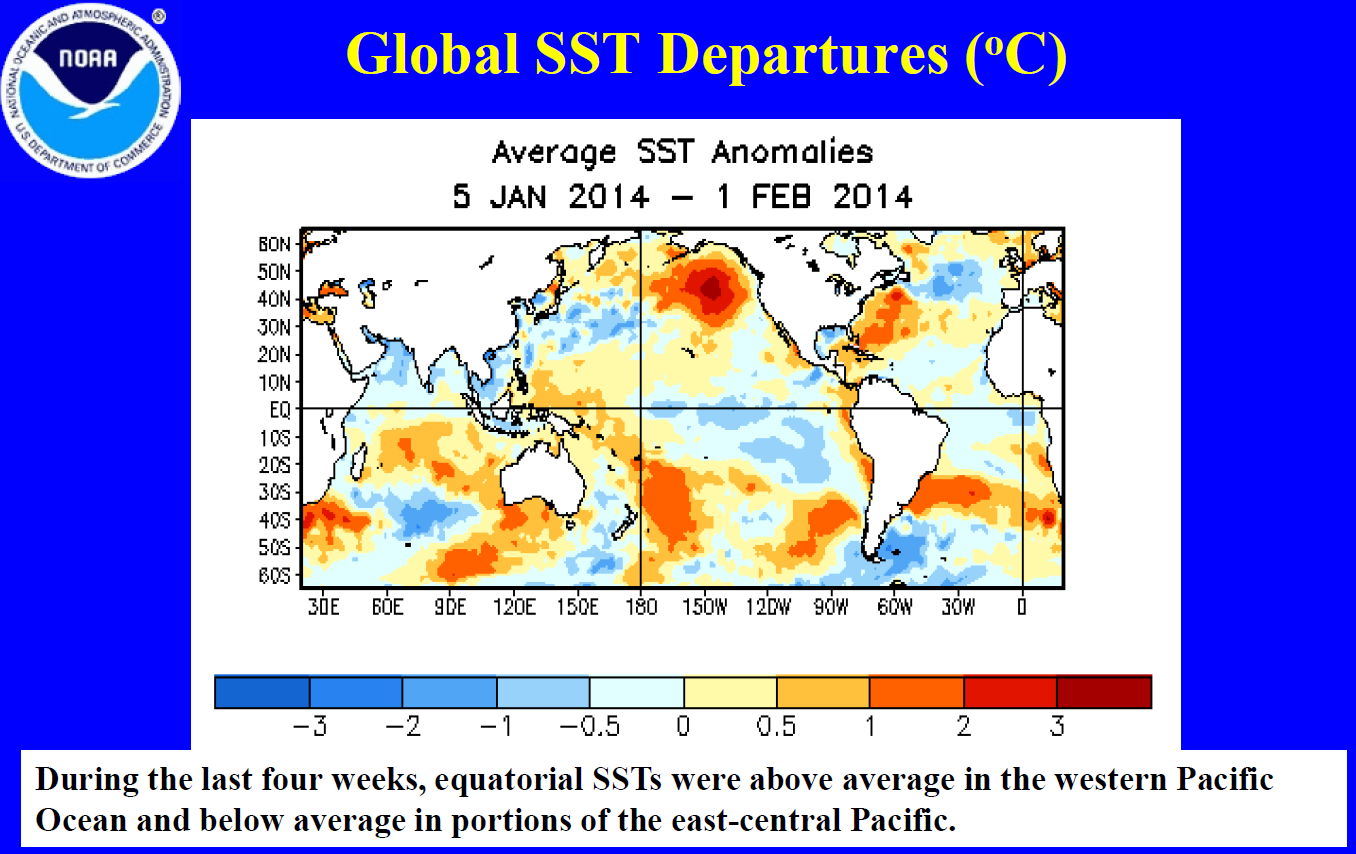
- Description: Oceanic and atmospheric conditions in the tropical Pacific Ocean can influence weather across the globe. ENSO is characterized by two extreme modes: El Niño (warmer-than-normal sea surface temperature [SST] anomalies in the tropical Pacific) and La Niña (cooler-than-normal SST anomalies), with the absence of either of these modes termed "ENSO-neutral" conditions.
- Status: Ocean temperatures and atmospheric circulation anomalies indicated that the equatorial Pacific continued in an ENSO-neutral state during January.
- Teleconnections (influence on weather): To the extent teleconnections are known, while in a neutral state, ENSO normally is not a player in the month's weather. Historical data has been analyzed by NOAA to show typical temperature and precipitation patterns associated with El Niño and La Niña ENSO episodes. Teleconnections are not available for ENSO-neutral conditions at that NOAA web site.
-
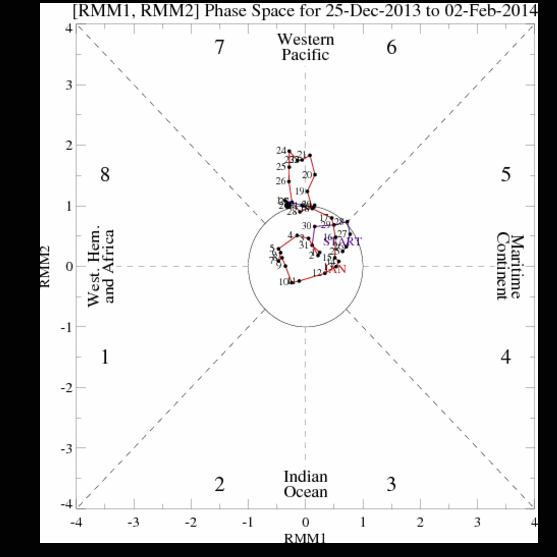
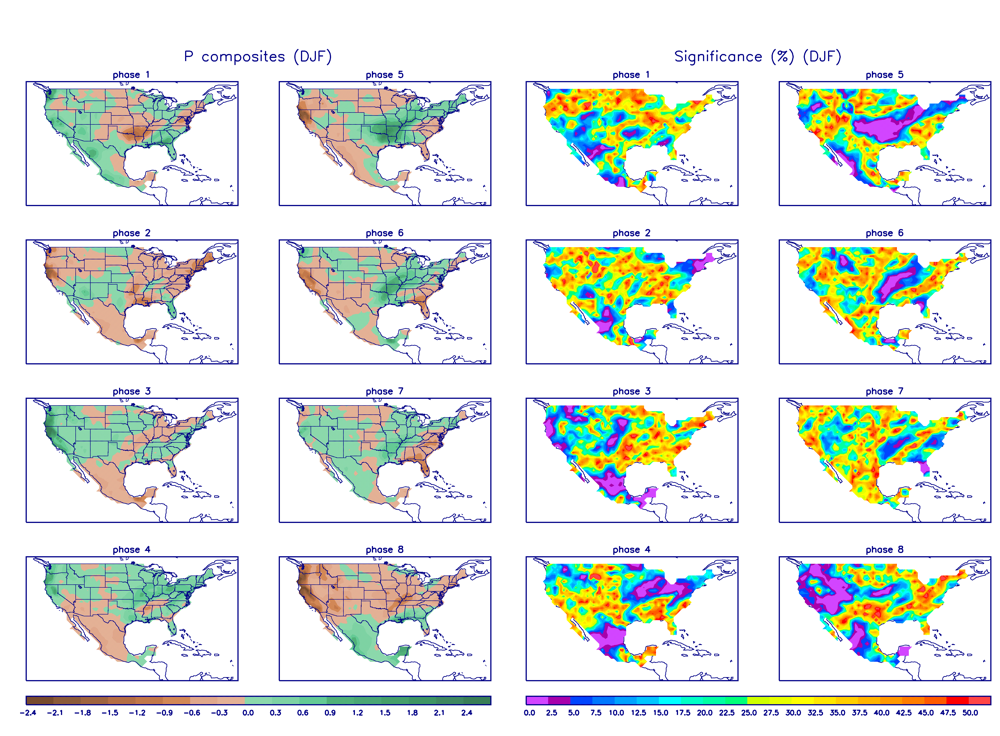
Madden-Julian Oscillation (MJO)
- Description: The MJO is a tropical disturbance or "wave" that propagates eastward around the global tropics with a cycle on the order of 30-60 days. It is characterized by regions of enhanced and suppressed tropical rainfall. One of its indices is a phase diagram which illustrates the phase (1-8) and amplitude of the MJO on a daily basis. The MJO is categorized into eight "phases" depending on the pattern of the location and intensity of the regions of enhanced and suppressed tropical rainfall. The MJO can enter periods of little or no activity, when it becomes neutral or incoherent and has little influence on the weather. Overall, the MJO tends to be most active during ENSO-neutral years, and is often absent during moderate-to-strong El Niño and La Niña episodes.
- Status:The MJO was incoherent for most of the month. During the last half of the month, it appeared to transition to phases 6 and 7, but this was essentially a manifestation of convective activity in the western Pacific, with Kelvin waves and low frequency variability appearing to influence the tropical precipitation pattern (as indicated by the MJO discussions for January 6, 13, 20, 27, and February 3).
- Teleconnections (influence on weather): The MJO's temperature and precipitation teleconnections to U.S. weather depend on time of year and MJO phase. To the extent teleconnections are known, the December-February teleconnections for precipitation are shown here and for temperature are shown here.
- Comparison to Observed: The MJO is transitory and can change phases (modes) within a month, so it is more closely related to weekly weather patterns than monthly. The January 2014 monthly temperature and precipitation anomaly patterns do not match the teleconnections for MJO phases 6 or 7, nor do the weekly temperature and precipitation anomaly patterns match.
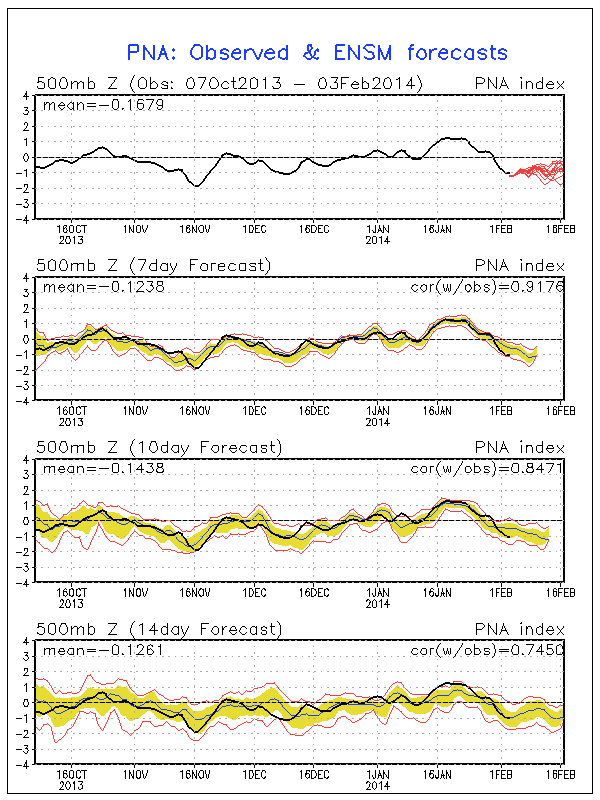
- The Pacific/North American (PNA) pattern
- Description: The PNA teleconnection pattern is associated with strong fluctuations in the strength and location of the East Asian jet stream. PNA-related blocking of the jet stream flow in the Pacific can affect weather downstream over North America, especially the West and especially in the winter half of the year.
- Status: The daily PNA index was neutral (near zero) for the first half of the month and positive for the last half, averaging positive for the month as a whole.
- Teleconnections (influence on weather): To the extent teleconnections are known, the temperature teleconnection map for a positive PNA at this time of year (January on the maps) shows above-normal temperatures along the West Coast, Alaska, western Canada, and Northern Plains, and below-normal temperatures across the eastern third of the CONUS and in the Southern Plains. The precipitation teleconnection map for this time of year shows drier-than-normal conditions over much of the eastern half of the CONUS and in the Pacific Northwest to Central Rockies. The upper-level circulation anomaly teleconnection for a positive PNA shows above-normal heights over the western half of North America and below-normal heights over the southeastern third of the CONUS. A negative PNA is associated with the opposite patterns.
- Comparison to Observed: The January 2014 temperature, precipitation, and upper-level circulation anomaly patterns show some consistency with those expected for a positive PNA in the Northwest and Southeast, but the broadscale patterns do not match.
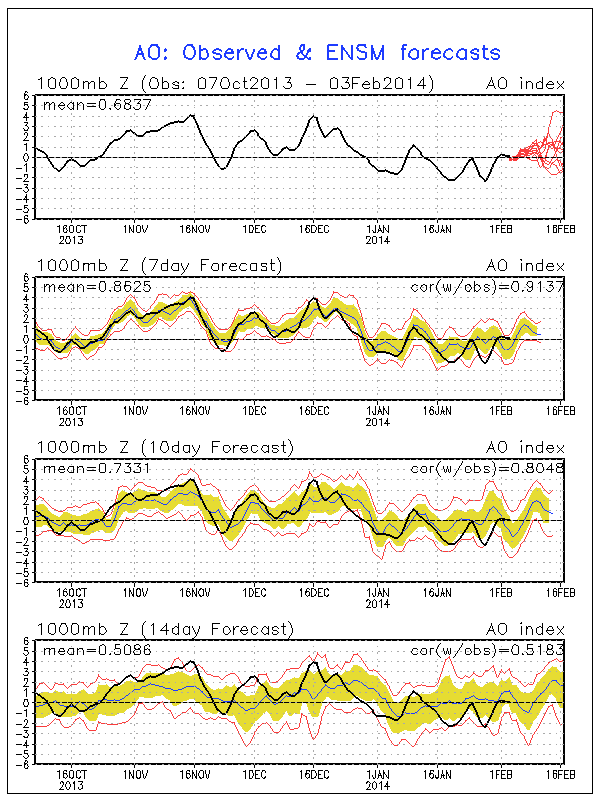
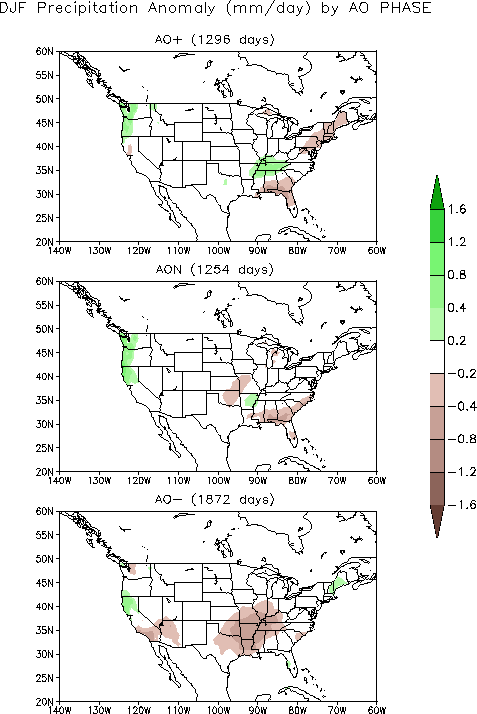
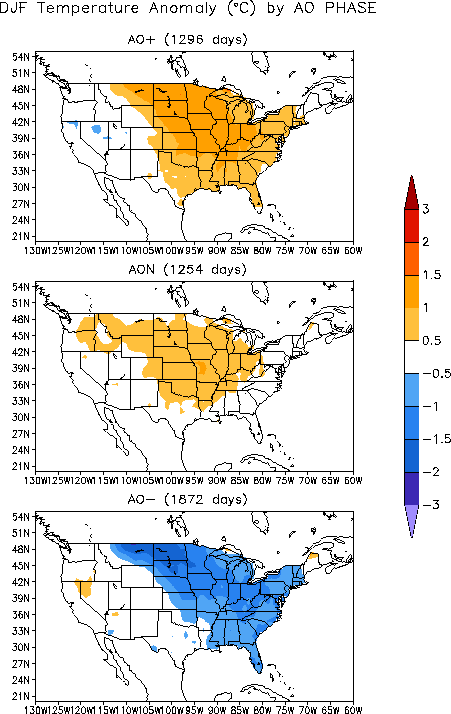
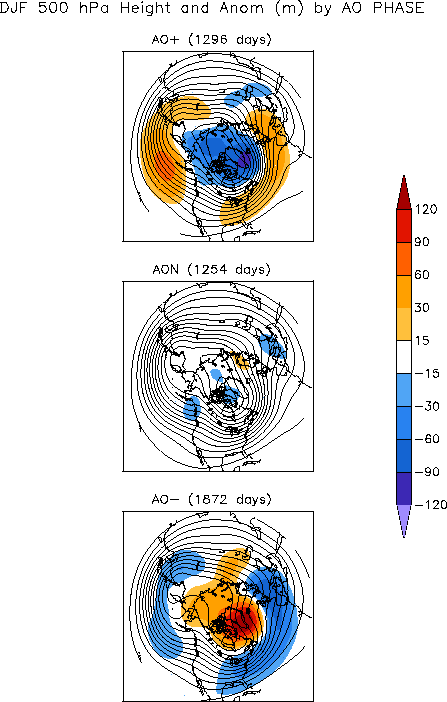
- The Arctic Oscillation (AO) pattern
- Description: The AO teleconnection pattern relates upper-level circulation over the Arctic to circulation features over the Northern Hemisphere mid-latitudes and is most active during the cold season.
- Status: The daily AO index was oscillated between neutral to negative values throughout January, averaging negative for the month.
- Teleconnections (influence on weather): To the extent teleconnections are known, a negative AO this time of year (December-February) is typically associated with wet conditions in northern California and New England, dryness in the Southwest and Southern Plains to Ohio Valley, below-normal temperatures across most of the country east of the Rockies, and upper-level circulation anomalies which are above normal over the polar region and below normal over the eastern CONUS.
- Comparison to Observed: The January 2014 upper-level circulation anomaly pattern (for North America and the Northern Hemisphere) is similar to that expected with a negative AO over the polar region and eastern CONUS, but does not agree over the eastern North Pacific, western North America, or the North Atlantic. The precipitation anomaly pattern agrees in the Southwest and Southern Plains to Ohio Valley, but not in northern California. The monthly temperature anomaly pattern, however, agrees quite well east of the Rockies, as does the temperature anomaly pattern for some weeks (weeks 1, 2, 3, 4, 5).
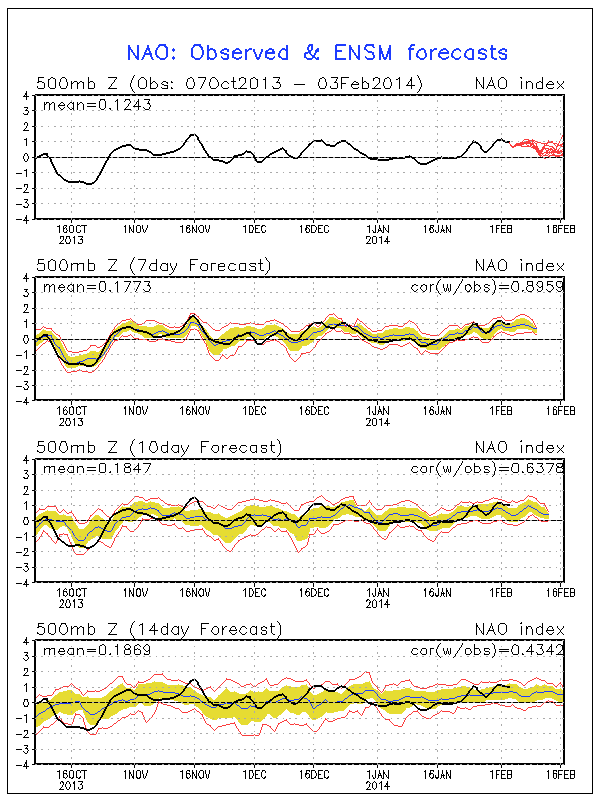
- The North Atlantic Oscillation (NAO) pattern
- Description: The NAO teleconnection pattern relates upper-level circulation over the North Atlantic Ocean to circulation features over the Northern Hemisphere mid-latitudes.
- Status: The daily NAO index was near zero for most of the month, but positive at the end of January, and averaged positive for the month.
- Teleconnections (influence on weather): To the extent teleconnections are known, a positive NAO during this time of year (January on the teleconnection maps) is associated with warmer-than-normal temperatures east of the Rockies (except the Central Plains), is weakly associated with drier-than-normal conditions in parts of the West, and is associated with positive upper-level circulation anomalies over most of the country (except the West Coast).
- Comparison to Observed: The January 2014 monthly temperature and upper-level circulation anomaly patterns do not match those expected with a positive NAO, but the precipitation anomaly pattern is consistent in the West where teleconnections exist.
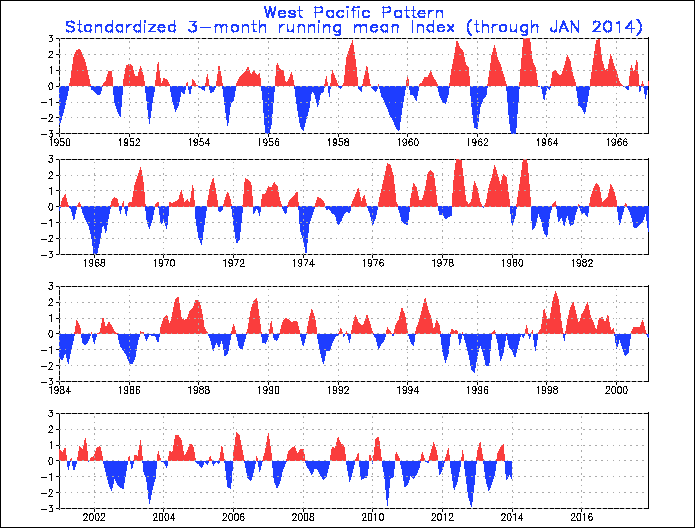
- The West Pacific (WP) pattern
- Description: The WP teleconnection pattern is a primary mode of low-frequency variability over the North Pacific and reflects zonal and meridional variations in the location and intensity of the (East Asian) jet stream in the western Pacific.
- Status: The monthly WP index was positive for the month, while the three-month average WP index was negative (dominated by the strongly negative December value).
- Teleconnections (influence on weather): To the extent teleconnections are known, a positive WP during this time of year (January on the maps) is typically associated with below-normal temperatures in the Southwest, above-normal temperatures in the Midwest to Northeast, wetter-than-normal weather from the Mid-Mississippi to Ohio valleys, below-normal circulation anomalies over the western CONUS, and above-normal circulation anomalies over eastern North America.
- Comparison to Observed: The January 2014 monthly temperature, precipitation, and upper-level circulation anomaly patterns are opposite those expected with a positive WP.
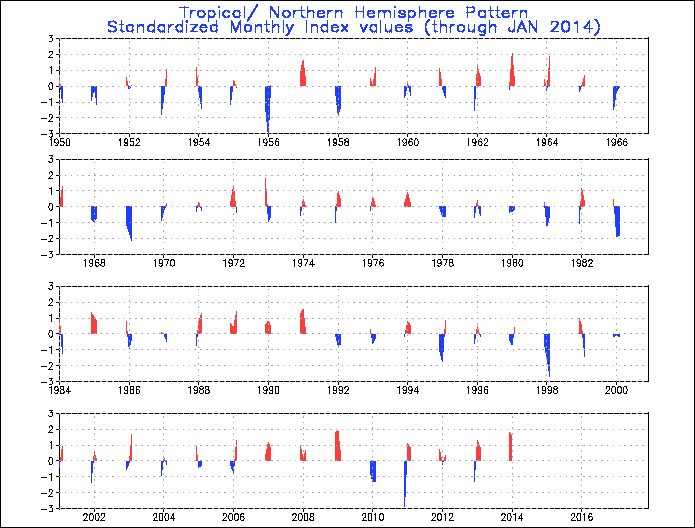
- The Tropical/Northern Hemisphere (TNH) pattern
- Description: The TNH teleconnection pattern reflects large-scale changes in both the location and eastward extent of the Pacific jet stream, and also in the strength and position of the climatological mean Hudson Bay Low, and is dominant in the winter months. The pattern significantly modulates the flow of marine air into North America, as well as the southward transport of cold Canadian air into the north-central United States.
- Status: The TNH index was positive during January.
- Teleconnections (influence on weather): To the extent teleconnections are known, a positive TNH is typically associated with cooler-than-normal temperatures for much of the country, drier-than-normal conditions in the West, and slightly wetter-than-normal conditions in the Tennessee Valley. The upper-level circulation anomalies for a positive TNH are below-normal 500-mb geopotential heights over the eastern two-thirds of Canada and the north central U.S., and above-normal heights over the northeastern Pacific and Gulf of Mexico into the western North Atlantic.
- Observed: The January 2014 monthly temperature anomaly pattern is consistent with a positive TNH east of the Rockies where teleconnections exist, but not in the West. The monthly precipitation anomaly patterns are consistent in the West but not in the Tennessee Valley. The upper-level circulation anomaly pattern is similar to that expected with a positive TNH but appears shifted to the east and south.
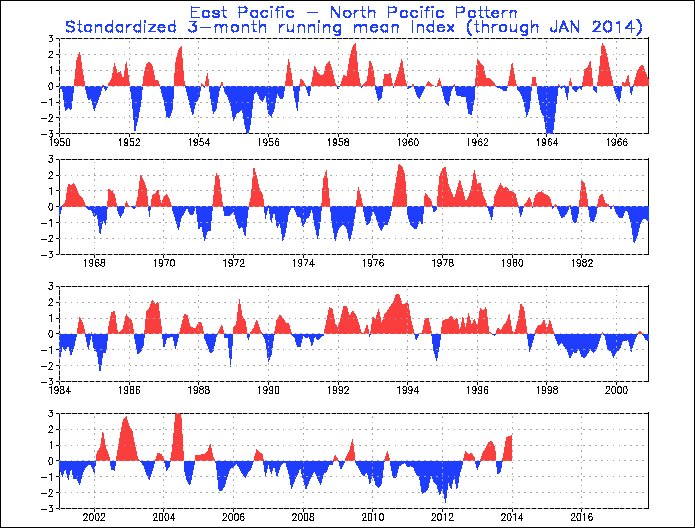
- The East Pacific-North Pacific (EP-NP) pattern
- Description: The EP-NP teleconnection pattern relates SST and upper-level circulation patterns over the eastern and northern Pacific to temperature, precipitation, and circulation anomalies downstream over North America. Its influence during the winter is not as strong as during the other three seasons.
- Status: The SST pattern over the northeastern North Pacific during January 2014 saw a continued expansion and intensification of the large pool of warmer-than-normal SSTs in the northeastern North Pacific. The monthly EP-NP index has been positive since October, pulling the 3-month running mean well into positive territory. The positive phase of the EP-NP pattern is associated with above-average surface temperatures over the northeastern Pacific (thus, the negative phase is associated with below-normal SSTs).
- Teleconnections (influence on weather): To the extent these teleconnections are known, a positive EP-NP index during this time of year (between October and April on the maps) is typically associated with cooler-than-normal temperatures across the U.S. east of the Rockies, warmer-than-normal temperatures along the immediate West Coast and in Alaska, drier-than-normal conditions in the Northwest, above-normal precipitation in southern Alaska (although the precipitation teleconnections are weak), below-normal upper-level circulation anomalies (stronger upper-level trough) over the eastern half of North America (especially eastern Canada), and above-normal upper-level circulation anomalies (stronger upper-level ridge) over western Canada and Alaska.
- Comparison to Observed: The January 2014 temperature anomaly pattern is a very good match, and the precipitation anomaly pattern agrees with the teleconnections in the Pacific Northwest. The upper-level circulation anomaly pattern is also a very good match, but stronger and extending slightly further south in latitude.
Examination of these circulation indices and their teleconnection patterns, and comparison to observed January 2014 temperature, precipitation, and circulation patterns, suggest that the circulation patterns are most closely associated with the EP-NP index, but hints of other patterns were evident. ENSO was neutral, and thus not a player. The MJO was incoherent or weak for most of the month and exerted little influence on January's weather. The teleconnection patterns for the WP and NAO do not match January's weather patterns. The PNA and TNH teleconnections are reflected in parts of the country, but not others. The AO temperature teleconnections are a strong match to the observed January temperature pattern and there is some agreement with the circulation and precipitation patterns, but the best match with January 2014 circulation, temperature, and precipitation patterns occurs with the EP-NP. This suggests that the EP-NP and AO modes were in phase to reinforce cold weather east of the Rockies, but that the drivers behind the EP-NP were strongest. This month illustrates how the anomaly patterns can be strongly represented by one atmospheric driver (EP-NP in this case) but also have elements of several other drivers (or modes of atmospheric variability).