Note: This Synoptic Discussion describes recent weather events and climate anomalies in relation to the phenomena that cause the weather. These phenomena include the jet stream, fronts and low pressure systems that bring precipitation, high pressure systems that bring dry weather, and the mechanisms which control these features — such as El Niño, La Niña, and other oceanic and atmospheric drivers (PNA, NAO, AO, and others). The report may contain more technical language than other components of the State of the Climate series.
Summary
December 2014 was characterized by an active jet stream with a strong zonal flow over the contiguous United States (CONUS). Pacific weather systems moving in the circulation generated areas of precipitation in parts of the country, especially in the West and Southeast, which shrank the national drought footprint slightly. The mild Pacific air masses, and relative absence of cold polar air masses, resulted in widespread warmer-than-normal monthly temperatures. A shift in the jet stream at the end of the month brought a return of very cold weather to the central and western CONUS. The upper-level circulation pattern, and temperature and precipitation patterns, suggest that the weather and climate of December 2014 were influenced very strongly by conditions in the North Pacific and Arctic. See below for details.
Synoptic Discussion
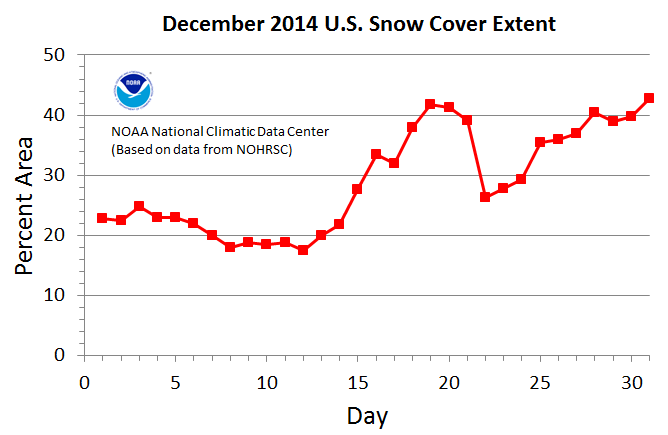
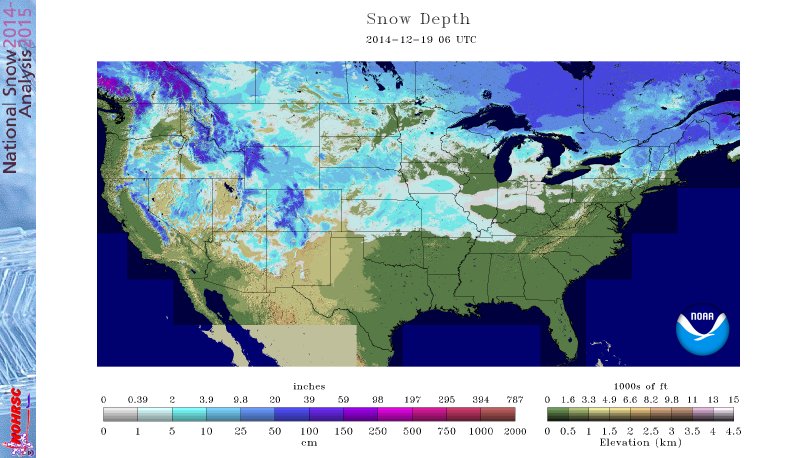
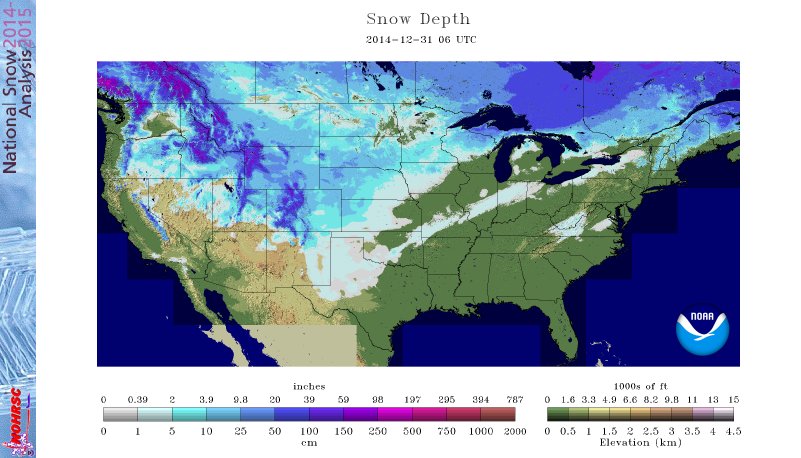
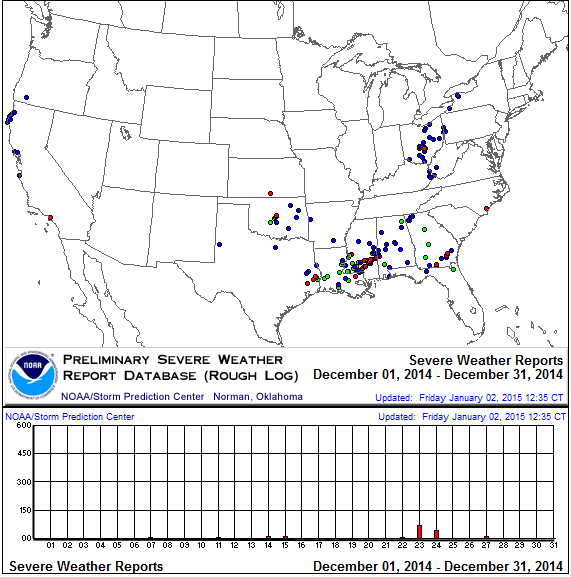
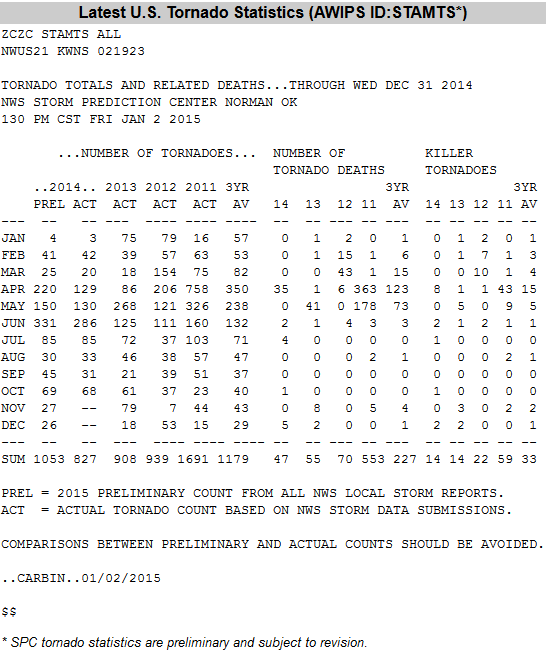
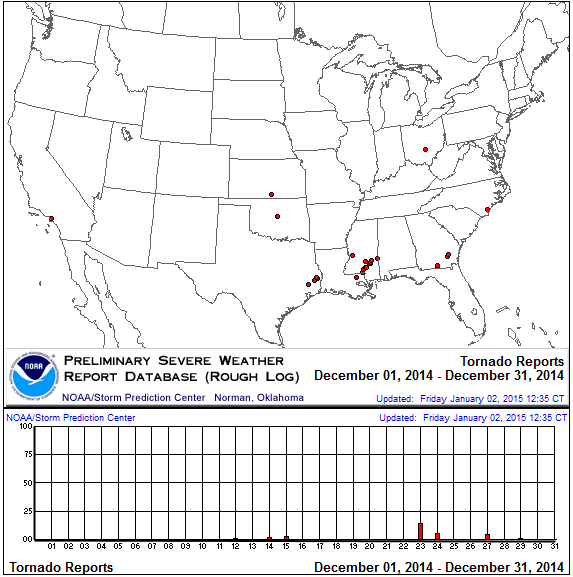
 Animation of daily upper-level circulation for the month. In the Northern Hemisphere, December marks the beginning of climatological winter, which is the time of year when the sun angle and solar heating reach their minimum and an expanding circumpolar vortex forces the jet stream to migrate southward. In December 2014, a zonal flow dominated the jet stream pattern, keeping cold arctic air masses bottled up in Canada and allowing milder Pacific air masses to move across the CONUS. Short-wave troughs and ridges frequently moved through the upper-level flow, with the troughs bringing areas of precipitation. The circulation pattern fed Pacific moisture into the West and Gulf of Mexico moisture into the Southeast, but blocked these moisture sources from most of the central part of the country for most of the month. Upper-level troughs and closed lows generated low pressure systems at the surface which were able to tap Gulf of Mexico moisture. These low pressure systems had enough below-freezing air with them that they were able to lay down an expanding snow cover at mid-month and the end of the month — over 42 percent of the CONUS was snow-covered by December 31st, the largest extent at any point during the month. A particularly energetic low pressure and frontal system brought a severe weather outbreak on the 23rd-24th. A (preliminary) total of 26 tornadoes occurred during December 2014, most in the Southeast, which is close to the December average of 24. |
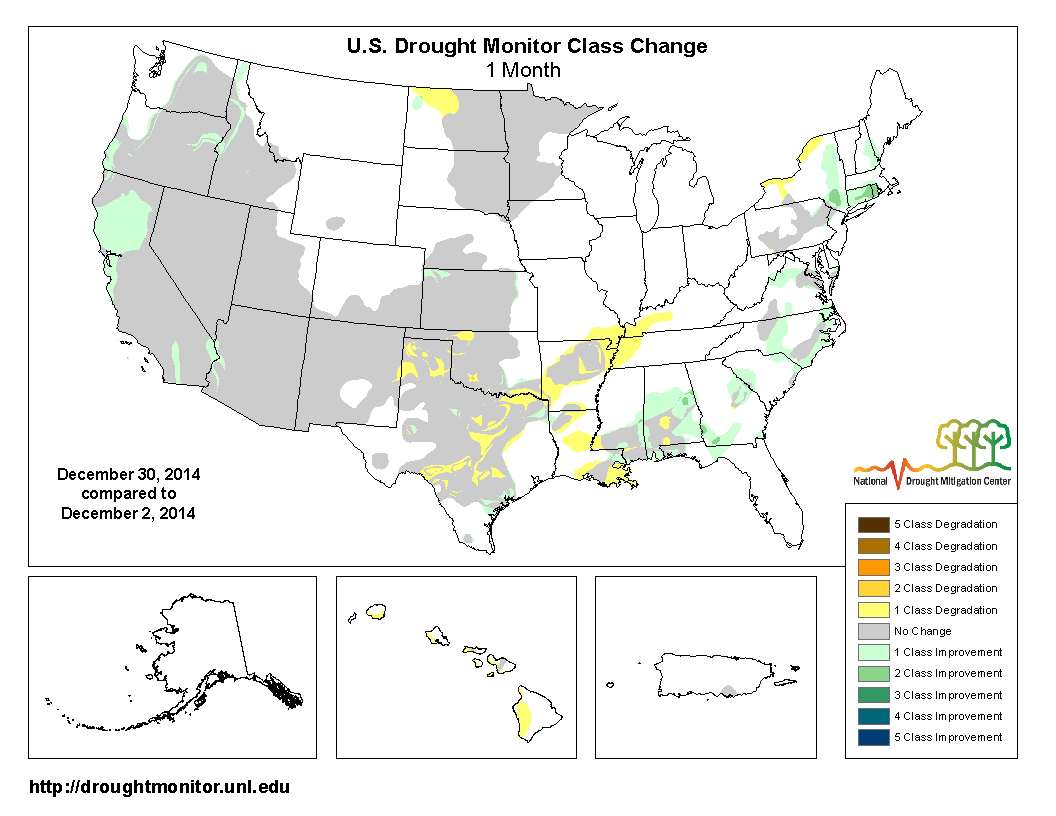
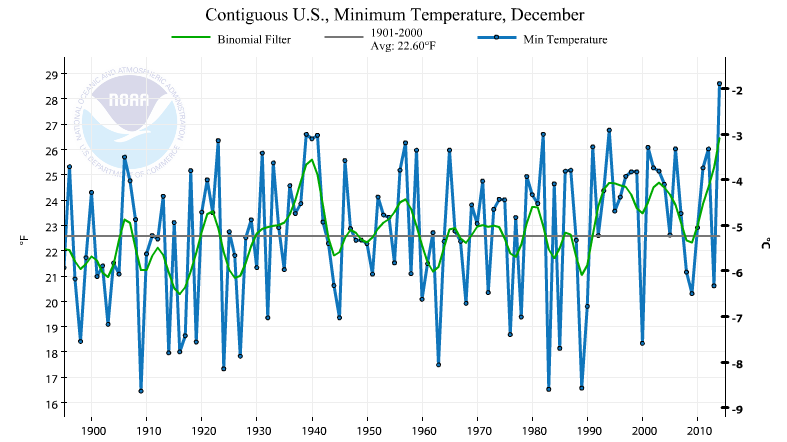
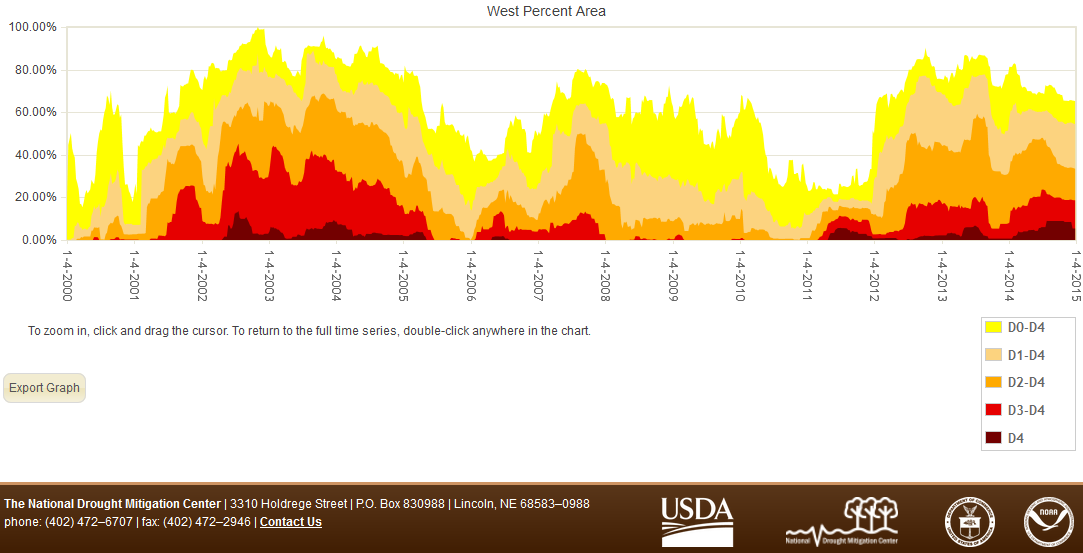
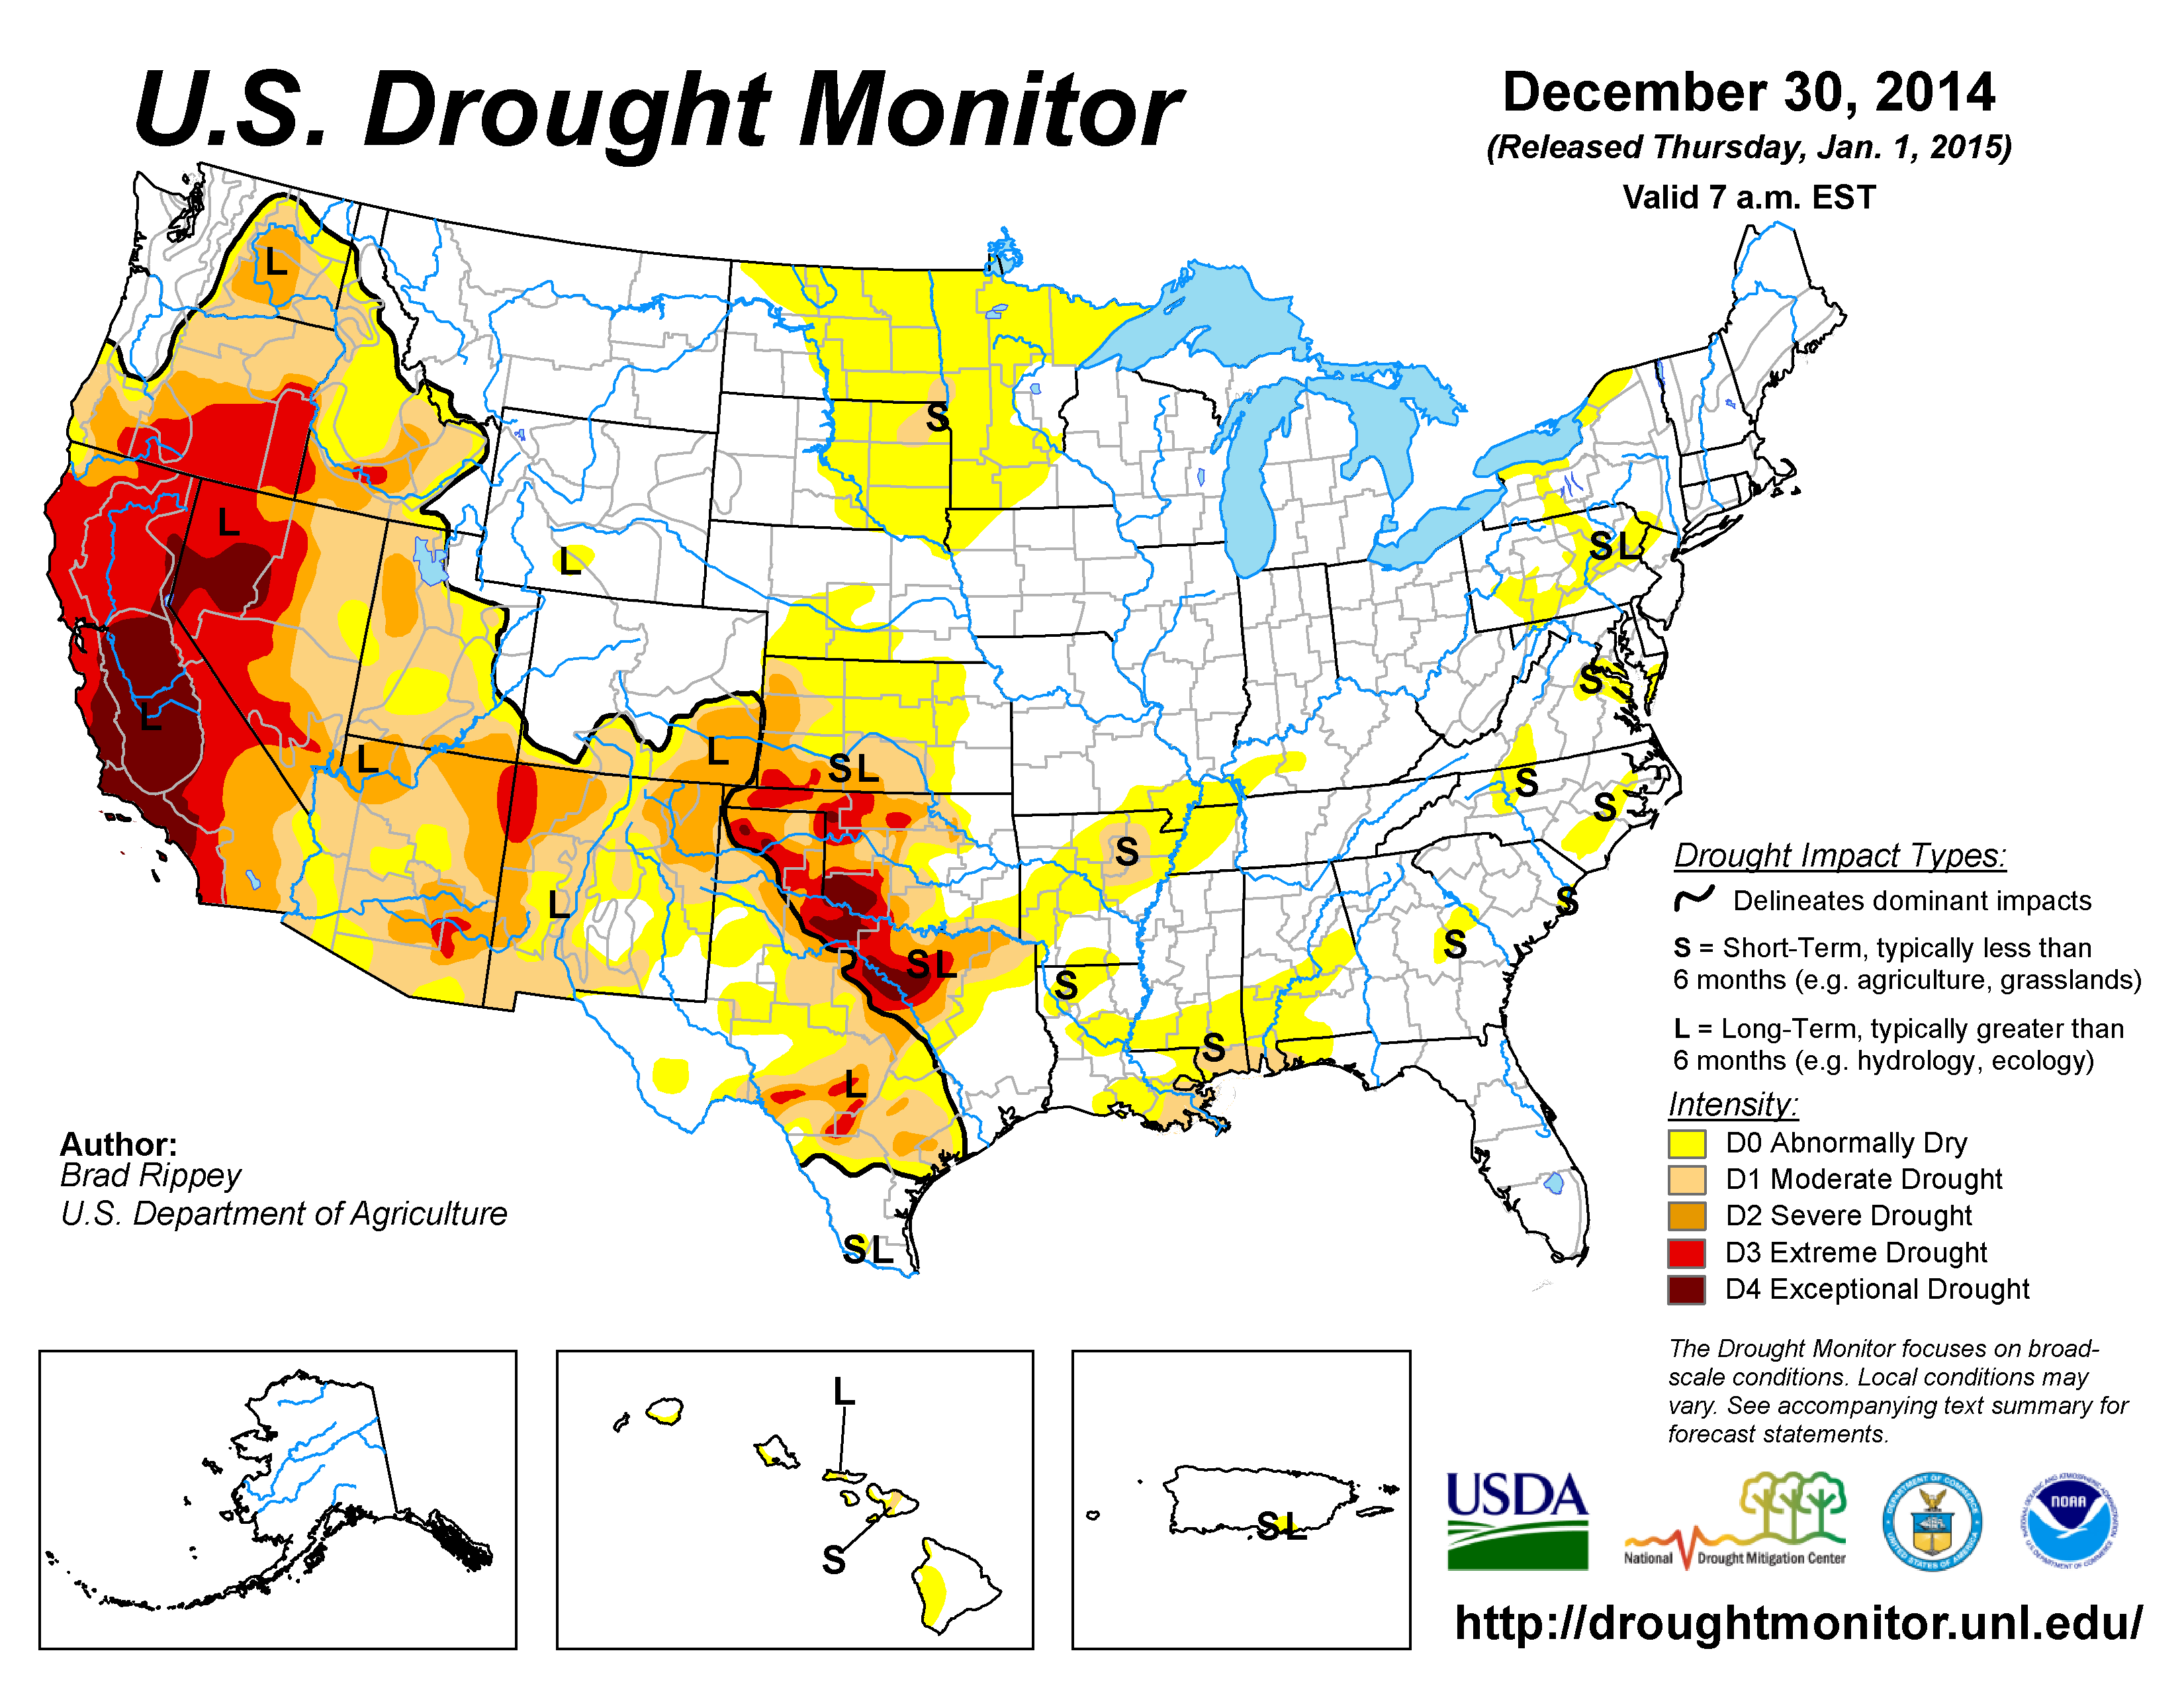
 Animation of daily surface fronts and pressure systems for the month. The relatively mild air associated with the Pacific air masses kept low temperatures from getting too cold, while frequent short-wave ridges moving in the upper-level flow brought warmer-than-normal air on southerly winds (weeks 1, 2, 3, 4). In fact, the nationally-averaged minimum temperature for the month ranked December 2014 as the warmest December in the 1895-2014 record. A shift in the jet stream occurred near the end of the month, with a long-wave ridge developing over the eastern North Pacific which induced a northerly flow in the jet stream over western Canada. This funneled cold arctic air into the CONUS during the last few days of the month. By the end of the month, there were 5,060 record warm daily high (1,371) and low (3,689) temperature records, which is more than eight times as many (580) record cold daily high (370) and low (210) temperature records. This was reflected in the national monthly average temperature which ranked December 2014 as the second warmest December in the 1895-2014 record. It was also reflected in the sixth lowest REDTI (Residential Energy Demand Temperature Index) for December, indicating that the widespread above-normal temperatures decreased the energy needed to heat homes. The Pacific weather systems brought much-needed precipitation to the western U.S., which has been suffering from drought for much of the last three years. The precipitation was not enough to end the drought, but it did help erase some soil moisture deficits and replenish small northern California reservoirs. These were "warm" storm systems, which dropped much of their moisture in the form of rain instead of snow, resulting in a mountain snow pack which was still well below seasonal norms. Drought contracted in parts of the West — and parts of the East where above-normal precipitation fell — but expanded in the Southern Plains, with the national drought footprint shrinking slightly compared to the end of November. |
 Monthly upper-level circulation pattern and anomalies. When integrated across the month, the atmospheric circulation indicated a pattern of above-normal 500-mb heights (weaker-than-normal long-wave trough) over much of eastern and northern North America, with below-normal 500-mb heights over part of the eastern North Pacific. While cold troughs and weather systems did occur in December, this pattern of monthly upper-level height anomalies reflects the more frequent occurrence of warm ridges over North America. |
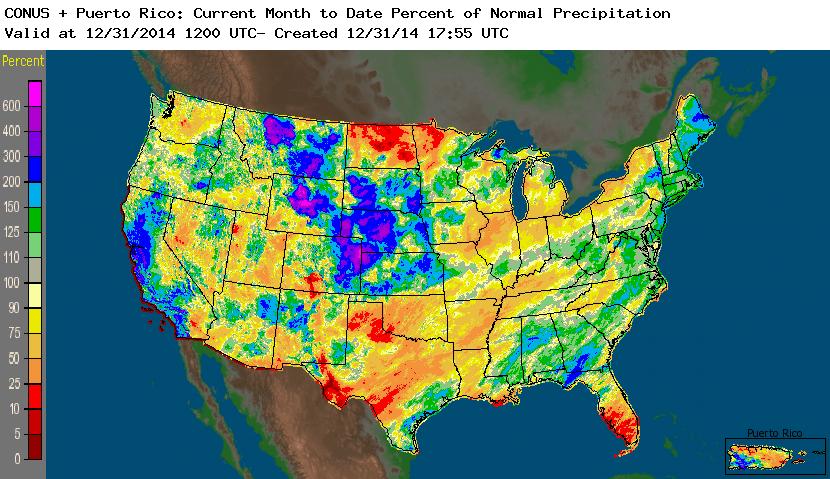
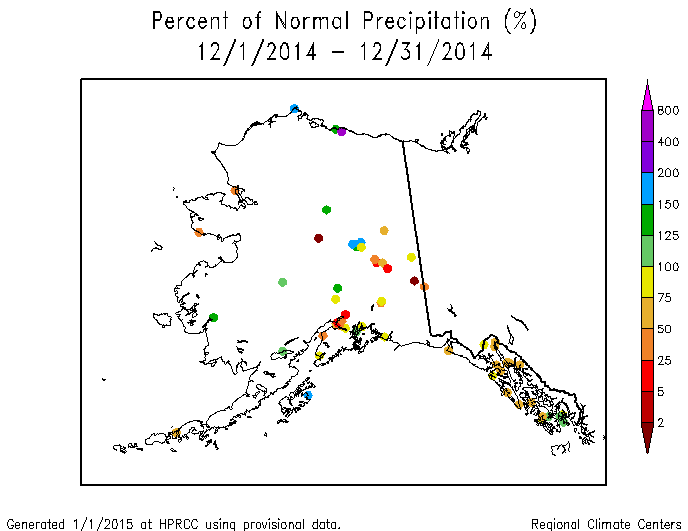
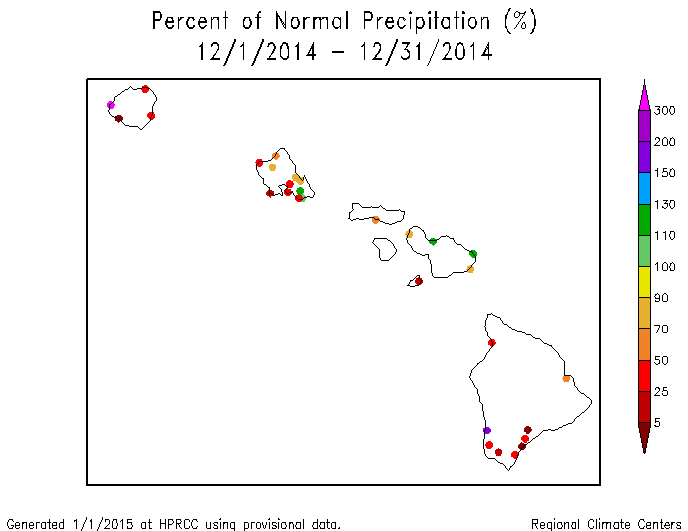
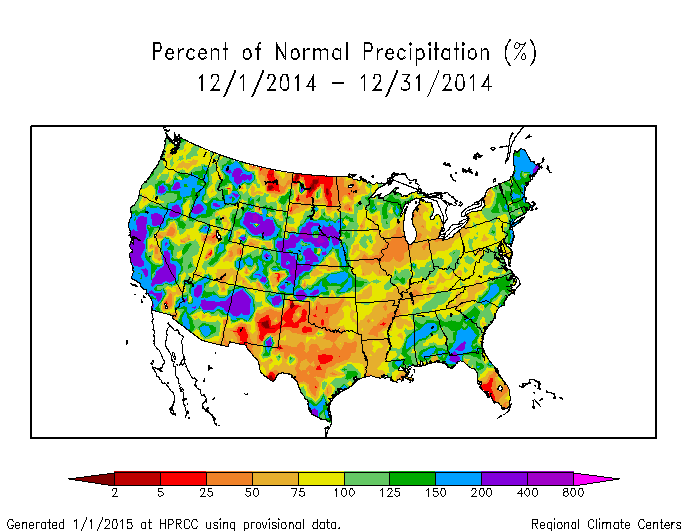 Map of monthly precipitation anomalies. Above-normal precipitation fell across much of the West and Central Plains, and parts of the Northeast and Southeast. Precipitation was below normal across much of the Southern and Northern Plains, Mississippi Valley, and southern Great Lakes. December was drier than normal across southeastern Alaska and much of the Hawaiian Islands. |
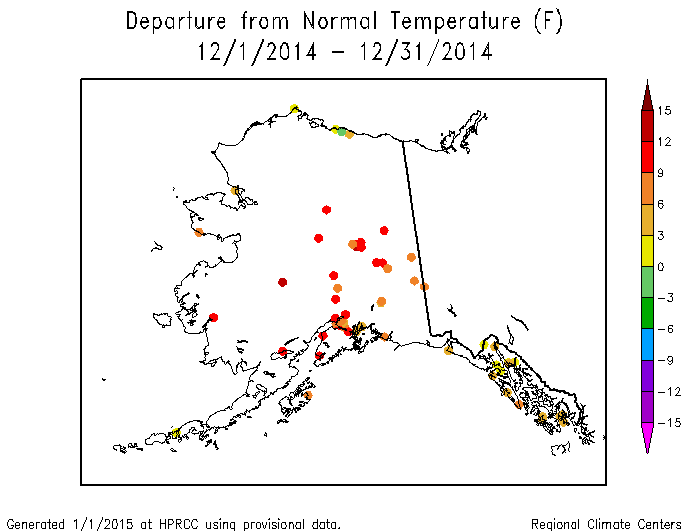
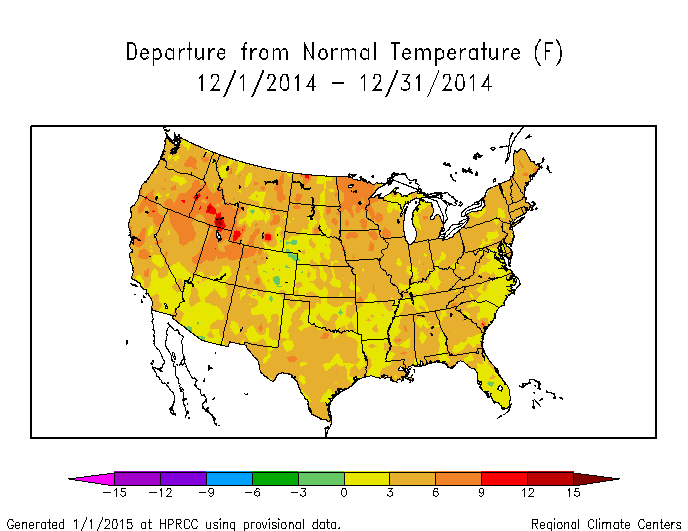 Map of monthly temperature anomalies. December temperatures were warmer than normal across virtually all of the CONUS and Alaska. |
Global Linkages: The upper-level circulation anomaly pattern over North America was part of a contracted circumpolar vortex across much of the Northern Hemisphere, with positive 500-mb height anomalies extending into the North Atlantic and across much of Asia. Above-normal 500-mb heights, associated with ridging in the upper atmosphere, were reflected by above-normal temperatures at the surface over much of North America and parts of Eurasia.
Atmospheric Drivers
Subtropical highs, and fronts and low pressure systems moving in the mid-latitude storm track flow, are influenced by the broadscale atmospheric circulation. The circulation of the atmosphere can be analyzed and categorized into specific patterns. The tropics, especially the equatorial Pacific Ocean, provides abundant heat energy which largely drives the world's atmospheric and oceanic circulation. The following describes several of these modes or patterns of the atmospheric circulation, their drivers, the temperature and precipitation patterns (or teleconnections) associated with them, and their index values this month:
-
El Niño Southern Oscillation (ENSO)
- Description: Oceanic and atmospheric conditions in the tropical Pacific Ocean can influence weather across the globe. ENSO is characterized by two extreme modes: El Niño (warmer-than-normal sea surface temperature [SST] anomalies in the tropical Pacific) and La Niña (cooler-than-normal SST anomalies), with the absence of either of these modes termed "ENSO-neutral" conditions.
- Status: Ocean surface temperatures and several other features across the tropical Pacific were characteristic of borderline El Niño conditions, but collectively, the combined atmosphere and oceanic state remained ENSO-neutral during December.
- Teleconnections (influence on weather): To the extent teleconnections are known, while in a neutral state, ENSO normally is not a player in the month's weather. Historical data has been analyzed by NOAA to show typical temperature and precipitation patterns associated with El Niño and La Niña ENSO episodes. Teleconnections are not available for ENSO-neutral conditions at that NOAA web site. If an El Niño were happening during December, the typical precipitation pattern would consist of wetter-than-normal conditions along the Gulf of Mexico and Atlantic coasts and in parts of the Southwest, and drier-than-normal conditions across the Northwest to Northern Rockies, and Central Plains to Great Lakes. The typical temperature pattern would consist of below-normal temperatures across most of the southern tier states and above-normal temperatures in the Northwest.
- Comparison to Observed: The December 2014 temperature anomaly pattern shows little resemblance to that expected with an El Niño, and the precipitation anomaly pattern has similarities in some areas (east of the Mississippi River) but not others.
-
Madden-Julian Oscillation (MJO)
- Description: The MJO is a tropical disturbance or "wave" that propagates eastward around the global tropics with a cycle on the order of 30-60 days. It is characterized by regions of enhanced and suppressed tropical rainfall. One of its indices is a phase diagram which illustrates the phase (1-8) and amplitude of the MJO on a daily basis. The MJO is categorized into eight "phases" depending on the pattern of the location and intensity of the regions of enhanced and suppressed tropical rainfall. The MJO can enter periods of little or no activity, when it becomes neutral or incoherent and has little influence on the weather. Overall, the MJO tends to be most active during ENSO-neutral years, and is often absent during moderate-to-strong El Niño and La Niña episodes.
- Status: The MJO started the month in phase 5, passed through phase 6 before becoming incoherent at mid-month, then transitioned into phases 3-5 by the end of the month. The MJO indices appeared to be influenced by other modes of coherent subseasonal tropical variability, including Kelvin and Rossby waves (MJO updates for December 8, 15, 22, 29).
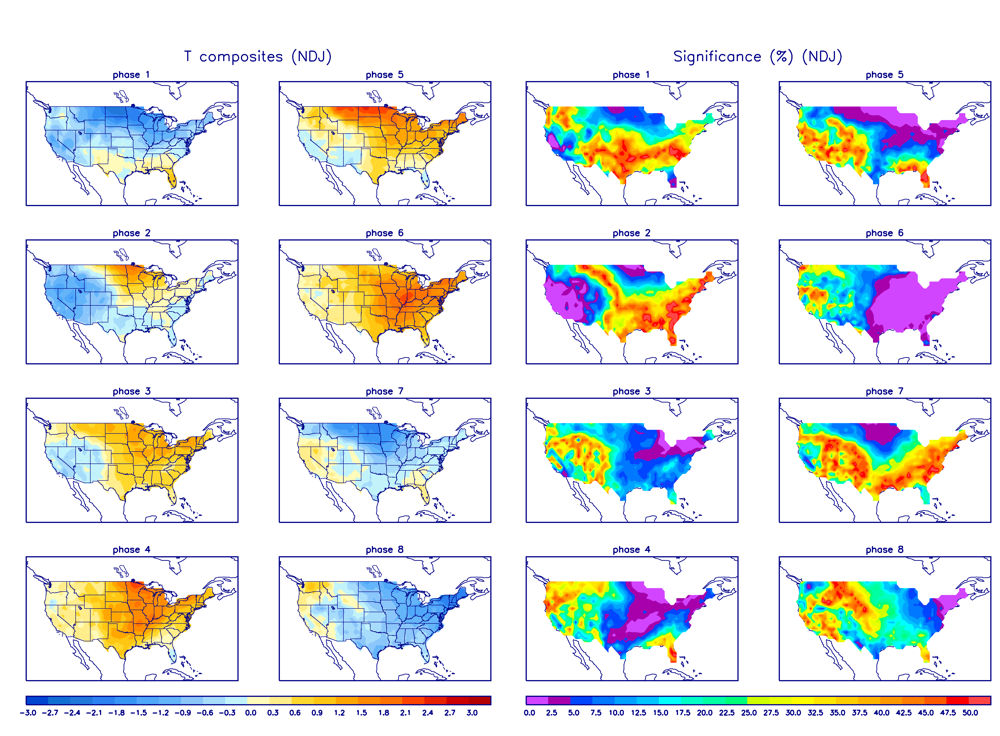
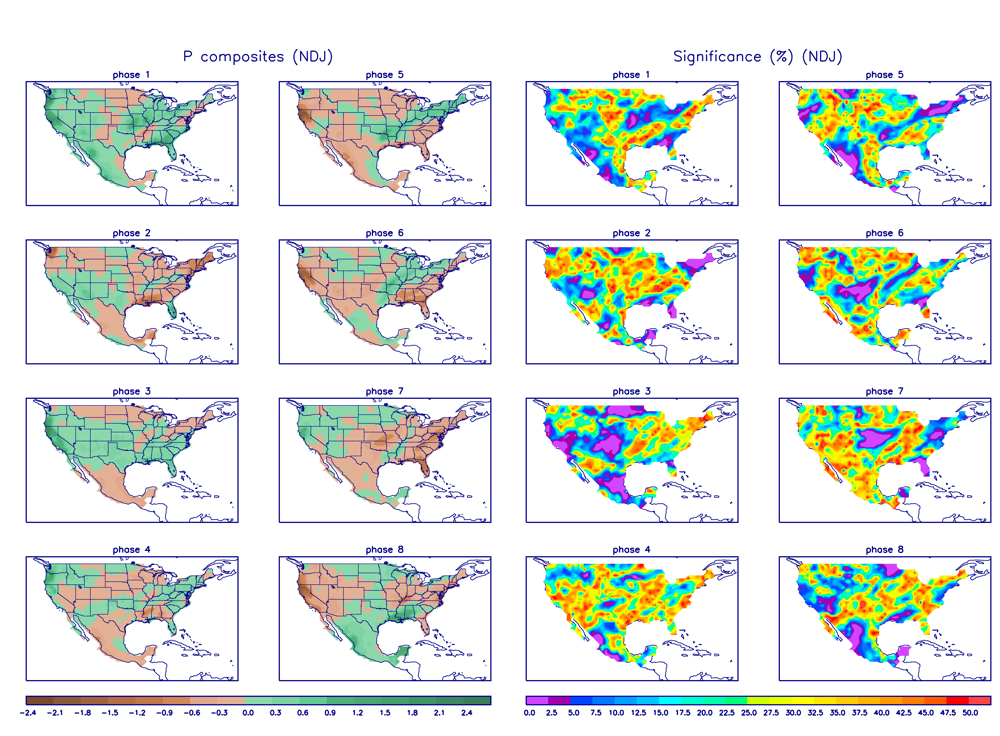
- Teleconnections (influence on weather): The MJO's temperature and precipitation teleconnections to U.S. weather depend on time of year and MJO phase. To the extent teleconnections are known, the November-January teleconnections for temperature are shown here and for precipitation are shown here.
- Comparison to Observed: The MJO is transitory and can change phases (modes) within a month, so it is more closely related to weekly weather patterns than monthly. The December 2014 monthly temperature anomaly pattern matches what is expected for MJO phases 3 through 6, while the weekly and monthly precipitation anomaly patterns match in some areas and not in others.
- The Pacific/North American (PNA) pattern
- Description: The PNA teleconnection pattern is associated with strong fluctuations in the strength and location of the East Asian jet stream. PNA-related blocking of the jet stream flow in the Pacific can affect weather downstream over North America, especially the West and especially in the winter half of the year.
- Status: The daily PNA index was started negative but turned positive for most of the month, averaging positive for the month as a whole. The 3-month-averaged index has been positive in recent months after a long run of mostly negative for the last two years.
- Teleconnections (influence on weather): To the extent teleconnections are known, for a positive PNA, the temperature teleconnection map for this time of year (January on the teleconnection maps) shows warmer-than-normal temperatures in Alaska, western Canada, and the west coast of the U.S., and cooler-than-normal temperatures for the Southern Plains to Atlantic Coast of the CONUS. The precipitation teleconnection map shows drier-than-normal weather in the Pacific Northwest to Central Rockies and much of the country along and east of the Mississippi River. The upper-level circulation anomaly teleconnections show above-normal heights over western Canada and the western CONUS, and below-normal heights over the southeastern and eastern CONUS.
- Comparison to Observed: The December 2014 temperature and upper-level circulation anomaly patterns show little agreement with a positive PNA, while the precipitation anomaly pattern agrees in parts of the Midwest to Great Lakes.
- The Arctic Oscillation (AO) pattern
- Description: The AO teleconnection pattern relates upper-level circulation over the Arctic to circulation features over the Northern Hemisphere mid-latitudes and is most active during the cold season.
- Status: The daily AO index started the month neutral, was positive for most of the month, dipped negative briefly near the end of the month, then turned positive at month's end, averaging positive for the month. The 3-month-averaged index was still negative in December reflecting the dominance of the negative monthly values for the last several months.
- Teleconnections (influence on weather): To the extent teleconnections are known, a positive AO this time of year (November-January) is typically associated with dry conditions in the Southeast and Northeast, wet conditions along the West Coast, above-normal temperatures east of the Rocky Mountains, near normal temperatures in the West, and upper-level circulation anomalies which are below normal across the Arctic into the northwestern North America, and above normal over the eastern CONUS, North Atlantic and North Pacific.
- Comparison to Observed: The December 2014 monthly temperature anomaly pattern is warmer than normal where the AO teleconnections are warm, (east of the Rockies), but there is no agreement in the West. The precipitation anomaly pattern has some agreement in the West but not eastern CONUS. The upper-level circulation anomaly pattern generally does not match.
- The North Atlantic Oscillation (NAO) pattern
- Description: The NAO teleconnection pattern relates upper-level circulation over the North Atlantic Ocean to circulation features over the Northern Hemisphere mid-latitudes.
- Status: The daily NAO index was positive for most of the month but turned negative at month's end, averaging positive for the month. The 3-month-averaged index was positive after many months in negative territory.
- Teleconnections (influence on weather): To the extent teleconnections are known, a positive NAO during this time of year (January on the teleconnection maps) is associated with drier-than-normal conditions in parts of the West (although the teleconnections are weak for precipitation), warmer-than-normal temperatures east of the Rockies, no temperature correlation across the West, positive upper-level circulation anomalies across the North Atlantic and most of the CONUS, and negative upper-level circulation anomalies over the Canadian Archipelago and Greenland.
- Comparison to Observed: The December 2014 monthly temperature anomaly pattern agrees with that expected with a positive NAO east of the Rockies and the upper-level circulation anomaly pattern agrees over the eastern CONUS and North Atlantic but not over Canada. The precipitation anomaly pattern shows little agreement.
- The West Pacific (WP) pattern
- Description: The WP teleconnection pattern is a primary mode of low-frequency variability over the North Pacific and reflects zonal and meridional variations in the location and intensity of the (East Asian) jet stream in the western Pacific.
- Status: The monthly WP index was near zero for the month, and the three-month average WP index was approaching zero after being negative for the last 12 to 18 months.
- Teleconnections (influence on weather): There are no teleconnection maps for a neutral WP.
- Comparison to Observed: The December 2014 monthly temperature, precipitation, and upper-level circulation anomaly patterns do not match those expected for either a positive or negative WP.
- The Tropical/Northern Hemisphere (TNH) pattern
- Description: The TNH teleconnection pattern reflects large-scale changes in both the location and eastward extent of the Pacific jet stream, and also in the strength and position of the climatological mean Hudson Bay Low, and is dominant in the winter months. The pattern significantly modulates the flow of marine air into North America, as well as the southward transport of cold Canadian air into the north-central United States.
- Status: The TNH index was near zero (but slightly negative) during December.
- Teleconnections (influence on weather): To the extent teleconnections are known, a negative TNH is typically associated with warmer-than-normal temperatures for much of the country, wetter-than-normal conditions in the West, and slightly drier-than-normal conditions in the Tennessee Valley. The upper-level circulation anomalies for a negative TNH are above-normal 500-mb geopotential heights over the eastern two-thirds of Canada and the north central U.S., and below-normal heights over the northeastern Pacific and Gulf of Mexico into the western North Atlantic.
- Observed: The December 2014 monthly temperature anomaly pattern is consistent with a negative TNH everywhere teleconnections exist. The upper-level circulation anomaly pattern matches that expected with a negative TNH across eastern Canada and the north central CONUS, does not match over the Gulf of Mexico and into the North Atlantic, and agrees over the northeast North Pacific except is shifted slightly in latitude. The monthly precipitation anomaly pattern generally agrees.
Examination of these circulation indices and their teleconnection patterns, and comparison to observed December 2014 temperature, precipitation, and circulation patterns, suggest that the weather over the CONUS in December reflected influences from the Pacific and Arctic. Even though the TNH index was only weakly negative (i.e., near zero), the TNH pattern reflects large-scale changes in both the location and eastward extent of the Pacific jet stream, and also in the strength and position of the climatological mean Hudson Bay Low. The December upper-level circulation pattern reflected a significant shift (weakening) in the Hudson Bay Low. The TNH pattern significantly modulates the flow of marine air into North America, as well as the southward transport of cold Canadian air into the north-central United States, and the December 2014 daily upper-level atmospheric circulation features reflected the dominance of Pacific marine air masses and absence of cold Canadian air masses over the CONUS. The December temperature pattern suggests the possible influence of the equatorial Pacific (MJO) and higher latitudes (AO and NAO) as well. There was some hint that the precipitation pattern may have been influenced by the drivers behind the MJO, TNH, AO, and even El Niño (even though ENSO was officially neutral). The drivers behind the PNA and WP appeared to have little influence on December's weather.
This month illustrates how the weather and climate anomaly patterns can be the manifestation of normal (random) atmospheric variability, as seen in the precipitation pattern, but also reflect influences from several atmospheric drivers (or modes of atmospheric variability), as seen in the temperature and circulation patterns.