Note: This Synoptic Discussion describes recent weather events and climate anomalies in relation to the phenomena that cause the weather. These phenomena include the jet stream, fronts and low pressure systems that bring precipitation, high pressure systems that bring dry weather, and the mechanisms which control these features — such as El Niño, La Niña, and other oceanic and atmospheric drivers (PNA, NAO, AO, and others). The report may contain more technical language than other components of the State of the Climate series.
Synoptic Discussion
Monthly upper-level circulation pattern and anomalies.
The July  weather pattern consisted of a classic battle between the subtropical high pressure belt (called the Bermuda High or Azores High), which is normally dominant this time of year, and the polar jet stream, which normally retreats well into Canada during the summer. The Bermuda High normally funnels hot and humid tropical air, along with a few tropical systems, into the central and eastern United States.
During July 2013, however, an active branch of the jet stream put a dent (trough) in the Bermuda High over the central U.S., paving the way for numerous
weather pattern consisted of a classic battle between the subtropical high pressure belt (called the Bermuda High or Azores High), which is normally dominant this time of year, and the polar jet stream, which normally retreats well into Canada during the summer. The Bermuda High normally funnels hot and humid tropical air, along with a few tropical systems, into the central and eastern United States.
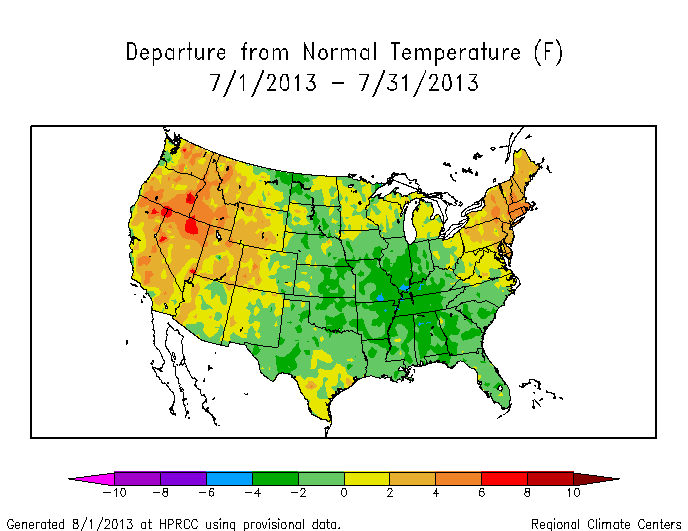
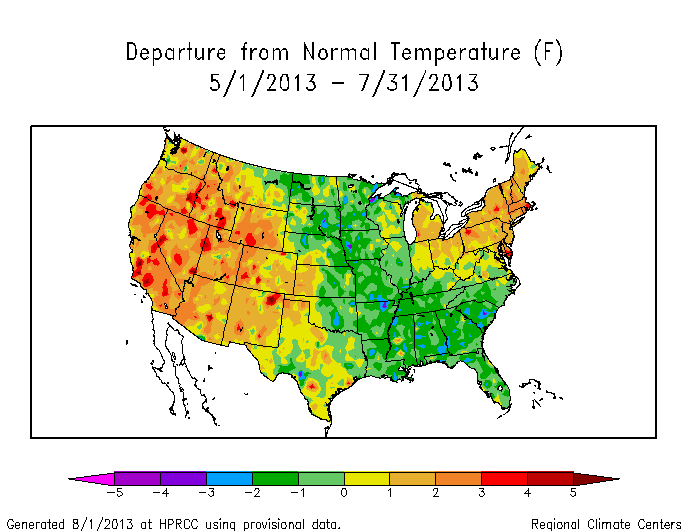
During July 2013, however, an active branch of the jet stream put a dent (trough) in the Bermuda High over the central U.S., paving the way for numerous  cold fronts and associated surface lows to bring cooler air from Canada into the central and southern states. This resulted in a monthly average upper-level circulation consisting of above-normal heights (or upper-level ridges) over the western and northeastern U.S., where warmer-than-normal temperatures dominated, and an upper-level trough with some below-normal heights over the central and southern U.S., where cooler-than-normal temperatures held sway.
This temperature pattern was so pervasive that four states in the West (Idaho, Nevada, Oregon, and Utah) and seven states in the Northeast (Connecticut, Delaware, Massachusetts, New Hampshire, New Jersey, Rhode Island, and Vermont) had July temperatures in the top ten warmest category (including two — Massachusetts and Rhode Island — with a record warm July), while four states in the South (Alabama, Arkansas, Mississippi, and Tennessee) ranked in the top ten coldest category.
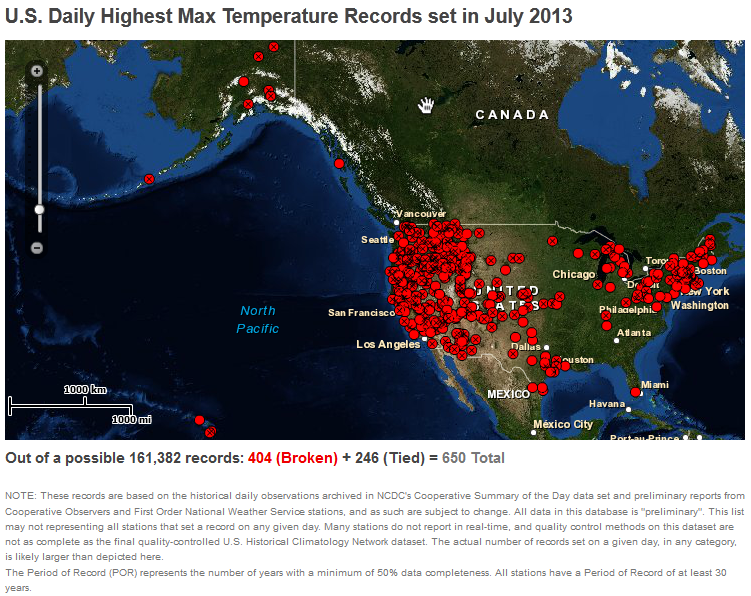
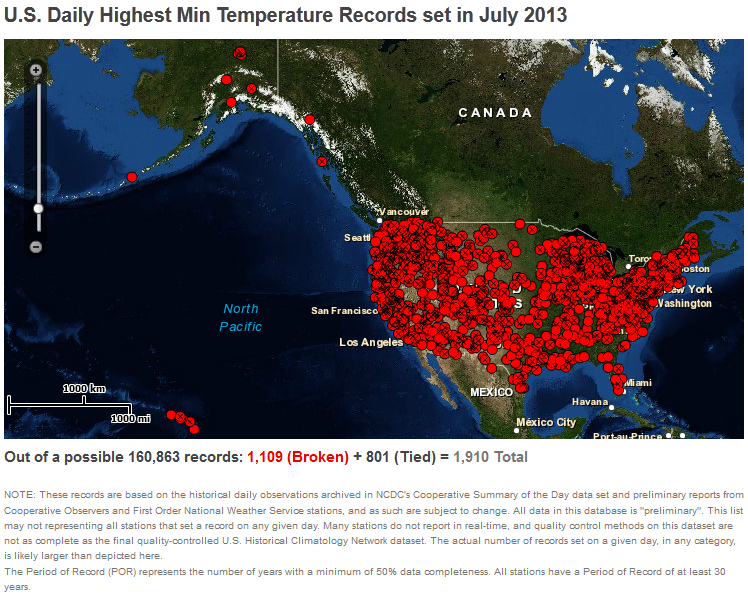
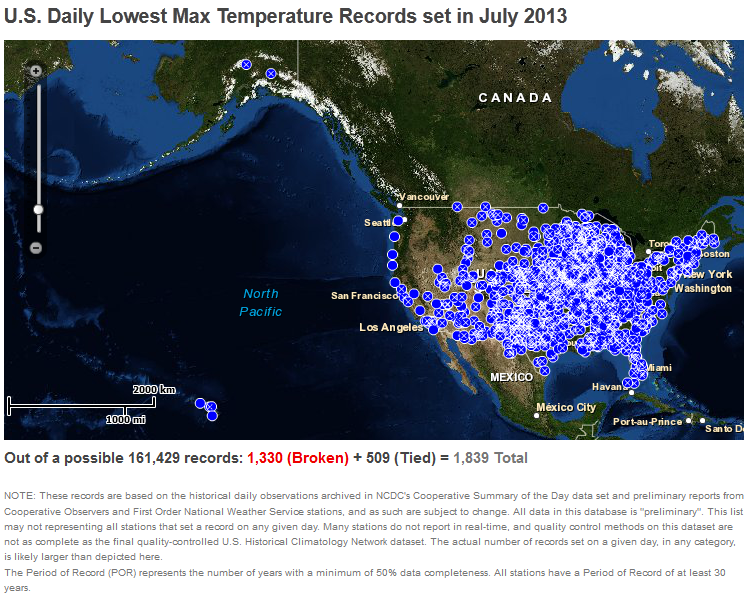
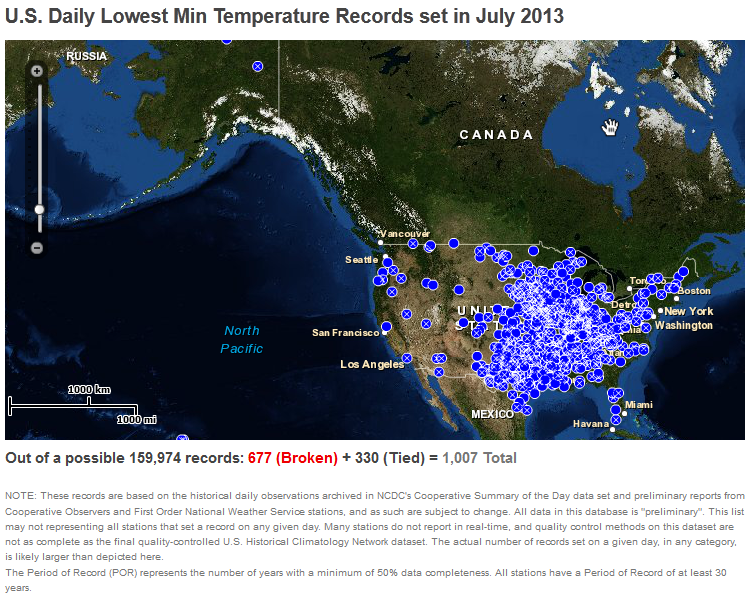
The number of record warm daily highs and lows (2560) was roughly the same as the number of record cool daily highs and lows (2846), although the cool camp had a slight edge (1.1 times as many).
In terms of duration, magnitude, and area of the temperature departures, the warm camp had the advantage, tilting the nation toward the warm side with a national temperature rank of 30th warmest for July 2013.
cold fronts and associated surface lows to bring cooler air from Canada into the central and southern states. This resulted in a monthly average upper-level circulation consisting of above-normal heights (or upper-level ridges) over the western and northeastern U.S., where warmer-than-normal temperatures dominated, and an upper-level trough with some below-normal heights over the central and southern U.S., where cooler-than-normal temperatures held sway.
This temperature pattern was so pervasive that four states in the West (Idaho, Nevada, Oregon, and Utah) and seven states in the Northeast (Connecticut, Delaware, Massachusetts, New Hampshire, New Jersey, Rhode Island, and Vermont) had July temperatures in the top ten warmest category (including two — Massachusetts and Rhode Island — with a record warm July), while four states in the South (Alabama, Arkansas, Mississippi, and Tennessee) ranked in the top ten coldest category.
The number of record warm daily highs and lows (2560) was roughly the same as the number of record cool daily highs and lows (2846), although the cool camp had a slight edge (1.1 times as many).
In terms of duration, magnitude, and area of the temperature departures, the warm camp had the advantage, tilting the nation toward the warm side with a national temperature rank of 30th warmest for July 2013.
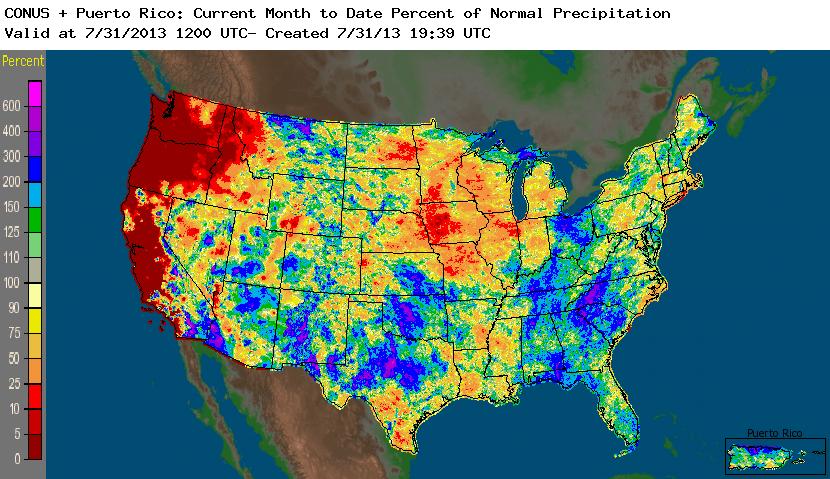
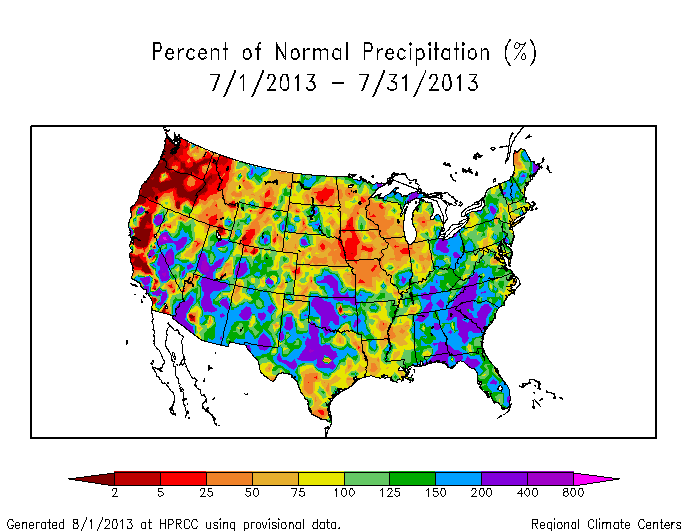
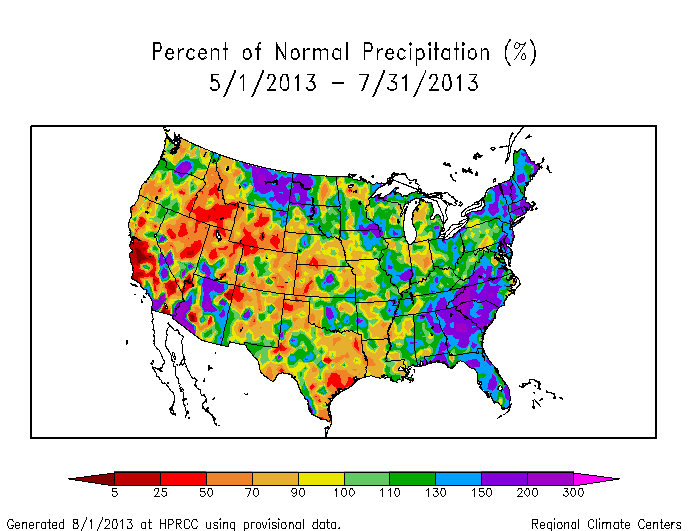
The upper-level ridge in the West steered rain systems away from the Pacific Northwest, which was drier than normal for July — in fact, Oregon had the driest July in the 1895-2013 record and Washington ranked eighth driest.
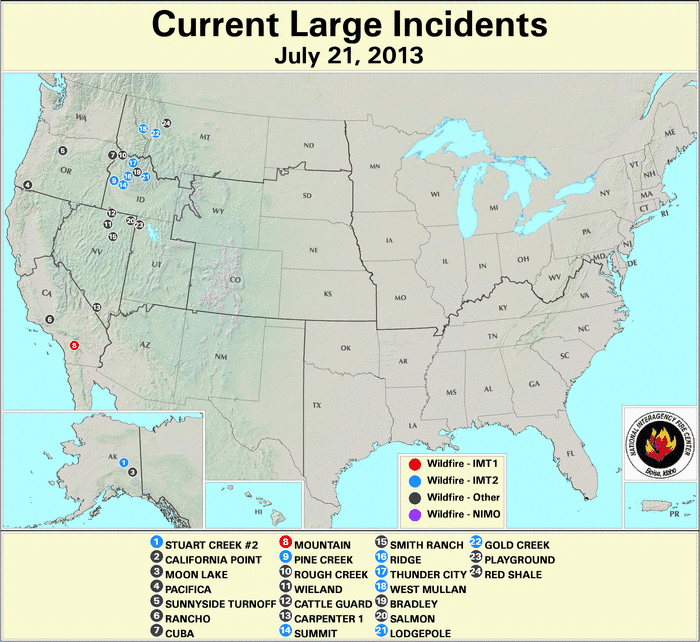
Persistent hot (weeks 1, 2, 3, 4) and dry (weeks 1, 2, 3, 4) weather contributed to numerous wildfires in the West, especially later in the month, although the monthly national number of wildfires and acres burned were both below average.
A southerly flow associated with a  stalled upper-level low early in the month, along with fronts and low pressure systems associated with the upper-level trough throughout the month, brought above-normal rainfall to much of the East, especially the Southeast. Twelve states east of the Mississippi River had a top ten wettest July.
The July weather pattern was further complicated at
stalled upper-level low early in the month, along with fronts and low pressure systems associated with the upper-level trough throughout the month, brought above-normal rainfall to much of the East, especially the Southeast. Twelve states east of the Mississippi River had a top ten wettest July.
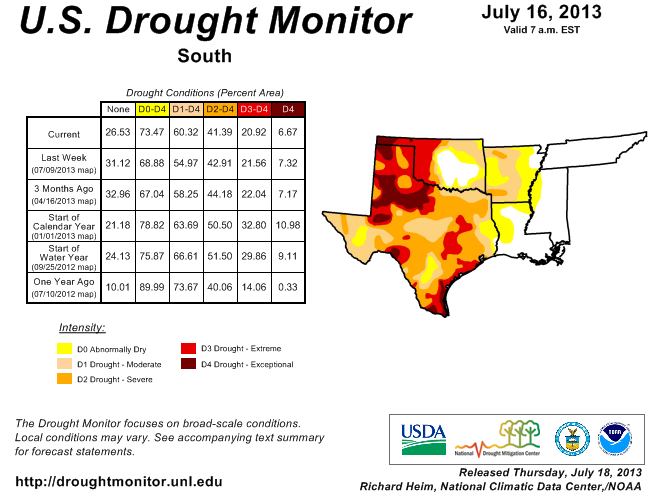
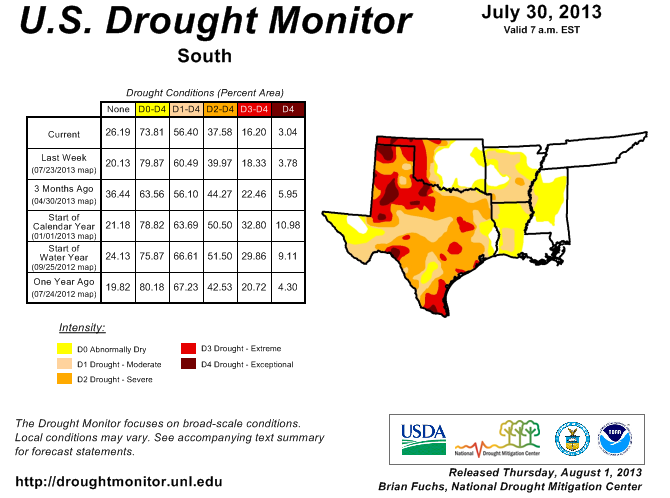
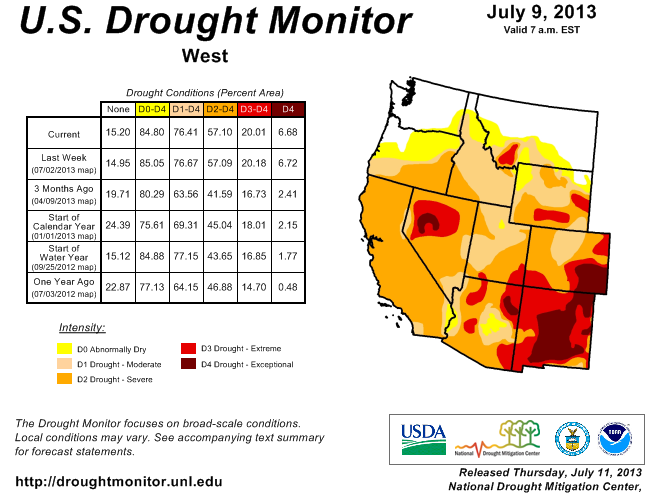
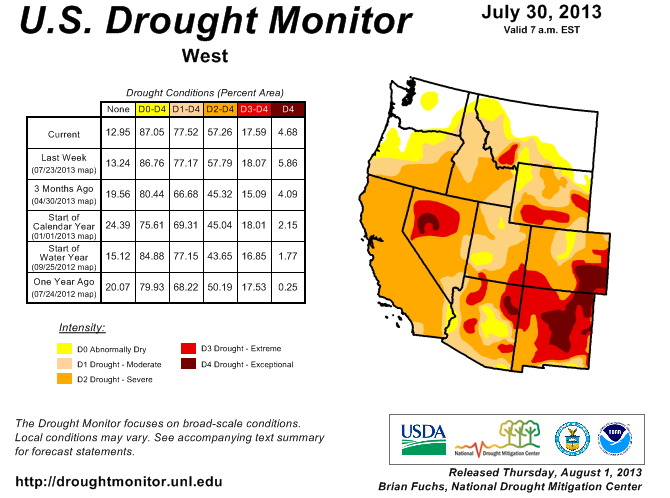
The July weather pattern was further complicated at  mid-month by an unusual upper-level low pressure system which started along the Mid-Atlantic coast, then retrograded against the flow and moved westward across the southern states. Cloud cover with this low kept temperatures cool. The low tapped Gulf of Mexico moisture as it moved westward, dumping abundant rainfall across the Southeast and Southern Plains, especially the drought areas of Texas (U.S. Drought Monitor [USDM] for July 16 vs. July 30). As it moved over the southwestern states, the low enhanced the summer monsoon rainfall to bring relief to many drought areas of the Southwest (USDM for July 9 vs. July 30).
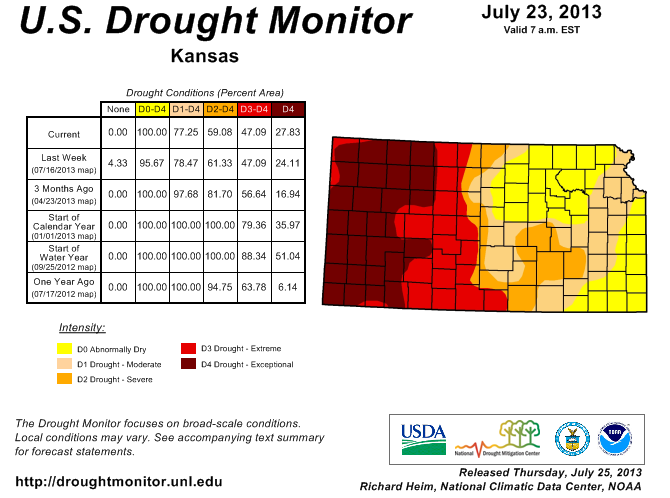
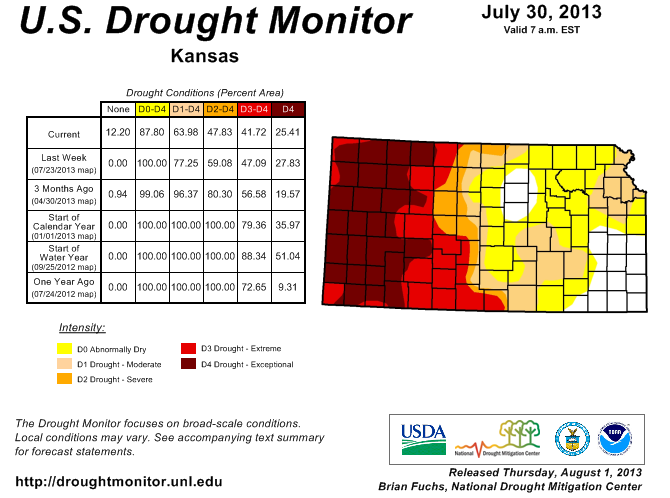
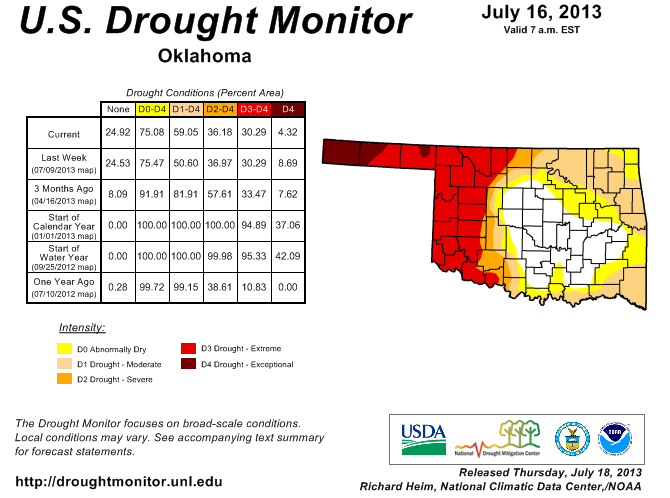
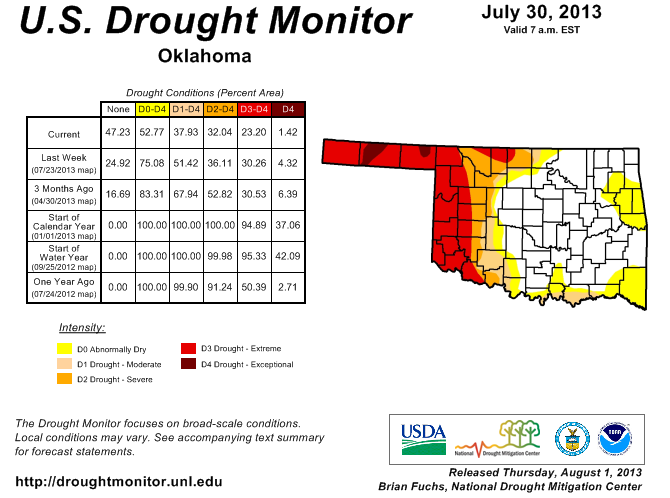
Gulf of Mexico moisture was tapped by cold fronts (and upper-level disturbances moving in the trough) to generate heavy rainfall in the Central Plains near the end of the month (weeks 1, 2, 3, 4). The heavy rainfall from these mesoscale convective systems improved the drought areas of Kansas (USDM for July 23 vs. July 30) and Oklahoma (USDM for July 16 vs. July 30), with July 2013 ranking as the tenth wettest July on record for Oklahoma.
mid-month by an unusual upper-level low pressure system which started along the Mid-Atlantic coast, then retrograded against the flow and moved westward across the southern states. Cloud cover with this low kept temperatures cool. The low tapped Gulf of Mexico moisture as it moved westward, dumping abundant rainfall across the Southeast and Southern Plains, especially the drought areas of Texas (U.S. Drought Monitor [USDM] for July 16 vs. July 30). As it moved over the southwestern states, the low enhanced the summer monsoon rainfall to bring relief to many drought areas of the Southwest (USDM for July 9 vs. July 30).
Gulf of Mexico moisture was tapped by cold fronts (and upper-level disturbances moving in the trough) to generate heavy rainfall in the Central Plains near the end of the month (weeks 1, 2, 3, 4). The heavy rainfall from these mesoscale convective systems improved the drought areas of Kansas (USDM for July 23 vs. July 30) and Oklahoma (USDM for July 16 vs. July 30), with July 2013 ranking as the tenth wettest July on record for Oklahoma.
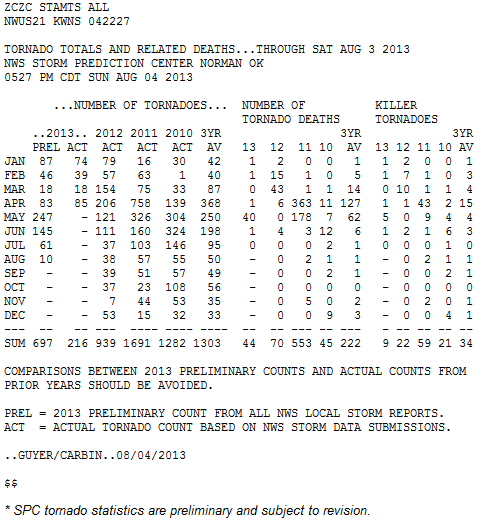
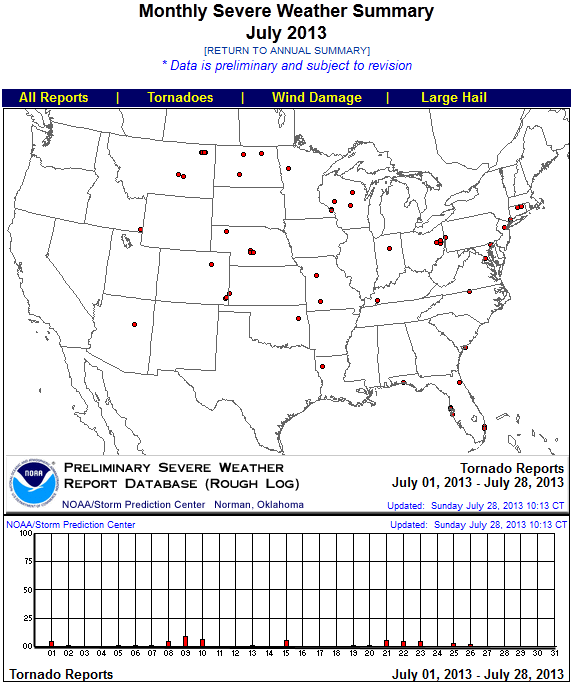
Two tropical storms (Chantal and Dorian) developed in the North Atlantic during July. Both were directed westward along the southern edge of the Bermuda High into the Caribbean Sea where they dissipated due to wind shear, dry mid-level air, and unfavorable upper-level conditions caused by the upper-level trough. Cold fronts from the trough propagated into the Southeast where they interacted with tropical moisture to give Florida the wettest July in the 119-year record. Severe weather developed in association with some of the cold fronts, with preliminary estimates of 61 tornadoes occurring, mostly scattered across the central and eastern two-thirds of the country. This was less than the July average of 134 tornadoes, due, in part, to stable northwesterly flow behind the upper-level trough which dominated the central United States.
The extremes in temperature and precipitation gave certain regions unusually high ranks of the Climate Extremes Index (CEI), which is an index that combines extreme weather indices to show their cumulative impact. A record high number of days with precipitation, second biggest rank for Palmer Index wetness, and second biggest rank for cool maximum temperatures gave the Southeast region its third largest July CEI in the 104-year record. The Southeast CEI has been ranked in the top ten for the last three consecutive Julys. The second biggest rank for Palmer Index long-term drought area, third biggest rank for warm minimum temperatures, and ninth biggest rank for warm maximum temperatures gave the West region its fourth largest July CEI. The record high number of days with precipitation, second biggest rank for warm minimum temperatures, and tenth biggest rank for Palmer Index long-term drought area gave the Southwest its eighth biggest July CEI.
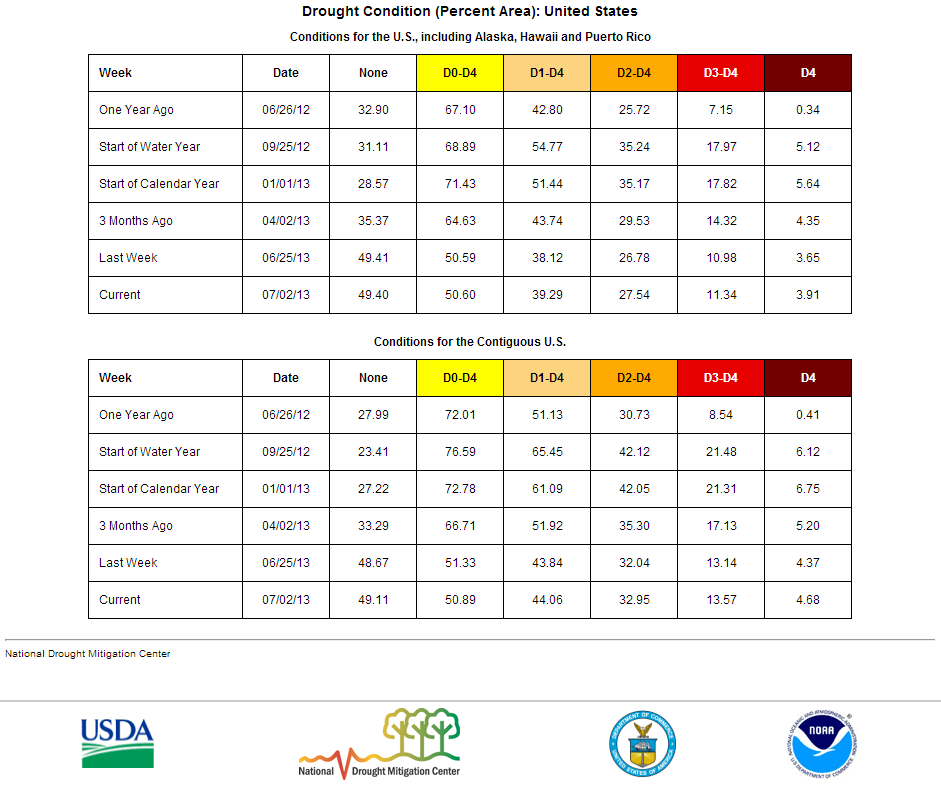
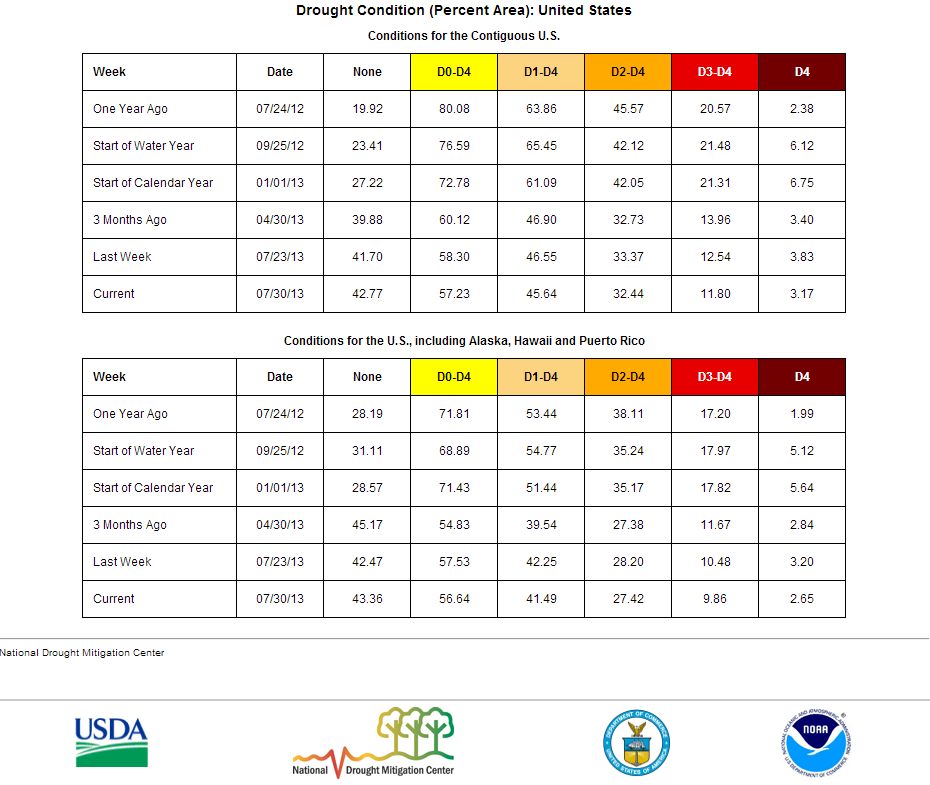
The many areas of heavy rain this month gave July 2013 a rank of fifth wettest July for the contiguous U.S. and helped shrink drought in parts of the Plains and Southwest. But dry weather dominated the Midwest — where Iowa had their tenth driest July and Wisconsin their twelfth driest — and Lower Mississippi Valley, as well as the Pacific Northwest. Drought crept back into parts of the Midwest and Mississippi Valley and expanded in the Pacific Northwest and Alaska. Overall, the national (all of the U.S.) drought footprint expanded from 39.3 percent at the end of June to 41.5 percent at the end of July. The drought footprint similarly expanded for the contiguous U.S. from 44.1 percent last month to 45.6 percent this month.
 |
 |
Subtropical highs, and cold fronts and low pressure systems moving in the storm track flow, are influenced by the broadscale atmospheric circulation. The following describes several such large-scale atmospheric circulation drivers and their potential influence this month:
-
El Niño Southern Oscillation (ENSO)
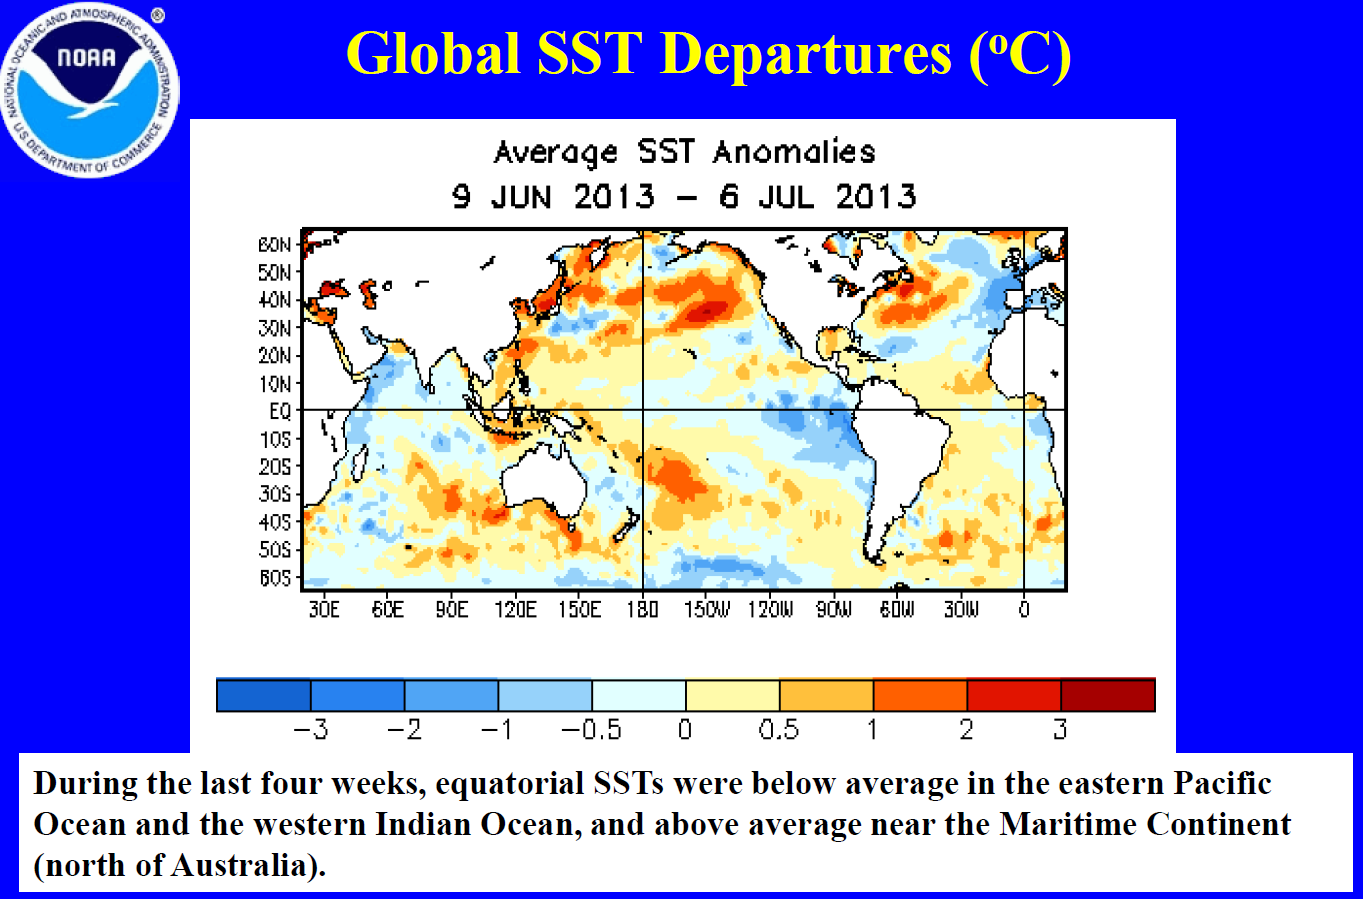
- Description: Oceanic and atmospheric conditions in the tropical Pacific Ocean can influence weather across the globe. ENSO is characterized by two extreme modes: El Niño (warmer-than-normal sea surface temperature [SST] anomalies in the tropical Pacific) and La Niña (cooler-than-normal SST anomalies), with the absence of either of these modes termed "ENSO-neutral" conditions.
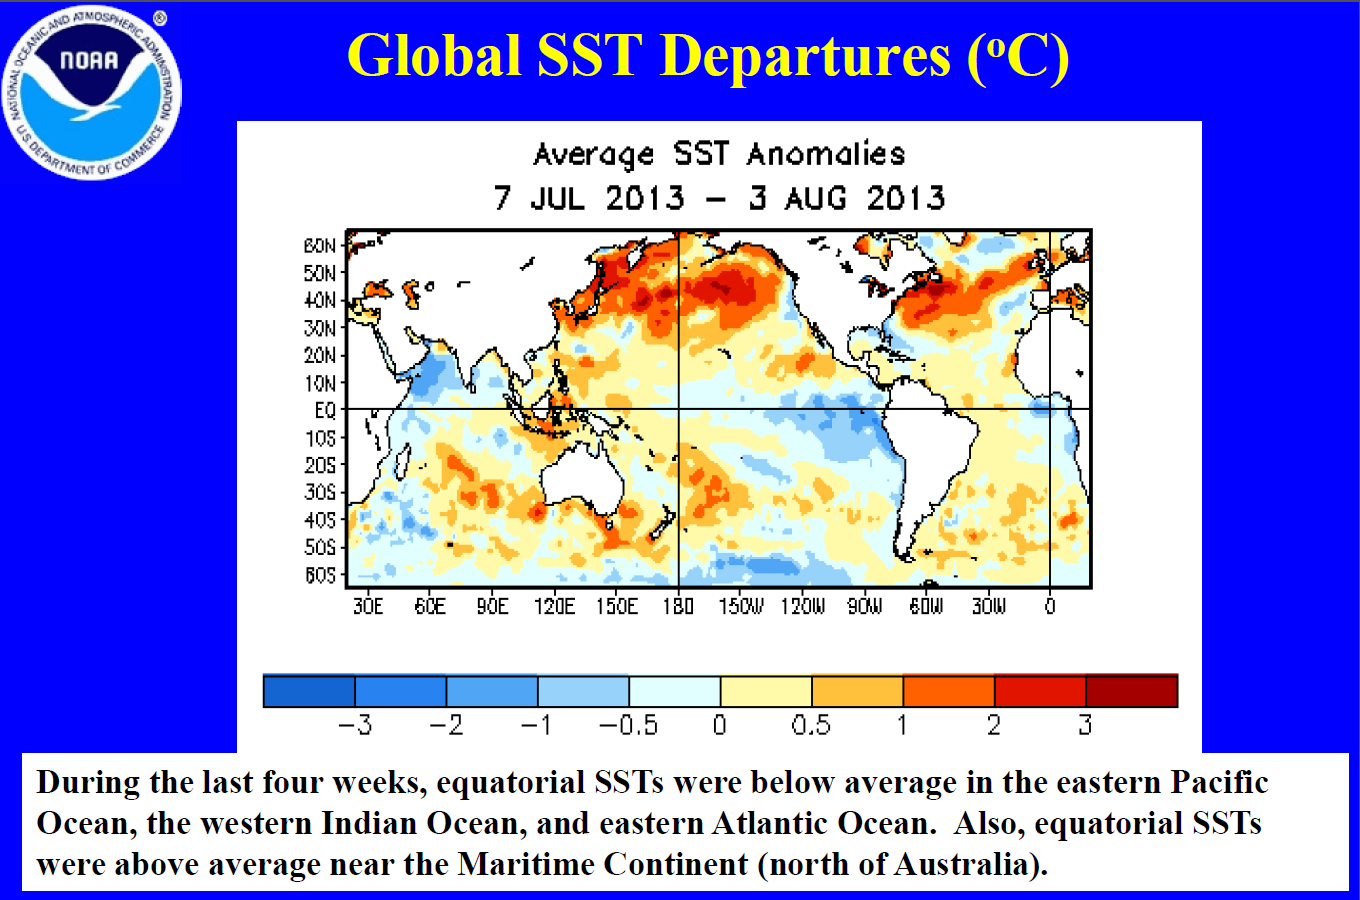
- Status: Ocean temperatures and atmospheric circulation anomalies indicated that the equatorial Pacific continued in an ENSO-neutral state during July, but SSTs were cooler-than-average over the eastern equatorial Pacific.
- Teleconnections (influence on weather): To the extent teleconnections are known, while in a neutral state, ENSO normally is not a player in the month's weather. Historical data can be analyzed to show typical temperature and precipitation patterns associated with El Niño and La Niña ENSO episodes. Teleconnections are not available for ENSO-neutral conditions.
-
Madden-Julian Oscillation (MJO)
- Description: The MJO is a tropical disturbance or "wave" that propagates eastward around the global tropics with a cycle on the order of 30-60 days. It is characterized by regions of enhanced and suppressed tropical rainfall. One of its indices is a phase diagram which illustrates the phase (1-8) and amplitude of the MJO on a daily basis. The MJO is categorized into eight "phases" depending on the pattern of the location and intensity of the regions of enhanced and suppressed tropical rainfall. Overall, the MJO tends to be most active during ENSO-neutral years, and is often absent during moderate-to-strong El Niño and La Niña episodes.
- Status:The MJO began the month in phase 2, then weakly transitioned to phase 3 before becoming incoherent for the last half of the month when other modes of convective variability in the tropics, such as Kelvin and Rossby waves, became apparent (as indicated by the MJO discussions for July 8, 15, 22, 29, and August 5). The propagation of enhanced precipitation anomalies eastward across the equatorial Pacific is associated with this transition.
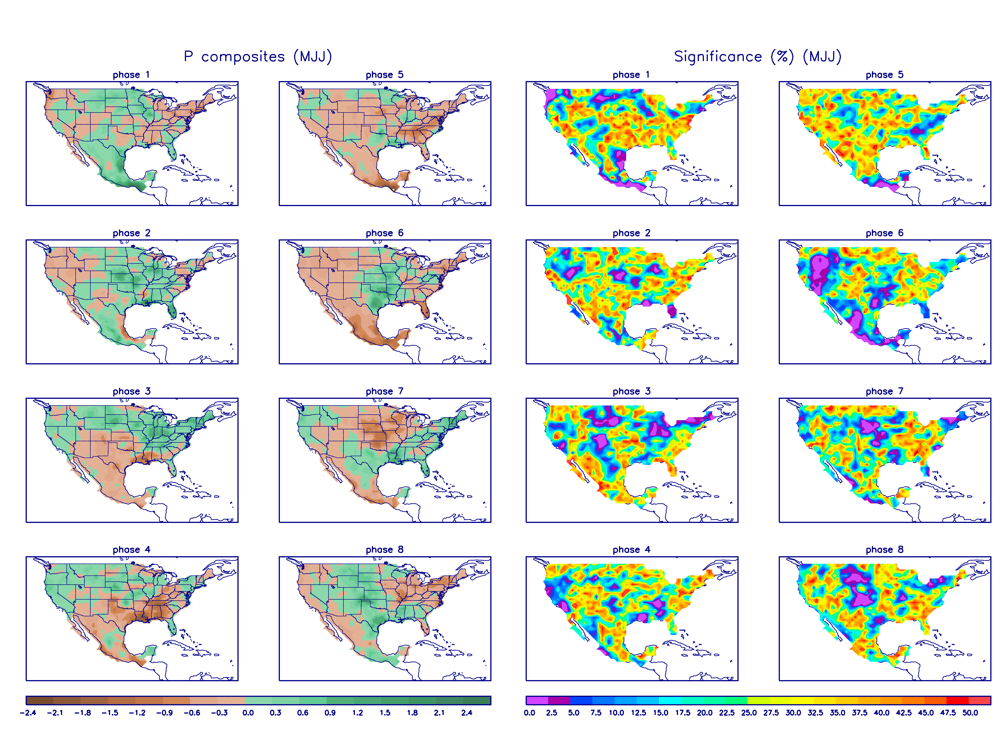
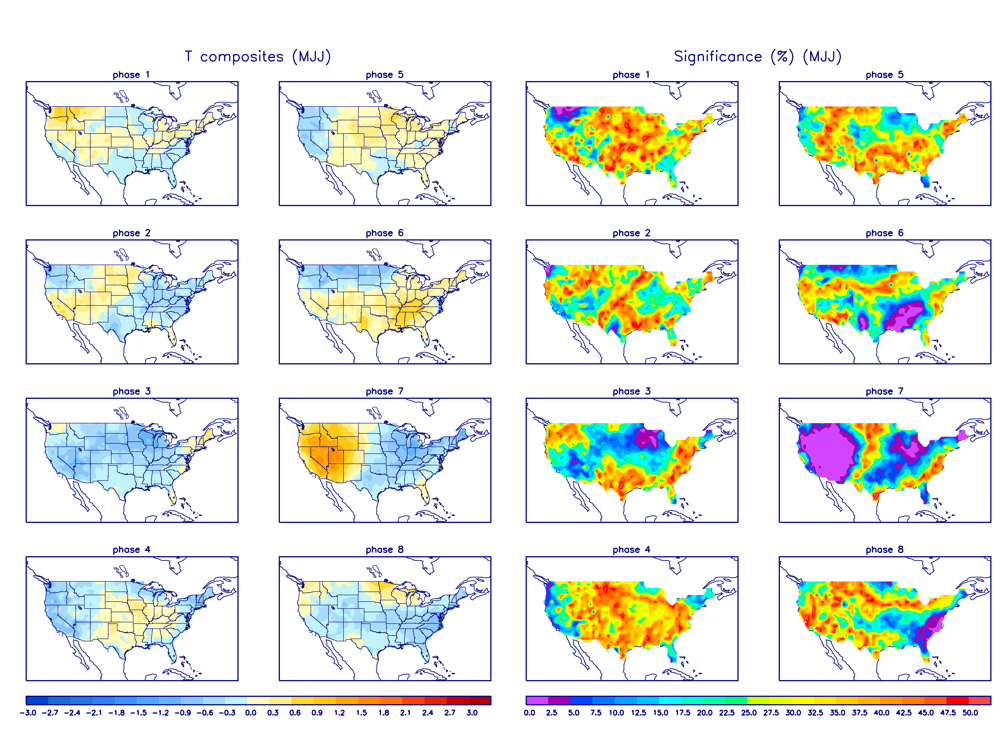
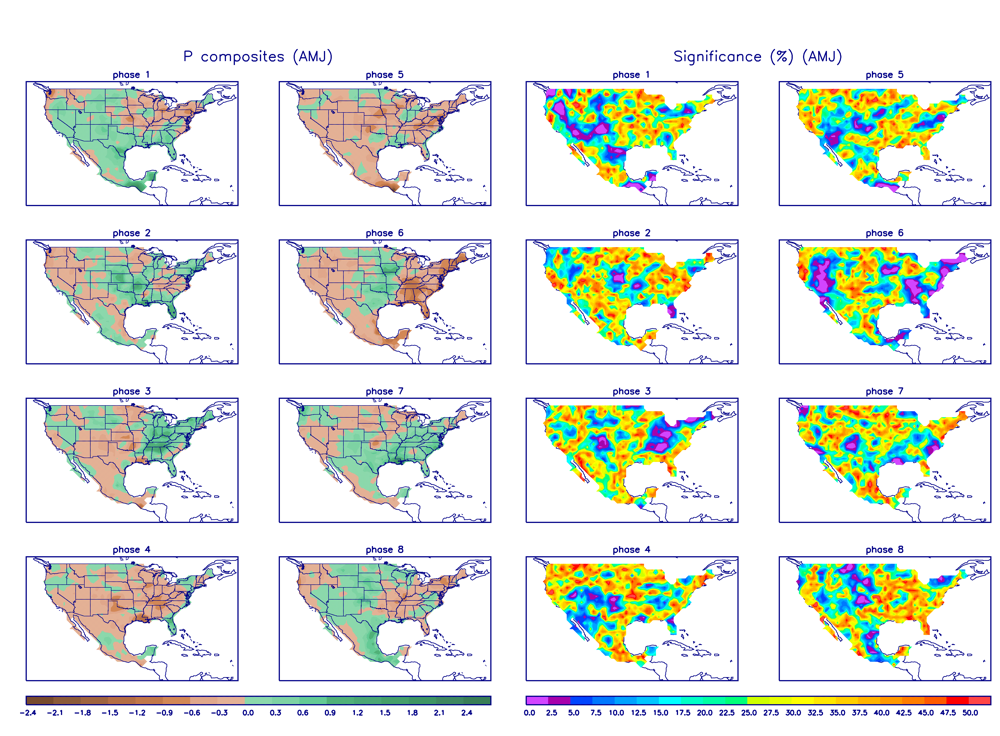
- Teleconnections (influence on weather): The MJO's temperature and precipitation teleconnections to U.S. weather depend on time of year and MJO phase. To the extent teleconnections are known, the May-July teleconnections for precipitation are shown here and for temperature are shown here.
- Observed: The MJO is transitory and can change phases (modes) within a month, so it is more closely related to weekly weather patterns than monthly. The July 2013 monthly precipitation pattern shows some correlation to the precipitation teleconnection pattern for MJO phase 2 this time of year in the Southeast, although the only statistically significant correlation is for Florida. The above-normal precipitation in the Southeast in weekly precipitation anomaly patterns during weeks 1 and 2 generally corresponds to the teleconnections for the MJO phase during these weeks (phase 2). The July 2013 monthly temperature pattern shows some similarity to the teleconnections for MJO phase 2 (cooler than normal in the Midwest to Southeast and Southern Plains, warmer than normal in the Southwest), although the statistical significance of these correlations is low. The match is especially evident for week 1.
- The Pacific/North American (PNA) pattern
- Description: The PNA teleconnection pattern is associated with strong fluctuations in the strength and location of the East Asian jet stream. PNA-related blocking of the jet stream flow in the Pacific can affect weather downstream over North America, especially the West and especially in the winter half of the year.
- Status: The daily PNA index was positive at the beginning of the month, then turned negative for most of July, averaging negative for the month as a whole.
- Teleconnections (influence on weather): To the extent teleconnections are known, the temperature teleconnection map for this time of year (July on the maps) shows little correlation with the PNA. The precipitation and upper-level circulation anomaly teleconnections are likewise weak, although there is some hint that a negative PNA is correlated with dryness from Montana to Texas and wetness in the upper Great Lakes.
- Observed: The mixed precipitation anomalies from Montana to Texas and in the upper Great Lakes during July 2013 do not agree with those expected with a negative PNA. The lack of notable teleconnections for temperature and upper-level circulation, and the mixed pattern of precipitation anomalies, suggest that the PNA had little influence on the weather during this month.
- The Arctic Oscillation (AO) pattern
- Description: The AO teleconnection pattern relates upper-level circulation over the Arctic to circulation features over the Northern Hemisphere mid-latitudes and is most active during the cold season.
- Status: The daily AO index was weakly positive for the first half of July and weakly negative during the second half, averaging neutral for the month.
- Teleconnections (influence on weather): To the extent teleconnections are known, a neutral AO this time of year (May-July) is typically associated with slight dryness in Texas, but has little correlation to temperatures or upper-level circulation anomalies.
- Observed: The July 2013 monthly precipitation anomaly pattern shows some agreement with the neutral AO teleconnection in southern Texas, but there is better agreement between the positive and negative phases of the daily AO index and the weekly precipitation anomalies in many regions (weeks 1, 2, 3, 4). Likewise for temperature, on the monthly scale there is no correlation but the positive and negative phases of the daily AO index show agreement with the weekly temperature anomalies in many areas (weeks 1, 2, 3, 4).
- The North Atlantic Oscillation (NAO) pattern
- Description: The NAO teleconnection pattern relates upper-level circulation over the North Atlantic Ocean to circulation features over the Northern Hemisphere mid-latitudes.
- Status: The daily NAO index started the month positive, then transitioned to weakly negative, averaging positive for the month.
- Teleconnections (influence on weather): To the extent teleconnections are known, a positive NAO during this time of year (July on the teleconnection maps) is typically associated with warmer-than-normal temperatures over the northwestern third of the country, cooler-than normal conditions across the Southern Plains and Southeast, drier-than-normal conditions in the Northern Plains and Midwest, patchy wet conditions along parts of the Gulf Coast (although the correlations are weak for precipitation), and positive upper-level circulation anomalies in the northwestern quarter of the country centered over Montana, with negative anomalies touching the Gulf of Mexico coast.
- Observed: The July and May-July 2013 temperature anomaly patterns match those expected for a positive NAO in the Northwest, Southern Plains, and Southeast. The July precipitation anomaly pattern shows some agreement in the Northern Plains and Midwest, where it was dry. The July 2013 upper-level circulation anomaly pattern is somewhat consistent with a positive NAO over New England/Canadian Maritimes/North Atlantic, Northern Canada, and the Northern Rockies, and a hint of agreement over the Deep South.
- The East Pacific-North Pacific (EP-NP) pattern
- Description: The EP-NP teleconnection pattern relates SST and upper-level circulation patterns over the eastern and northern Pacific to temperature, precipitation, and circulation anomalies downstream over North America. Its influence during the winter is not as strong as during the other three seasons.
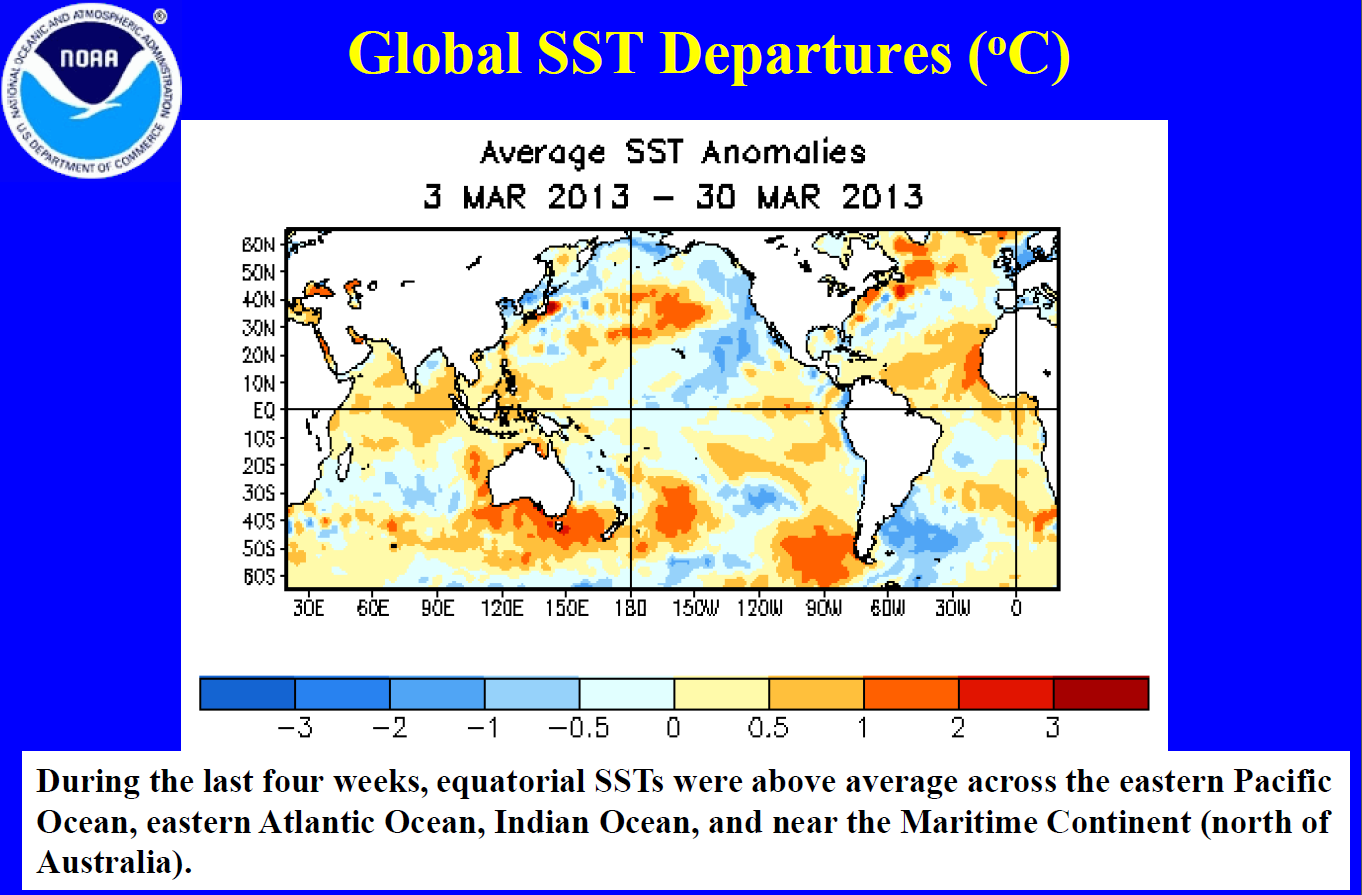
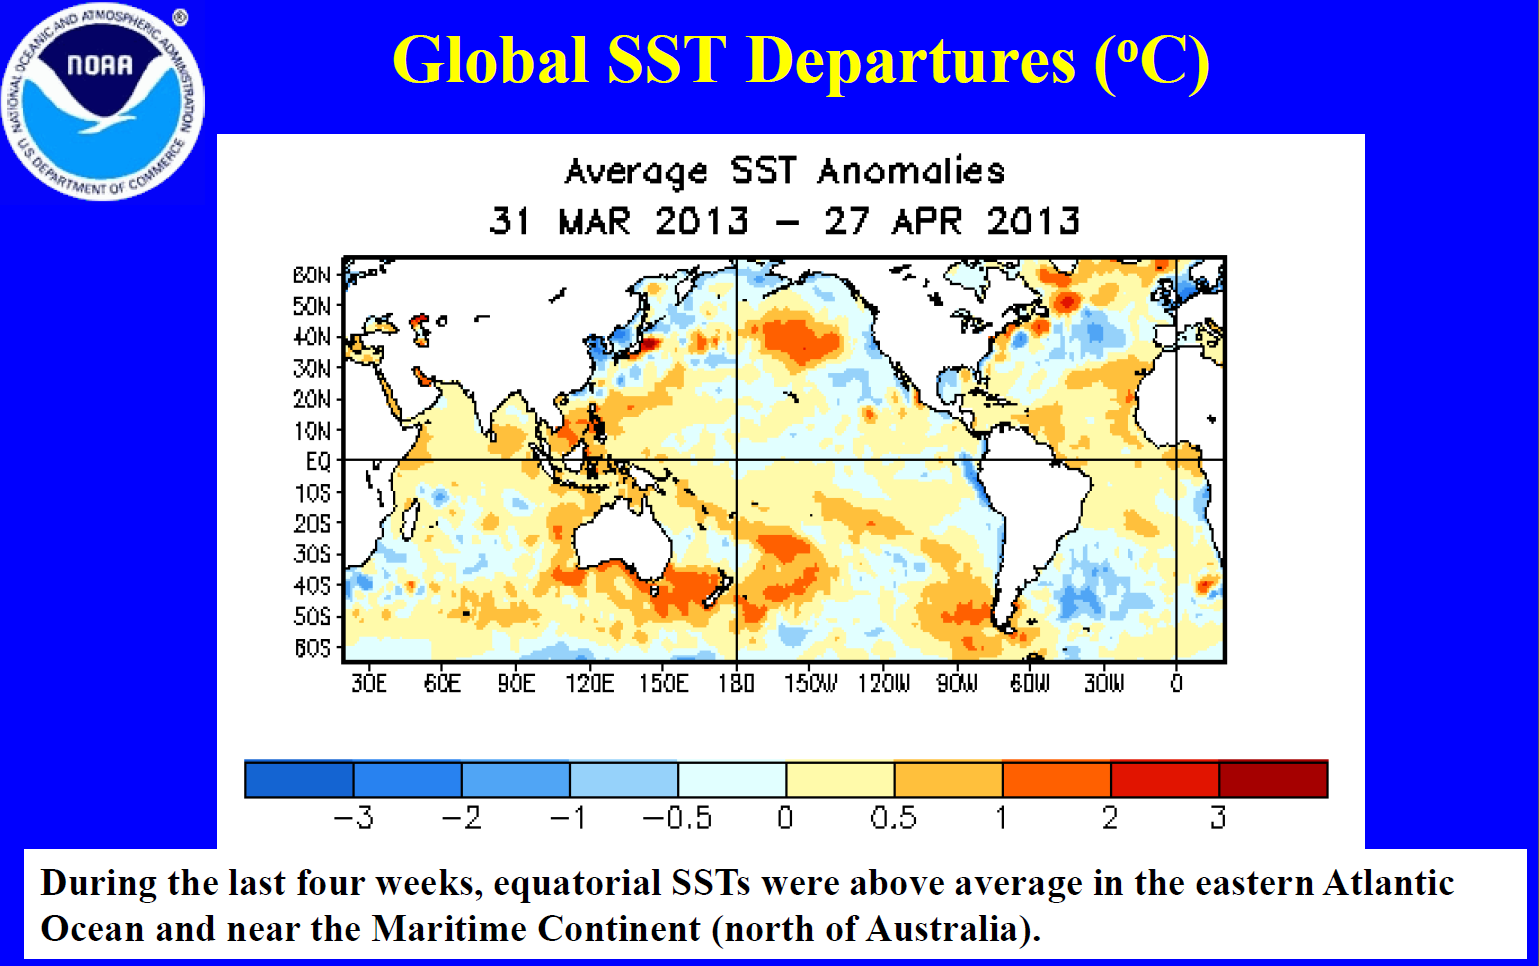
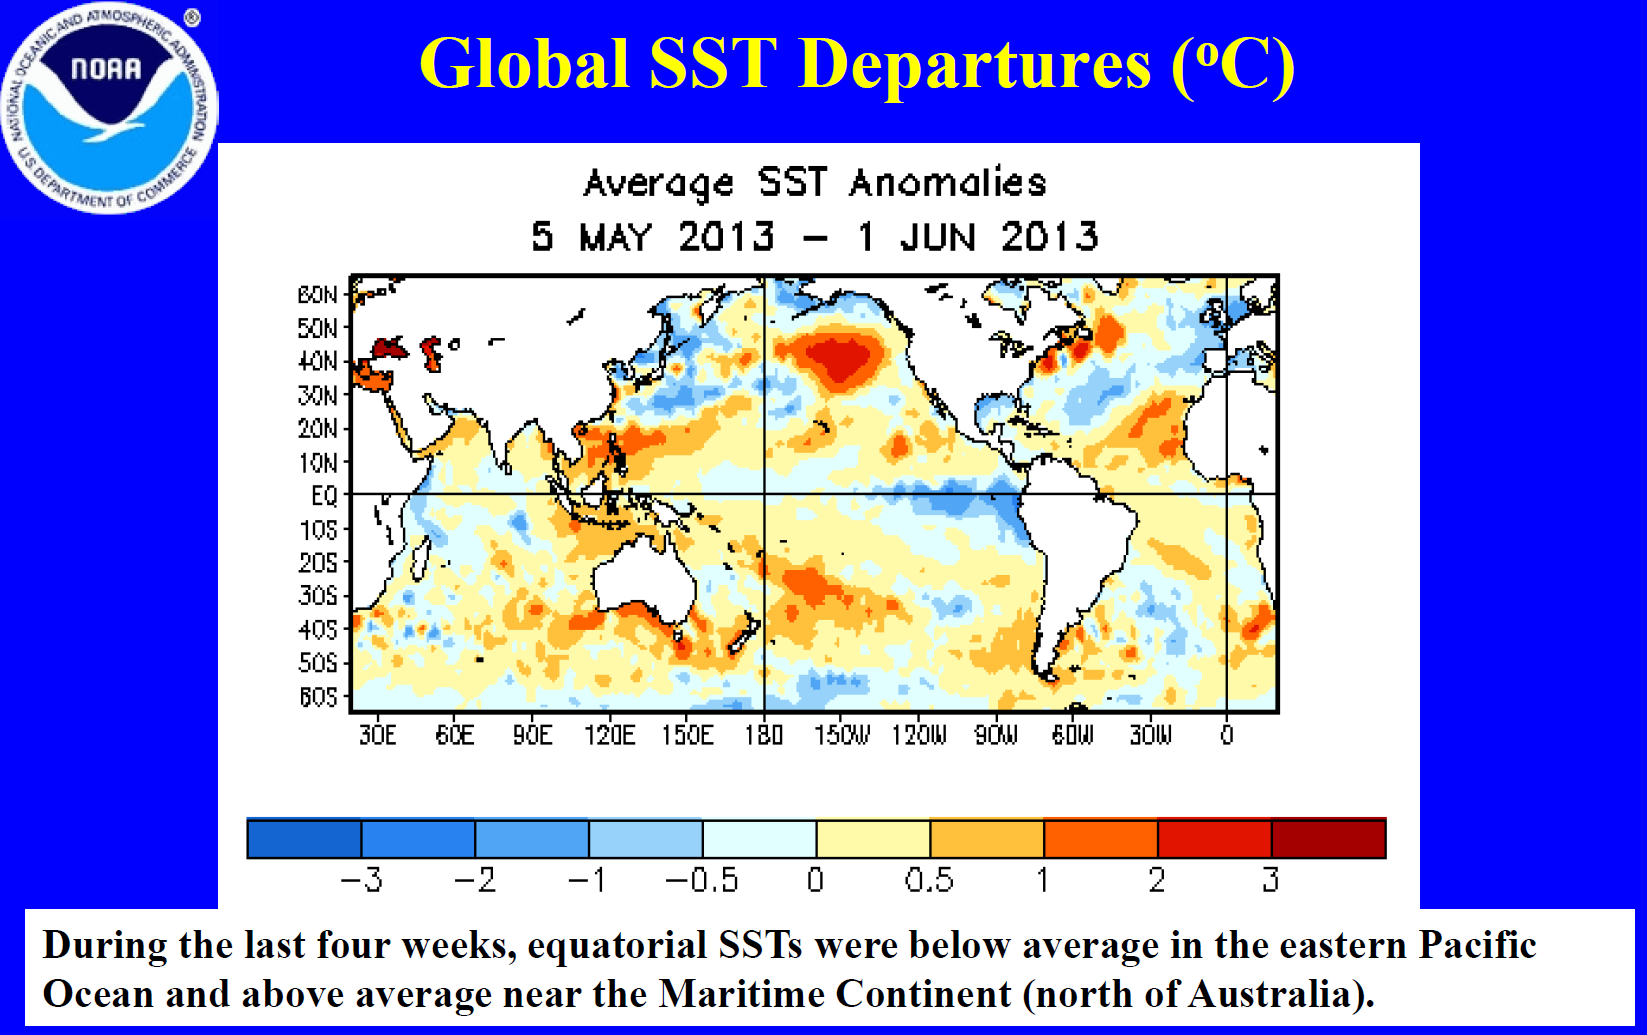
- Status: The SST pattern over the northeast Pacific during July 2013 was dominated by a large pool of warmer-than-normal SSTs in the central North Pacific, with cooler-than-normal SSTs immediately along the western U.S. coast. The warm pool has gradually expanded over the last several months (March, April, May, June, July) to now dominate much of the North Pacific. The EP-NP index (both the monthly index and 3-month running mean) was positive.
- Teleconnections (influence on weather): To the extent these teleconnections are known, a positive EP-NP index during this time of year (July on the maps) is typically associated with cooler-than-normal temperatures in the north central U.S. and much of Canada, warmer-than-normal temperatures in parts of Alaska, below-normal upper-level circulation anomalies (stronger upper-level trough) over eastern Canada into the north central U.S., and above-normal upper-level circulation anomalies (stronger upper-level ridge) over western North America, including Alaska (the correlations are weak for precipitation).
- Observed: The temperature anomalies for July (contiguous U.S. and Alaska) and May-July (contiguous U.S. and Alaska) are a good match for a positive EP-NP for those areas where correlations exist. The July 2013 upper-level circulation anomaly patterns over western Canada and Alaska (positive anomalies) are consistent with those expected for a positive EP-NP; while an upper-level trough is evident over the Great Lakes to Lower Mississippi Valley, the trough was not strong enough to produce negative height anomalies (which are expected from the teleconnections) except over the vicinity of Arkansas.
 |
 |
Examination of these circulation indices and their teleconnection patterns, and comparison to observed July 2013 and May-July 2013 temperature, precipitation, and circulation patterns, suggests that the MJO, AO, NAO, and EP-NP drivers each exerted some influence during July (the influence for temperature is stronger than for precipitation this time of year). ENSO was neutral, and thus not a player; the PNA changed signs during the month, thus making its signal difficult to decipher, but its influence is not as strong during the summer as it is in the winter. The MJO signal could be seen during the first week or two of the month, and the AO signal was visible on a weekly scale but not monthly scale. The EP-NP and NAO drivers, taken together, are a very good match for the temperature anomaly pattern across all of the U.S. except the Northeast and for the upper-level circulation pattern across much of the North American sector. Precipitation is not as strongly correlated to the atmospheric drivers during the summer as it is during the winter, with random convective processes playing a greater role in precipitation during the summer. But some elements of the July precipitation pattern might be traced to the influence of the MJO, AO, and NAO drivers. This month illustrates how competing atmospheric drivers may work in phase to create a complex weather pattern.
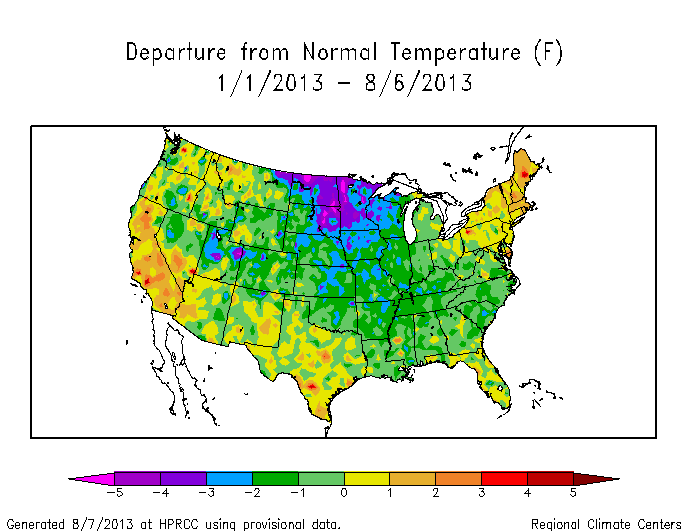
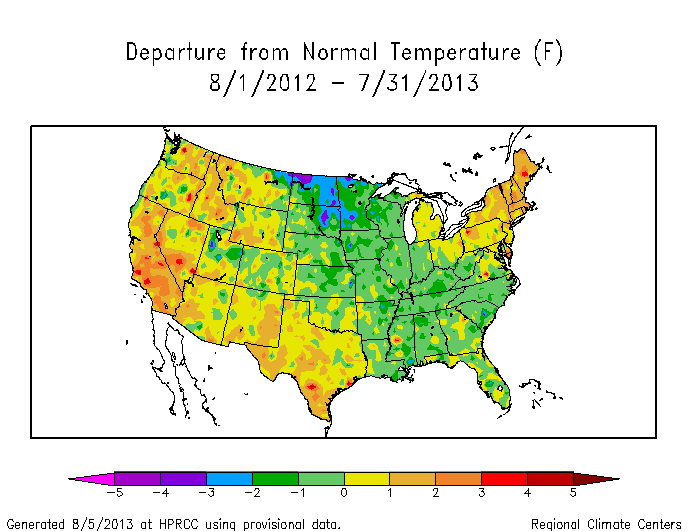
It should also be noted that, during the last three months, the PNA, AO, and NAO indices have fluctuated on both sides of the scale, cycling between positive, neutral, and negative several times, and the MJO cycled through several phases, which is characteristic of such drivers which oscillate on short (e.g., weekly to monthly) time scales. On the other hand, the EP-NP index has transitioned from a negative state to a positive state, fairly steadily, over the last 12 months, and has been mostly positive during May-July and, indeed, for much of August 2012-July 2013. The temperature pattern over the U.S. has consisted of below-normal temperatures over the central regions and warmer-than-normal temperatures over the west and northeast coasts, under the influence of a persistent long-wave trough over central North America. This pattern is evident in the temperature anomaly maps for July 2013, the last three months (May-July 2013), since the beginning of the year (January-July 2013), and even for the last twelve months (August 2012-July 2013). This consistent pattern at these multiple time scales is remarkably similar (even accounting for seasonal shifts) to the teleconnection pattern for a slowly-evolving positive EP-NP.