Note: This Synoptic Discussion describes recent weather events and climate anomalies in relation to the phenomena that cause the weather. These phenomena include the jet stream, fronts and low pressure systems that bring precipitation, high pressure systems that bring dry weather, and the mechanisms which control these features — such as El Niño, La Niña, and other oceanic and atmospheric drivers (PNA, NAO, AO, and others). The report may contain more technical language than other components of the State of the Climate series.
Synoptic Discussion
Monthly upper-level circulation pattern and anomalies.
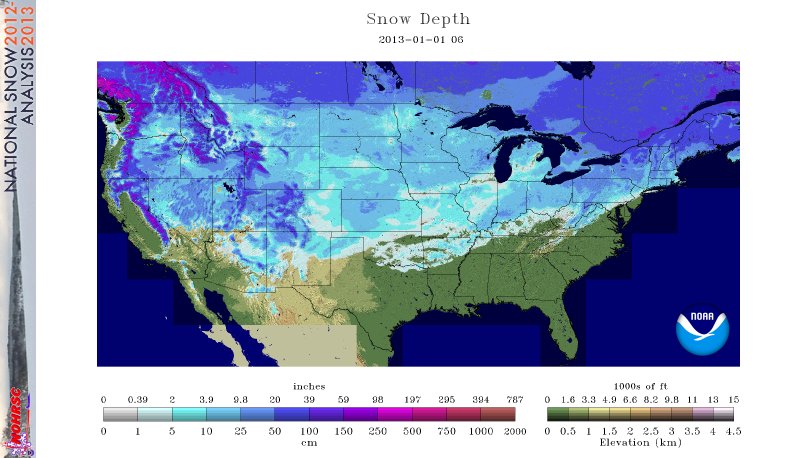
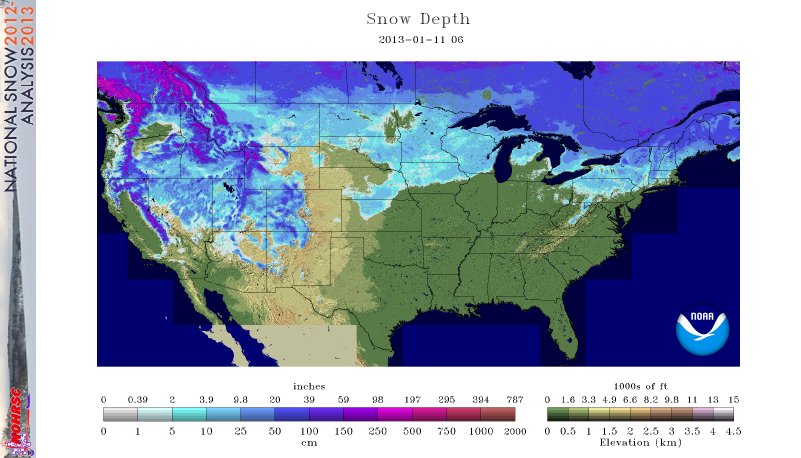
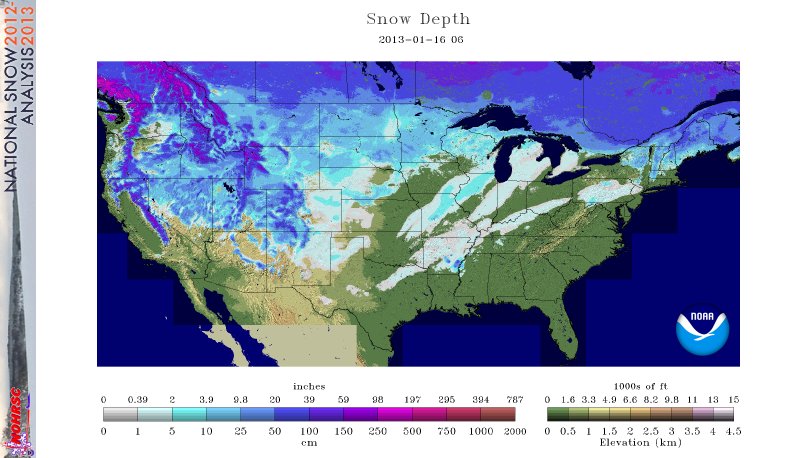
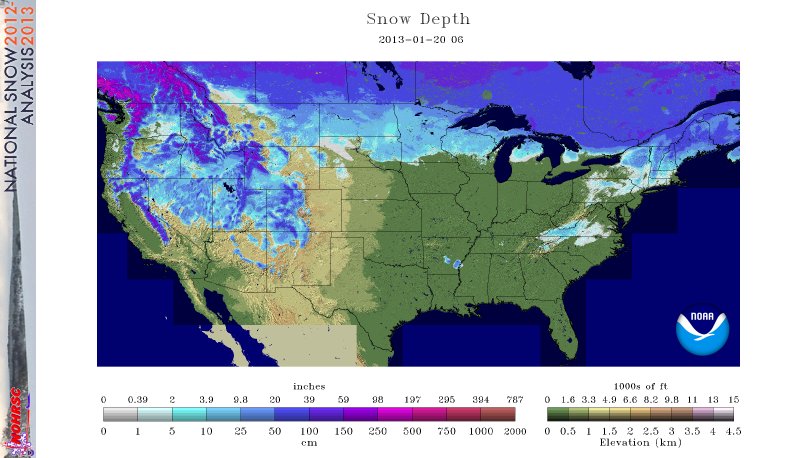
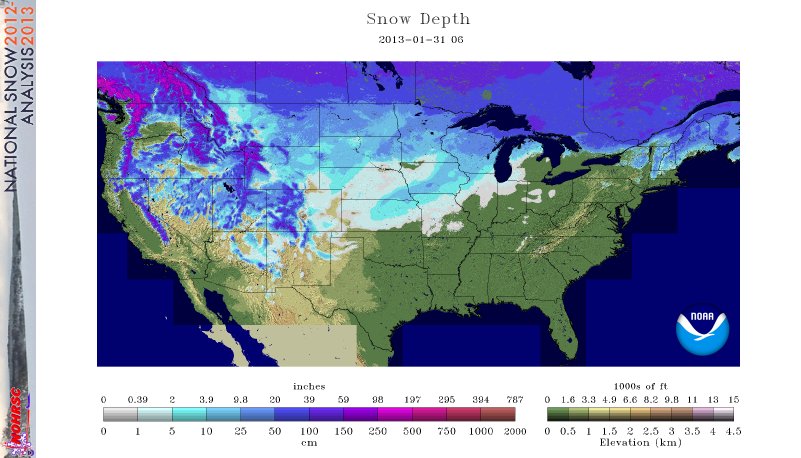
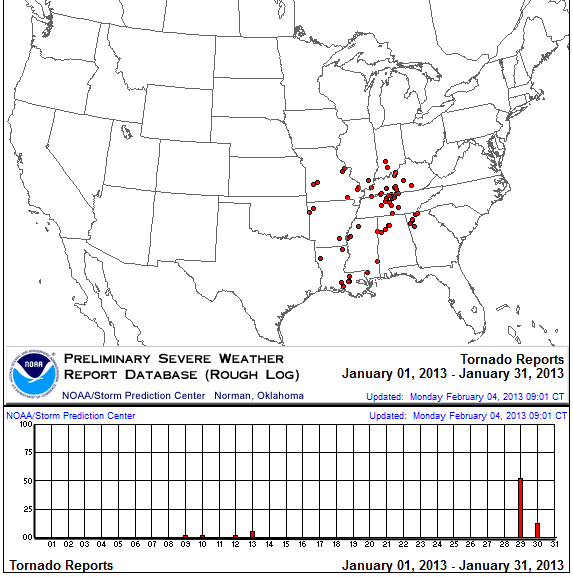
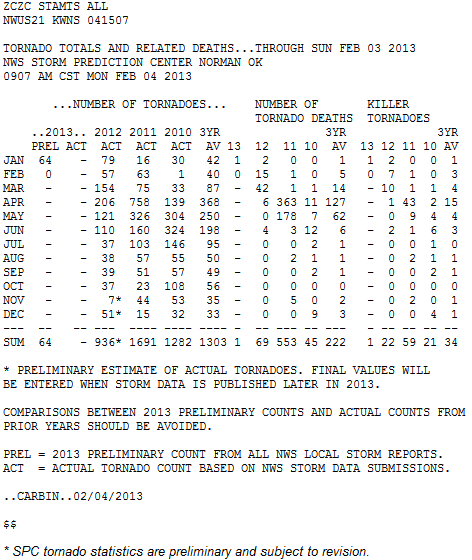
January is the heart of the winter season when the cold polar air masses of the circumpolar vortex have the greatest likelihood of expanding south across the United States. The polar jet stream (which marks the edge of the circumpolar vortex and the boundary between the cold polar air masses to the north and the warmer sub-tropical air masses to the south) was  very active during January 2013, meandering in large loops of troughs and ridges as it blew across the country, bringing warm and cold spells to different areas during the month (weeks 1, 2, 3, 4, 5). Winter storms moving in the jet stream flow tapped Gulf of Mexico moisture to drop above-normal precipitation over the Lower to Mid-Mississippi and Ohio valleys and southern Appalachians (weeks 1, 2, 3, 4, 5), while winter storms in the western trough brought welcomed precipitation over parts of the West. But the weather systems largely avoided the heart of the Central Plains and Southeast drought areas. Snow cover extent expanded and contracted with each passing storm (from 67 percent of the country snowcovered on January 1st, to 40 percent on the 11th, 49 percent on the 16th, 34 percent on the 20th, and 45 percent on the 31st), but ended up near average when integrated across the country and across the month. A spring-like storm system near the end of the month generated a tornado outbreak in the South to Midwest that raised the total preliminary tornado count to 64 tornadoes, which is above the long-term average for January. This is usually a quiet time of year for wildfires, but even so, 2013 had the second lowest number of wildfires for January in the 14-year record.
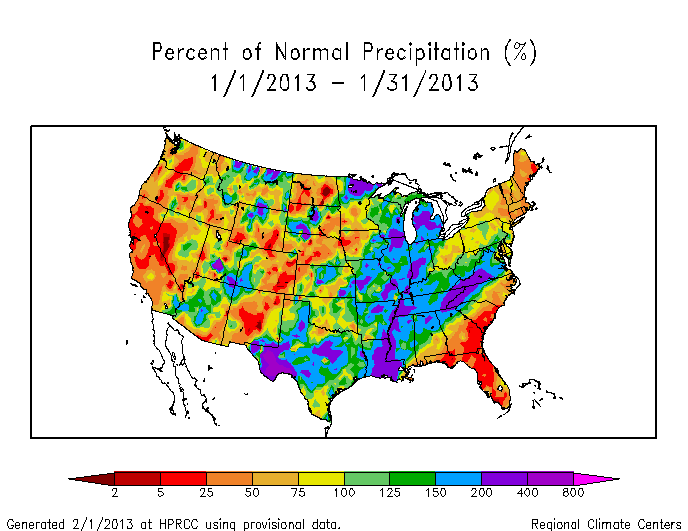
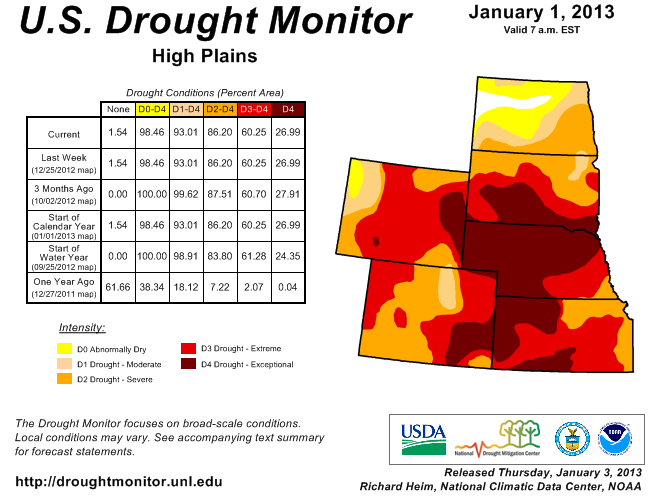
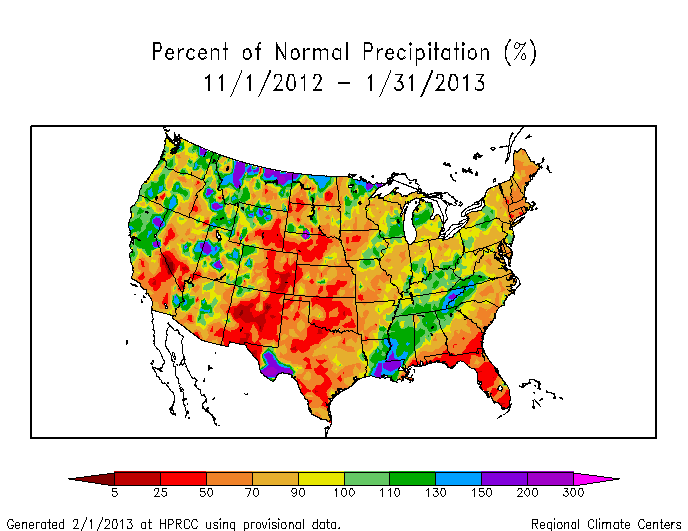
Monthly precipitation anomalies.
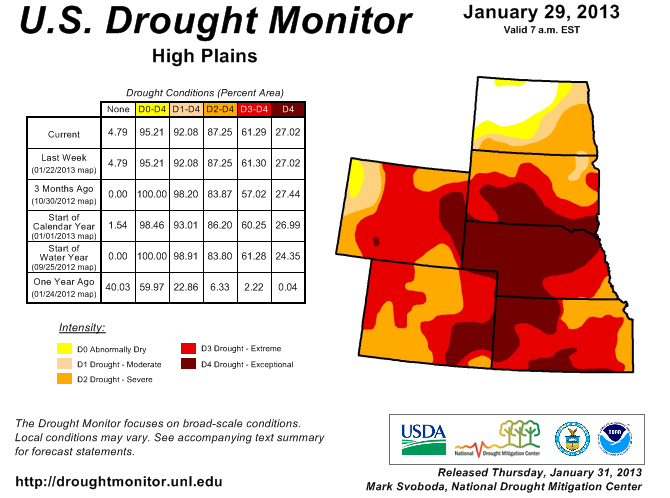
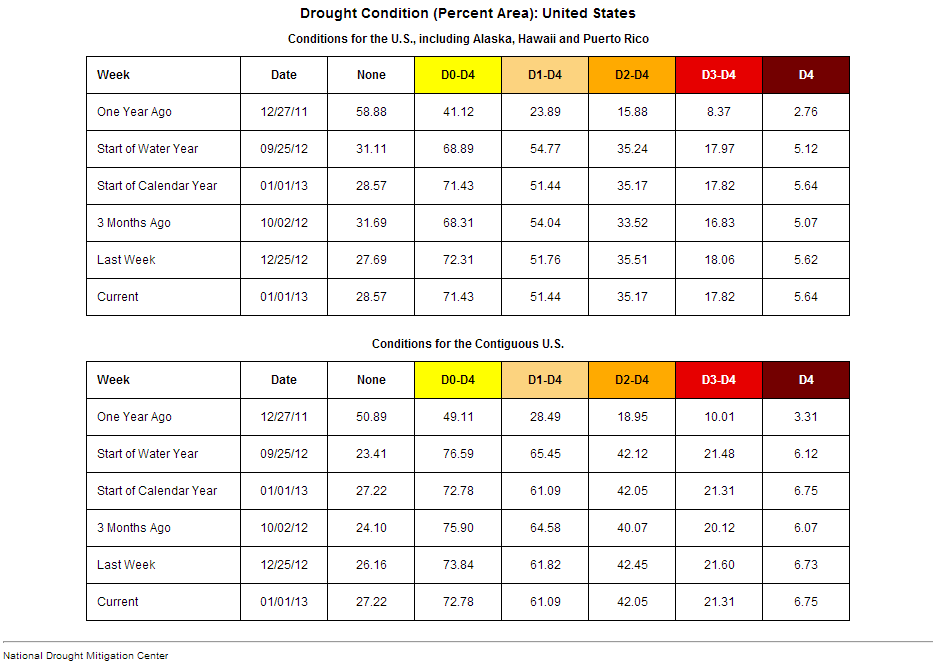
The movement of the weather systems can be seen in the weekly precipitation anomaly patterns (weeks 1, 2, 3, 4, 5). Beneficial rain and snow helped improve drought conditions over much of the country, with contraction of the drought area occurring in the Midwest, Southeast, South, West, and Hawaii. However, storm systems largely missed the High Plains, where the worst drought categories (D3-D4, extreme to exceptional drought) expanded from 60.3 percent of the region at the end of December to 61.3 percent by the end of this month. Five states (Michigan and Virginia to Louisiana) had the tenth wettest, or wetter, January in the 1895-2013 record, while three states (California, Florida, and Connecticut) ranked in the top ten driest category. Overall, the precipitation helped reduce the national moderate to exceptional drought footprint from 61.1 percent at the end of December to 57.7 percent at the end of January (based on U.S. Drought Monitor statistics). According to the Palmer Drought Index, which goes back to the beginning of the 20th century, 45.6 percent of the contiguous U.S. was in moderate to extreme drought at the end of January, a decrease of about 6 percent compared to last month.
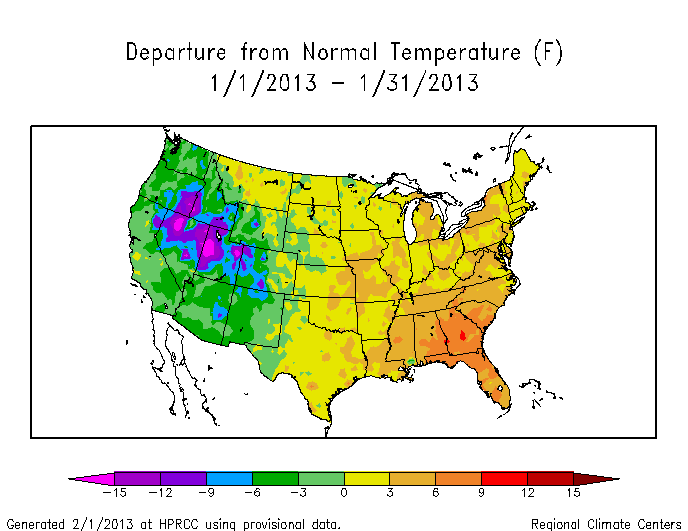
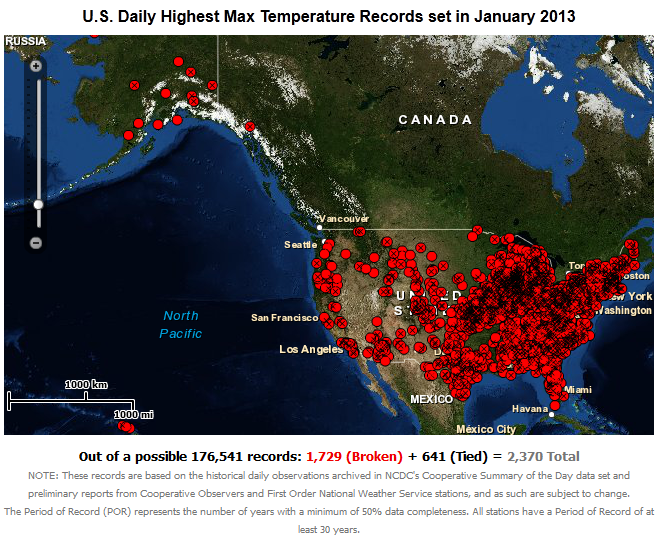
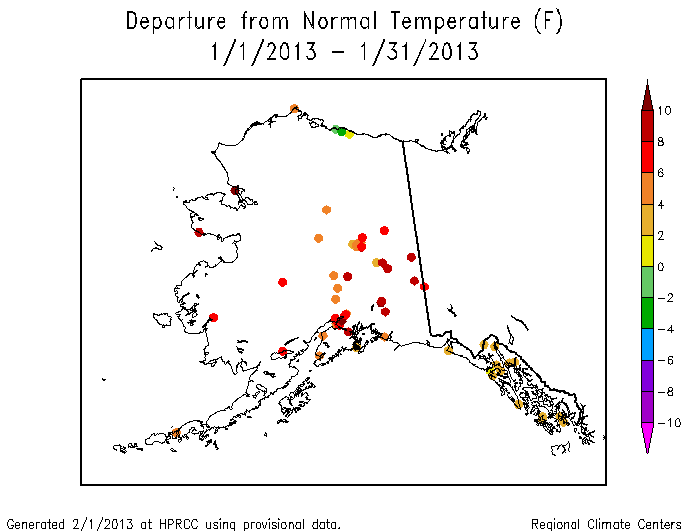
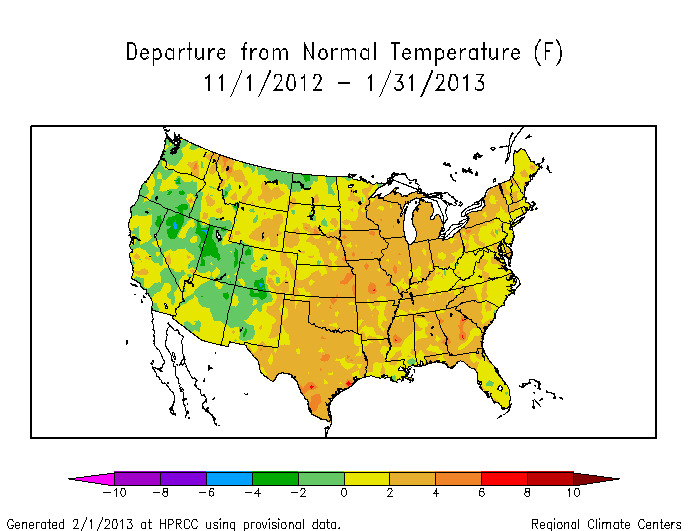
Monthly temperature anomalies.
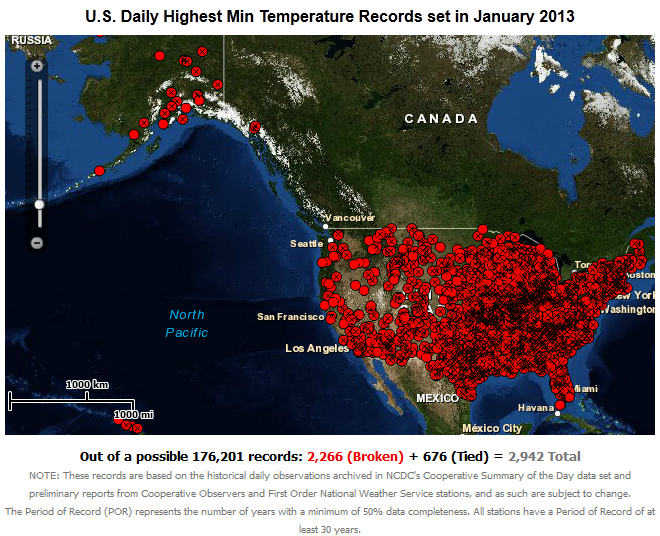
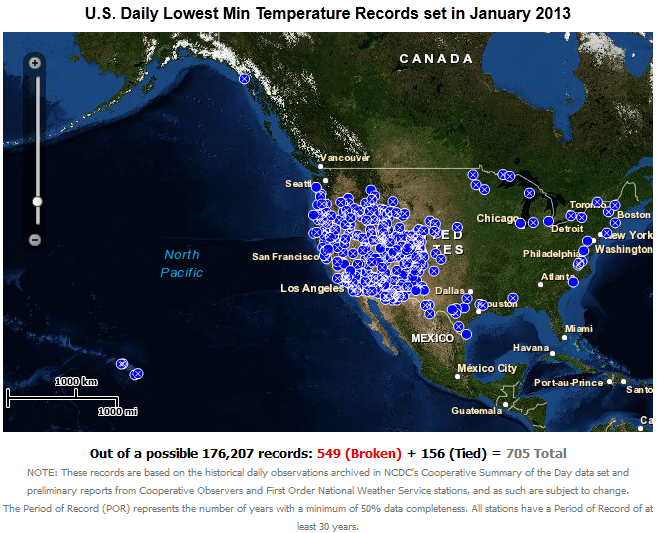
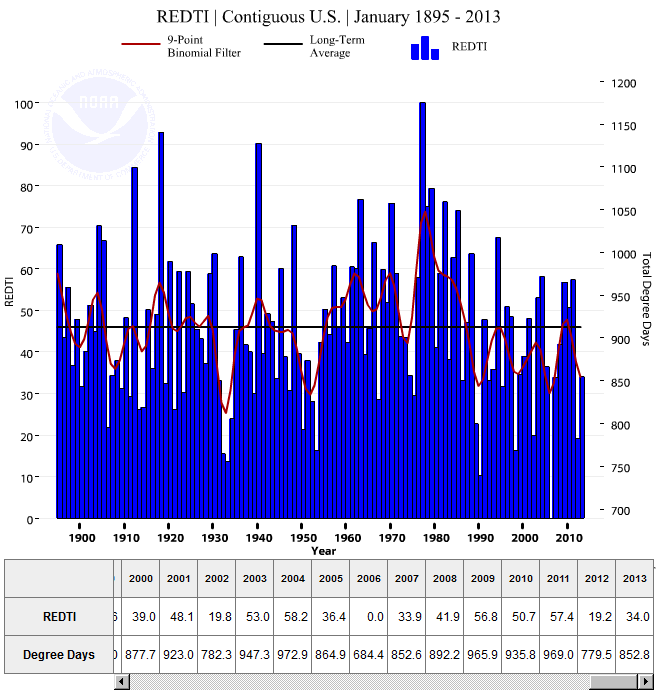
The weekly temperature anomaly maps (weeks 1, 2, 3, 4, 5) show the  migrating nature of the weather systems, with warm air ahead of the fronts and colder air behind them, as they cycled west to east. Averaged across the month, temperatures were below normal in the West and above normal in the East, with two states (Nevada and Utah) ranking in the top ten coldest category for January and two southeastern states (Florida and Georgia) ranking as eleventh warmest. On a local basis, two and a half times as many record warm highs and lows occurred than record cold highs and lows. Over 2350 daily high temperature records and 2900 record warm daily low temperatures were tied or broken. In comparison, about 700 record low temperatures and 1300 record cool daily high temperatures were tied or broken. (These numbers are preliminary and are expected to increase as more data arrive.) The warmth in the highly-populated eastern U.S. contributed to a national Residential Energy Demand Temperature Index (REDTI) for January 2013 that was below normal.
When averaged together, the mixture of temperature and precipitation extremes gave the U.S. the 39th warmest and 38th wettest January in the 119-year record. Averaging extremes tends to cancel them out. But when extremes are combined cumulatively, like in the U.S. Climate Extremes Index (USCEI), they may tell a different story. For January 2013, the nation had a large spatial extent of drought conditions (sixth largest PDSI component for January), but mediocre extent of heavy daily precipitation (33rd largest extremes in 1-day precipitation component), and extreme minimum (35th largest cold minimum component and 54th largest warm minimum component) and extreme maximum (43rd smallest warm maximum component and 47th largest cold maximum component) temperatures, compared to the 104-year history. This combined to give the U.S. a January USCEI that was only 62nd largest (43th smallest). But the mediocre performance of January was not enough to counter the preponderance of unusual warmth and dryness for much of 2012, with the national USCEI for the last twelve months (February 2012-January 2013) still ranking as the largest on record for February-January.
Subtropical highs, and cold fronts and low pressure systems moving in the storm track flow, are influenced by the broadscale atmospheric circulation. The following describes several such large-scale atmospheric circulation drivers and their potential influence this month:
-
El Niño Southern Oscillation (ENSO)
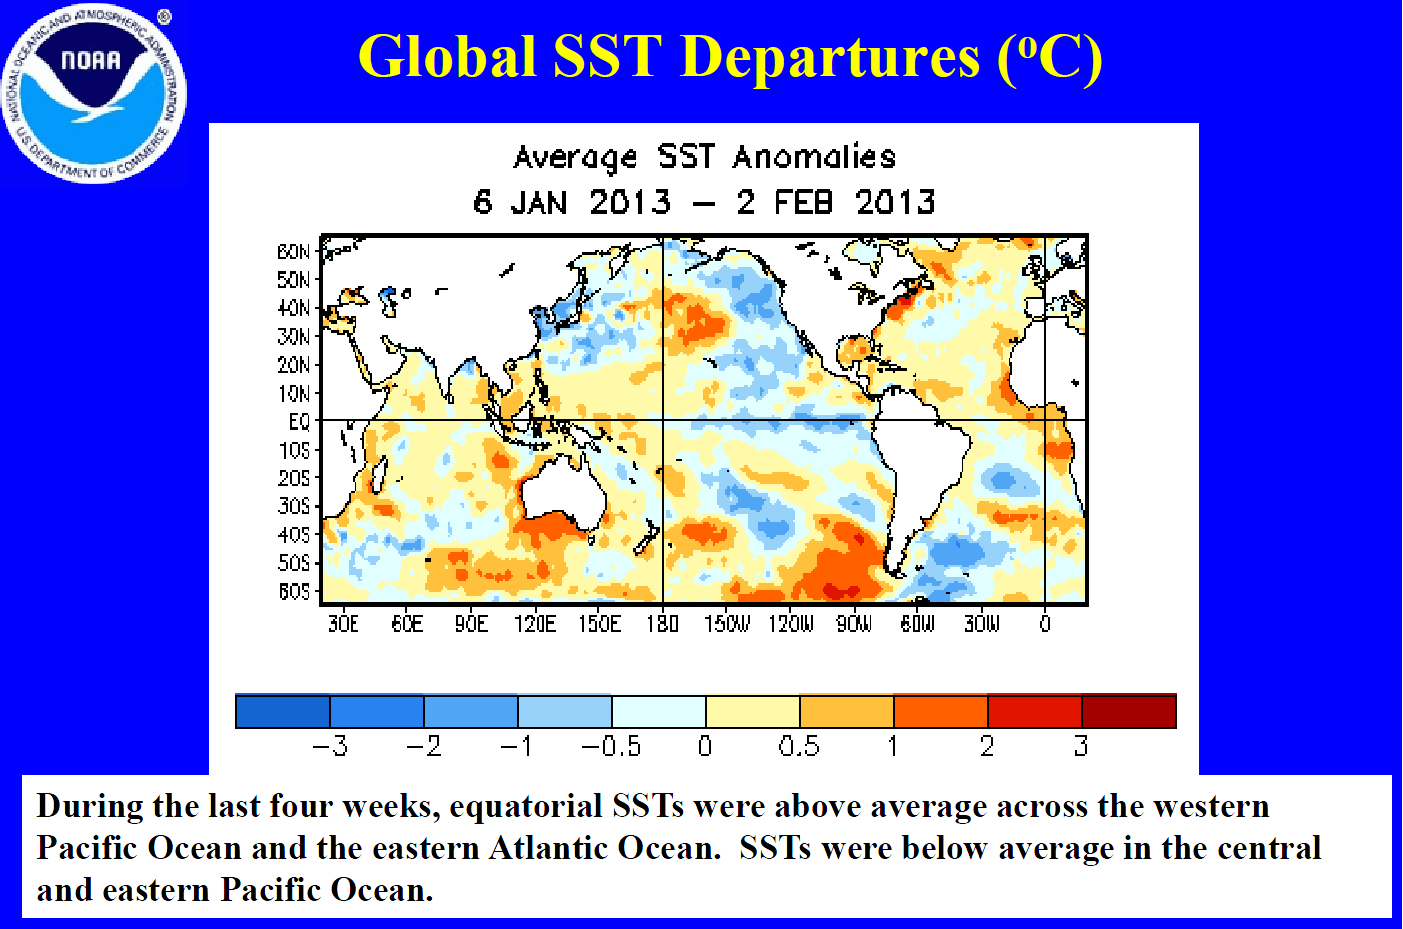
- Description: Oceanic and atmospheric conditions in the tropical Pacific Ocean can influence weather across the globe. ENSO is characterized by two extreme modes: El Niño (warmer-than-normal sea surface temperature [SST] anomalies in the tropical Pacific) and La Niña (cooler-than-normal SST anomalies), with the absence of either of these modes termed "ENSO-neutral" conditions.
- Status: Ocean temperatures and atmospheric circulation anomalies indicated that the equatorial Pacific continued in an ENSO-neutral state during January. Some atmospheric circulation features resembled La Niña, but this was at least partially due to an active Madden-Julian Oscillation.
- Teleconnections (influence on weather): To the extent teleconnections are known, while in a neutral state, ENSO normally is not a player in the month's weather. Historical data can be analyzed to show typical temperature and precipitation patterns associated with El Niño and La Niña ENSO episodes. Teleconnections are not available for ENSO-neutral conditions. For a La Niña, the typical November-January temperature anomaly pattern consists of warmer-than-normal conditions in the Southern Plains and cooler-than-normal temperatures in the Northern Plains. The precipitation anomaly pattern is drier than normal across much of the country from the Southwest to Ohio Valley, Southern Plains to Southeast, and Mid-Atlantic region, with above-normal precipitation mostly in the Pacific Northwest and Northern California.
- Observed: The November 2012-January 2013 precipitation pattern matched the La Niña teleconnections for much of the Southwest to Southeast, Ohio Valley, and coastal Pacific Northwest, but there were significant differences in the Lower Mississippi and Tennessee Valleys and Northeast. The November 2012-January 2013 temperature pattern shows some resemblance to that associated with La Niña in the Southern Plains, but little elsewhere.
-
Madden-Julian Oscillation (MJO)
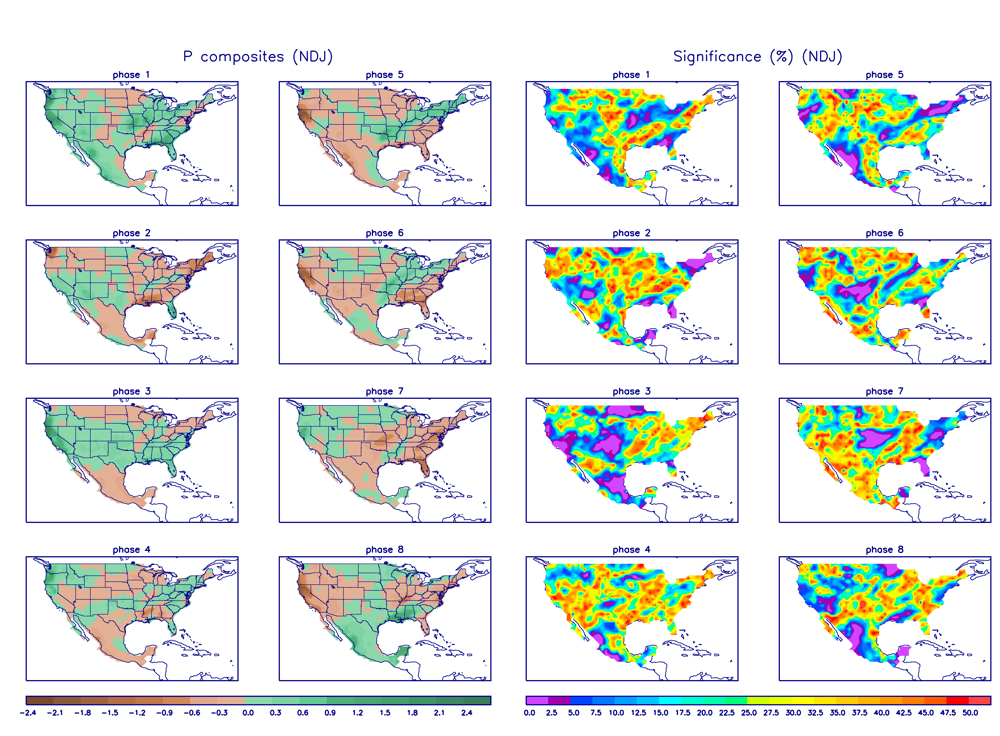
- Description: The MJO is a tropical disturbance or "wave" that propagates eastward around the global tropics with a cycle on the order of 30-60 days. It is characterized by regions of enhanced and suppressed tropical rainfall, and one of its indices is a time-longitude graph showing the areas affected by these regions and their propagation. The MJO is categorized into eight "phases" depending on the pattern of the location and intensity of the regions of enhanced and suppressed tropical rainfall. Overall, the MJO tends to be most active during ENSO-neutral years, and is often absent during moderate-to-strong El Niño and La Niña episodes.
- Status:The MJO was very active during January, with positive and negative anomalies propagating west to east as the month progressed (5-day index, 15-day index).
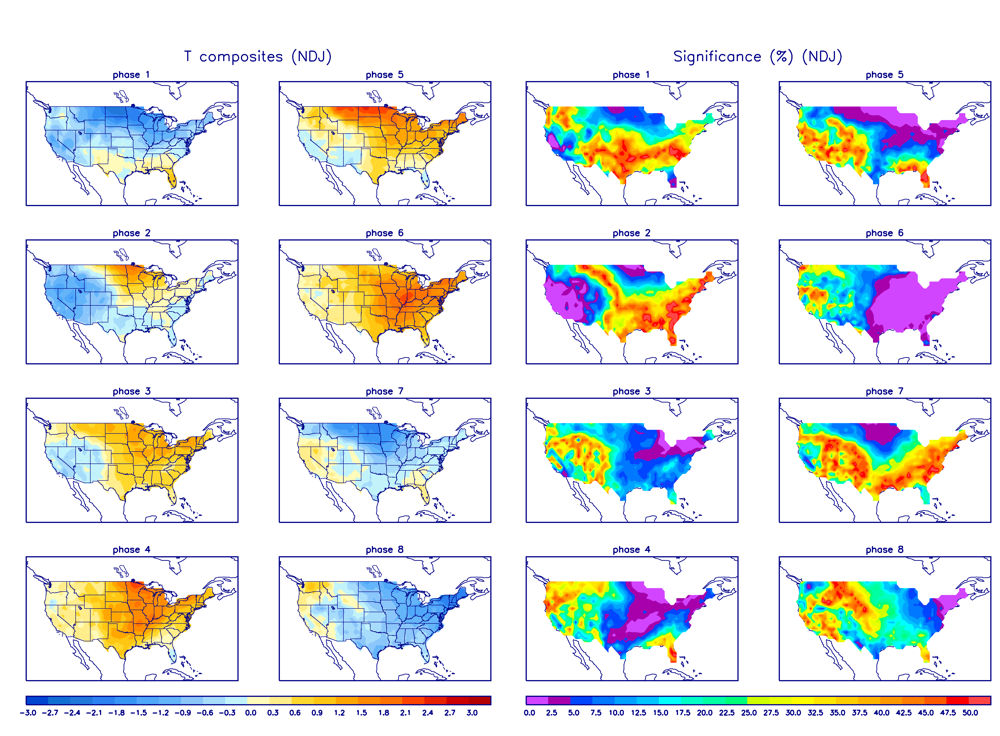
- Teleconnections (influence on weather): The MJO's temperature and precipitation teleconnections to U.S. weather depend on time of year and MJO phase. To the extent teleconnections are known, the November-January teleconnections for precipitation are shown here and for temperature are shown here.
- Observed: The MJO is transitory and can change phases (modes) within a month, so it is more closely related to weekly weather patterns than monthly. The January 2013 monthly precipitation pattern shows some correlation to the precipitation teleconnection for a phase 8 to phase 1 MJO. The 5-day temperature patterns for January 1-5, 11-15, and 21-25 are somewhat consistent with a phase 8 to phase 2 MJO, but the relationship is hard to see in the monthly temperature anomalies.
- The Pacific/North American (PNA) pattern
- Description: The PNA teleconnection pattern is associated with strong fluctuations in the strength and location of the East Asian jet stream. PNA-related blocking of the jet stream flow in the Pacific can affect weather downstream over North America, especially the West and especially in the winter half of the year.
- Status: The PNA index oscillated between positive and near neutral values during the month.
- Teleconnections (influence on weather): To the extent teleconnections are known, the temperature teleconnection map for this time of year (January on the maps) shows that a positive PNA is correlated with cooler-than-normal temperatures in the Southeast and warmer-than-normal temperatures along the west coast of North America, especially in western Canada and Alaska. The precipitation teleconnections are generally drier-than-normal weather, especially in the Pacific Northwest, Great Basin, and eastern third of the country. The upper-level circulation anomalies associated with a positive PNA are above-normal heights over western North America and below-normal heights over southeastern North America.
- Observed: Alaska's warmer-than-normal January is consistent with a positive PNA, but the January 2013 and November 2012-January 2013 temperature anomaly patterns for the contiguous U.S. were essentially opposite to what is expected with a positive PNA. The January 2013 and November 2012-January 2013 precipitation patterns were generally inconsistent with a positive PNA, although the Northwest was drier than normal during January. The January 2013 upper-level circulation pattern had strong positive anomalies over western North America/northeast Pacific, as well as over the eastern U.S., which is not consistent with a positive PNA.
- The Arctic Oscillation (AO) pattern
- Description: The AO teleconnection pattern relates upper-level circulation over the Arctic to circulation features over the Northern Hemisphere mid-latitudes and is most active during the cold season.
- Status: The AO index began the month neutral, turned negative for the middle half of the month, and ended the month slightly positive.
- Teleconnections (influence on weather): To the extent teleconnections are known, a negative AO this time of year (November-January) is typically associated with cooler-than-normal temperatures from the Northern High Plains to the East Coast and Florida, dry conditions from the Southern Plains to Tennessee Valley, and patchy wetter-than-normal conditions in Northern California and New England. A neutral AO is related to drier-than-normal conditions from the Central and Southern Plains to the Southeast. The November-January averaged upper-level circulation anomalies for a negative AO are below-normal 500-millibar (mb) geopotential heights (which translates to stronger trough or weaker ridge, depending on the circulation) over the eastern half of the U.S. and over the North Pacific Ocean, and above-normal 500-mb heights (which translates to stronger ridge or weaker trough, depending on the circulation) over the Arctic.
- Observed: The January and November-January temperature patterns are opposite to what is expected with a negative AO, although the 5-day temperature anomaly pattern for January 21-25 (the period of most negative AO) is a reasonable match. There is some agreement with a negative or neutral AO in the November-January precipitation pattern, but not in the January pattern. The November 2012-January 2013 upper-level circulation had above-normal heights over eastern North America, across the Arctic Ocean and Bering Strait, and into the North Pacific, with a small area of below-normal geopotential heights over northwestern Canada. This has some resemblance to a negative AO over the eastern U.S. and North Pacific, but not over the polar region. There are similar disagreements between the AO upper-level teleconnections and January 2013 upper-level circulation pattern. The strong positive anomalies in January 2013 upper-level circulation over the eastern U.S. and northeast Pacific are consistent with a negative AO, but the negative height anomalies at higher latitudes and over the North Atlantic are not.
- The North Atlantic Oscillation (NAO) pattern
- Description: The NAO teleconnection pattern relates upper-level circulation over the North Atlantic Ocean to circulation features over the Northern Hemisphere mid-latitudes.
- Status: The NAO index fluctuated above and below neutral during the month, but was slightly positive more than it was negative.
- Teleconnections (influence on weather): To the extent teleconnections are known, a positive NAO during this time of year (January on the teleconnection maps) is typically associated with drier-than-normal conditions in Northern California and the Great Basin and warmer-than-normal temperatures for much of the country east of the Rockies. The upper-level circulation anomalies for a positive NAO are above-normal 500-mb geopotential heights over the eastern two-thirds of the contiguous United States.
- Observed: The January and November-January temperature anomaly patterns match that expected with a positive NAO where teleconnections exist. The precipitation anomalies match for January but not November-January. The January 2013 upper-level circulation pattern over eastern North America and Greenland is consistent with a positive NAO.
- The East Pacific-North Pacific (EP-NP) pattern
- Description: The EP-NP teleconnection pattern relates SST and upper-level circulation patterns over the eastern and northern Pacific to temperature, precipitation, and circulation anomalies downstream over North America. Its influence during the winter is not as strong as during the other three seasons.
- Status: The SST pattern over the northeast Pacific averaged cooler than normal during January 2013. The EP-NP index (3-month running mean) has been positive for the last several months and remained slightly positive to neutral for January.
- Teleconnections (influence on weather): Teleconnection maps are not available for the winter (January), but they are for the bookend seasons autumn and spring. To the extent these teleconnections are known, a positive EP-NP index during these seasons is typically associated with cooler-than-normal temperatures east of the Rockies, warmer-than-normal temperatures along the West Coast and Alaska, below-normal upper-level circulation anomalies (stronger upper-level trough) over eastern North America, and above-normal upper-level circulation anomalies (stronger upper-level ridge) over western Canada and Alaska (the correlations are weak for precipitation). A negative EP-NP index is typically associated with the opposite patterns (especially warmer-than-normal temperatures east of the Rockies).
- Observed: The January temperature anomaly pattern is opposite that expected for a positive EP-NP, except for Alaska. The January upper-level circulation anomaly patterns are consistent with a positive EP-NP over Alaska and Canada, but not over the eastern United States.
- The Tropical/Northern Hemisphere (TNH) pattern
- Description: The TNH teleconnection pattern reflects large-scale changes in both the location and eastward extent of the Pacific jet stream, and also in the strength and position of the climatological mean Hudson Bay Low, and is dominant in the winter months. The pattern significantly modulates the flow of marine air into North America, as well as the southward transport of cold Canadian air into the north-central United States.
- Status: The TNH index was positive during January.
- Teleconnections (influence on weather): To the extent teleconnections are known, a positive TNH is typically associated with cooler-than-normal temperatures for much of the country, drier-than-normal conditions in the West, and slightly wetter-than-normal conditions in the Tennessee Valley. The upper-level circulation anomalies for a positive TNH are below-normal 500-mb geopotential heights over the eastern two-thirds of Canada and the north central U.S., and above-normal heights over the northeastern Pacific and Gulf of Mexico into the western North Atlantic.
- Observed: The January precipitation anomaly pattern matches that expected with a positive TNH where teleconnections exist. The January temperature anomaly pattern matches in the West but not east of the Rockies. The January upper-level circulation pattern over North America matches the teleconnections for a positive TNH quite well, except it is shifted a little to the north.
 |
 |
Examination of these circulation indices and their teleconnection patterns, and comparison to observed January 2013 and November 2012-January 2013 temperature, precipitation, and circulation patterns, suggests that no single atmospheric driver dominated the weather during January, but the weather was influenced in part by several of the drivers. ENSO was neutral and, thus, not a player. The PNA, AO, and NAO oscillated near or around neutral, and the EP-NP was near neutral, thus making their signals weak. Nevertheless, there is some agreement between the January upper-level circulation anomalies and the teleconnections for the AO and NAO, but the TNH circulation teleconnections were the closest match. Precipitation relationships are more susceptible to variability than temperature or circulation, but there is some match with the PNA and TNH. The temperature anomaly pattern matched the NAO in the east and TNH in the west. To summarize: it seems the TNH dominated the overall circulation for the month, but it may have shared influence with NAO for temperature and with PNA for precipitation, and possibly with the MJO for both. This month illustrates how competing atmospheric drivers can result in a complex weather pattern and how, when the atmospheric circulation drivers are neutral or in a state of transition, their influence can become difficult to trace and can be overwhelmed by other competing forces, including random fluctuations in the atmosphere.