Note: This Synoptic Discussion describes recent weather events and climate anomalies in relation to the phenomena that cause the weather. These phenomena include the jet stream, fronts and low pressure systems that bring precipitation, high pressure systems that bring dry weather, and the mechanisms which control these features — such as El Niño, La Niña, and other oceanic and atmospheric drivers (PNA, NAO, AO, and others). The report may contain more technical language than other components of the State of the Climate series.
Synoptic Discussion
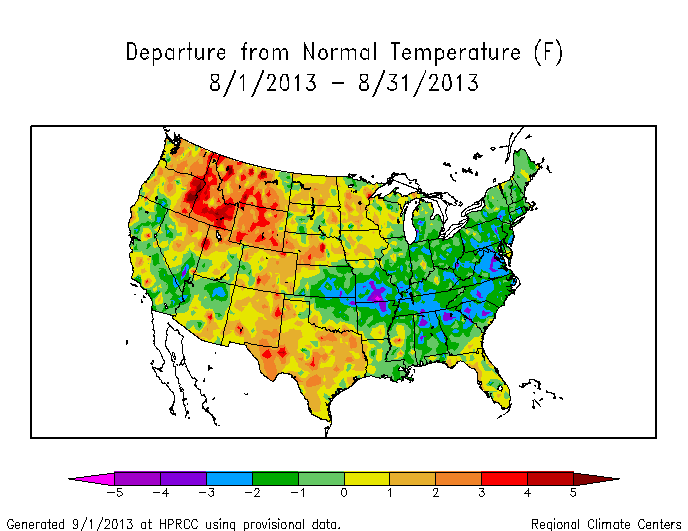
Monthly upper-level circulation pattern and anomalies.
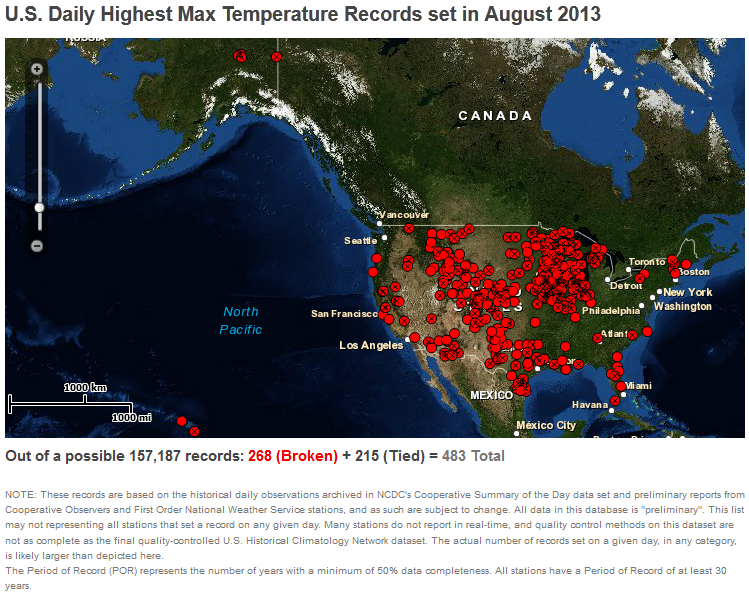
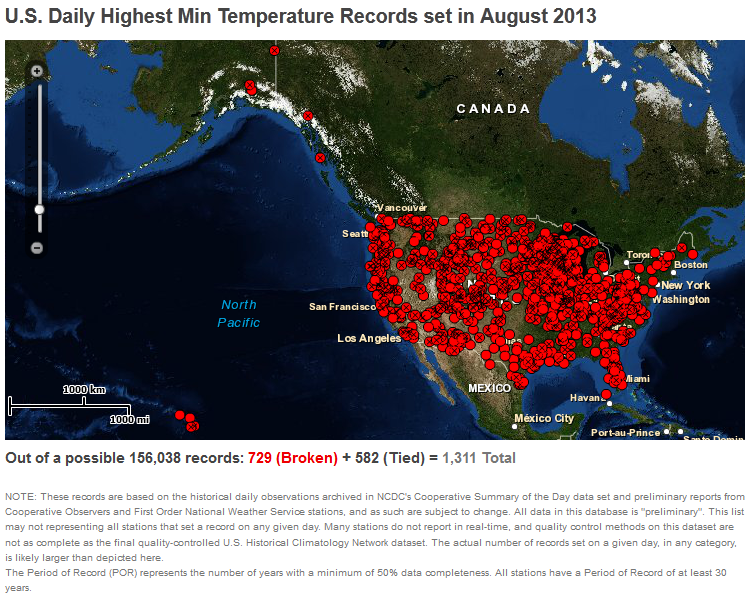
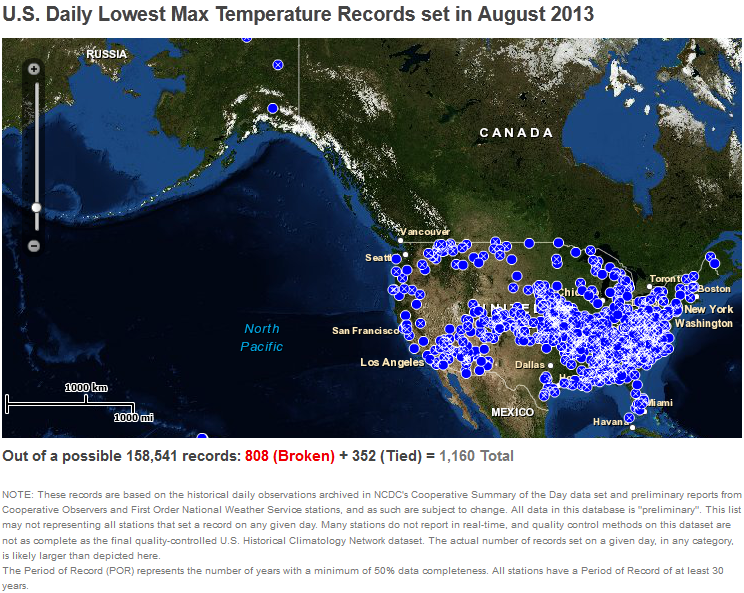
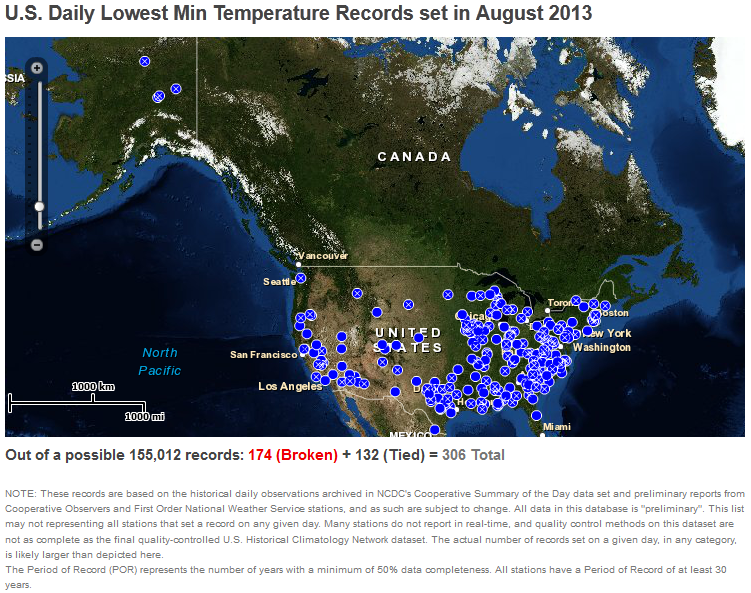
August: Normally, the subtropical high pressure belt (called the Bermuda High or Azores High) dominates the weather over the U.S. this time of year, and the polar jet stream normally retreats well into Canada during the summer. This month was a departure from this normal pattern. The weather pattern during August 2013 underwent a change part way through the month, flipping from a persistent abnormally strong upper-level trough over the central and eastern United States during the first 22 days of the month to a strong upper-level high pressure ridge over much of the country during the last week. The persistent jet stream trough funneled cool polar air masses into the country east of the Rockies, resulting in a large area of below-normal temperatures for the first three weeks of the month (weeks 1, 2, 3). Unusually hotter-than-normal temperatures accompanied the ridge the following week (weeks 4, 5), effectively neutralizing the earlier cold in the north central regions when temperatures are averaged for the entire month. There were slightly more record warm daily highs and lows (about 1800) than record cold daily highs and lows (about 1450), especially in the Upper Midwest. A ridge persisted across the West for much of the month, with warmer-than-normal temperatures occurring during most weeks (weeks 1, 2, 3, 4, 5), especially in the northern regions. The monthly temperature anomaly pattern across the country consisted of warmer-than-normal temperatures in the Northwest, across the Rockies, and into the Southern Plains, with Idaho and Wyoming ranking in the top ten warmest category. Cooler-than-normal temperatures dominated from parts of the Central Plains, spreading across the Midwest to the East Coast. When averaged across the month and across the nation, August 2013 ranked as the 28th warmest August in the 1895-2013 record.
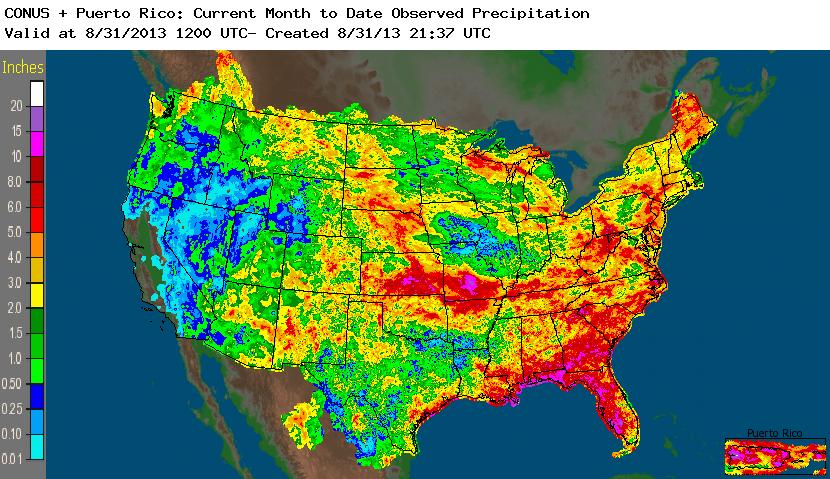
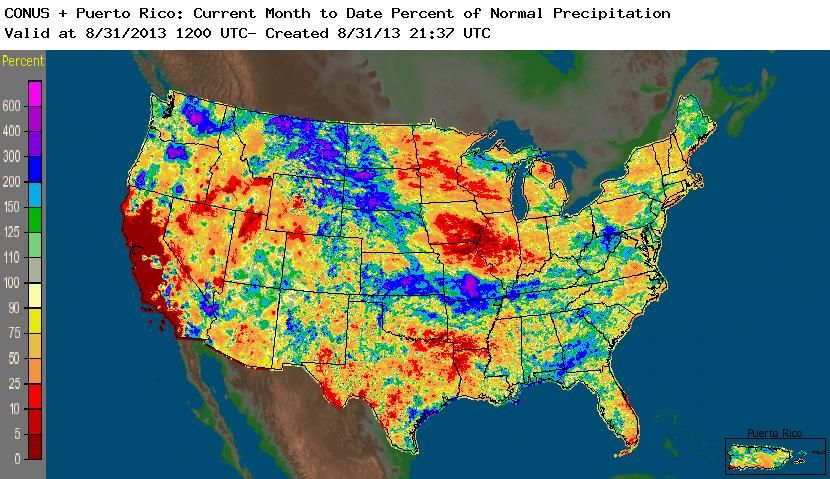
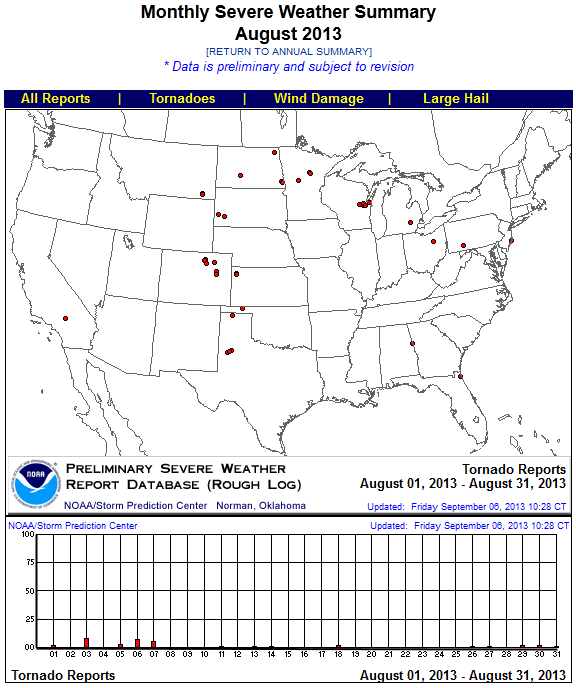
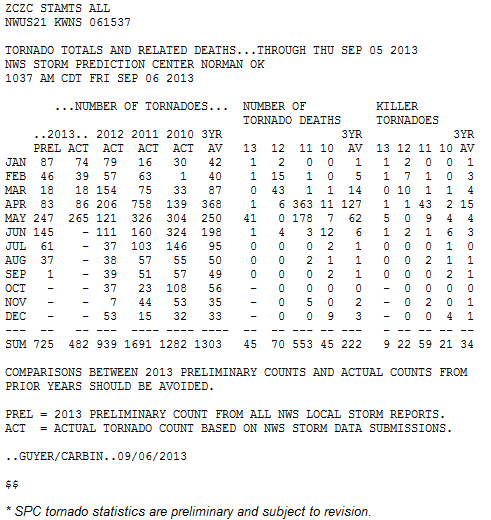
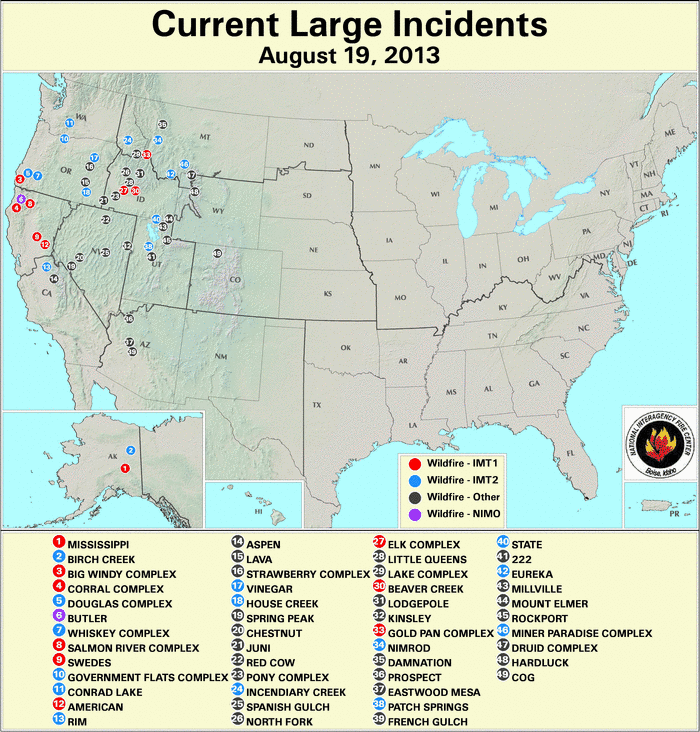
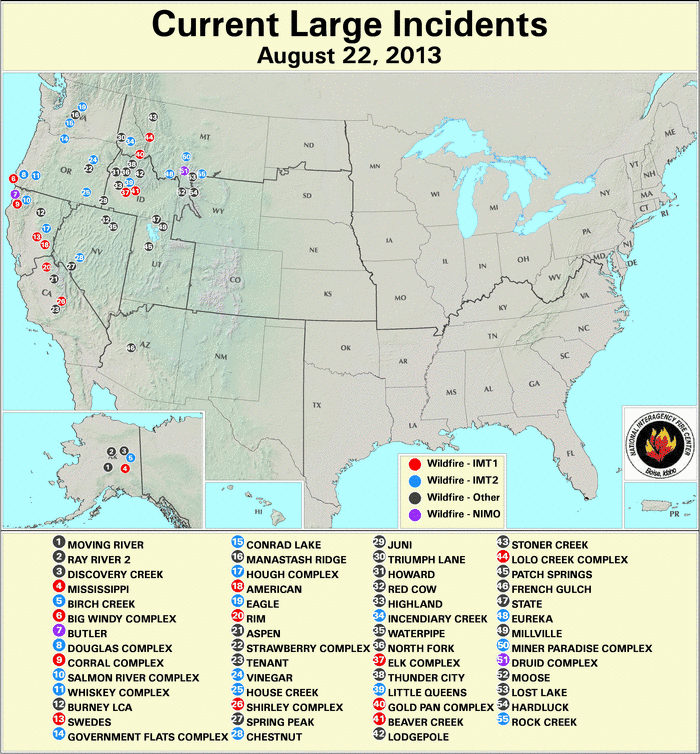
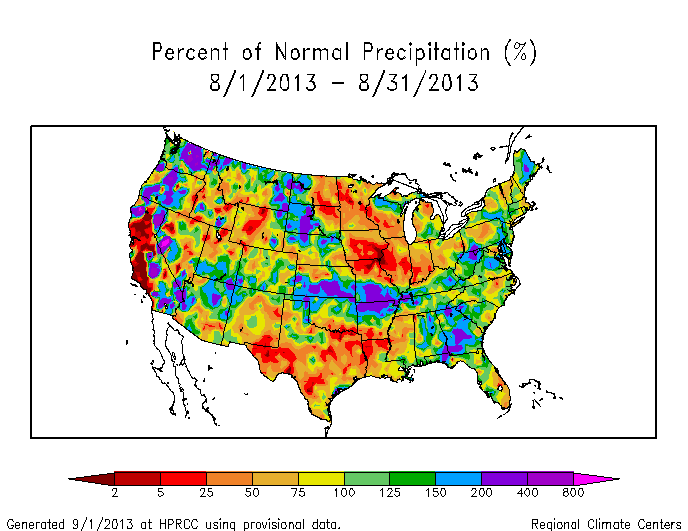
Cool fronts, steered by the upper-level trough over the north central U.S., moved south and east, frequently stalling along the east slopes of the Rockies to Central Plains and Southeast. Gulf of Mexico moisture to the south of the frontal boundary fed frequent mesoscale convective systems that dumped copious amounts of rain along the front (weeks 1, 2, 3), giving Kansas and Georgia precipitation ranks of top ten wettest for August. Precipitation was above normal along the average position of the frontal boundary; precipitation was below normal in the dry polar air mass to the north of the frontal boundary; and high pressure kept precipitation below normal south of the boundary over the Southern Plains to Lower Mississippi Valley, with the lack of tropical systems from a relatively quiet Atlantic hurricane season contributing to the southern dryness. With a dry northerly flow dominating across much of the country east of the Rockies inhibiting the formation of tornadoes, the preliminary August count of 37 tornadoes was below normal. Troughs and cut-off lows in the upper-level flow frequently brushed the West Coast, bringing above-normal precipitation to the Northwest and below-normal temperatures to California. Monsoon showers, some supplied by moisture from Pacific tropical systems such as Tropical Storm Ivo, brought above-normal precipitation to parts of the Southwest (weeks 4, 5). Otherwise, the West had a drier-than-normal August, with the hot and dry weather contributing to the development of several dozen large wildfires. Nationally, August 2013 ranked as the 53rd wettest August in the 1895-2013 record.
The extremes in temperature and precipitation gave certain regions unusually high ranks of the Climate Extremes Index (CEI), which is an index that combines extreme weather indices to show their cumulative impact. The second highest rank for Palmer Index wetness, third highest for cool maximum temperatures, and eighth highest for number of days with precipitation gave the Southeast region its seventh largest August CEI in the 104-year record (the Southeast had the third largest July CEI just last month). The Northwest region and West North Central region had the second biggest and fifth biggest rank, respectively, for the warm minimum temperature component. The West region and Southwest region had the second biggest and ninth biggest rank, respectively, for the Palmer drought component. The Central region and East North Central region had the sixth biggest and eighth biggest rank, respectively, for the days without precipitation component.
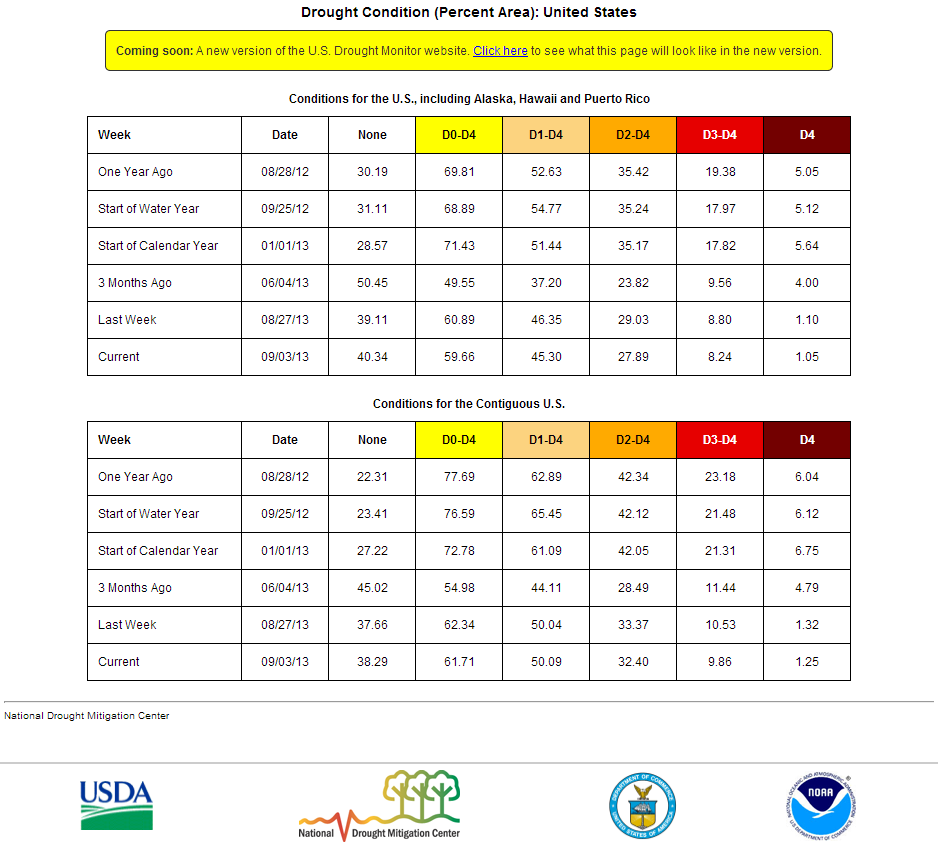
Beneficial rain over the drought areas, brought by the active jet stream, helped reduce the intensity of drought in most areas, especially the Great Plains, with the percentage of the U.S. in extreme to exceptional drought decreasing from 9.9 percent last month to 8.2 percent at the end of August, according to U.S. Drought Monitor statistics. However, dry conditions in Hawaii and the Southern Plains, and especially prolonged summer dryness in the Midwest — where Illinois, Indiana, Iowa, and Minnesota had a top ten driest August — caused the overall area in drought to expand, from 41.5 percent of the U.S. in moderate to exceptional drought at the end of July to 45.3 percent at the end of this month.
 |
 |
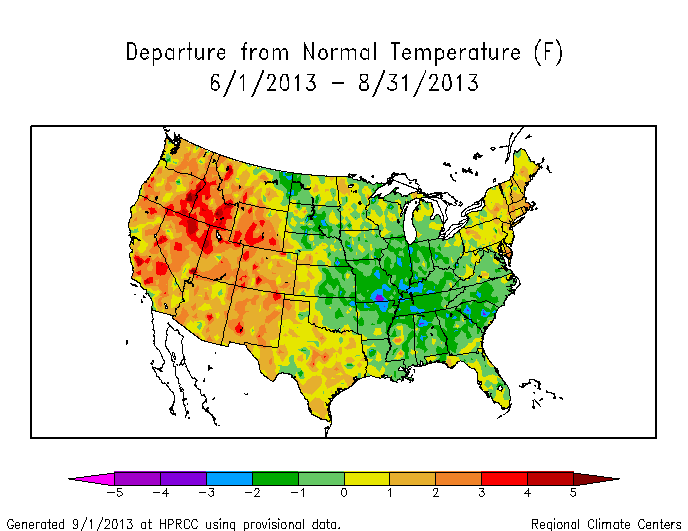
Summer: The jet stream was very active throughout summer 2013, sending troughs and ridges rippling across the contiguous U.S., some with high amplitude which sent synoptic weather systems (fronts, low pressure systems) far into the Deep South. The subtropical high pressure system pushed the jet stream back, attempting to regain its normal seasonal dominance. This resulted in swings of temperature and precipitation to both extremes across much of the country. On balance, however, the seasonal temperature pattern reflected the dominance of troughs in the eastern U.S. and ridges in the West — most of the states from the Rockies westward had June-August 2013 temperatures in the top ten warmest category for summer, while eleven states from the Ohio Valley to Southeast ranked in the bottom third of the historical record. Unusually warm summer temperatures were the rule in the Northeast, as well.
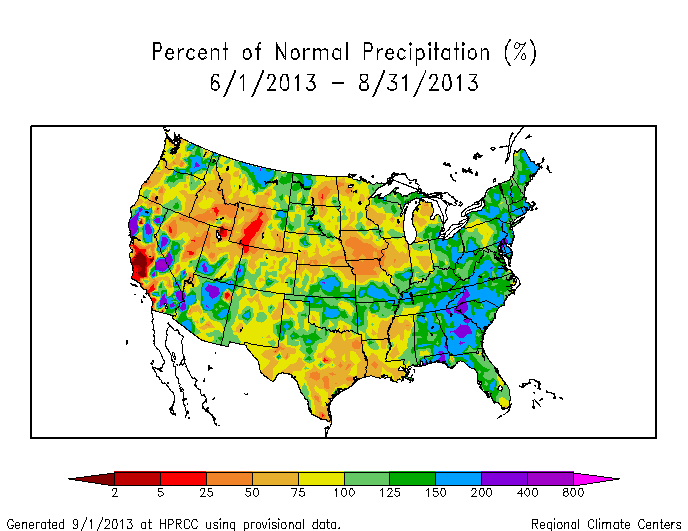
The complicated mix of fronts and low pressure systems resulted in a chaotic pattern of summer precipitation. The predominant flow associated with the upper-level trough brought moisture-laden air to the eastern U.S., where fronts and low pressure systems moving in the jet stream flow wrung it out in frequent heavy downpours. The result was a record wet June-August for Florida, Georgia, South Carolina, and New York, with 15 other eastern and Midwestern states ranking in the top ten wettest category. Cool and dry air masses from the north were funneled into the central part of the country by the upper-level trough, but ripples in the jet stream flow drew in enough Gulf of Mexico moisture to trigger periods of intense rainfall over parts of the Plains. As a result, Nebraska, Iowa, Minnesota, Illinois, and Louisiana ranked in the driest third of the 1895-2013 historical record, while Oklahoma, Kansas, and South Dakota fell in the wettest third category. Monsoon rainfall benefited the Southwest, where Arizona had the ninth wettest June-August and New Mexico had a seasonal reprieve from its long-term drought, but the monsoon moisture did not reach further north where dry conditions prevailed beneath the ridge, with Idaho and Wyoming ranking in the driest third of the historical record.
When these extremes are aggregated together, as in the Climate Extremes Index, several regions rank high for the CEI and for some of its components. A detailed discussion of the regional components of the CEI is available here.
 |
 |
Subtropical highs, and cold fronts and low pressure systems moving in the storm track flow, are influenced by the broadscale atmospheric circulation. The following describes several such large-scale atmospheric circulation drivers and their potential influence this month:
-
El Niño Southern Oscillation (ENSO)
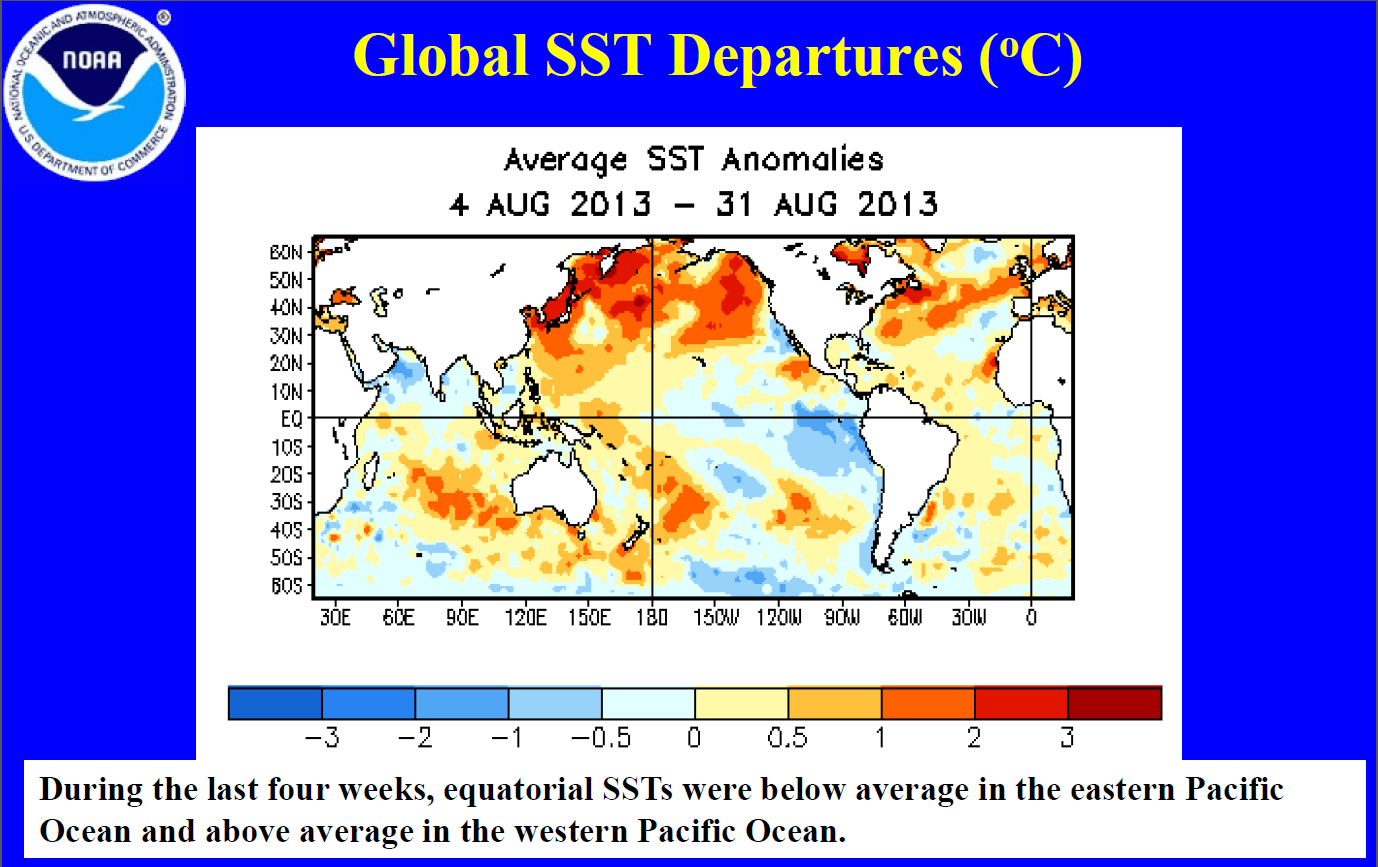
- Description: Oceanic and atmospheric conditions in the tropical Pacific Ocean can influence weather across the globe. ENSO is characterized by two extreme modes: El Niño (warmer-than-normal sea surface temperature [SST] anomalies in the tropical Pacific) and La Niña (cooler-than-normal SST anomalies), with the absence of either of these modes termed "ENSO-neutral" conditions.
- Status: Ocean temperatures and atmospheric circulation anomalies indicated that the equatorial Pacific continued in an ENSO-neutral state during August, but SSTs were cooler-than-average over the eastern equatorial Pacific.
- Teleconnections (influence on weather): To the extent teleconnections are known, while in a neutral state, ENSO normally is not a player in the month's weather. Historical data can be analyzed to show typical temperature and precipitation patterns associated with El Niño and La Niña ENSO episodes. Teleconnections are not available for ENSO-neutral conditions.
-
Madden-Julian Oscillation (MJO)
- Description: The MJO is a tropical disturbance or "wave" that propagates eastward around the global tropics with a cycle on the order of 30-60 days. It is characterized by regions of enhanced and suppressed tropical rainfall. One of its indices is a phase diagram which illustrates the phase (1-8) and amplitude of the MJO on a daily basis. The MJO is categorized into eight "phases" depending on the pattern of the location and intensity of the regions of enhanced and suppressed tropical rainfall. The MJO can enter periods of little or no activity, when it becomes neutral or incoherent and has little influence on the weather. Overall, the MJO tends to be most active during ENSO-neutral years, and is often absent during moderate-to-strong El Niño and La Niña episodes.
- Status:The MJO began the month in an incoherent phase, then transitioned weakly into phase 8 during the last half of the month, ending the month in phase 1. When the MJO was incoherent, other modes of convective variability in the tropics, such as Kelvin and Rossby waves, exerted some influence (as indicated by the MJO discussions for August 5, 12, 19, 26). Tropical precipitation patterns associated with the MJO became apparent near the end of the month when the MJO strengthened.
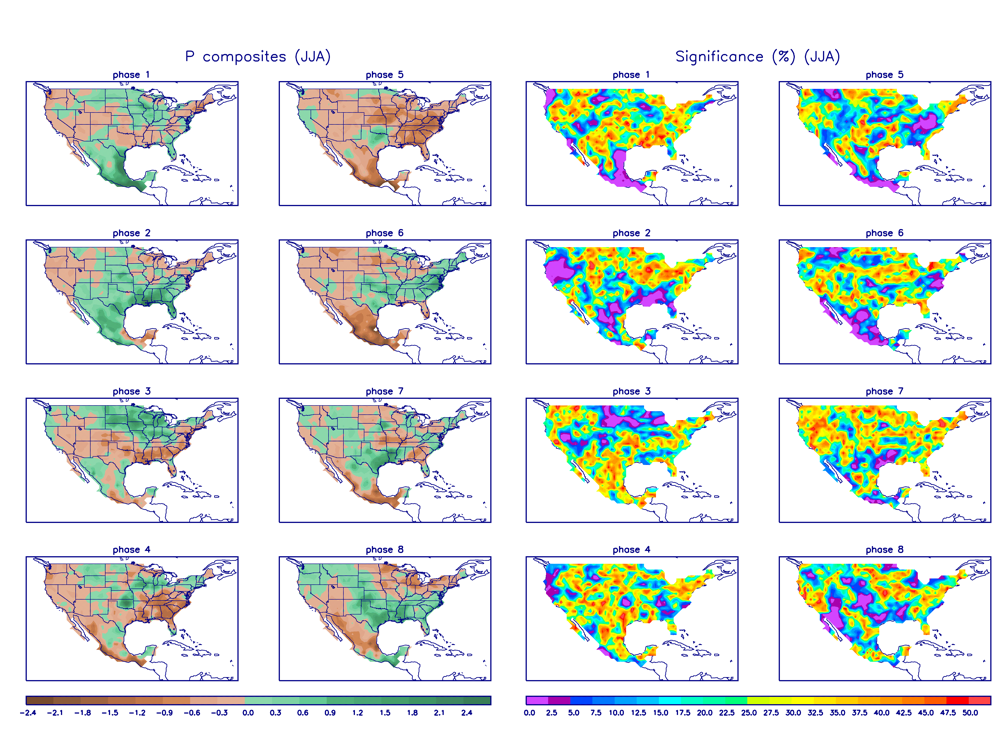
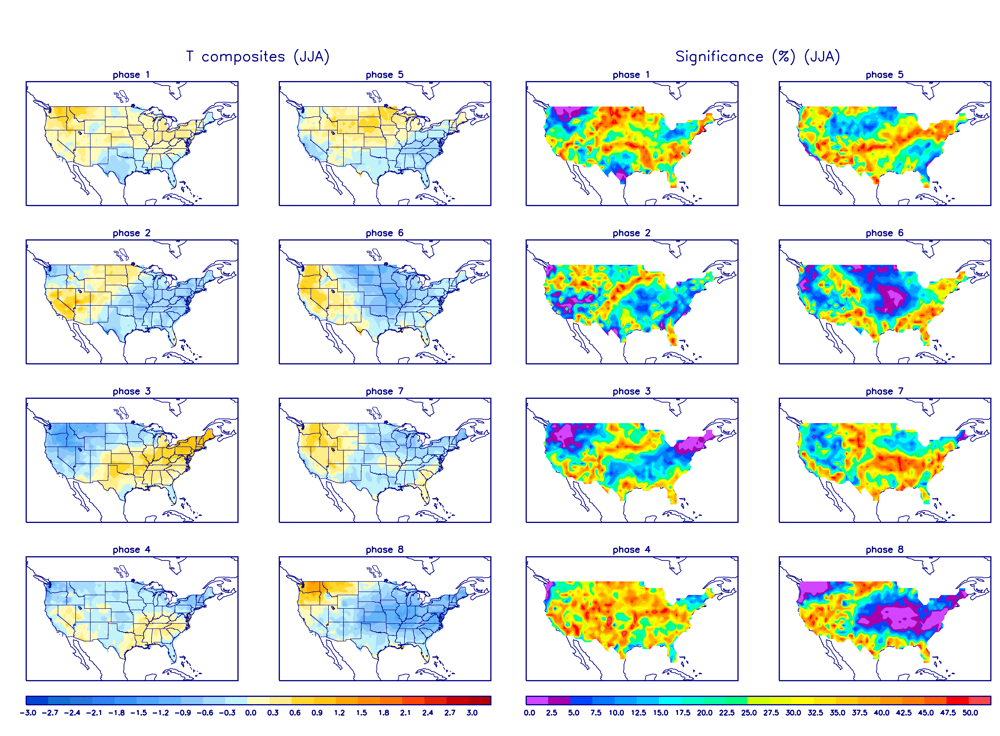
- Teleconnections (influence on weather): The MJO's temperature and precipitation teleconnections to U.S. weather depend on time of year and MJO phase. To the extent teleconnections are known, the June-August teleconnections for precipitation are shown here and for temperature are shown here.
- Observed: The MJO is transitory and can change phases (modes) within a month, so it is more closely related to weekly weather patterns than monthly. The August 2013 monthly precipitation pattern shows little correlation to the precipitation teleconnection pattern for MJO phases 8 and 1 this time of year, nor do the weekly precipitation anomaly patterns at the end of the month (weeks 4 and 5). The August 2013 monthly temperature pattern shows some similarity to the teleconnections for MJO phase 8 (cooler than normal in the Central Plains to East Coast, warmer than normal in the Northwest), and the transition to warmer-than-normal temperatures in the north at the end of the month (weeks 4 and 5) corresponds to a transition to MJO phase 1.
- The Pacific/North American (PNA) pattern
- Description: The PNA teleconnection pattern is associated with strong fluctuations in the strength and location of the East Asian jet stream. PNA-related blocking of the jet stream flow in the Pacific can affect weather downstream over North America, especially the West and especially in the winter half of the year.
- Status: The daily PNA index was neutral to slightly negative for most of the month, turning slightly positive at the end of of August, averaging near zero (neutral) for the month as a whole.
- Teleconnections (influence on weather): To the extent teleconnections are known, the temperature teleconnection map for this time of year (July on the maps) shows little correlation with the PNA. The precipitation and upper-level circulation anomaly teleconnections are likewise weak.
- Observed: Observed temperature and precipitation anomaly patterns have little relationship to a neutral PNA, or to any phase PNA this time of year.
- The Arctic Oscillation (AO) pattern
- Description: The AO teleconnection pattern relates upper-level circulation over the Arctic to circulation features over the Northern Hemisphere mid-latitudes and is most active during the cold season.
- Status: The daily AO index oscillated around zero (neutral), averaging slightly positive for the month.
- Teleconnections (influence on weather): To the extent teleconnections are known, a positive AO this time of year (June-August) is typically associated with dryness from the Central and Southern Plains to the Northeast, wetness in the Southeast, above-normal temperatures in the north central U.S., and above-normal upper-level circulation anomalies from the Northern Plains to Northeast.
- Observed: The August 2013 monthly temperature anomaly pattern shows some agreement with a positive AO teleconnection in the Northern Rockies to Northern Plains, especially during the last two weeks when the daily AO went positive. The dryness at the monthly scale in the Southern Plains and Midwest, and above-normal precipitation in the Southeast, match the teleconnections with a positive AO, but there is an even better match of the weekly precipitation anomaly patterns to the daily AO index throughout the month. The August 2013 upper-level circulation anomaly pattern of above-normal heights over the Northern Rockies to Northern Plains, and a trough over the eastern U.S., does not match the teleconnection pattern for a positive AO.
- The North Atlantic Oscillation (NAO) pattern
- Description: The NAO teleconnection pattern relates upper-level circulation over the North Atlantic Ocean to circulation features over the Northern Hemisphere mid-latitudes.
- Status: The daily NAO index started the month slightly negative, then transitioned to positive for the last half of August, averaging positive for the month.
- Teleconnections (influence on weather): To the extent teleconnections are known, a positive NAO during this time of year (July on the teleconnection maps) is typically associated with warmer-than-normal temperatures over the northwestern third of the country, cooler-than normal conditions across the Southern Plains and Southeast, drier-than-normal conditions in the Northern Plains and Midwest, patchy wet conditions along parts of the Gulf Coast (although the correlations are weak for precipitation), and positive upper-level circulation anomalies in the northwestern quarter of the country centered over Montana, with negative anomalies over the eastern North Pacific and touching the Gulf of Mexico coast.
- Observed: The August and June-August 2013 temperature anomaly patterns match those expected for a positive NAO (except in the Southern Plains). The August precipitation anomaly pattern shows agreement in the Midwest, where it was dry. The August upper-level circulation anomaly pattern matches the NAO teleconnection pattern over the Northern Rockies to Northern Plains and over the eastern North Pacific.
- The East Pacific-North Pacific (EP-NP) pattern
- Description: The EP-NP teleconnection pattern relates SST and upper-level circulation patterns over the eastern and northern Pacific to temperature, precipitation, and circulation anomalies downstream over North America. Its influence during the winter is not as strong as during the other three seasons.
- Status: The SST pattern over the North Pacific during August 2013 was dominated by a large pool of warmer-than-normal SSTs, with cooler-than-normal SSTs immediately along the southern California coast. The EP-NP index has been positive for several months. But the monthly EP-NP index turned negative during August, pulling down the 3-month running mean to near zero.
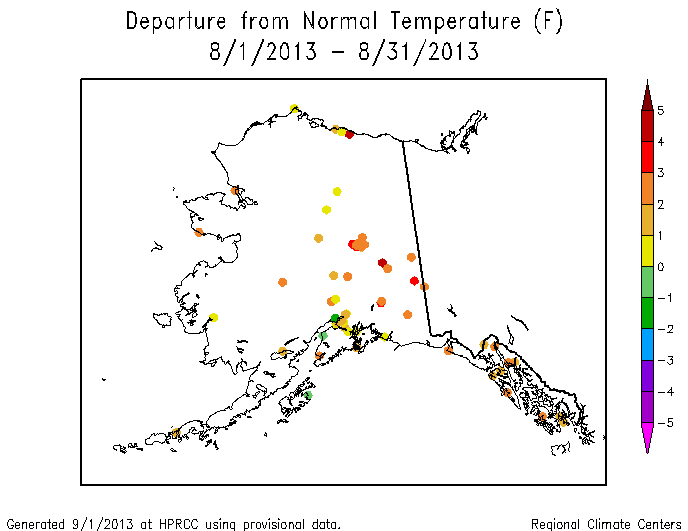
- Teleconnections (influence on weather): To the extent these teleconnections are known, a negative EP-NP index during this time of year (July on the maps) is typically associated with warmer-than-normal temperatures in the north central U.S. and much of Canada, cooler-than-normal temperatures in parts of Alaska, above-normal upper-level circulation anomalies (weaker upper-level trough) over eastern Canada into the north central U.S., and below-normal upper-level circulation anomalies (weaker upper-level ridge) over western North America, including Alaska (the correlations are weak for precipitation).
- Observed: The August monthly temperature anomalies for the contiguous U.S. are weakly consistent with a negative EP-NP, while those for Alaska agree more with a positive EP-NP. But the weekly temperature anomalies for the contiguous U.S. — cold in the northern states at the beginning of the month (weeks 1, 2, 3) and hot at the end of the month (weeks 4, 5) — are consistent with the transition from a positive to negative EP-NP. The August 2013 upper-level circulation anomaly pattern seems shifted westward from that expected with a negative EP-NP. The expected below-normal heights over western North America are over the adjacent North Pacific, and the expected above-normal heights over the central to northeastern parts of North America are over northwestern North America.
Examination of these circulation indices and their teleconnection patterns, and comparison to observed August 2013 and summer (June-August) 2013 temperature, precipitation, and circulation patterns, suggest that the MJO, AO, NAO, and EP-NP drivers each exerted some influence on August temperatures (the influence for temperature is stronger than for precipitation this time of year). ENSO was neutral, and thus not a player; the PNA was also neutral, and its influence is not as strong during the summer as it is in the winter. The positive NAO was a good match to the monthly northwest-to-southeast temperature pattern and to the upper-level circulation anomaly pattern. The transition of the EP-NP from positive to negative, coupled with influence from the MJO and AO, seem likely drivers for the switch from cooler-than-normal temperatures to hotter-than-normal temperatures east of the Rockies at the end of the month, while the NAO seemed to be the strongest driver for upper-level circulation. Precipitation is not as strongly correlated to the atmospheric drivers during the summer as it is during the winter, with random convective processes playing a greater role in precipitation during the summer. But in August, the weekly precipitation patterns might be traced to the influence of the AO driver. This month illustrates how competing atmospheric drivers may work in phase to create a complex weather pattern.