Note: This Synoptic Discussion describes recent weather events and climate anomalies in relation to the phenomena that cause the weather. These phenomena include the jet stream, fronts and low pressure systems that bring precipitation, high pressure systems that bring dry weather, and the mechanisms which control these features — such as El Niño, La Niña, and other oceanic and atmospheric drivers (PNA, NAO, AO, and others). The report may contain more technical language than other components of the State of the Climate series.
Summary
The December 2013 circulation pattern over North America consisted of a dominant upper-level ridge over the eastern North Pacific and western North America with a trough over eastern North America. This pattern is most closely associated with the positive phase of the Tropical/Northern Hemisphere mode of circulation, whose teleconnections include colder-than-normal temperatures across much of the contiguous United States (CONUS), drier-than-normal weather in the West, and wetter-than-normal weather in the Ohio to Tennessee valleys. The combination of cold and moist air masses produced frequent winter storm systems east of the Rockies, while precipitation and snow pack in the West lagged behind seasonal normals. See below for details.
Synoptic Discussion
Monthly upper-level circulation pattern and anomalies.
In the Northern Hemisphere, December marks the start of climatological winter which is the time of year when the jet stream and circumpolar vortex are most active and furthest south, spreading polar and arctic air masses from the north across the United States. The upper-level circulation consisted of a long-wave ridge over the eastern North Pacific and western coast of North America, and a long-wave trough over eastern North America, with many wiggles, or short-wave troughs and ridges, migrating through the flow. When integrated across the month, the circulation produced a pattern of above-normal 500-mb heights (stronger-than-normal long-wave ridge) over the Gulf of Alaska in the northeast Pacific and along the west coast of North America, with above-normal heights also over the North Atlantic spreading into the southeast CONUS. Below-normal 500-mb heights (stronger-than-normal long-wave trough) dominated eastern and central Canada and into the Great Lakes and Northern Plains of the CONUS.
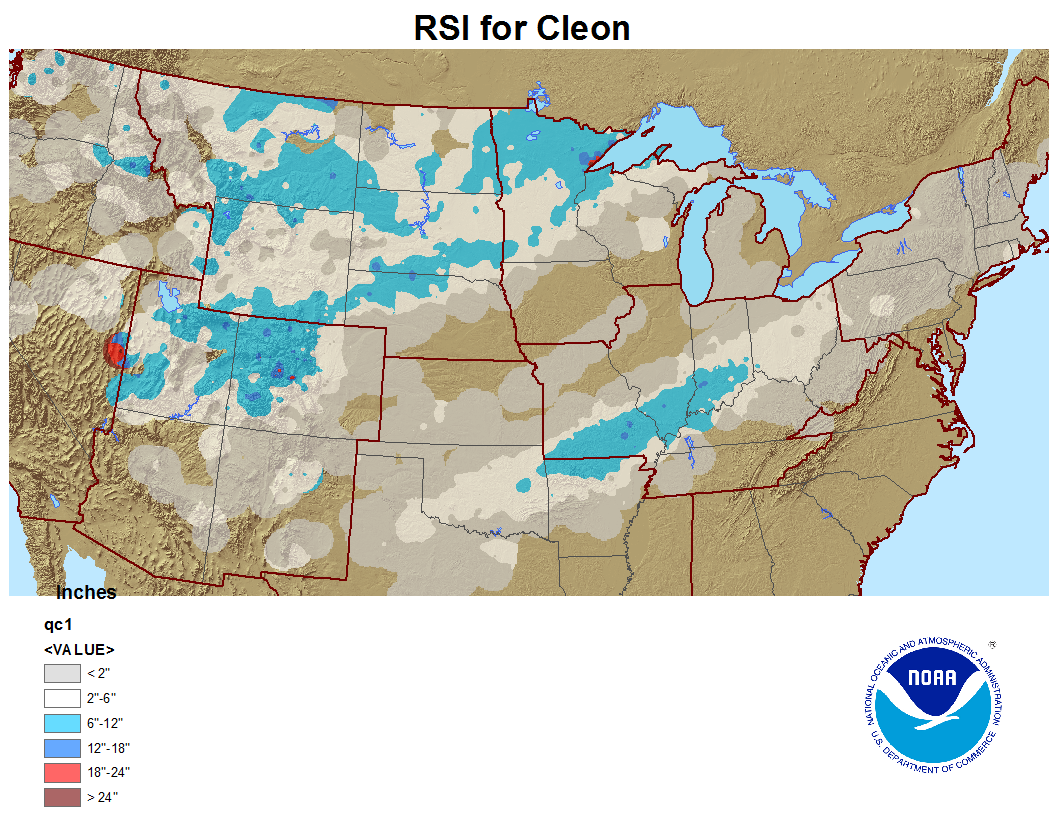
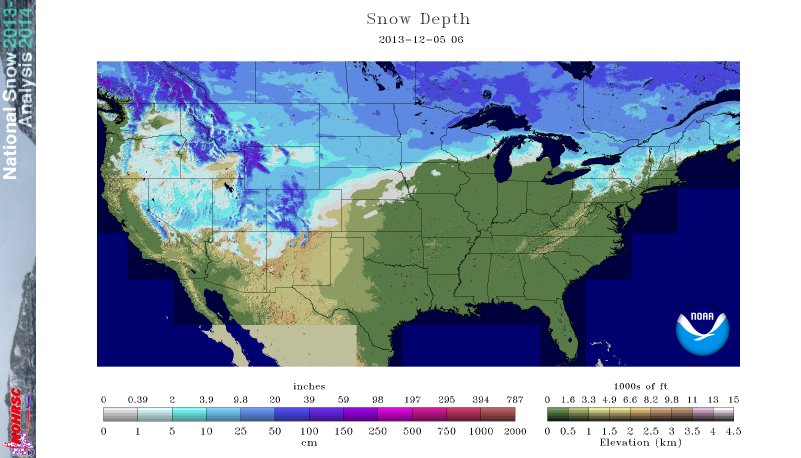
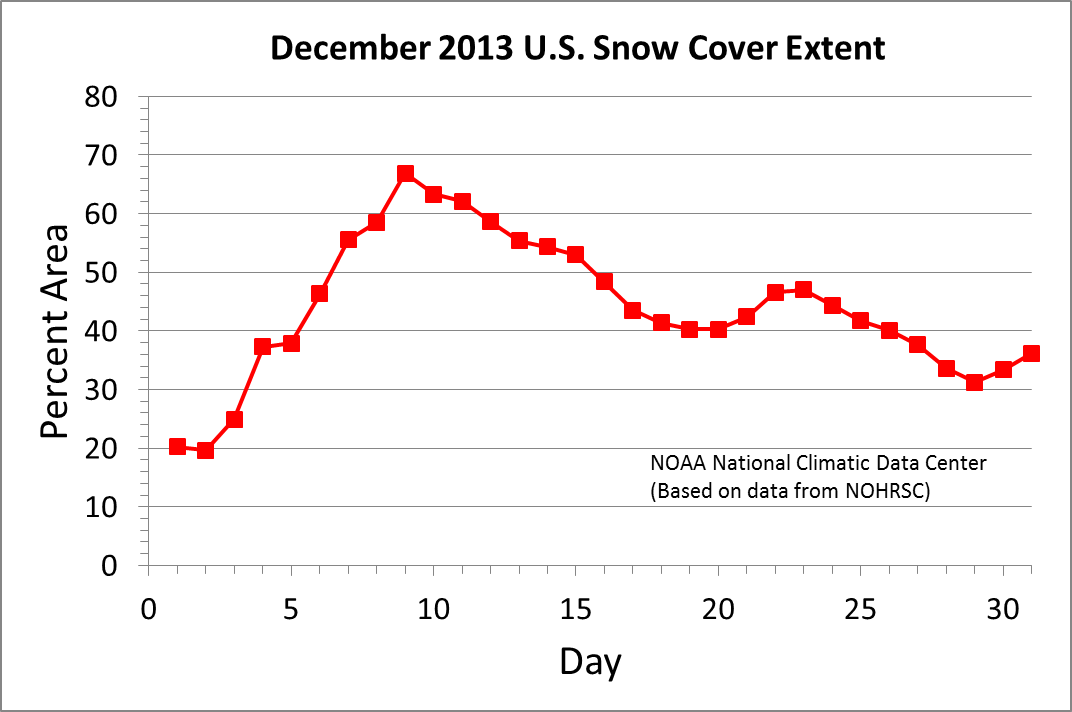
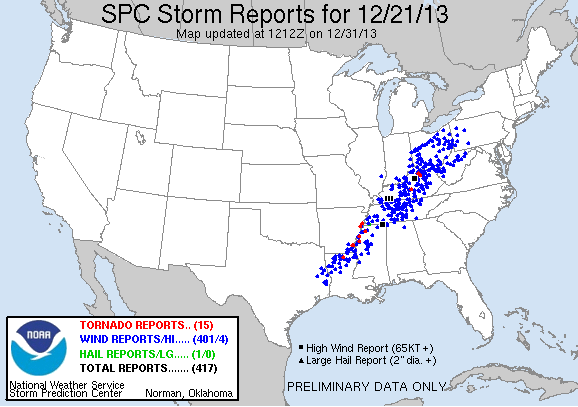
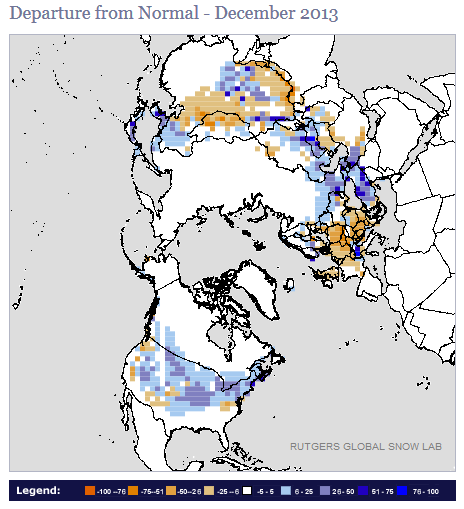
For December 2013, the jet stream was very active with several upper-level short-wave troughs and closed lows bringing cold and wet weather to parts of the country. These systems drew in moisture from the Gulf of Mexico to produce tracks of precipitation as they moved east of the Rockies. Where the moisture was entrained into sub-freezing air, wintry precipitation occurred. Consequently, several significant snowstorms expanded snow cover across the Lower 48 States:
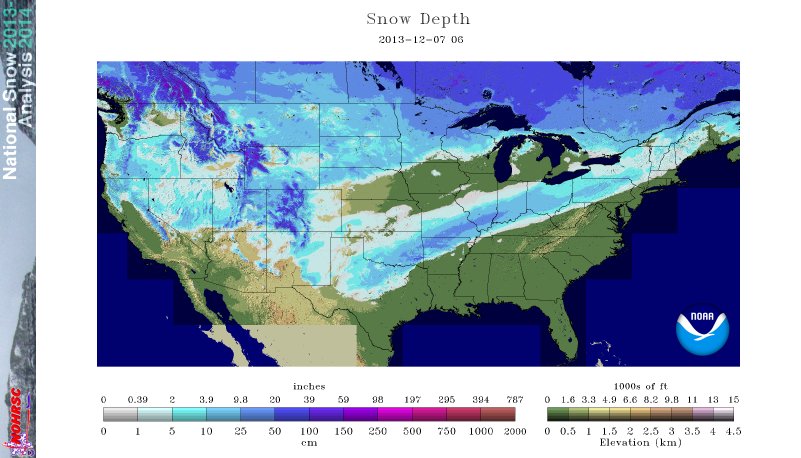
- On December 1st-7th, a snowstorm dropped bands of snow across the country — first across the West and Northern Plains, bringing national snow coverage to 37.9 percent of the country by the 5th, then across the Southern Plains to Northeast, bringing the national coverage to 55.5 percent on the 7th.
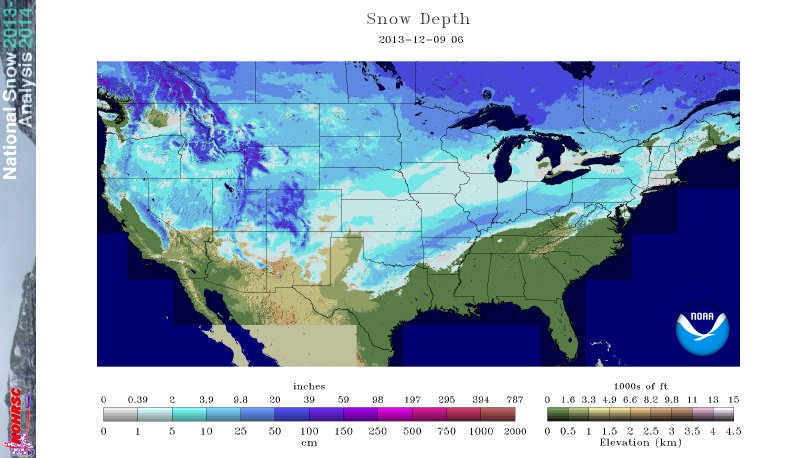
- Another system quickly followed on the 9th, expanding the snow cover across the Central Plains to Great Lakes and bringing the national coverage to 66.9 percent of the country.
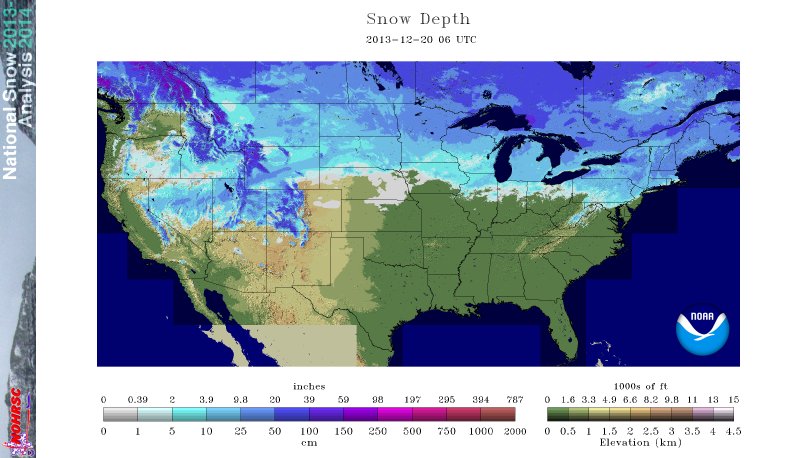
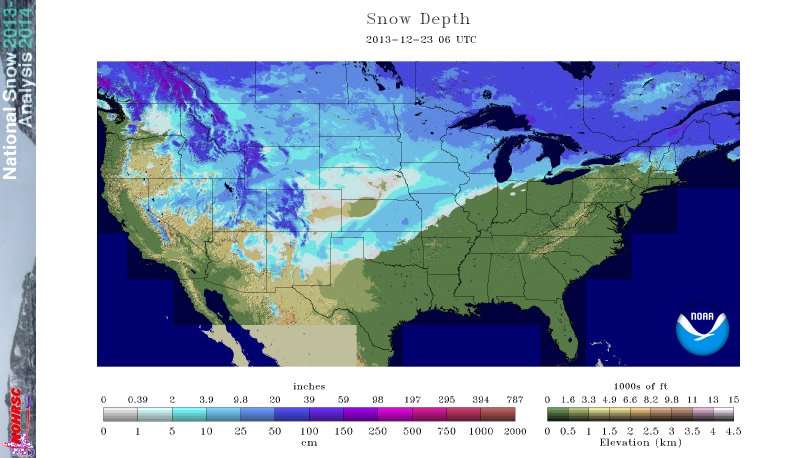
- Warm southerly air associated with upper-level ridges behind the troughs quickly melted the snow, so by the 20th the snow cover area had contracted to 40.3 percent of the country, but a storm system moving out of the Southern and Central Plains expanded the national snow coverage to 47.0 percent of the country by the 23rd.
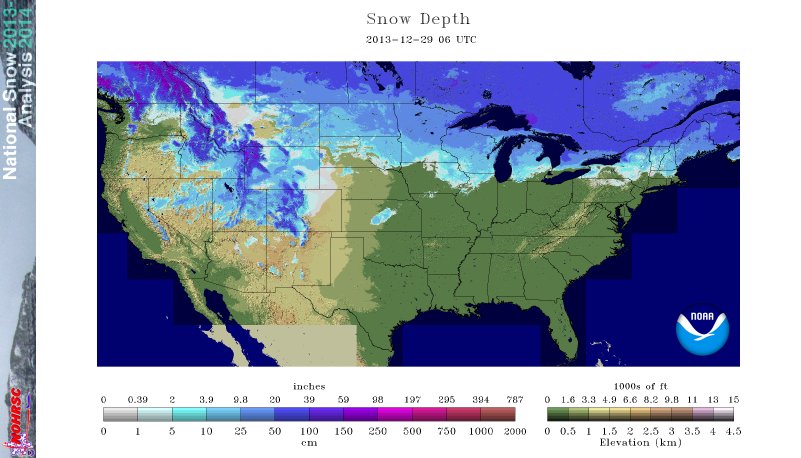
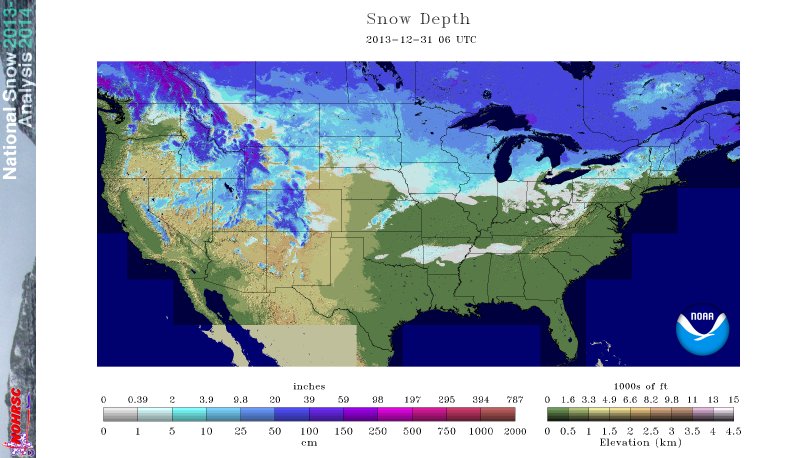
- The snow cover shrank again to 31.2 percent of the country by the 29th, but a snowstorm moving across the northern States brought the national snow cover area to 36.2 percent of the country by the end of the month.
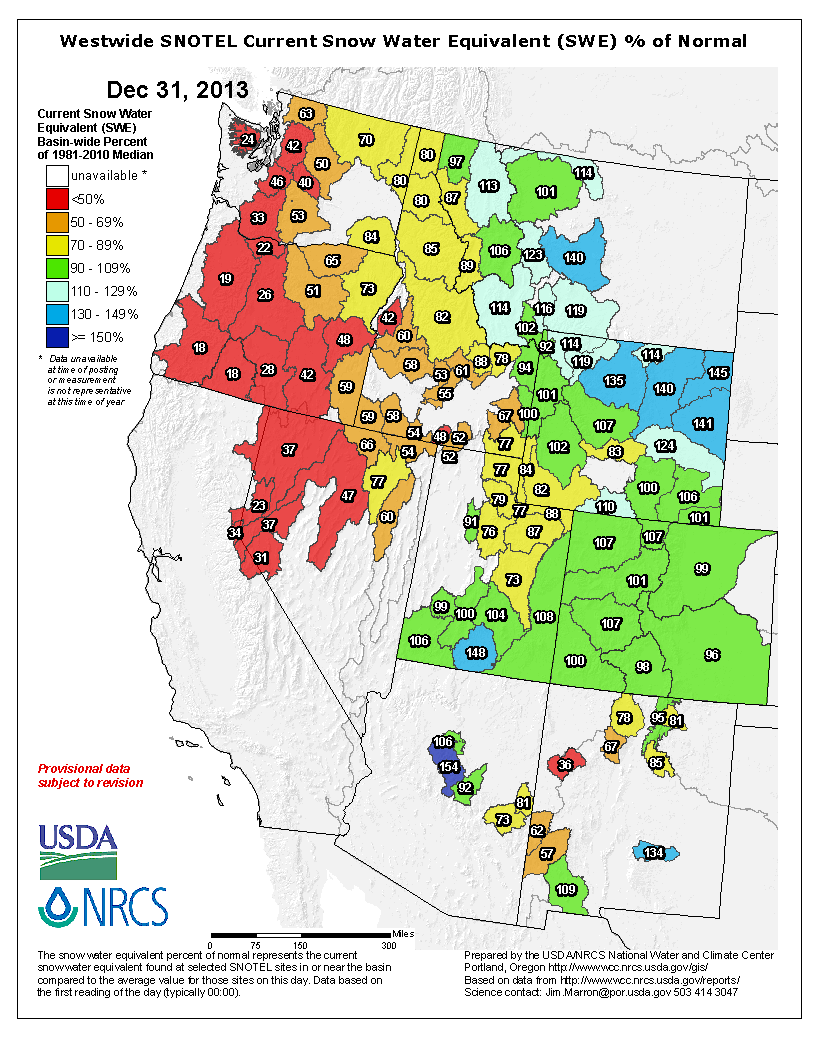
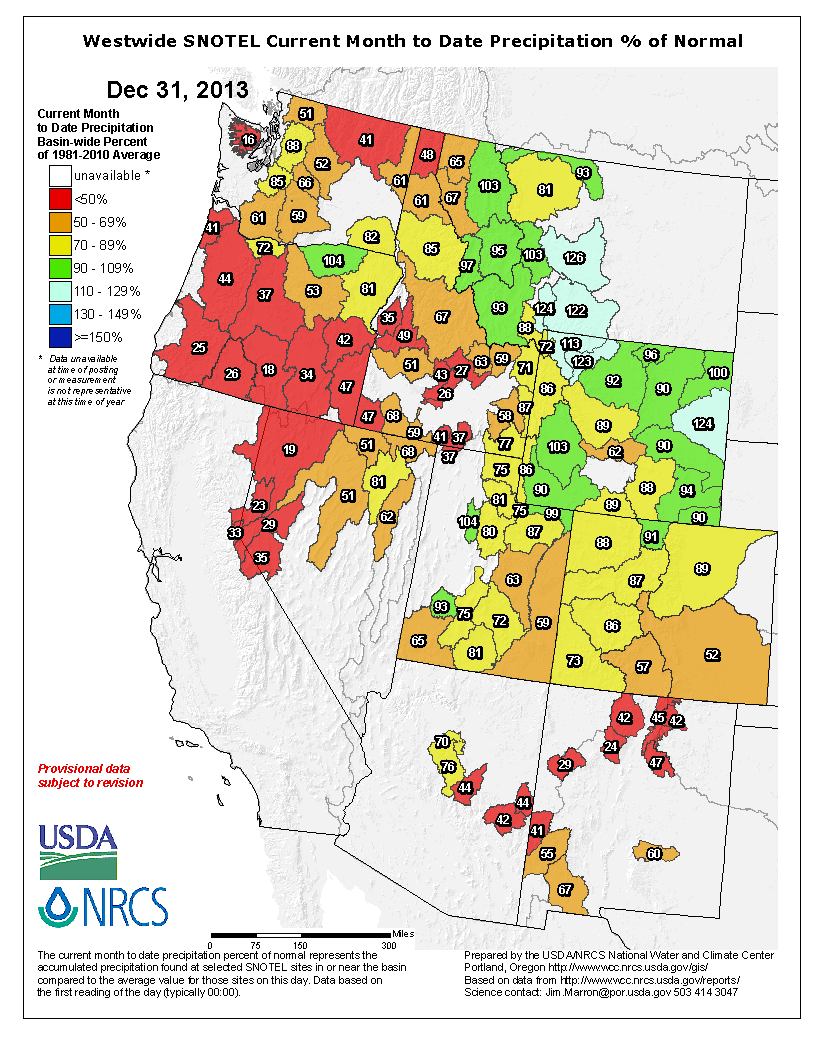
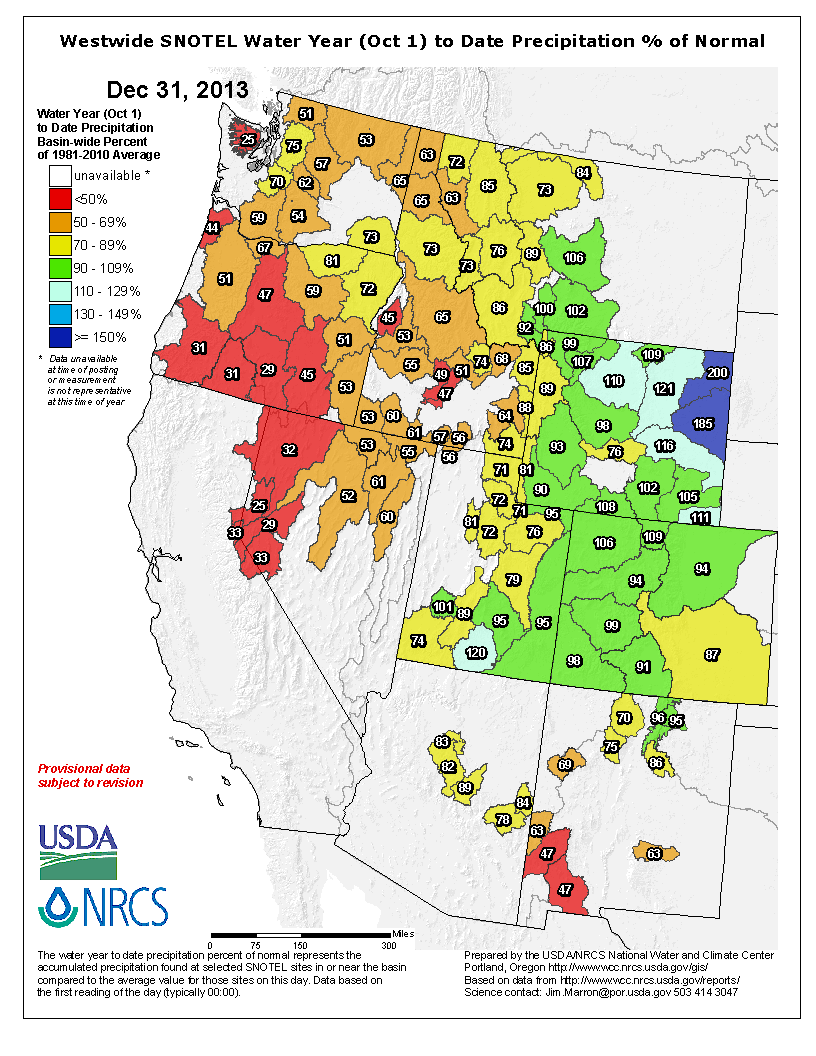
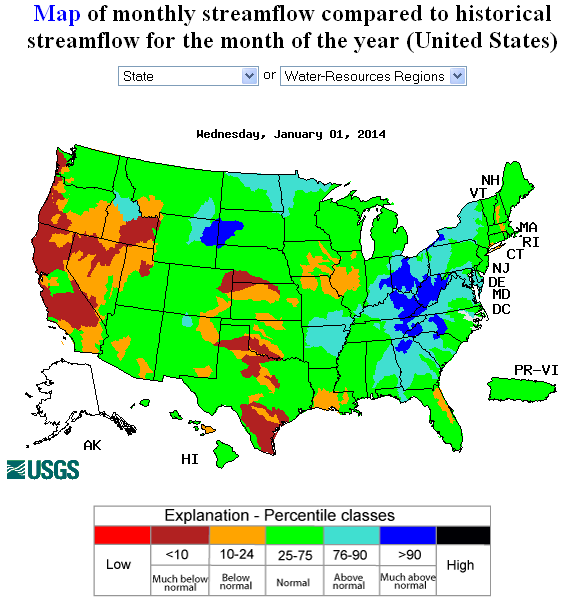
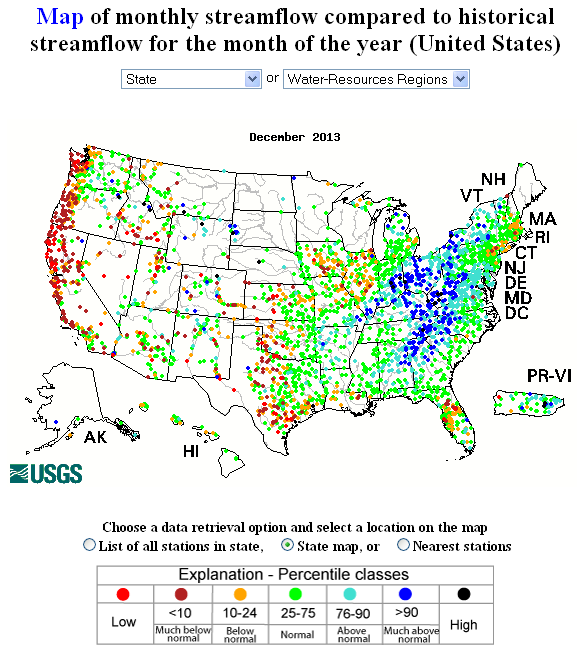
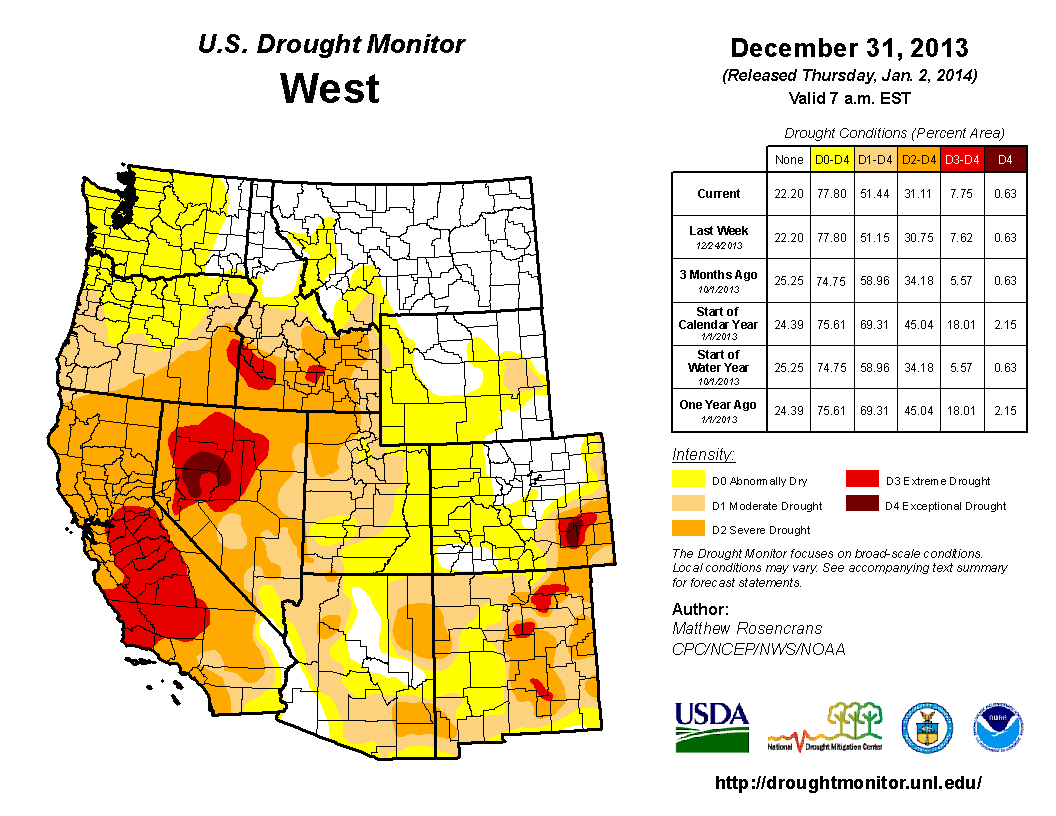
The upper-level long-wave ridge over the eastern North Pacific created a northwesterly flow in the circulation which inhibited the formation of massive winter storms over the West. As a result, both total precipitation and the mountain snowpack over the western U.S. were well below normal, both for the month and the water year to date (which began October 1), and streamflow was well below normal, especially along the West Coast. The Climate Extremes Index (CEI) for the West ranked second biggest in the 1910-2013 record for December due to the dryness (second most extreme drought area component, fifth most extreme days without precipitation component) and cold temperatures (fourth most extreme cold minimum temperature component).
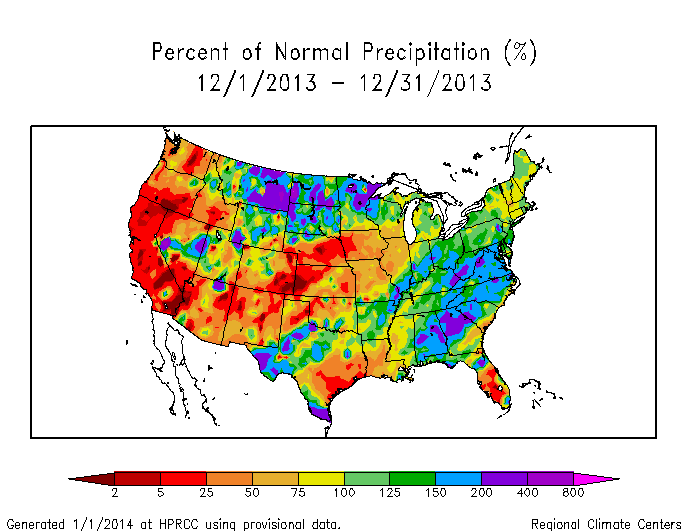
Map of monthly precipitation anomalies.
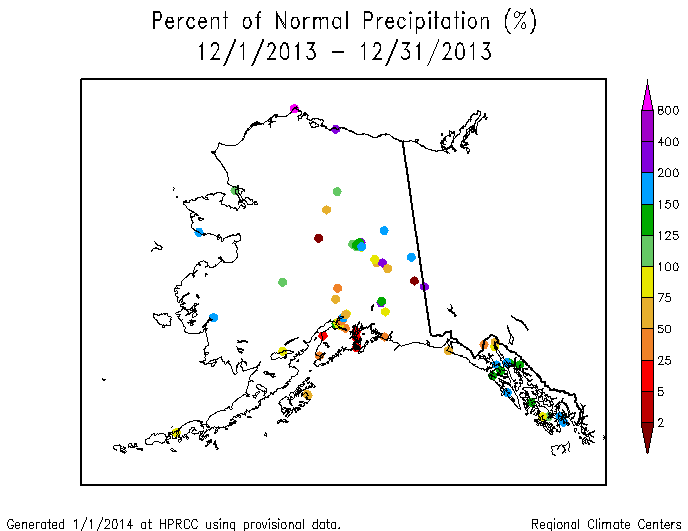
The storm track resulted in three streaks of above-normal precipitation: in the north central States, the Ohio Valley to Great Lakes, and the Southeast to Mid-Atlantic Coast. Precipitation largely missed the West and Central Plains, as well as parts of the Southern Plains, Midwest, and Florida. Although weather systems moved across the West before intensifying east of the Rockies, the precipitation they dropped totaled well below normal for the month. South central Alaska was drier than normal, but the western, northern, and eastern sections were generally wetter than normal.
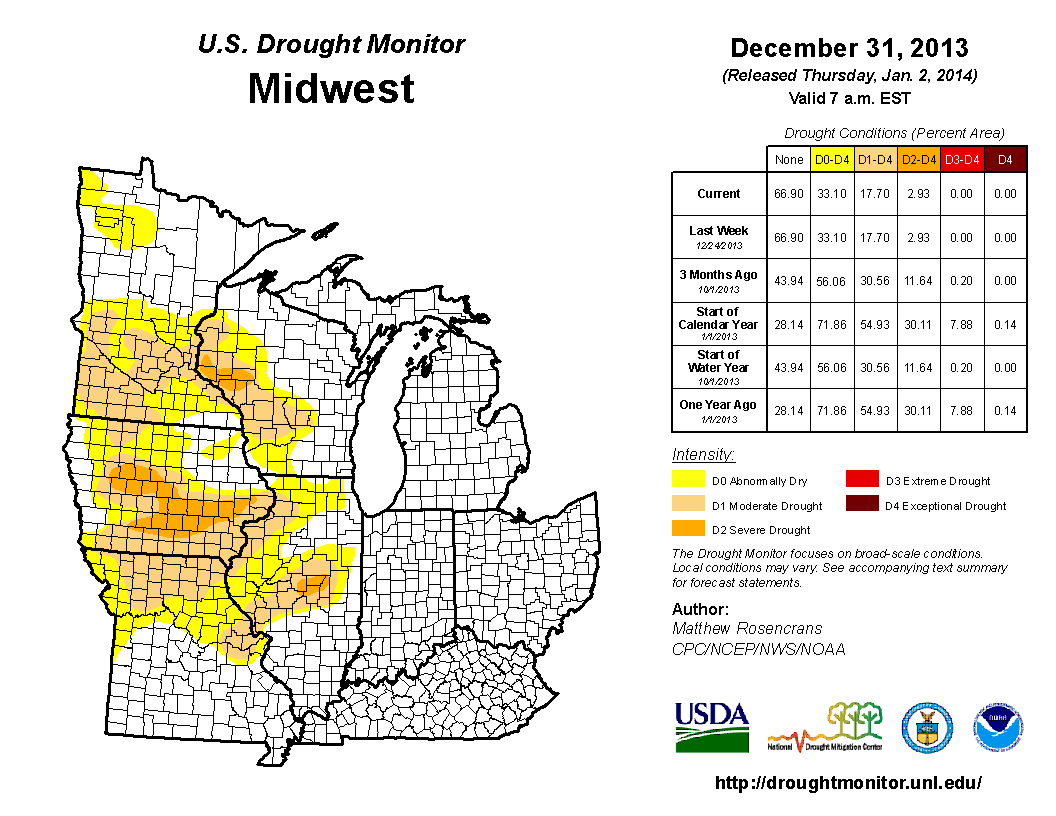
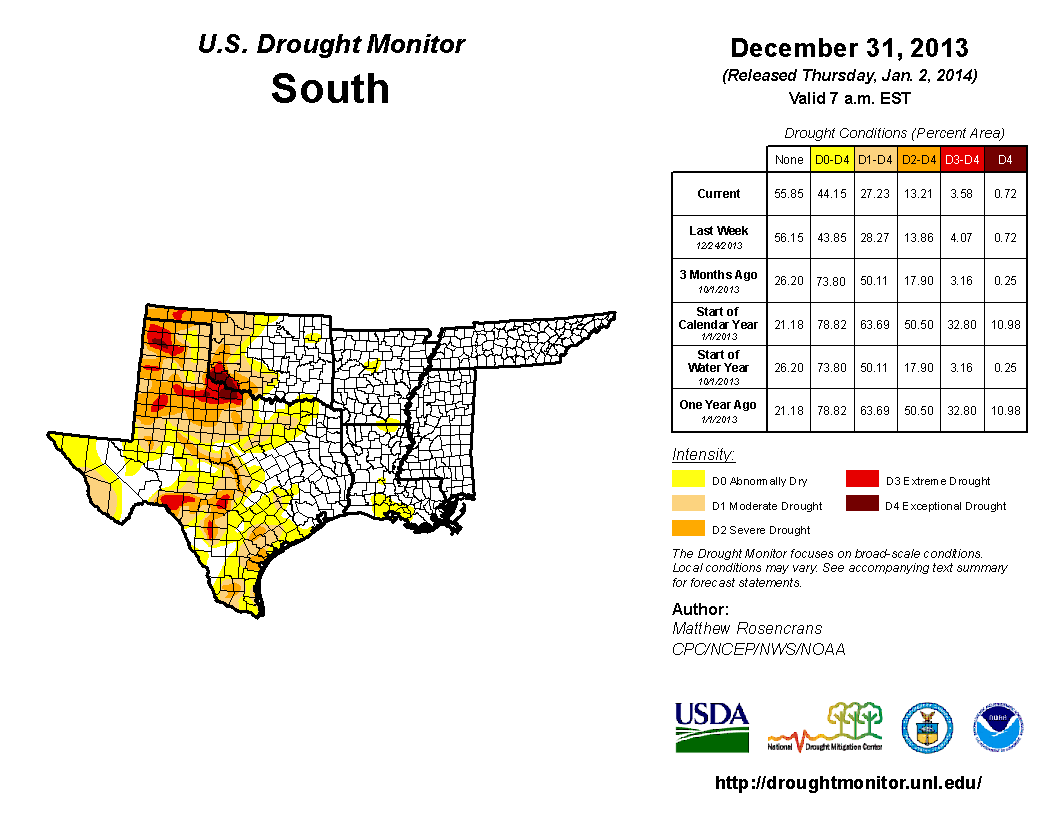
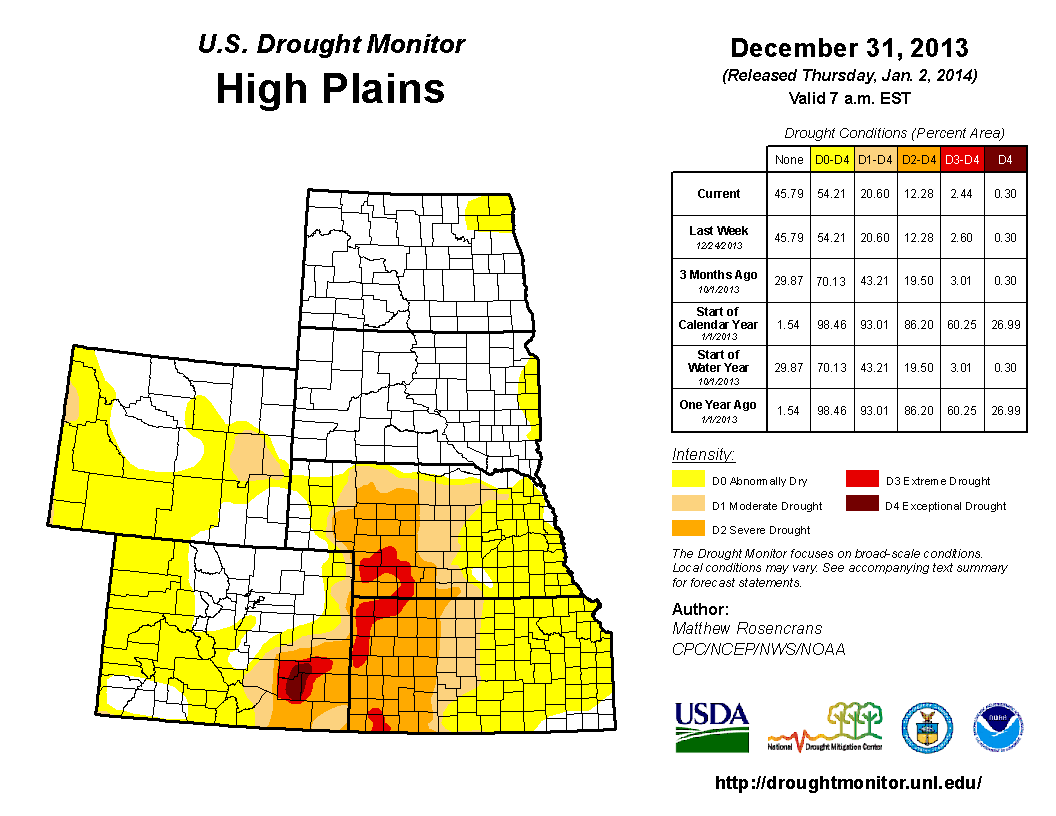
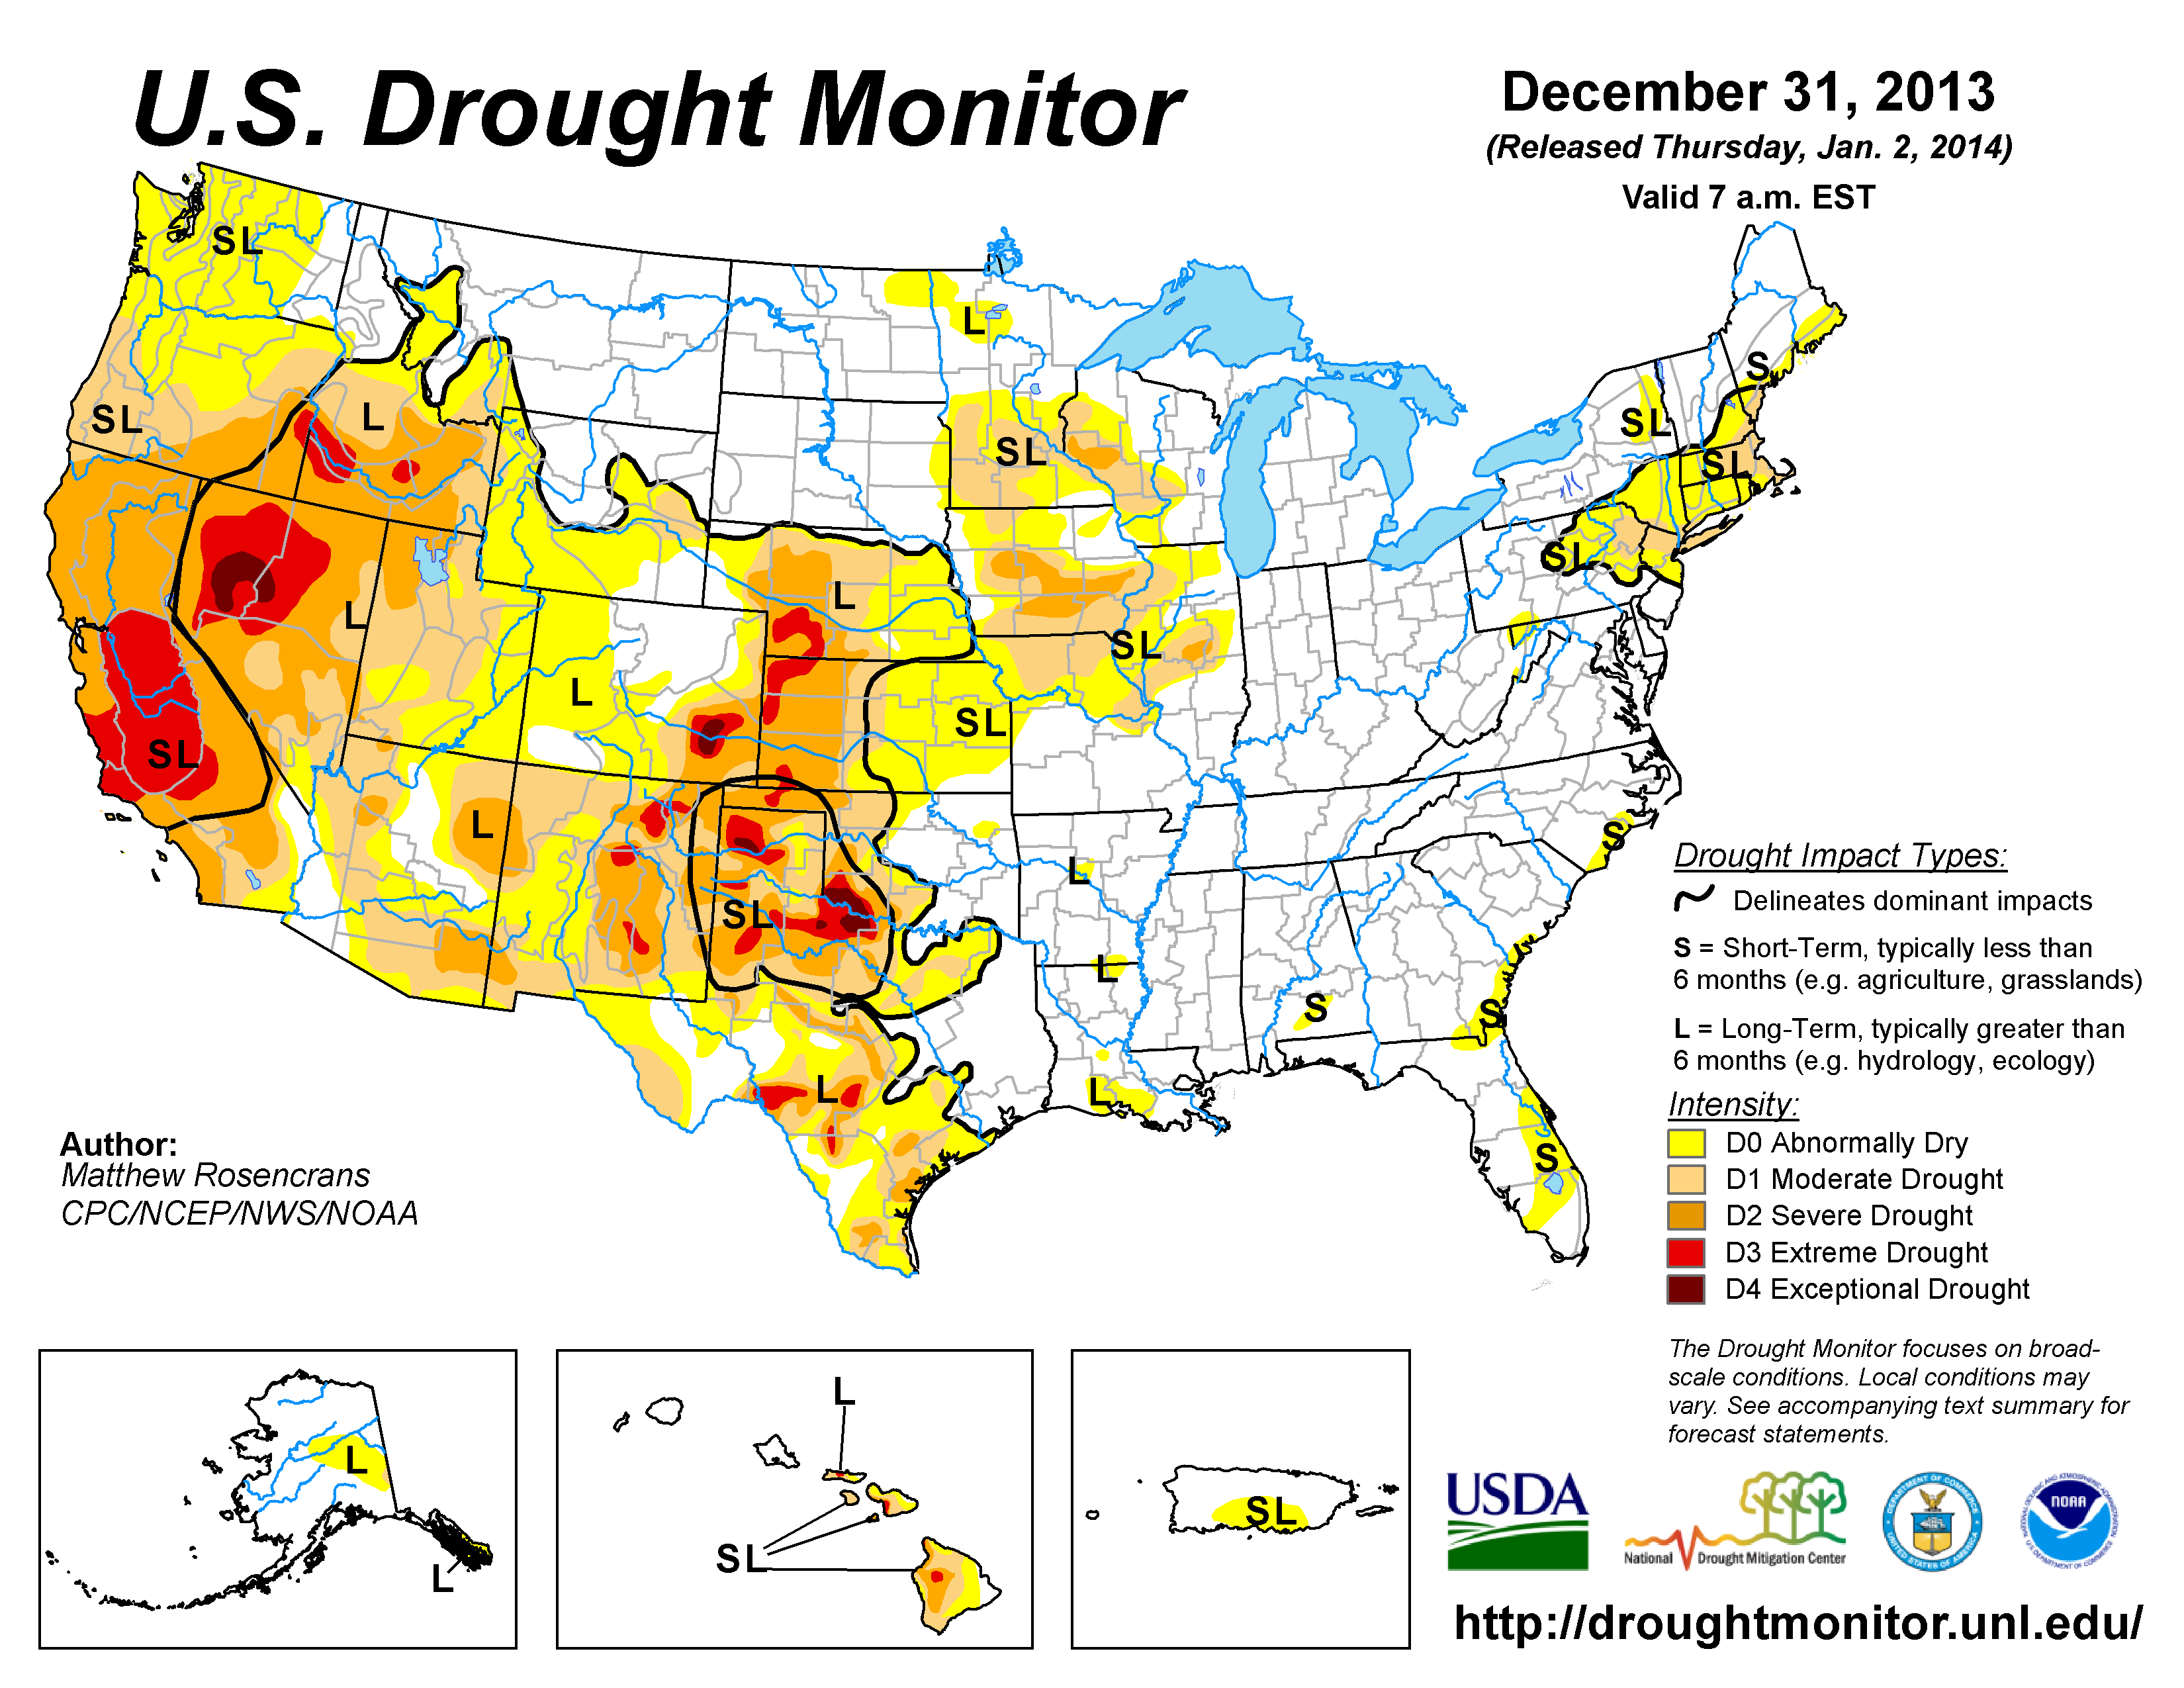
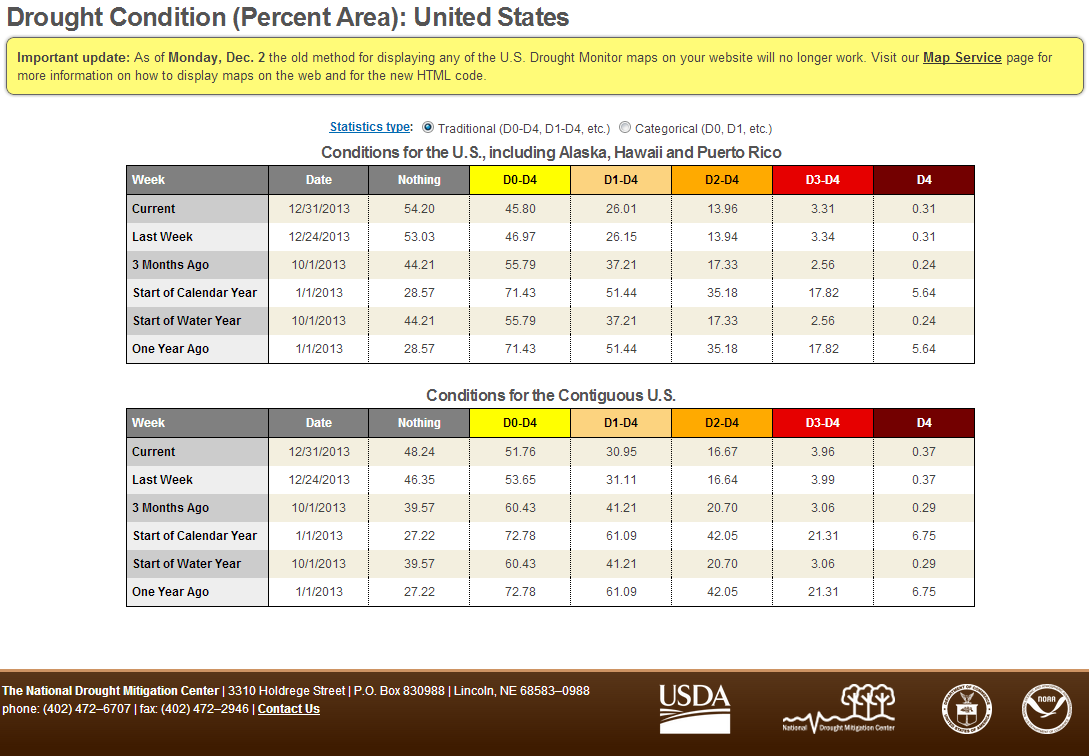
When integrated across the country, December ranked near the middle of the historical record at 54th driest. But the monthly dryness along the West Coast and in the Central Plains gave nine states a December precipitation rank in their driest third of the historical record, with three of those (California at second driest, Oregon at third driest, and Washington at sixth driest) ranking in the top ten driest category. Six states ranked in the top ten wettest category, with 17 others in the wettest third of the historical record. The precipitation east of the Rockies helped reduce drought in the East and parts of the Midwest and Southern Plains, but December's dryness expanded drought in the West and Central Plains. On balance, the national drought footprint expanded slightly to 26.0 percent of the U.S. as a whole (according to U.S. Drought Monitor statistics).
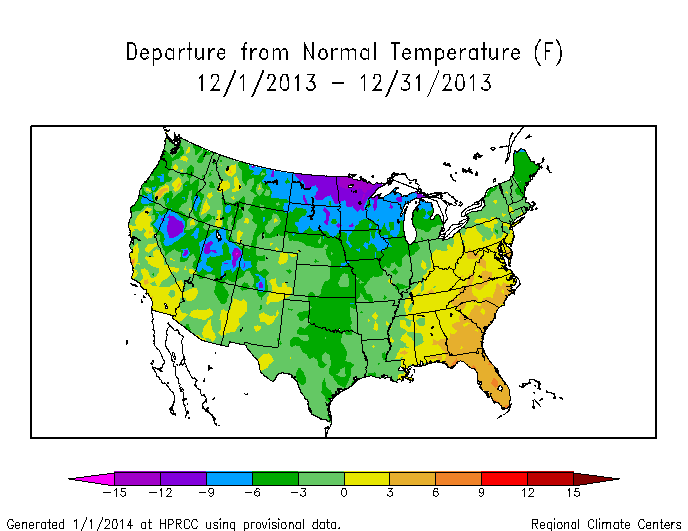
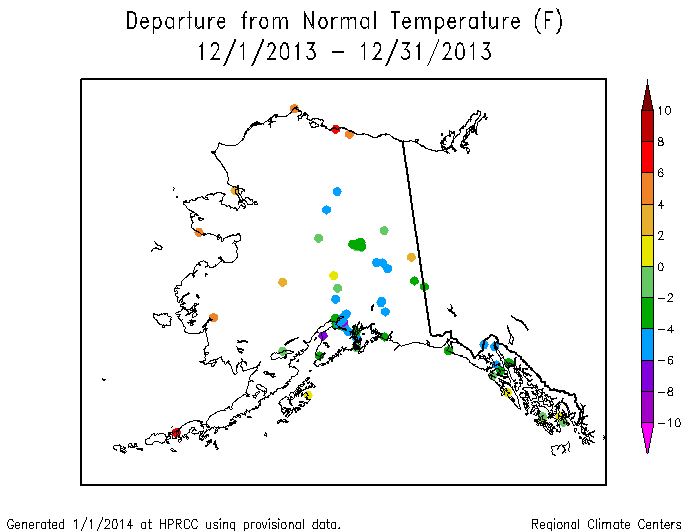
Map of monthly temperature anomalies.
The long-wave circulation pattern (ridge over eastern North Pacific and western North America, trough over eastern North America) set the stage for cold weather by establishing a long northwesterly flow in the upper atmosphere which extended into the high northern Arctic regions. Each short-wave trough in the northwesterly flow dragged cold fronts along with them. These fronts spread colder-than-normal air into the U.S. east of the Rockies, with many of the fronts reaching as far south as Florida and into Mexico. Some of the troughs and fronts moved across the western U.S., bringing below-normal temperatures west of the Rockies, most notably during the first half of the month (weeks 1, 2, 3, 4). Warmer, southerly air masses, associated with upper-level ridges, followed the troughs and cold fronts, especially in the Southeast. When integrated across the month, December 2013 averaged colder than normal across the Plains and Northeast and much of the West, but warmer than normal for the Southeast. Temperatures in Alaska averaged colder than normal in the central to southeastern areas and warmer than normal in the north and west.
When viewed in terms of the patterns across the Northern Hemisphere, the December 2013 temperature and circulation patterns over North America represent a simple shift of the circumpolar vortex from the polar region to North America and the North Atlantic. The upper-level circulation anomalies over the North Pole, Europe, and much of Asia were above normal, as opposed to below normal over North America. This was manifested at the surface in the temperatures — while much of North America was colder than normal, much of Eurasia was warmer than normal.
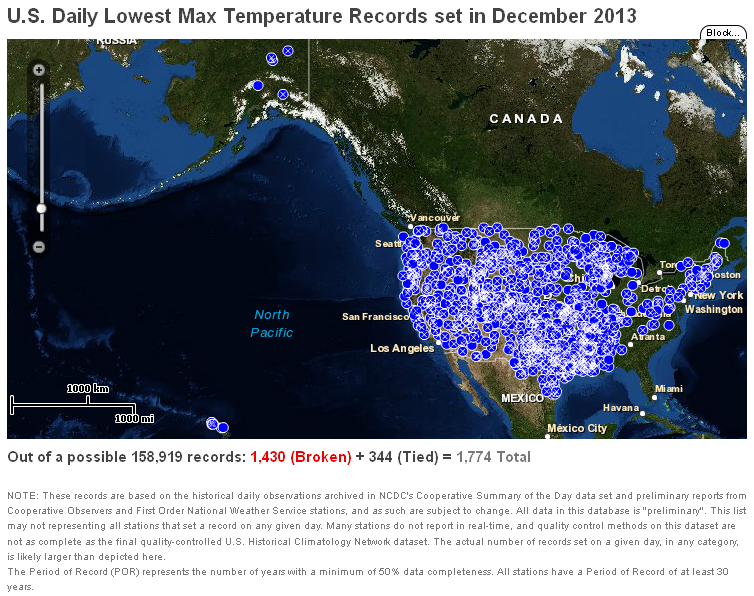
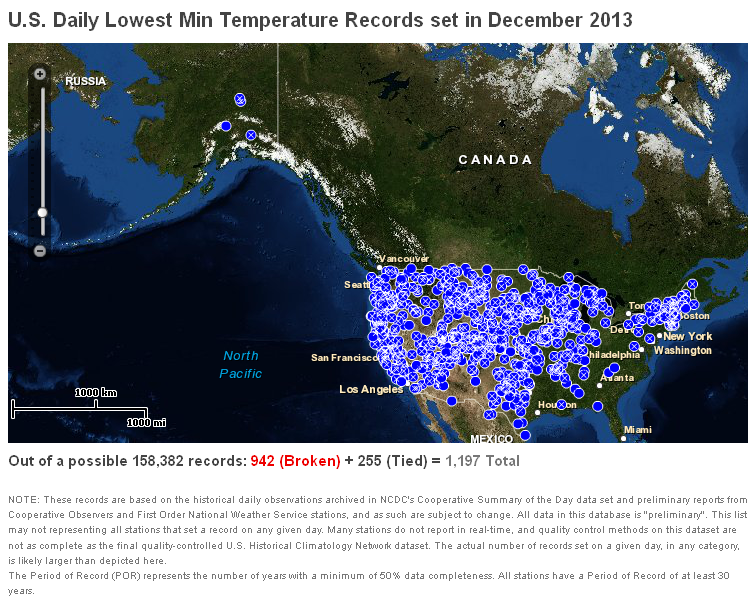
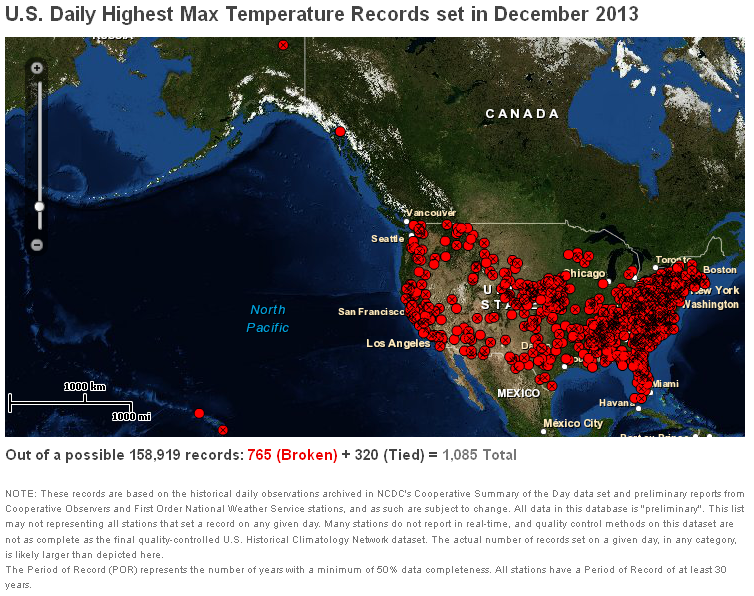
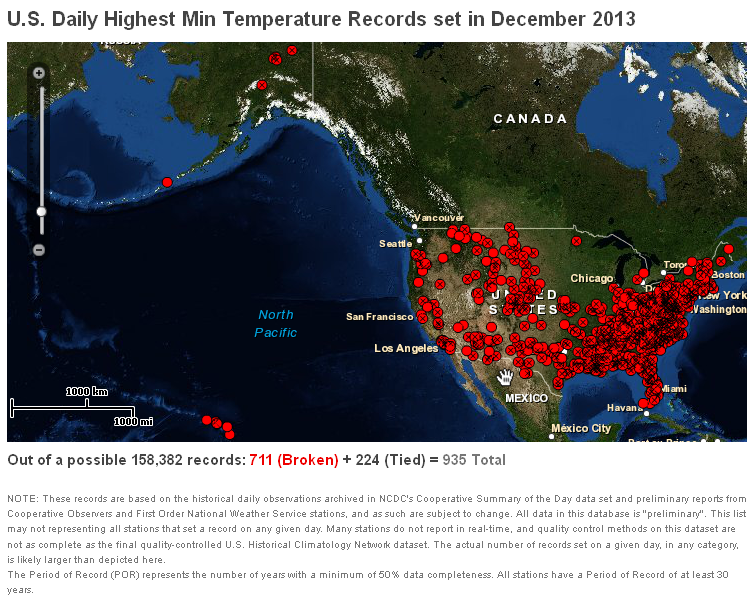
When integrated across the CONUS, December 2013 ranked as the 21st coldest December in the 1895-2013 record. Twenty-three states, mostly along and west of the Mississippi River and Great Lakes, ranked in the coldest third of the historical record, with two of them (Minnesota at eighth coldest and North Dakota at ninth coldest) ranking in the top ten coldest category. Eight states (in the Mid-Atlantic to Southeast) had December temperatures in the warmest third of the historical record, with Florida ranking sixth warmest. There were about one and a half as many record cold daily highs (1774) and lows (1197, or a total of 2971) as record warm daily highs (1085) and lows (935, or a total of 2020). In spite of the widespread cold temperatures (the area-averaged temperature rank for the U.S. was 21st coldest), most of the high-population centers of the East Coast had near- to above-average temperatures, so the national Residential Energy Demand Temperature Index (REDTI) for December 2013 was near the long-term average (only 42nd largest).
Atmospheric Drivers
Subtropical highs, and cold fronts and low pressure systems moving in the storm track flow, are influenced by the broadscale atmospheric circulation. The following describes several modes or patterns of the atmospheric circulation, their drivers, the temperature and precipitation patterns (or teleconnections) associated with them, and their index values this month:
-
El Niño Southern Oscillation (ENSO)
- Description: Oceanic and atmospheric conditions in the tropical Pacific Ocean can influence weather across the globe. ENSO is characterized by two extreme modes: El Niño (warmer-than-normal sea surface temperature [SST] anomalies in the tropical Pacific) and La Niña (cooler-than-normal SST anomalies), with the absence of either of these modes termed "ENSO-neutral" conditions.
- Status: Ocean temperatures and atmospheric circulation anomalies indicated that the equatorial Pacific continued in an ENSO-neutral state during December.
- Teleconnections (influence on weather): To the extent teleconnections are known, while in a neutral state, ENSO normally is not a player in the month's weather. Historical data has been analyzed by NOAA to show typical temperature and precipitation patterns associated with El Niño and La Niña ENSO episodes. Teleconnections are not available for ENSO-neutral conditions at that NOAA web site.
-
Madden-Julian Oscillation (MJO)
- Description: The MJO is a tropical disturbance or "wave" that propagates eastward around the global tropics with a cycle on the order of 30-60 days. It is characterized by regions of enhanced and suppressed tropical rainfall. One of its indices is a phase diagram which illustrates the phase (1-8) and amplitude of the MJO on a daily basis. The MJO is categorized into eight "phases" depending on the pattern of the location and intensity of the regions of enhanced and suppressed tropical rainfall. The MJO can enter periods of little or no activity, when it becomes neutral or incoherent and has little influence on the weather. Overall, the MJO tends to be most active during ENSO-neutral years, and is often absent during moderate-to-strong El Niño and La Niña episodes.
- Status:The MJO began the month incoherent, transitioned weakly into phases 3 and 4 by mid-month, then spent the rest of the month incoherent or weakly near phases 5 and 6. When the MJO was incoherent, other modes of convective variability in the tropics, such as Kelvin and Rossby waves, exerted some influence (as indicated by the MJO discussions for December 9, 16, 23, 30).
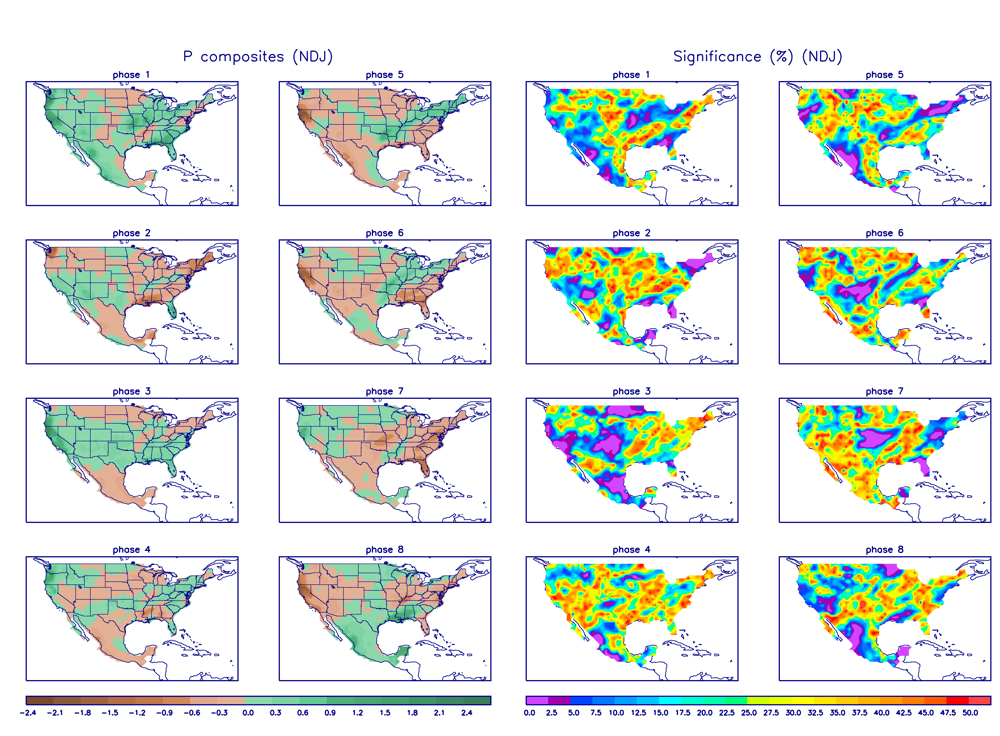
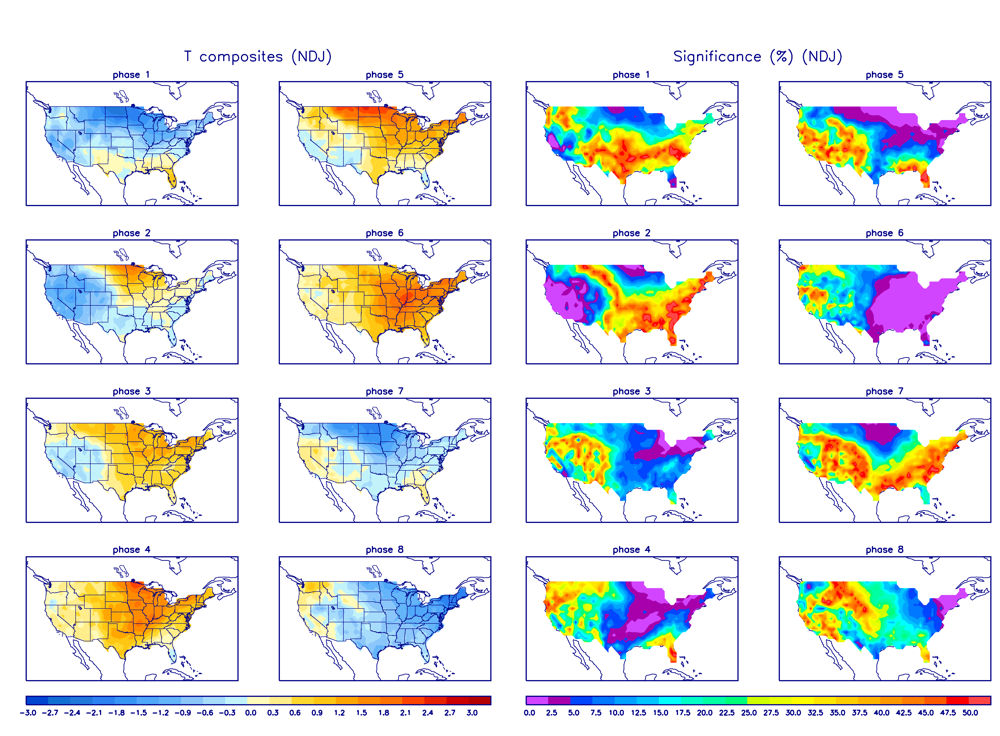
- Teleconnections (influence on weather): The MJO's temperature and precipitation teleconnections to U.S. weather depend on time of year and MJO phase. To the extent teleconnections are known, the November-January teleconnections for precipitation are shown here and for temperature are shown here.
- Comparison to Observed: The MJO is transitory and can change phases (modes) within a month, so it is more closely related to weekly weather patterns than monthly. The December 2013 monthly temperature and precipitation anomaly patterns do not match the teleconnections for MJO phases 3-6, except for warmer-than-normal temperatures in the Southeast. On a weekly basis, the temperature anomaly pattern for the first two weeks of December is opposite that expected for phases 3 and 4, but there is some hint of agreement (warmer-than-normal temperatures) with phases 5 and 6 for parts of the country during the last two weeks (weeks 1, 2, 3, 4). The weekly precipitation anomaly patterns do not agree with the teleconnections expected for phases 3 and 4 during the first half of the month, but during the third week the wetter-than-normal strip from Arkansas to New England is consistent with the teleconnection pattern for phase 5 (weeks 1, 2, 3, 4).
- The Pacific/North American (PNA) pattern
- Description: The PNA teleconnection pattern is associated with strong fluctuations in the strength and location of the East Asian jet stream. PNA-related blocking of the jet stream flow in the Pacific can affect weather downstream over North America, especially the West and especially in the winter half of the year.
- Status: The daily PNA index was negative for the first half of the month and near zero (neutral) for the last half, averaging negative for the month as a whole.
- Teleconnections (influence on weather): To the extent teleconnections are known, the temperature teleconnection map for a negative PNA at this time of year (January on the maps) shows below-normal temperatures along the West Coast, Alaska, western Canada, and Northern Plains, and above-normal temperatures across the eastern third of the CONUS and in the Southern Plains. The precipitation teleconnection map for this time of year shows wetter-than-normal conditions over much of the eastern half of the CONUS and in the Pacific Northwest to Central Rockies. The upper-level circulation anomaly teleconnection for a negative PNA shows below-normal heights over the western half of North America and above-normal heights over the southeastern third of the CONUS. A positive PNA is associated with the opposite patterns.
- Comparison to Observed: The December 2013 temperature, precipitation, and upper-level circulation anomaly patterns are consistent with a negative PNA for temperature and upper-level circulation in the Southeast and for precipitation for much of the East, but the upper-level circulation anomalies are opposite those expected for a negative PNA over the rest of the continent.
- The Arctic Oscillation (AO) pattern
- Description: The AO teleconnection pattern relates upper-level circulation over the Arctic to circulation features over the Northern Hemisphere mid-latitudes and is most active during the cold season.
- Status: The daily AO index was positive throughout most of December, and strongly positive at mid-month, averaging positive for the month.
- Teleconnections (influence on weather): To the extent teleconnections are known, a positive AO this time of year (November-January) is typically associated with wet conditions along the West Coast and dryness in the Northeast and along the Gulf of Mexico coast, above-normal temperatures across most of the country east of the Rockies, and upper-level circulation anomalies which are below normal over much of Alaska and above normal over the eastern CONUS.
- Comparison to Observed: The December 2013 upper-level circulation anomaly pattern (for North America and the Northern Hemisphere) is similar to that expected with a positive AO, except it is shifted to the east and south, but the temperature anomaly pattern is not consistent with a positive AO. The precipitation anomaly pattern agrees weakly in a few places in the East, but generally not anywhere else.
- The North Atlantic Oscillation (NAO) pattern
- Description: The NAO teleconnection pattern relates upper-level circulation over the North Atlantic Ocean to circulation features over the Northern Hemisphere mid-latitudes.
- Status: The daily NAO index was near zero at the beginning and end of the month, but positive in between, and averaged positive for the month.
- Teleconnections (influence on weather): To the extent teleconnections are known, a positive NAO during this time of year (January on the teleconnection maps) is associated with warmer-than-normal temperatures east of the Rockies (except the Central Plains), is weakly associated with drier-than-normal conditions in parts of the West, and is associated with positive upper-level circulation anomalies over most of the country (except the West Coast).
- Comparison to Observed: The December 2013 monthly temperature anomaly pattern is consistent only in the Southeast, and there is some agreement during the third week when the NAO was at its strongest. The December 2013 monthly precipitation anomaly pattern is consistent where teleconnections exist. The upper-level circulation anomaly pattern shows little resemblance to a positive NAO.
- The West Pacific (WP) pattern
- Description: The WP teleconnection pattern is a primary mode of low-frequency variability over the North Pacific and reflects zonal and meridional variations in the location and intensity of the (East Asian) jet stream in the western Pacific.
- Status: The monthly WP index was strongly negative for the month, and the three-month average WP index was negative.
- Teleconnections (influence on weather): To the extent teleconnections are known, a negative WP during this time of year (January on the maps) is typically associated with above-normal temperatures in the Southwest, below-normal temperatures in the Midwest to Northeast, drier-than-normal weather from the Mid-Mississippi to Ohio valleys, above-normal circulation anomalies over the western CONUS, and below-normal circulation anomalies over eastern North America.
- Comparison to Observed: The December 2013 monthly temperature anomaly pattern is consistent in the Upper Midwest and part of the Northeast, but not elsewhere. The December 2013 monthly precipitation anomaly pattern does not agree where teleconnections exist. The upper-level circulation anomaly pattern agrees with a negative WP along the West Coast and Great Lakes, but not elsewhere.
- The Tropical/Northern Hemisphere (TNH) pattern
- Description: The TNH teleconnection pattern reflects large-scale changes in both the location and eastward extent of the Pacific jet stream, and also in the strength and position of the climatological mean Hudson Bay Low, and is dominant in the winter months. The pattern significantly modulates the flow of marine air into North America, as well as the southward transport of cold Canadian air into the north-central United States.
- Status: The TNH index was positive during December.
- Teleconnections (influence on weather): To the extent teleconnections are known, a positive TNH is typically associated with cooler-than-normal temperatures for much of the country, drier-than-normal conditions in the West, and slightly wetter-than-normal conditions in the Tennessee Valley. The upper-level circulation anomalies for a positive TNH are below-normal 500-mb geopotential heights over the eastern two-thirds of Canada and the north central U.S., and above-normal heights over the northeastern Pacific and Gulf of Mexico into the western North Atlantic.
- Observed: The December 2013 monthly temperature and precipitation anomaly patterns are consistent with a positive TNH. The upper-level circulation anomaly pattern is a very good (almost classic) match to a positive TNH.
Examination of these circulation indices and their teleconnection patterns, and comparison to observed December 2013 temperature, precipitation, and circulation patterns, suggest that the circulation patterns associated with the TNH atmospheric driver had the greatest influence on December weather, but other drivers shared influence. ENSO was neutral, and thus not a player. The MJO was incoherent or weak for most of the month, but could have exerted some influence on temperature during the last two weeks and precipitation in the East during the third week of the month. The circulation and temperature teleconnections of the PNA and NAO could have some association with the warm anomalies in the Southeast; the PNA and AO have some association with wetness in the East; and the NAO has some association with dryness in the West. The upper-level circulation anomalies for December 2013 have some resemblence to the teleconnections associated with the AO. But the TNH had the best match for the December 2013 temperature, precipitation, and upper-level circulation anomaly patterns. This month illustrates how the anomaly patterns can be strongly represented by one atmospheric driver (TNH in this case) but also have elements of several other drivers (or modes of atmospheric variability).