Note: This Synoptic Discussion describes recent weather events and climate anomalies in relation to the phenomena that cause the weather. These phenomena include the jet stream, fronts and low pressure systems that bring precipitation, high pressure systems that bring dry weather, and the mechanisms which control these features — such as El Niño, La Niña, and other oceanic and atmospheric drivers (PNA, NAO, AO, and others). The report may contain more technical language than other components of the State of the Climate series.
Synoptic Discussion
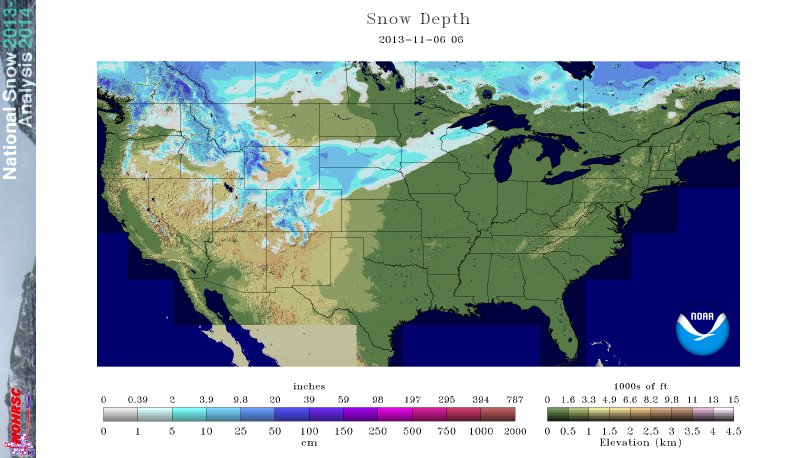
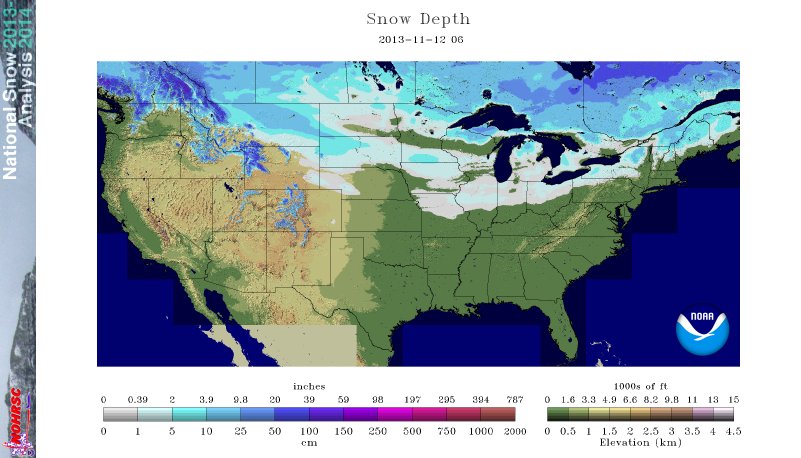
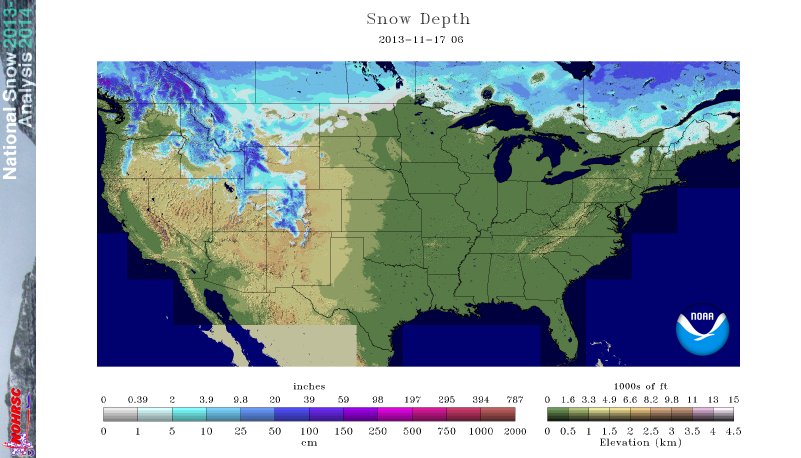
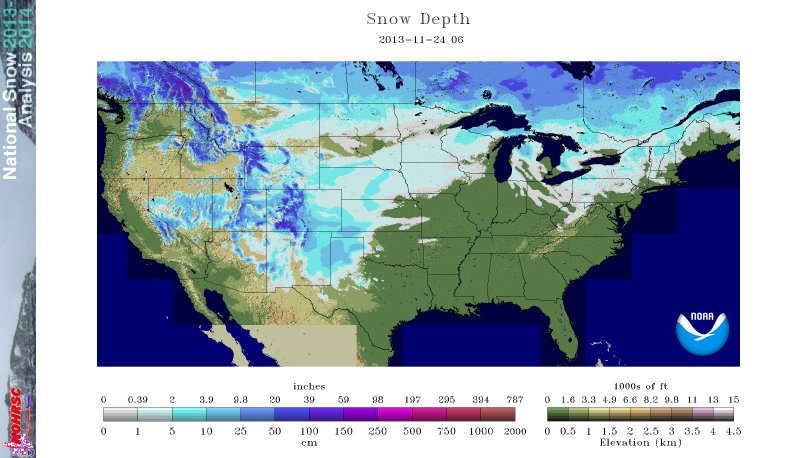
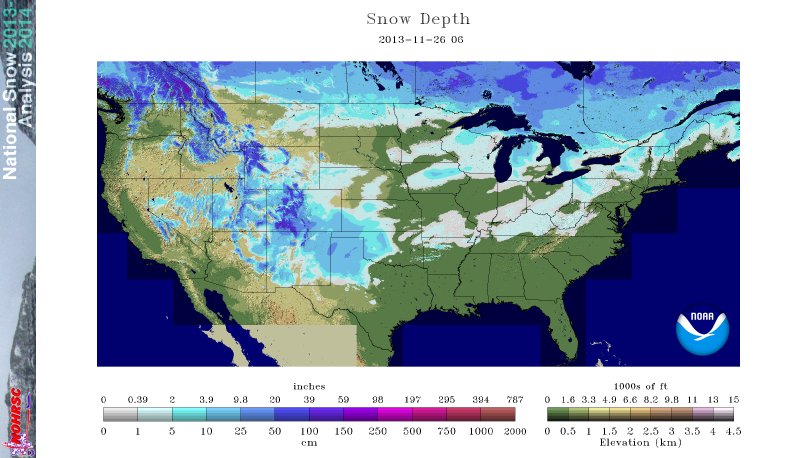
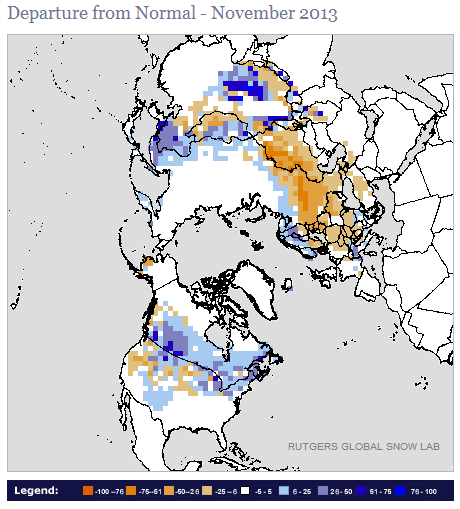
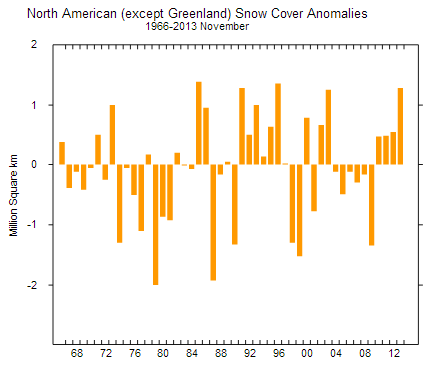
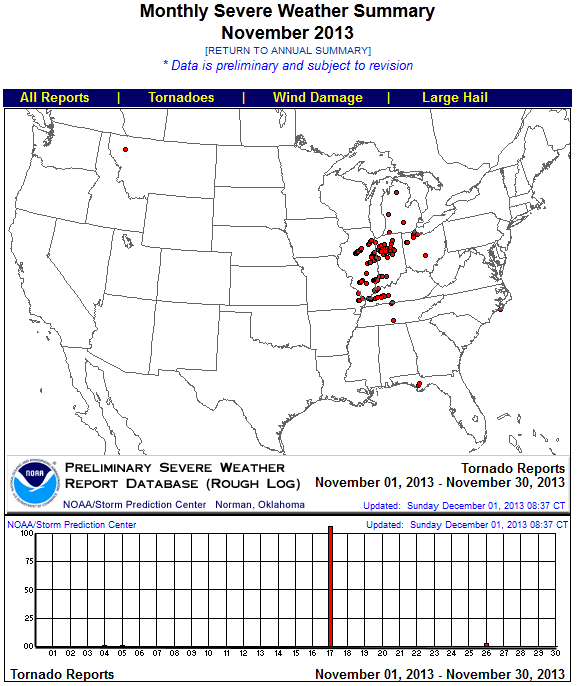
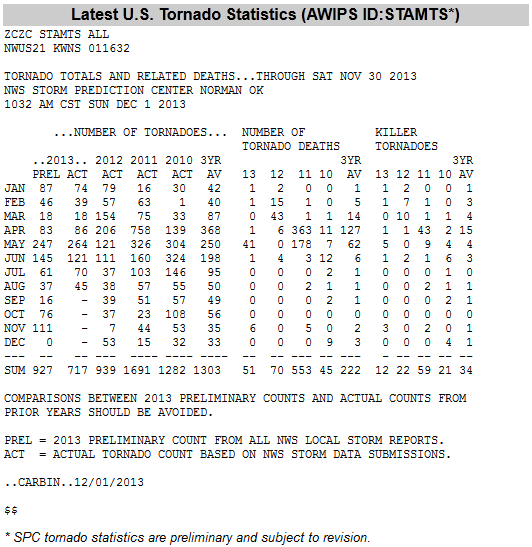
In the Northern Hemisphere, November marks the end of climatological fall (or autumn) which is the time of year when the active jet stream and circumpolar vortex expand south, spreading polar and arctic air masses from the north across the United States. For November 2013, the jet stream was very active with several upper-level troughs and closed lows bringing cool and wet weather to parts of the country. These systems drew in moisture from the Pacific which mixed with cold Canadian air to produce rain and snow in the West, and they entrained moisture from the Gulf of Mexico to produce widespread rain and snow as they moved east of the Rockies. Consequently, several significant winter snowstorms expanded snow cover across the Lower 48 States; however, warm southerly air associated with upper-level ridges behind the troughs quickly melted the snow. Four systems in particular expanded the snow cover — to 18 percent of the country on the 6th, 19 percent on the 12th, 13 percent on the 17th, and 38 percent on the 24th. The storm system on the 24th was a slow-moving, cut-off low which dropped snow from the Southwest to Central Plains and Midwest by the 24th, then across the Ohio Valley to the Northeast by the 26th. Integrated over the month, snow cover was above normal across parts of the South and some northern tier states and below normal across parts of the West and Midwest, but November 2013 snow cover area still ranked 12th largest (in the 1966-2013 satellite record for November) for the continental U.S. (CONUS) and third largest for North America. The trough and associated cold front on the 17th was especially violent, spawning over 100 tornadoes in the Ohio Valley to southern Great Lakes. The preliminary count of 111 tornadoes for November 2013 is nearly double the climatological average count of 58 for November.
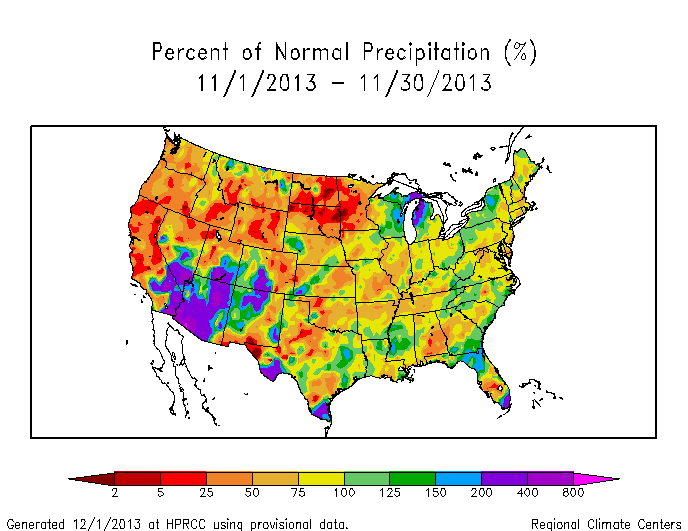
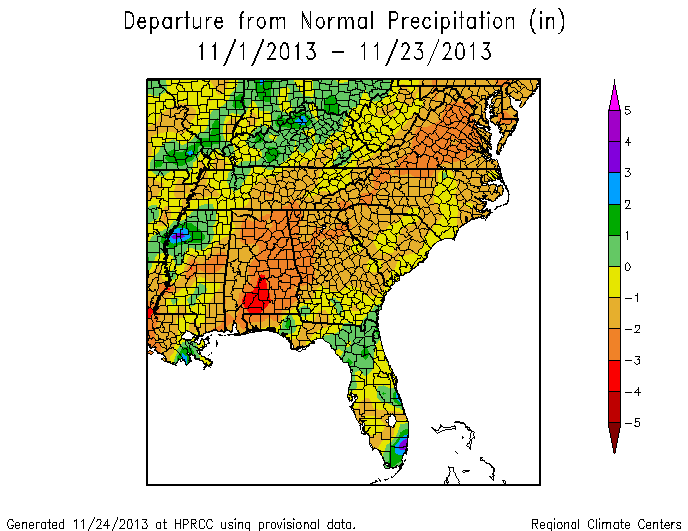
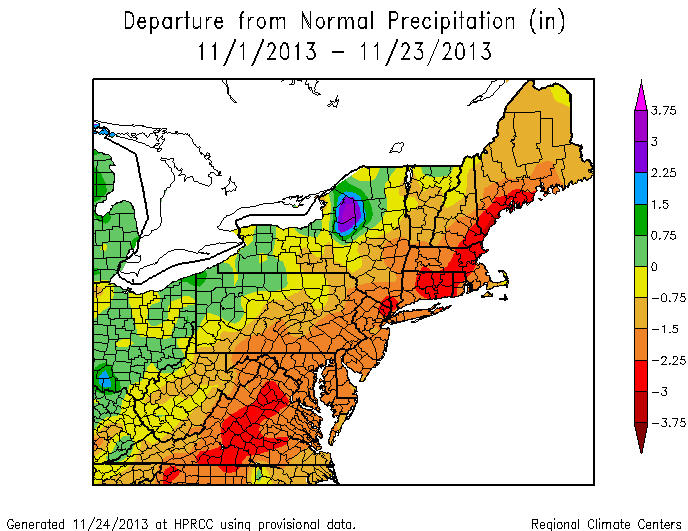
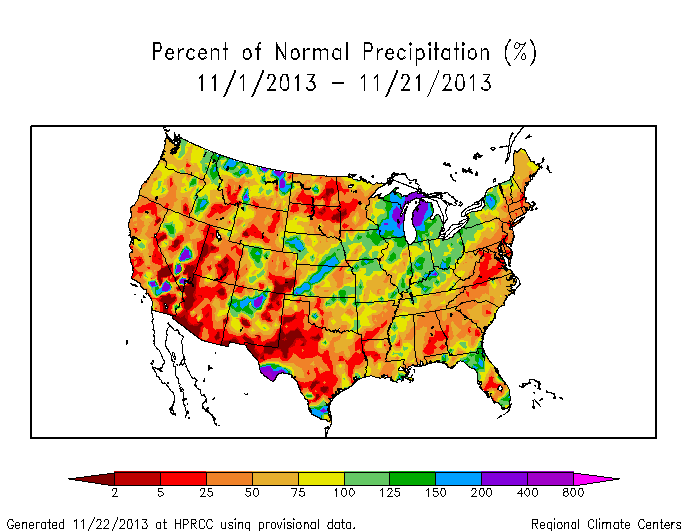
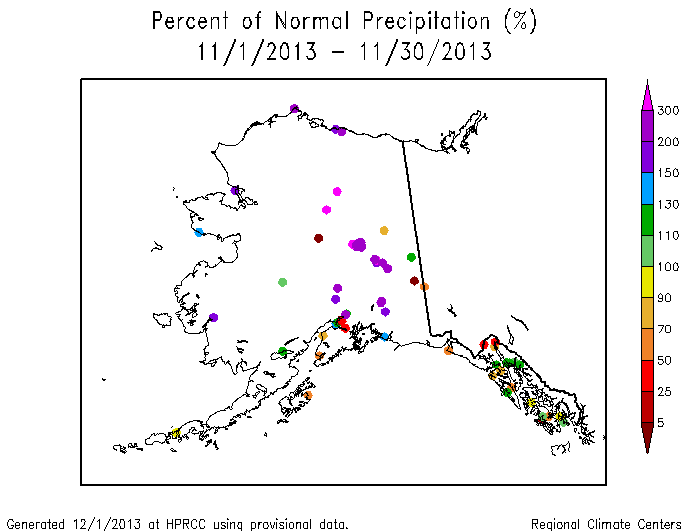
Map of monthly precipitation anomalies.
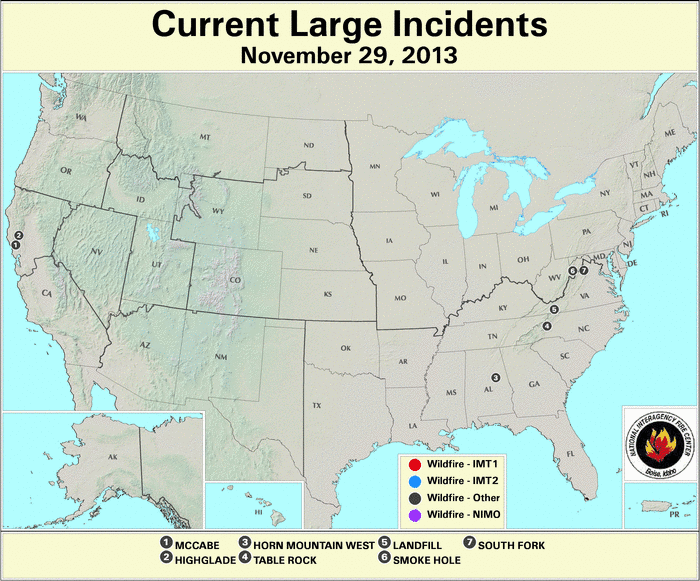
The storm track resulted in above-normal precipitation in the Southwest, but only patchy areas of above-normal precipitation east of the Rockies. Precipitation largely missed the Northern Plains, and the Deep South to Northeast was drier than normal for most of the month (weeks 1, 2, 3, 4). The slow-moving system, which moved out of the Southwest and swept across the South and up the East Coast during the last week of the month, produced enough precipitation to transform what could have been a very dry month (pre-storm Palmer Z Index and precipitation departures for the Southeast, Northeast, and U.S.) into a near-normal (or not-so-dry) month for much of the Deep South and Northeast, thus illustrating the importance of one wet weather system to the total precipitation for a month. But the rain from this system wasn't enough to extinguish several large wildfires which continued to burn along the Appalachian spine at the end of the month. Although weather systems moved across the West Coast and Northwest and into the Northern Rockies, the precipitation they dropped totaled well below normal for the month. Much of Alaska was wetter than normal, except for the southern stations which had a mixed precipitation anomaly pattern.
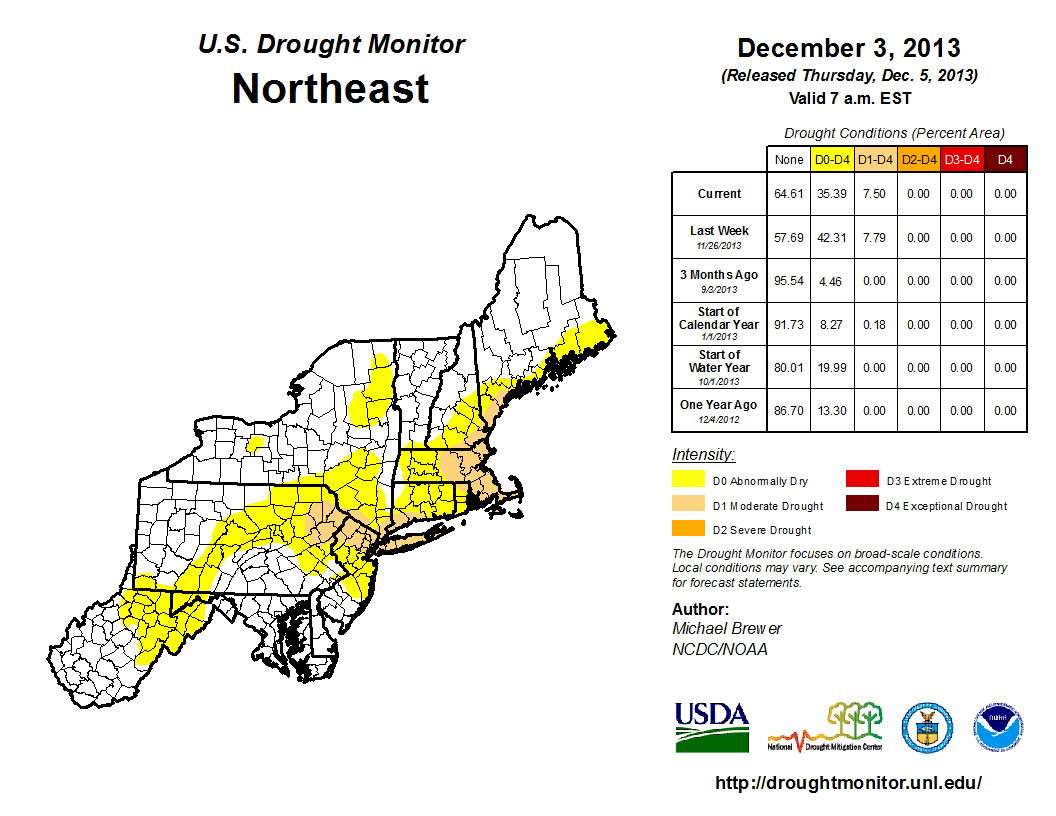
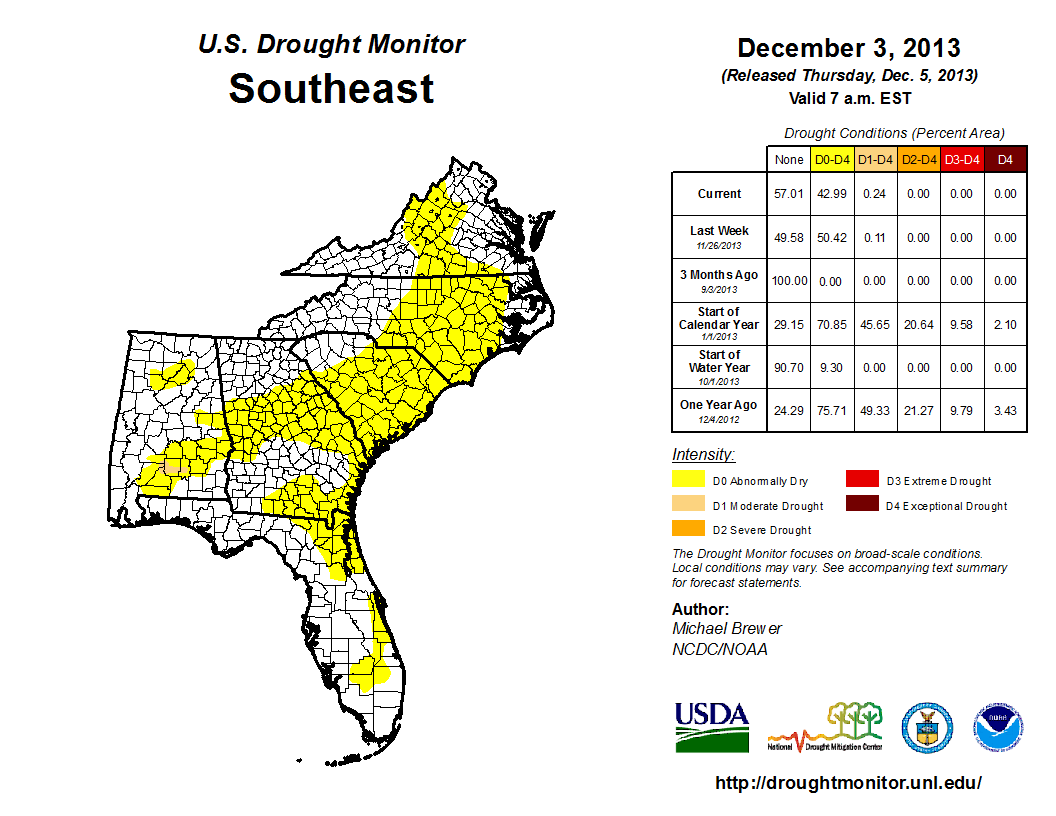
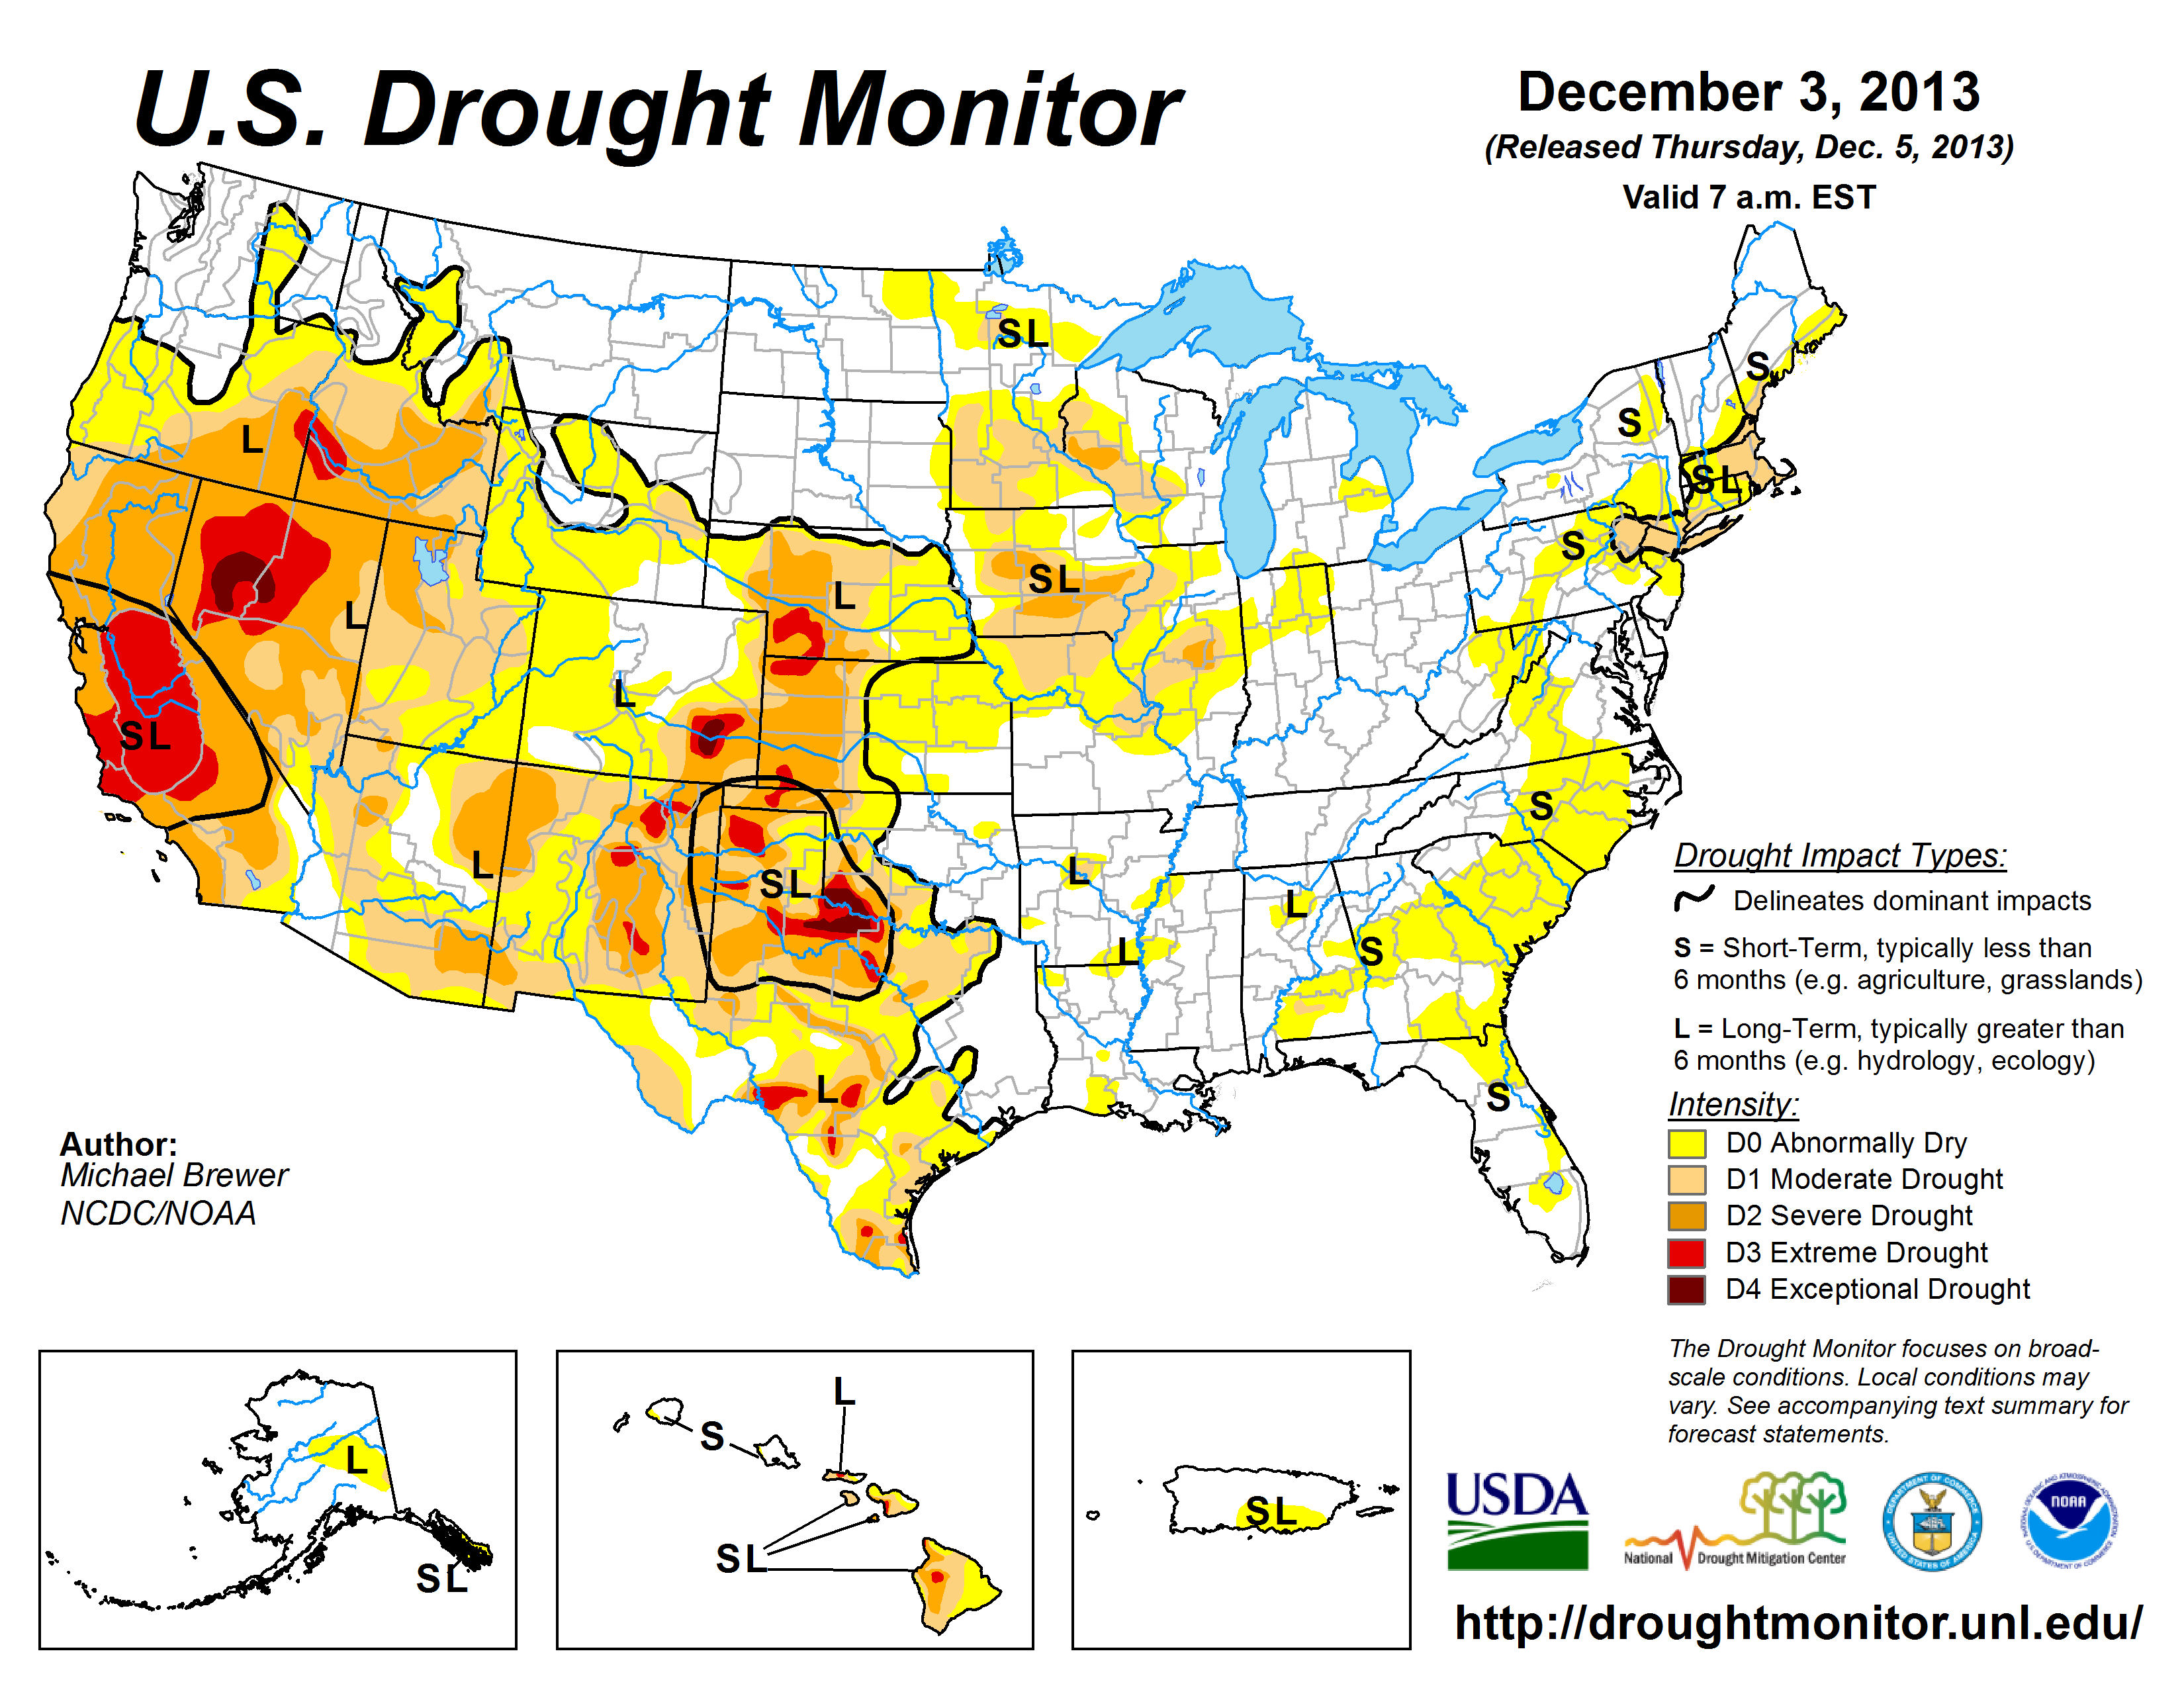
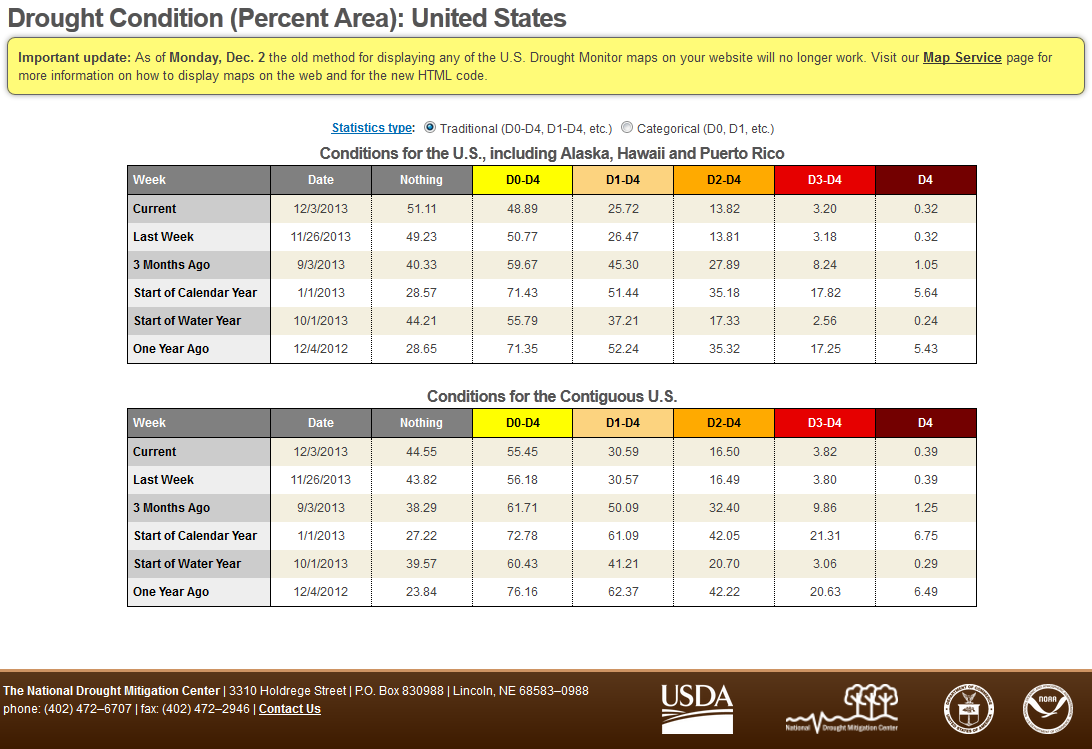
When integrated across the country, November ranked near the middle of the historical record at 51st driest. But the monthly dryness along the West Coast to Northern Plains gave eight states a November precipitation rank in their driest third of the historical record, with Wyoming ranking eleventh driest. Michigan ranked in the top ten wettest category, with nine others (most in the Southwest or Southeast) in the wettest third, most of which would have been dry if not for the end-of-month storm system. Not only did that weather system save many southern and eastern states from a dry November, it also helped reduce drought or abnormally dry conditions for the country. Drought contracted in all regions except the Northeast, where it expanded, and the Southeast, where it was introduced this month. The national drought footprint shrank to 25.7 percent of the U.S. as a whole (according to U.S. Drought Monitor statistics).
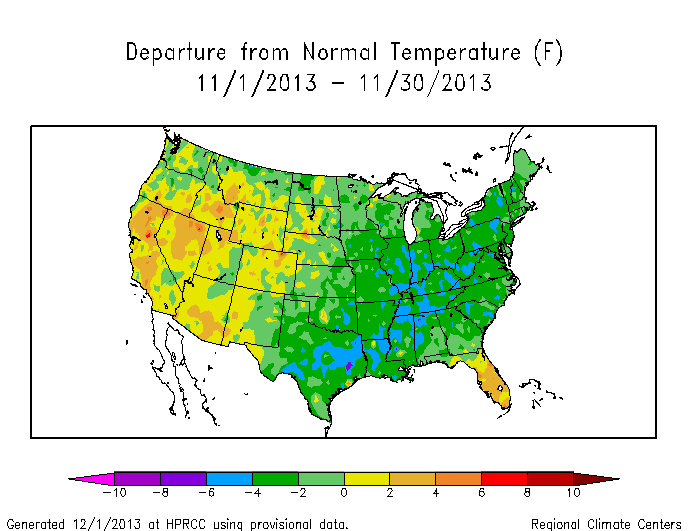
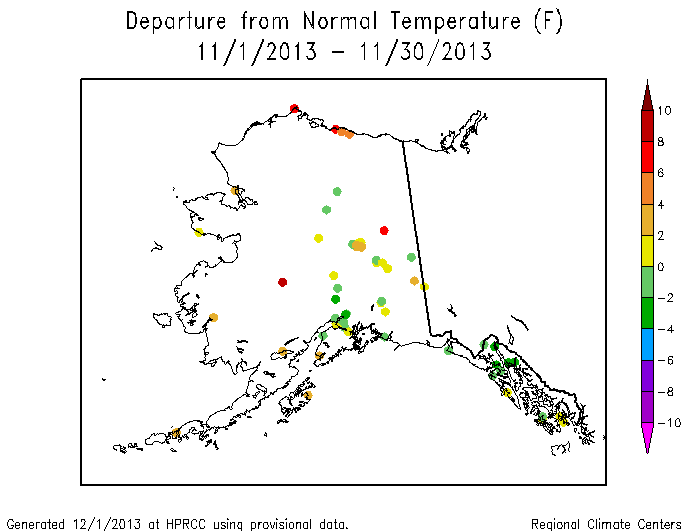
Map of monthly temperature anomalies.
As the troughs in the upper-level circulation moved across the country, they dragged cold fronts along with them. These fronts spread colder-than-normal air into the U.S. east of the Rockies, with many of the fronts reaching as far south as Florida and into Mexico. This was especially the case during the last week of the month (weeks 1, 2, 3, 4). Warm, southerly air masses, associated with upper-level ridges, followed the troughs and cold fronts. When integrated across the month, November 2013 averaged colder than normal from the Plains to the East Coast, warmer than normal for much of Florida and parts of the West, and had a mixed temperature anomaly pattern in Alaska.
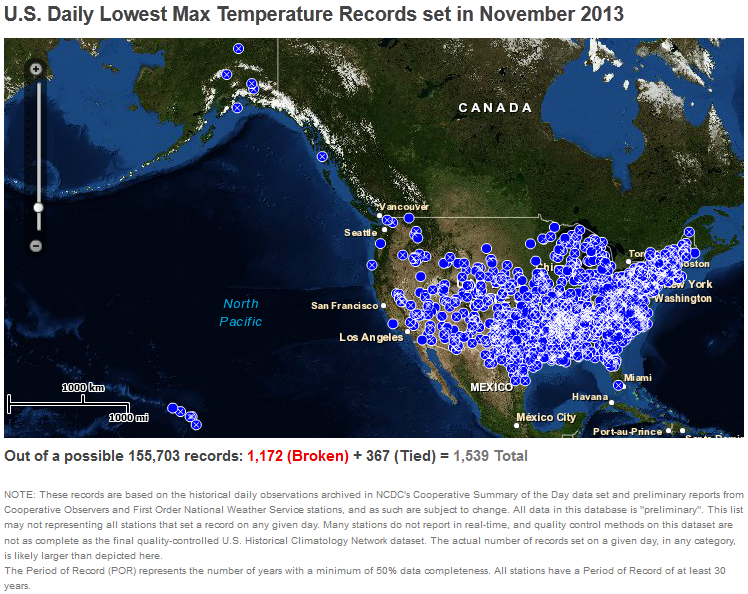
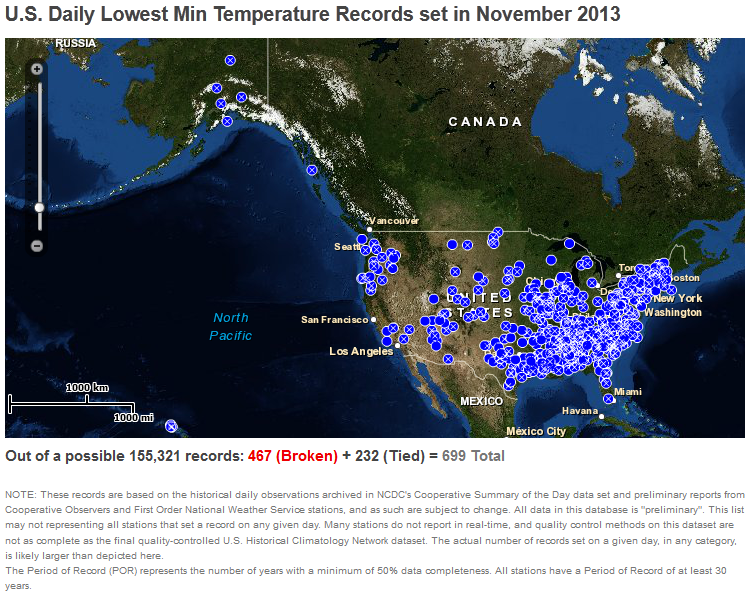
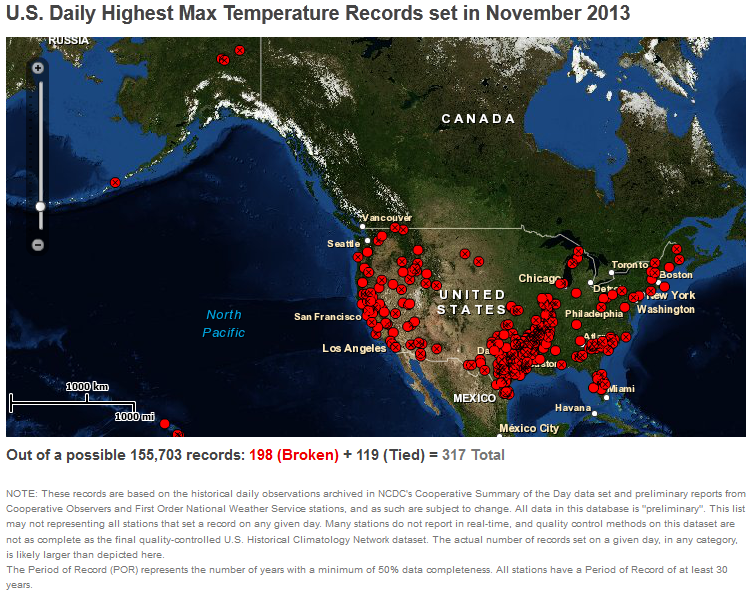
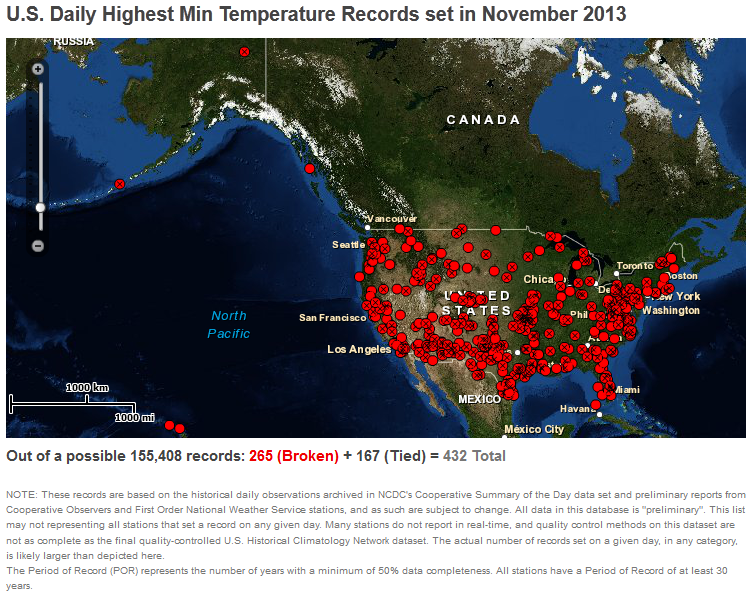
When integrated across the country, November 2013 ranked as the 49th coldest November in the 1895-2013 record. Twenty-seven states, all east of the Rockies, ranked in the coldest third of the historical record, while four states (Florida, California, Nevada, and Arizona) had November temperatures in the warmest third of the historical record. There were nearly three times as many record cold daily highs (1539) and lows (699, or a total of 2238) as record warm daily highs (317) and lows (432, or a total of 749).
Monthly upper-level circulation pattern and anomalies.
The upper-level circulation was generally westerly with many wiggles, or troughs and ridges, and an occasional cutoff low, migrating through the flow. When integrated across the month, the circulation produced a pattern of above-normal 500-mb heights (stronger-than-normal long-wave ridge) over the Gulf of Alaska in the northeast Pacific, along the west coast of North America, and into the CONUS as far as the Central Plains. Below-normal 500-mb heights (stronger-than-normal long-wave trough) dominated the eastern half of Canada and into the Great Lakes and Northeast of the CONUS. The slow-moving cutoff low near the end of the month appears as a trough with below-normal heights off the coast of Baja California.
Subtropical highs, and cold fronts and low pressure systems moving in the storm track flow, are influenced by the broadscale atmospheric circulation. The following describes several such large-scale atmospheric circulation drivers and their potential influence this month:
-
El Niño Southern Oscillation (ENSO)
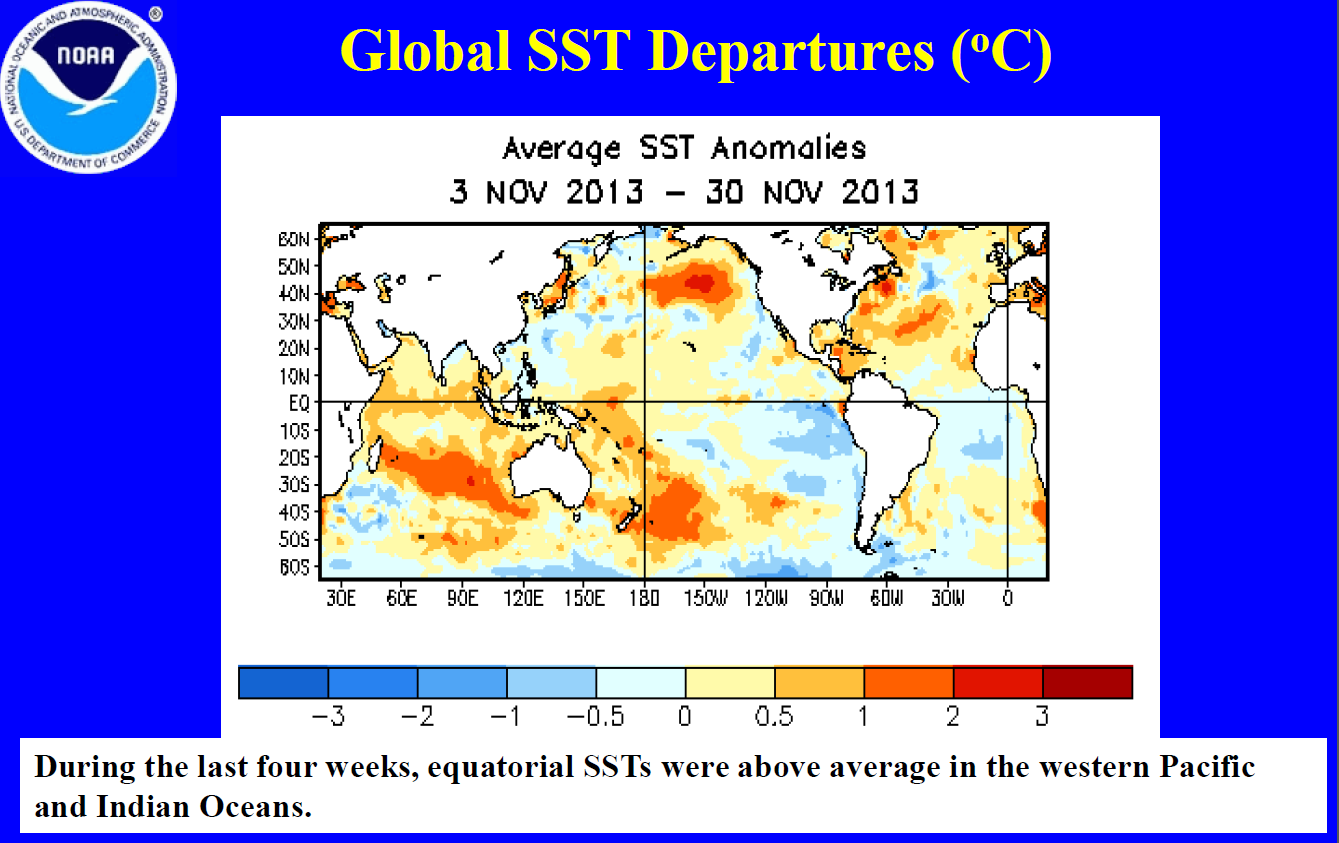
- Description: Oceanic and atmospheric conditions in the tropical Pacific Ocean can influence weather across the globe. ENSO is characterized by two extreme modes: El Niño (warmer-than-normal sea surface temperature [SST] anomalies in the tropical Pacific) and La Niña (cooler-than-normal SST anomalies), with the absence of either of these modes termed "ENSO-neutral" conditions.
- Status: Ocean temperatures and atmospheric circulation anomalies indicated that the equatorial Pacific continued in an ENSO-neutral state during November.
- Teleconnections (influence on weather): To the extent teleconnections are known, while in a neutral state, ENSO normally is not a player in the month's weather. Historical data has been analyzed by NOAA to show typical temperature and precipitation patterns associated with El Niño and La Niña ENSO episodes. Teleconnections are not available for ENSO-neutral conditions at that NOAA web site.
-
Madden-Julian Oscillation (MJO)
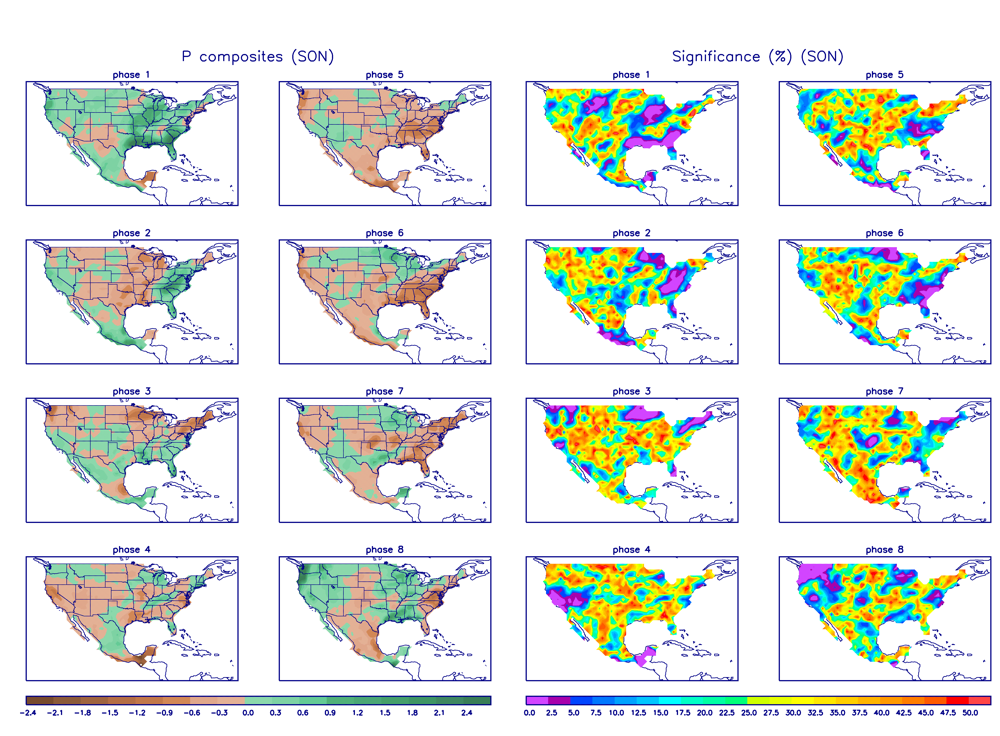
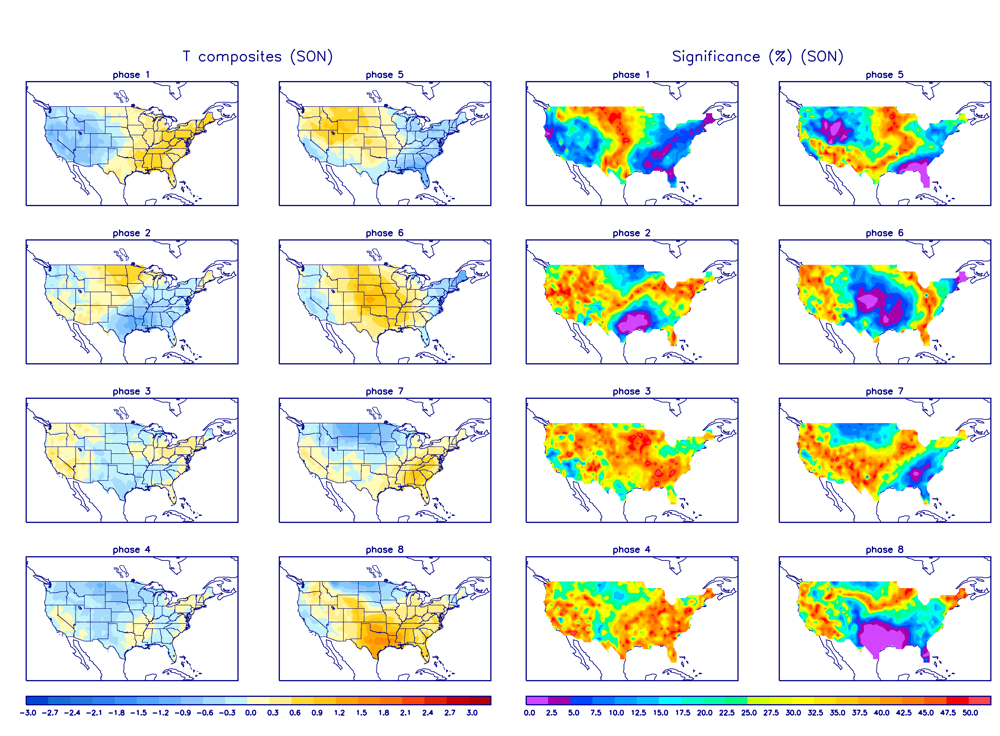
- Description: The MJO is a tropical disturbance or "wave" that propagates eastward around the global tropics with a cycle on the order of 30-60 days. It is characterized by regions of enhanced and suppressed tropical rainfall. One of its indices is a phase diagram which illustrates the phase (1-8) and amplitude of the MJO on a daily basis. The MJO is categorized into eight "phases" depending on the pattern of the location and intensity of the regions of enhanced and suppressed tropical rainfall. The MJO can enter periods of little or no activity, when it becomes neutral or incoherent and has little influence on the weather. Overall, the MJO tends to be most active during ENSO-neutral years, and is often absent during moderate-to-strong El Niño and La Niña episodes.
- Status:The MJO began the month weakly in phase 1, stayed in phase 1 for about a week, then became incoherent for the rest of the month. When the MJO was incoherent, other modes of convective variability in the tropics, such as Kelvin and Rossby waves, exerted some influence (as indicated by the MJO discussions for November 4, 11, 18, 25, December 2).
- Teleconnections (influence on weather): The MJO's temperature and precipitation teleconnections to U.S. weather depend on time of year and MJO phase. To the extent teleconnections are known, the September-November teleconnections for precipitation are shown here and for temperature are shown here.
- Comparison to Observed: The MJO is transitory and can change phases (modes) within a month, so it is more closely related to weekly weather patterns than monthly. The November 2013 monthly temperature and precipitation anomaly patterns do not match the teleconnections for MJO phase 1. However, the temperature and precipitation anomaly patterns for October 27-November 2 are a reasonable match for MJO phase 1.
- The Pacific/North American (PNA) pattern
- Description: The PNA teleconnection pattern is associated with strong fluctuations in the strength and location of the East Asian jet stream. PNA-related blocking of the jet stream flow in the Pacific can affect weather downstream over North America, especially the West and especially in the winter half of the year.
- Status: The daily PNA index started the month near zero, became negative by mid-month, then ended the month near zero again (neutral), averaging negative for the month as a whole.
- Teleconnections (influence on weather): To the extent teleconnections are known, the temperature teleconnection map for a negative PNA at this time of year (October on the maps) shows below-normal temperatures along the West Coast, Alaska, and western Canada and above-normal temperatures in the Southeast, with near-normal temperatures in between. The precipitation teleconnection map for this time of year (October on the maps) shows a hint of wetter-than-normal conditions in the Great Lakes to Ohio Valley. The upper-level circulation anomaly teleconnection for a negative PNA shows below-normal heights over the western half of Canada and the western U.S. and above-normal heights over the southeastern United States.
- Comparison to Observed: The November 2013 temperature, precipitation, and upper-level circulation anomaly patterns are not consistent with a negative PNA.
- The Arctic Oscillation (AO) pattern
- Description: The AO teleconnection pattern relates upper-level circulation over the Arctic to circulation features over the Northern Hemisphere mid-latitudes and is most active during the cold season.
- Status: The daily AO index was strongly positive for the first half of November, then dipped to near zero during the second half before ending the month positive, averaging positive for the month.
- Teleconnections (influence on weather): To the extent teleconnections are known, a positive AO this time of year (September-November) is typically associated with dryness from much of the Northern Plains to the Northeast and Southern Plains to Ohio Valley, above-normal temperatures in the north central U.S., and upper-level circulation anomalies which are below normal over Alaska and above normal from the central U.S. to eastern Canada.
- Comparison to Observed: The November 2013 temperature and upper-level circulation anomaly patterns are not consistent with a positive AO. The precipitation anomaly pattern agrees in northern California and the Northern Plains, but generally not anywhere else.
- The North Atlantic Oscillation (NAO) pattern
- Description: The NAO teleconnection pattern relates upper-level circulation over the North Atlantic Ocean to circulation features over the Northern Hemisphere mid-latitudes.
- Status: The daily NAO index was near zero for most of the month, except positive at mid-month, and averaged positive for the month.
- Teleconnections (influence on weather): To the extent teleconnections are known, a positive NAO during this time of year (October on the teleconnection maps) has little correlation with temperature, is weakly associated with wetter-than-normal conditions in the Ohio Valley, and is associated with positive upper-level circulation anomalies over the eastern half of the country.
- Comparison to Observed: The November 2013 temperature, precipitation, and upper-level circulation anomaly patterns show little resemblance to a positive NAO.
- The West Pacific (WP) pattern
- Description: The WP teleconnection pattern is a primary mode of low-frequency variability over the North Pacific and reflects zonal and meridional variations in the location and intensity of the (East Asian) jet stream in the western Pacific.
- Status: The monthly WP index was near zero for the month, as was the three-month average WP index.
- Teleconnections (influence on weather): To the extent teleconnections are known, the teleconnections for a positive or negative WP for temperature, precipitation, and upper-level circulation are defined at the NOAA website, but the teleconnections for a neutral (near zero) WP are not defined.
- The East Pacific-North Pacific (EP-NP) pattern
- Description: The EP-NP teleconnection pattern relates SST and upper-level circulation patterns over the eastern and northern Pacific to temperature, precipitation, and circulation anomalies downstream over North America. Its influence during the winter is not as strong as during the other three seasons.
- Status: The SST pattern over the northeastern North Pacific during November 2013 saw an expansion and intensification of the large pool of warmer-than-normal SSTs and the reduction of cooler-than-normal SSTs near the coast. The monthly EP-NP index was positive again for November, pulling the 3-month running mean back into positive territory.
- Teleconnections (influence on weather): To the extent these teleconnections are known, a positive EP-NP index during this time of year (October on the maps) is typically associated with cooler-than-normal temperatures across the U.S. east of the Rockies, warmer-than-normal temperatures along the immediate West Coast and in Alaska, drier-than-normal conditions in the Northwest, above-normal precipitation in southern Alaska, below-normal upper-level circulation anomalies (stronger upper-level trough) over the eastern half of North America, and above-normal upper-level circulation anomalies (stronger upper-level ridge) over western Canada and Alaska.
- Comparison to Observed: The November 2013 temperature and precipitation anomaly patterns are a close match for the CONUS and partly consistent for precipitation in Alaska. The upper-level circulation anomaly patterns are also a close match, but with the positive upper-level height anomalies extending a little further into the central U.S., shifting the negative height anomalies a little northward.
Examination of these circulation indices and their teleconnection patterns, and comparison to observed November 2013 temperature, precipitation, and circulation patterns, suggest that the North Pacific atmospheric driver had the greatest influence on November weather. ENSO was neutral, and thus not a player; the MJO was incoherent for much of the month; the WP was neutral; and the AO, NAO, and PNA did not seem to be influential. The EP-NP North Pacific driver appeared to have a controlling influence on the circulation and temperature patterns in the CONUS. Precipitation is not as strongly correlated to any of the atmospheric drivers during the fall as it is during the winter, with random convective and synoptic processes playing a greater role in precipitation during November, but the EP-NP appeared to be influential in the dry pattern in the Pacific Northwest, and the MJO may have exerted influence in the Ohio Valley to Great Lakes at the very beginning of the month. This month illustrates how an atmospheric driver may influence some aspects of the weather while other aspects (such as precipitation) may be influenced by a combination of drivers and random atmospheric processes.