Note: This Synoptic Discussion describes recent weather events and climate anomalies in relation to the phenomena that cause the weather. These phenomena include the jet stream, fronts and low pressure systems that bring precipitation, high pressure systems that bring dry weather, and the mechanisms which control these features — such as El Niño, La Niña, and other oceanic and atmospheric drivers (PNA, NAO, AO, and others). The report may contain more technical language than other components of the State of the Climate series.
Synoptic Discussion
 |
 |
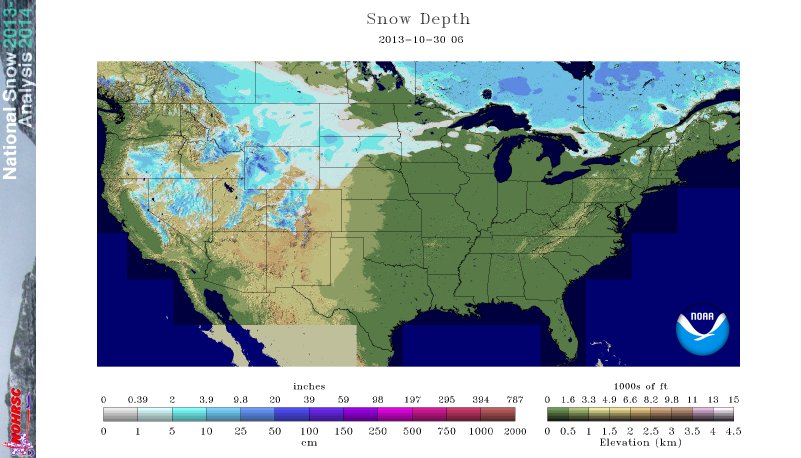
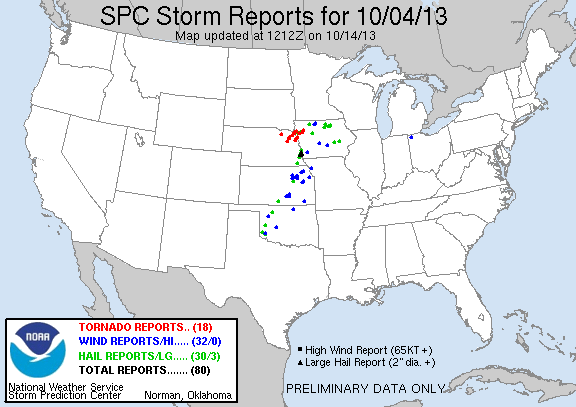
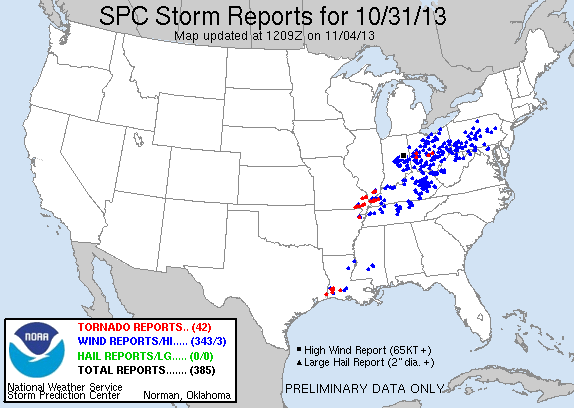
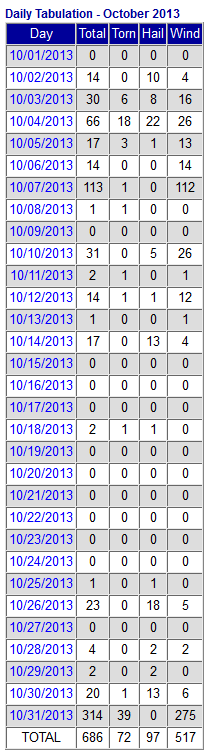
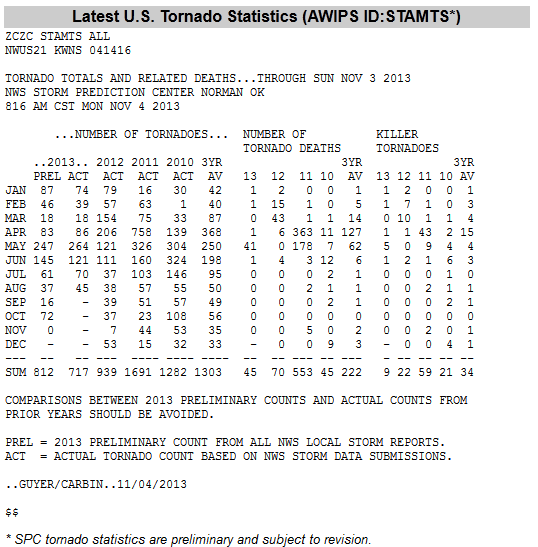
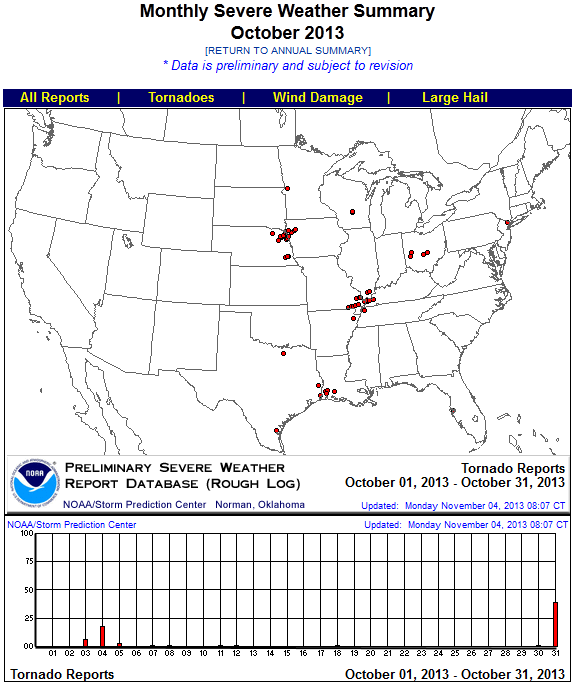
In the Northern Hemisphere, October marks the middle of climatological fall (autumn) which is the time of year when the active jet stream and circumpolar vortex expand south, spreading polar and arctic air masses from the north across the United States. For October 2013, the jet stream was very active with several upper-level troughs and closed lows bringing cool and wet weather to parts of the country. The lows generated significant winter snowstorms in the north central U.S. near the beginning and end of the month, with snow covering 18 percent of the country on the 30th. These lows and their associated cold fronts also triggered severe weather outbreaks, with the tornado outbreaks on the 4th and the 31st accounting for the bulk of the (preliminary estimated count of) 72 tornadoes for October 2013 (this compares to a climatological average count of 61 for October).
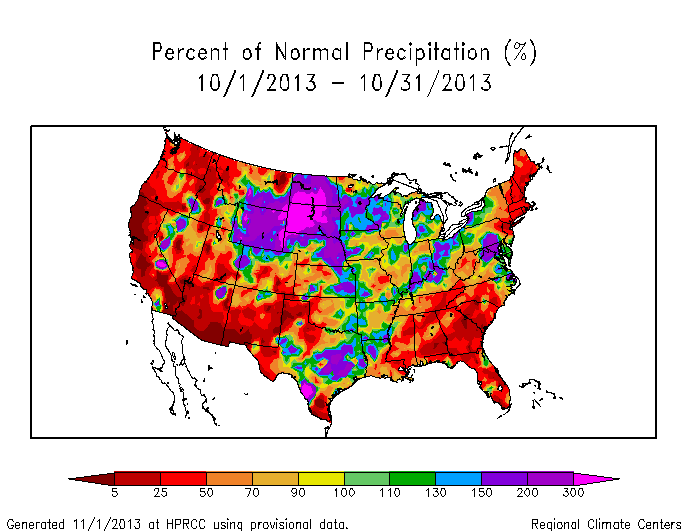
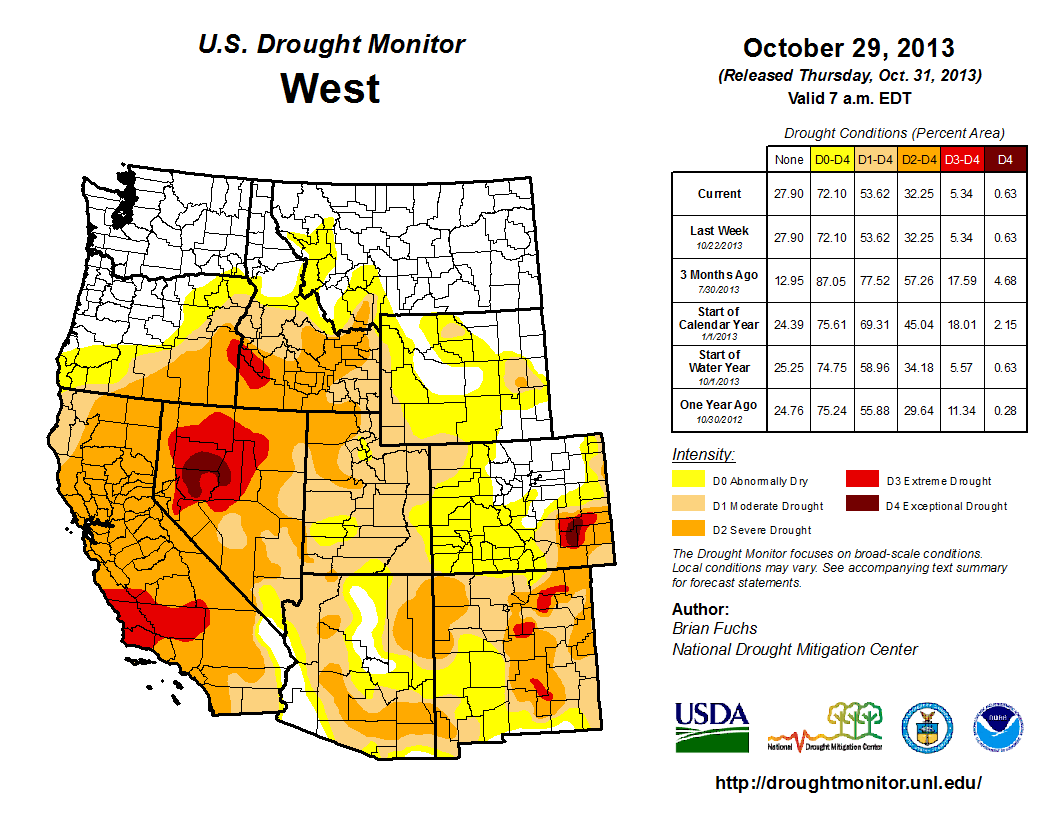
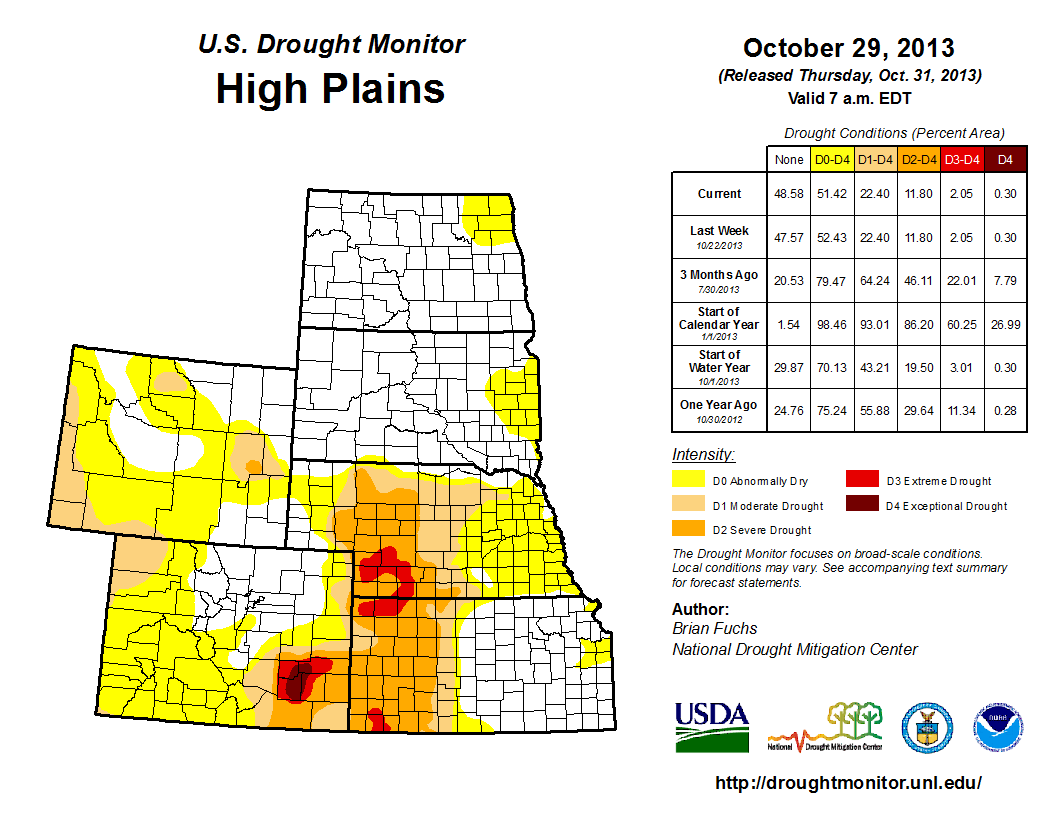
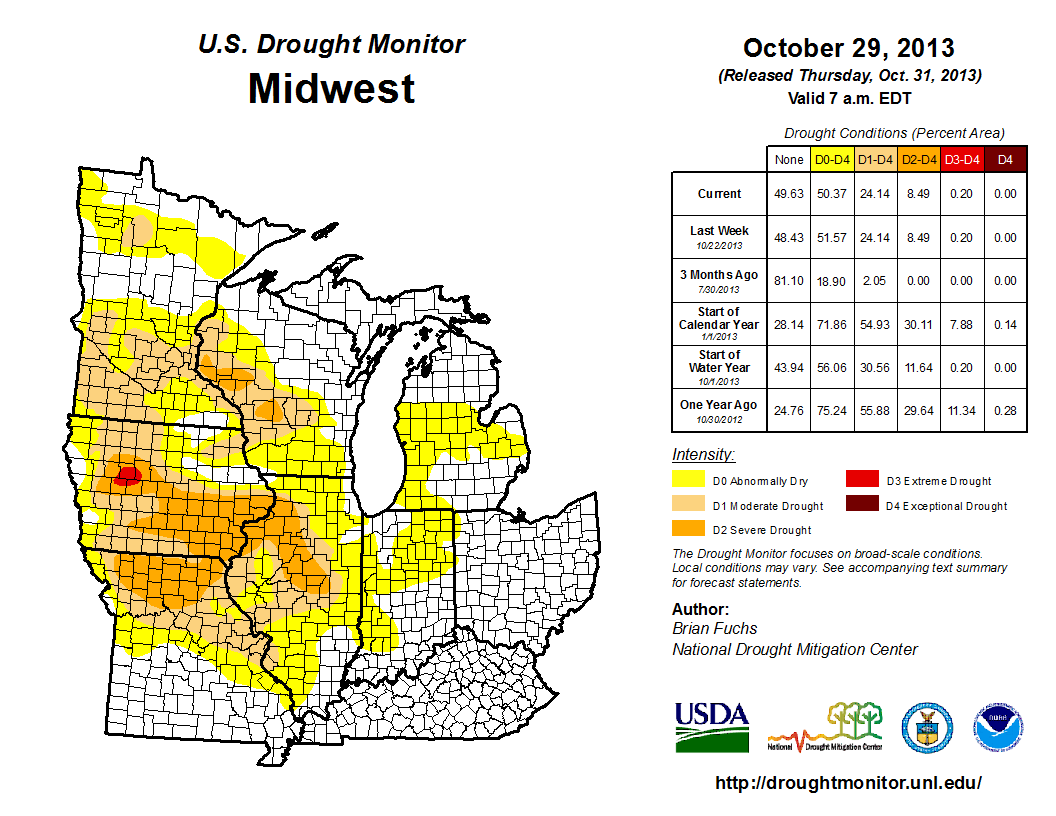
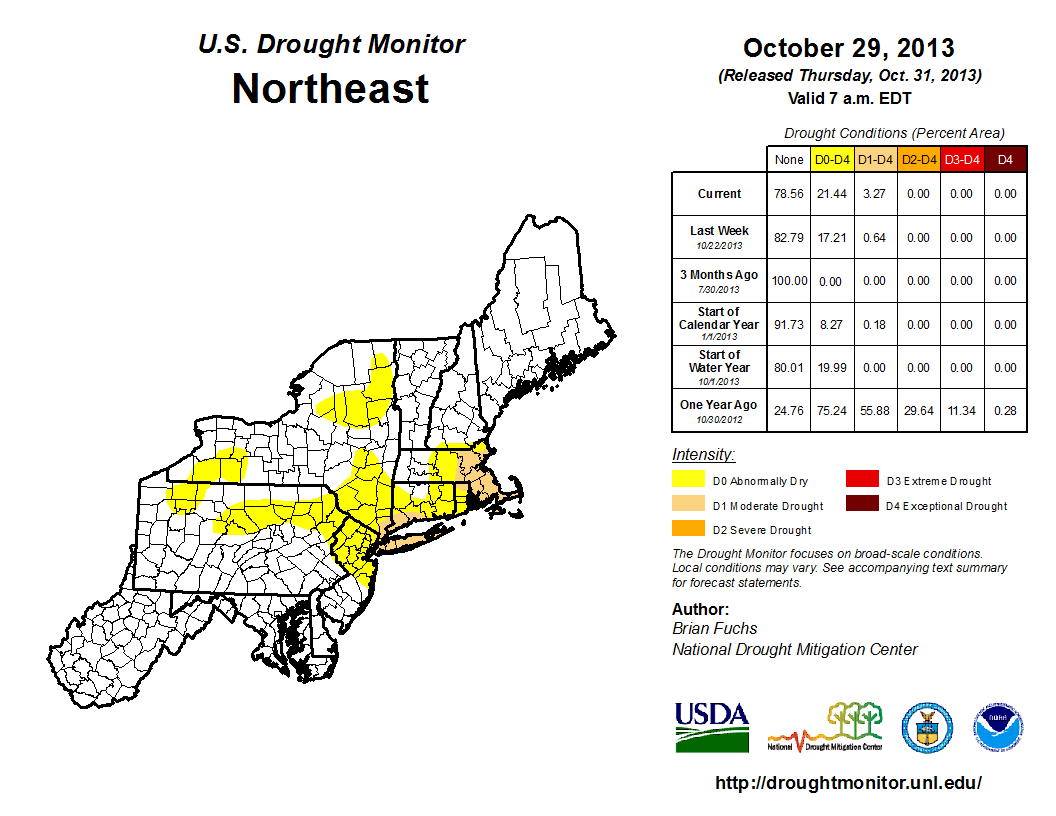
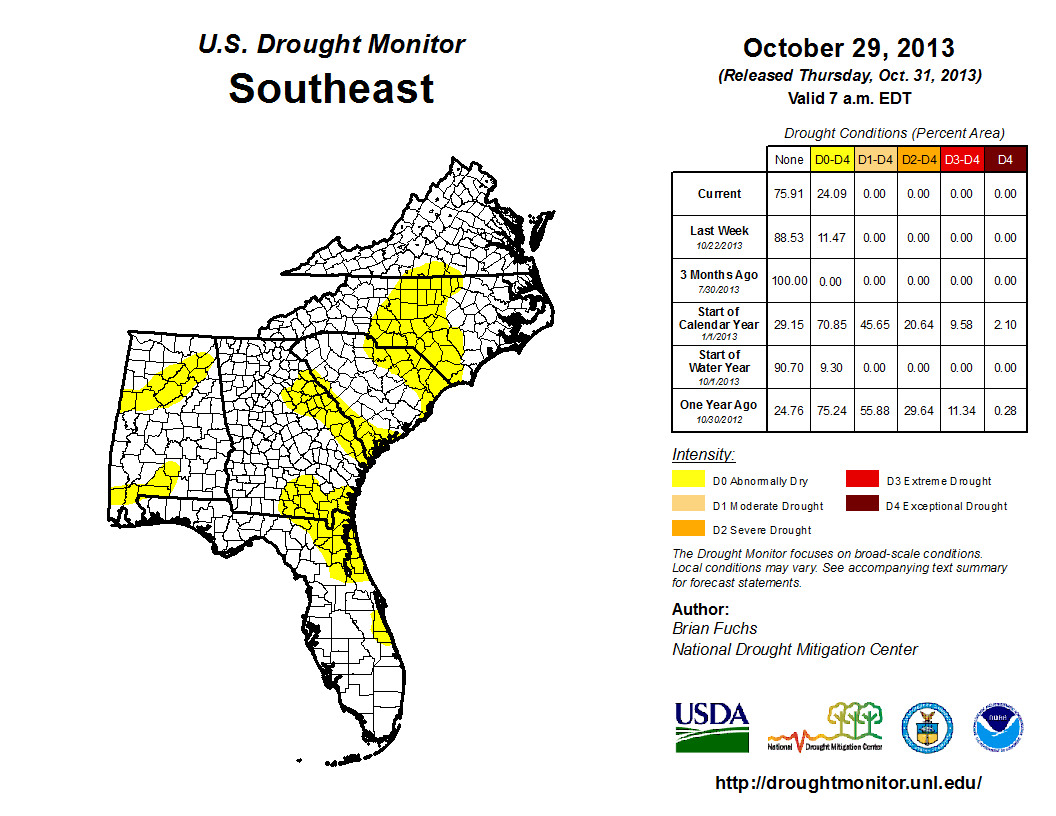
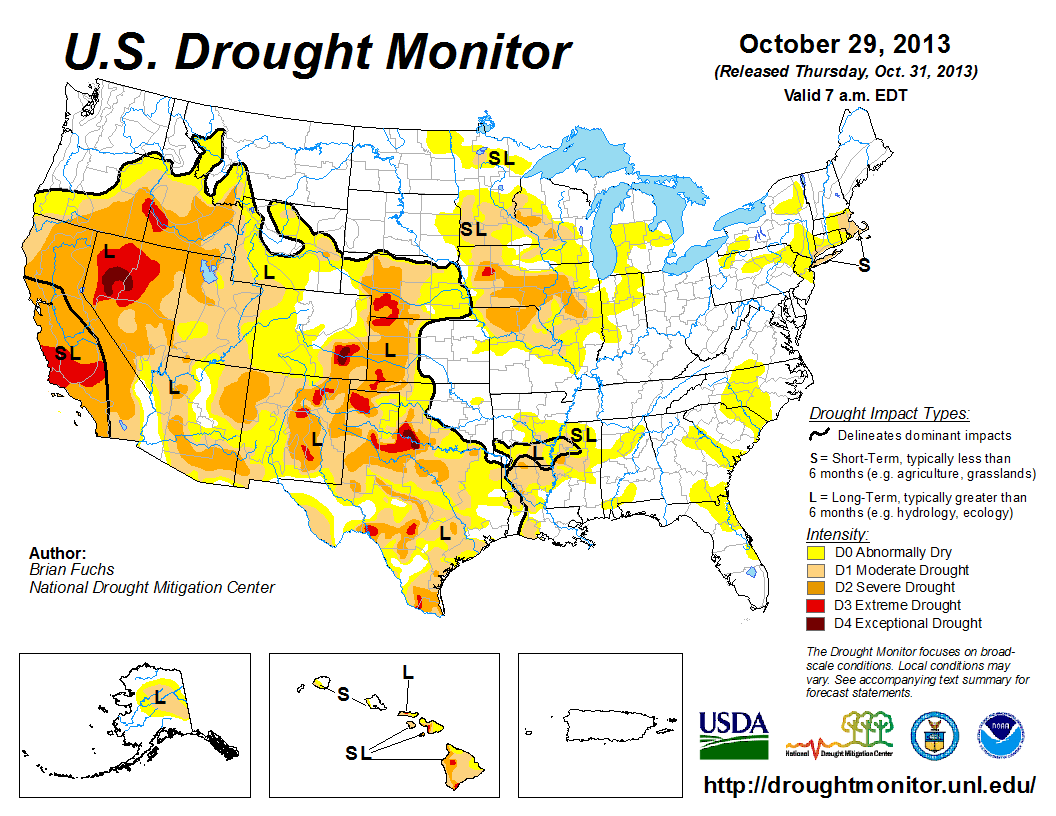
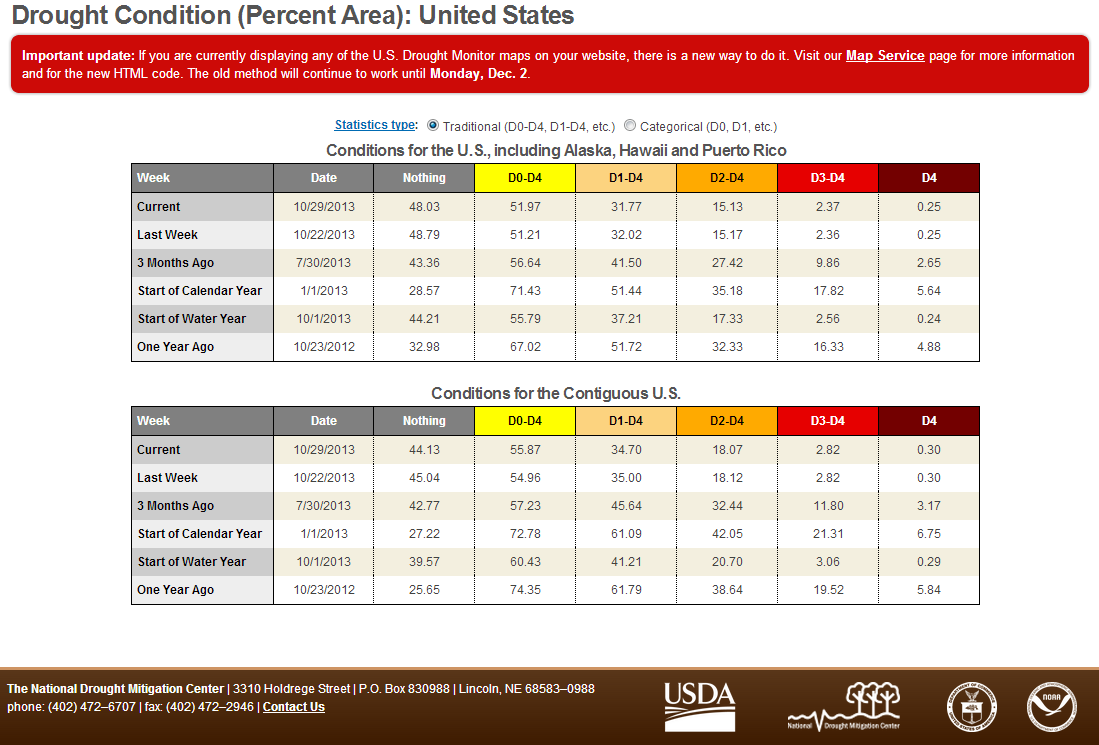
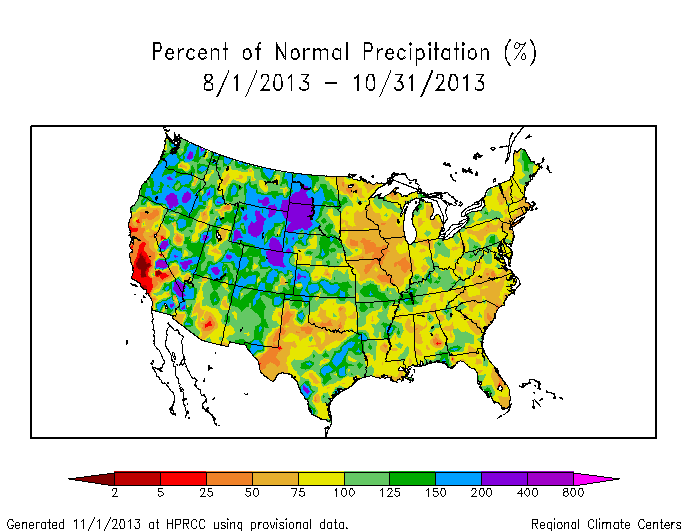
The snowstorm track (weeks 1, 2, 3, 4, 5) resulted in above-normal precipitation from the Central Rockies to Northern Plains during October, and precipitation was above normal from the Southern Plains to Midwest where the cold fronts tapped Gulf of Mexico moisture; but the northerly flow and polar air masses funneled drier-than-normal air to much of the western and central parts of the country, and the circulation kept moisture systems away from much of the East. Rhode Island and Massachusetts had the fourth and ninth driest, respectively, October in the 1895-2013 record, with several other states in the Northeast, West, and Southeast not far behind. On the other hand, four North Central states (Nebraska, North and South Dakota, and Wyoming) ranked in the top ten wettest category. When integrated across the country, October ranked near the middle of the historical record at 50th driest. The wet conditions in the Rockies and Plains helped reduce drought coverage in those regions. Drought also shrank in the Midwest, but moderate drought developed in the Northeast and abnormally dry conditions expanded in the Southeast. The national drought footprint shrank to 31.8 percent of the U.S. as a whole (according to U.S. Drought Monitor statistics). Tropical cyclone activity in the North Atlantic basin during October was near normal in terms of the number of named storms, but below normal with respect to the number of hurricanes, with none of the cyclones making landfall on the U.S. mainland. The frequent troughs and frontal passages produced upper-level wind shear in the vicinity of the U.S. which inhibited tropical cyclone activity.
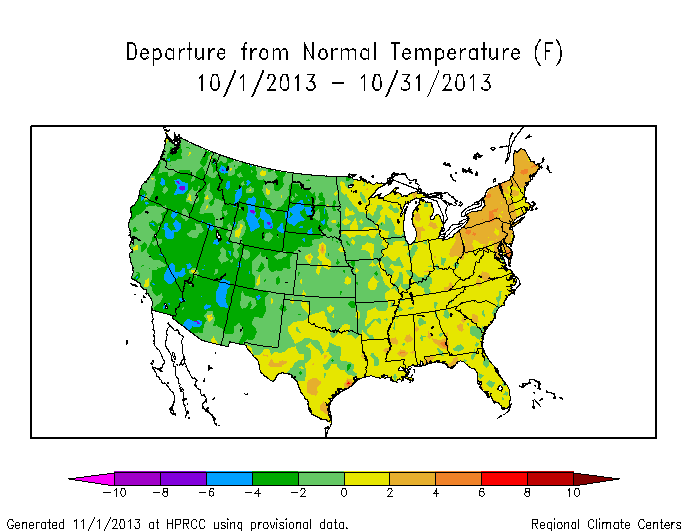
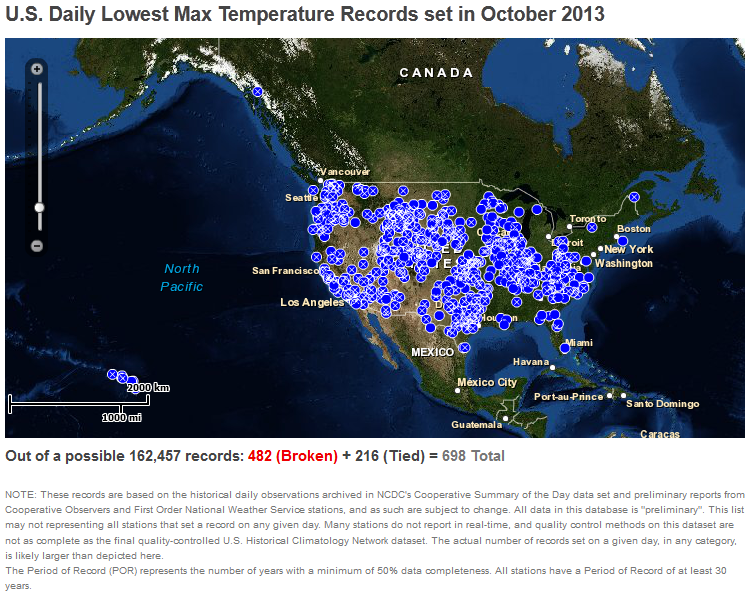
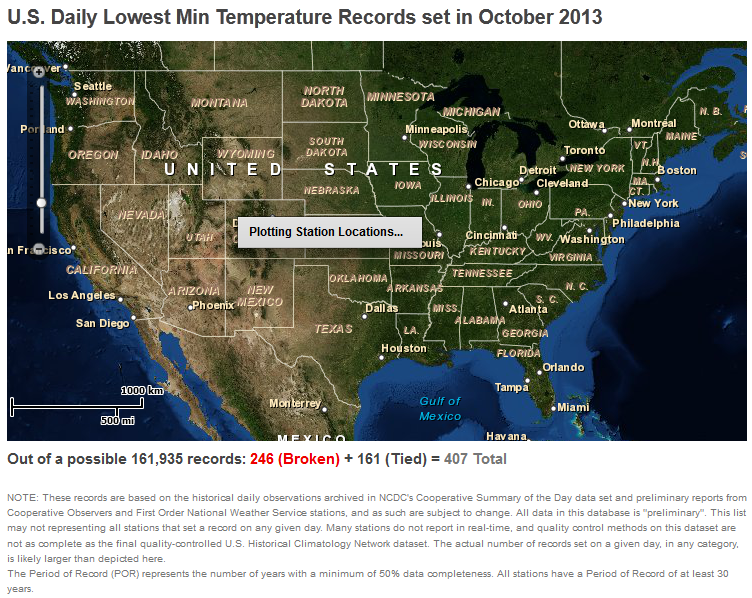
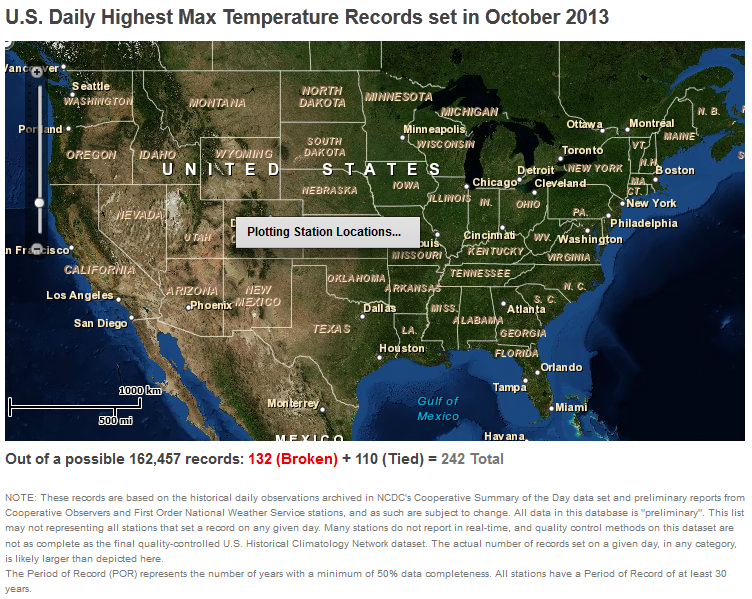
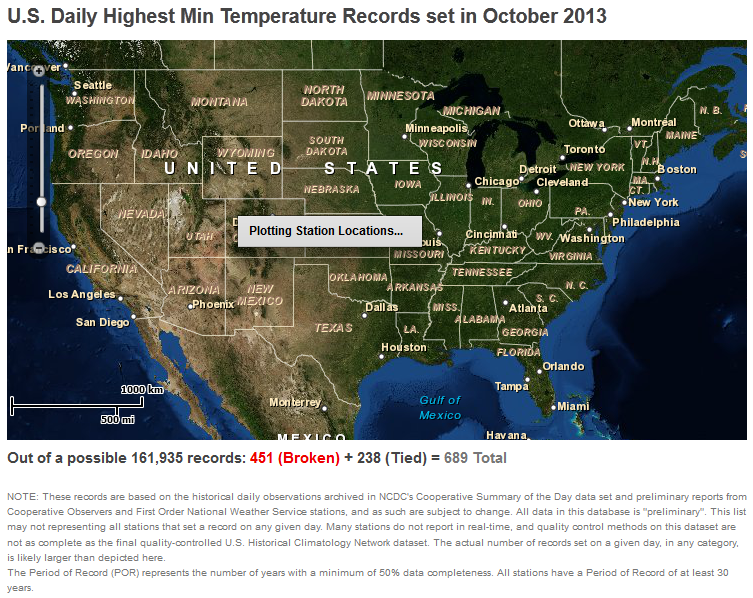
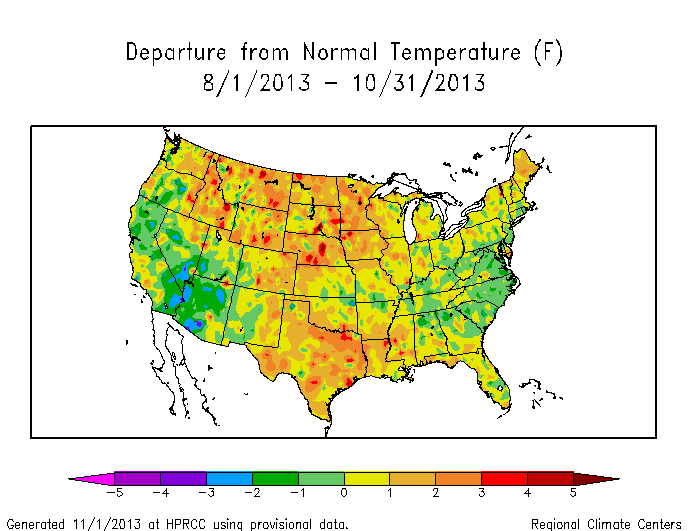
The troughs in the upper-level circulation favored the western and central U.S., with upper-level ridges dominating in the east for much of the month. The warm southerly flow associated with the ridge (and ahead of the cold fronts which eventually reached the region) resulted in above-normal temperatures most weeks (weeks 1, 2, 3, 4, 5). A shift in the circulation near the end of the month brought a warm ridge to the West and cool trough to the East, but for the month as a whole, temperatures averaged below normal in the West and Central regions and above normal in the East, especially the Northeast. Seventeen states in the West to Central U.S. had October temperatures in the coolest third of the historical record, with Oregon ranking eleventh coldest. Thirteen states in the East ranked in the warmest third of the historical record, with Delaware tenth warmest. There were slightly more (1.2 times as many) record cold daily highs (698) and lows (407, or a total of about 1100) as record warm daily highs (242) and lows (689, or a total of about 930). On balance for the nation as a whole, October ranked in the cool third of the historical record at 37th coolest.
Monthly upper-level circulation pattern and anomalies.
The upper-level circulation, integrated across the month, produced a pattern of above-normal 500-mb heights (stronger-than-normal ridge) over the northwest Pacific, Alaska, and western Canada, and below-normal 500-mb heights (stronger-than-normal trough) from the Southwest U.S. to south central Canada. This monthly pattern reflects the frequent occurrence of troughs and upper-level low pressure systems moving out of the Southwest U.S. into the Central to Northern Plains and is somewhat indicative of the Pacific drivers of the atmospheric circulation, as noted below.
Subtropical highs, and cold fronts and low pressure systems moving in the storm track flow, are influenced by the broadscale atmospheric circulation. The following describes several such large-scale atmospheric circulation drivers and their potential influence this month:
-
El Niño Southern Oscillation (ENSO)
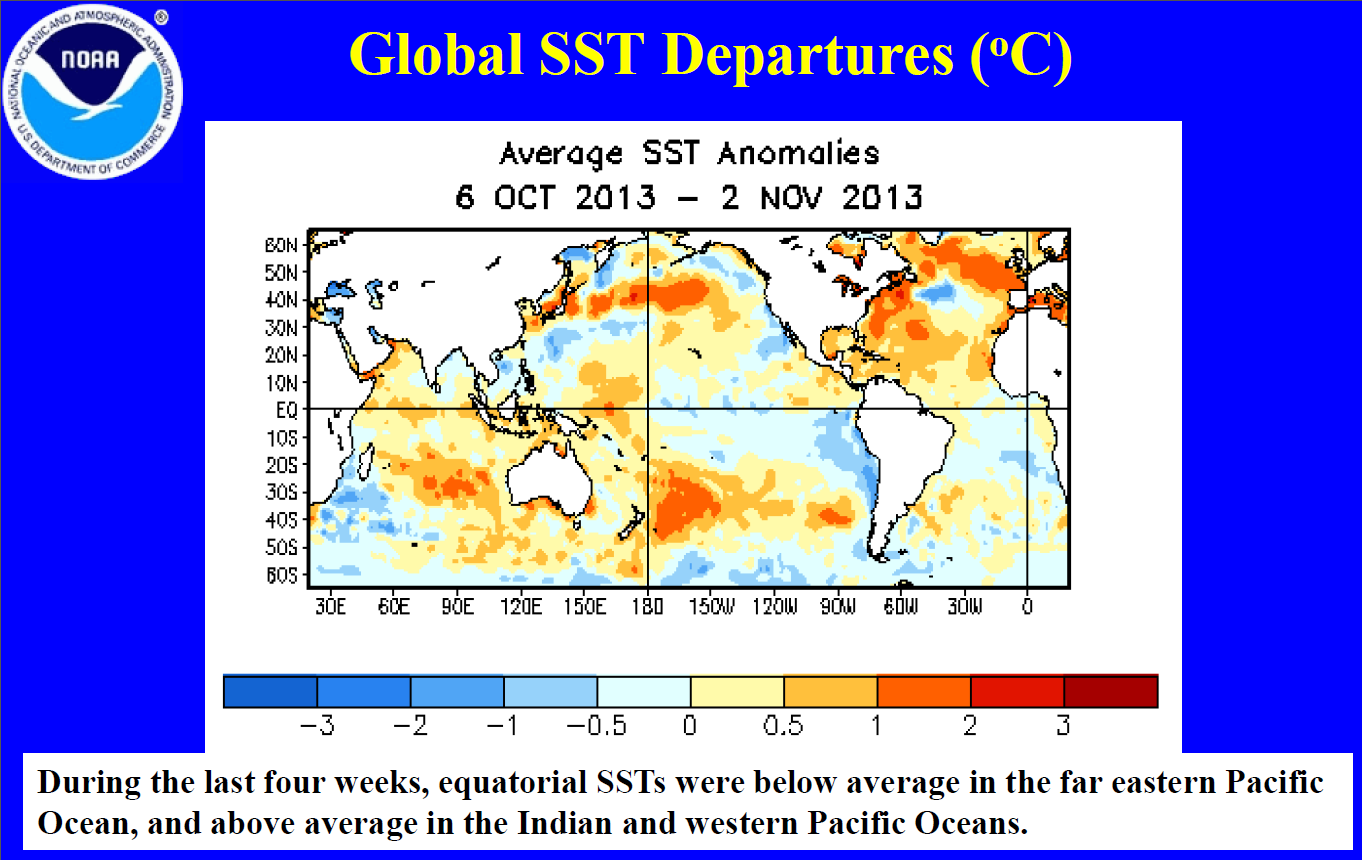
- Description: Oceanic and atmospheric conditions in the tropical Pacific Ocean can influence weather across the globe. ENSO is characterized by two extreme modes: El Niño (warmer-than-normal sea surface temperature [SST] anomalies in the tropical Pacific) and La Niña (cooler-than-normal SST anomalies), with the absence of either of these modes termed "ENSO-neutral" conditions.
- Status: Ocean temperatures and atmospheric circulation anomalies indicated that the equatorial Pacific continued in an ENSO-neutral state during October.
- Teleconnections (influence on weather): To the extent teleconnections are known, while in a neutral state, ENSO normally is not a player in the month's weather. Historical data has been analyzed by NOAA to show typical temperature and precipitation patterns associated with El Niño and La Niña ENSO episodes. Teleconnections are not available for ENSO-neutral conditions at that NOAA web site.
-
Madden-Julian Oscillation (MJO)
- Description: The MJO is a tropical disturbance or "wave" that propagates eastward around the global tropics with a cycle on the order of 30-60 days. It is characterized by regions of enhanced and suppressed tropical rainfall. One of its indices is a phase diagram which illustrates the phase (1-8) and amplitude of the MJO on a daily basis. The MJO is categorized into eight "phases" depending on the pattern of the location and intensity of the regions of enhanced and suppressed tropical rainfall. The MJO can enter periods of little or no activity, when it becomes neutral or incoherent and has little influence on the weather. Overall, the MJO tends to be most active during ENSO-neutral years, and is often absent during moderate-to-strong El Niño and La Niña episodes.
- Status:The MJO began the month weakly in phase 6, then became incoherent for most of the middle of the month, finally re-emerging weakly into phase 8 at the end of the month. When the MJO was incoherent, other modes of convective variability in the tropics, such as Kelvin and Rossby waves, exerted some influence (as indicated by the MJO discussions for October 7, 14, 21, 28, November 4).
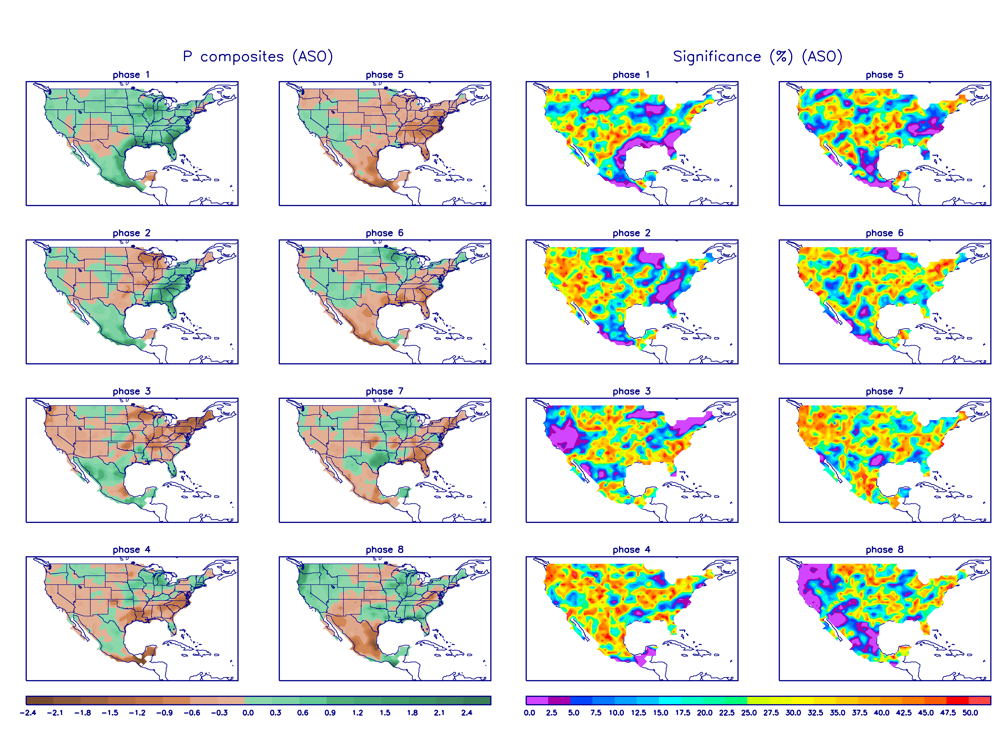
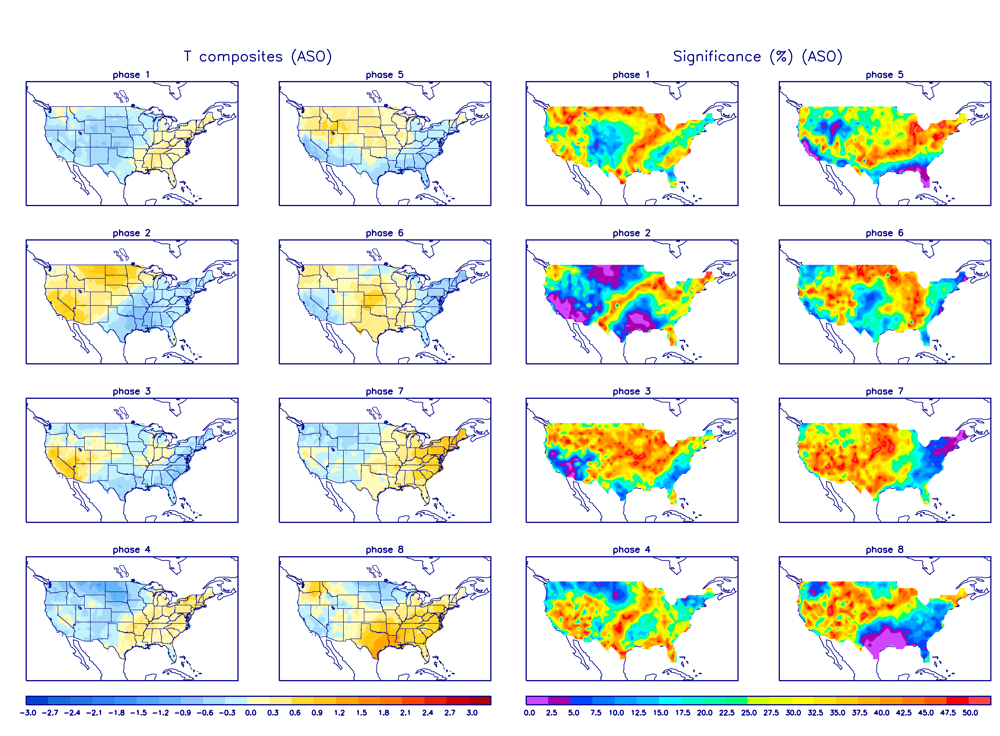
- Teleconnections (influence on weather): The MJO's temperature and precipitation teleconnections to U.S. weather depend on time of year and MJO phase. To the extent teleconnections are known, the August-October teleconnections for precipitation are shown here and for temperature are shown here.
- Observed: The MJO is transitory and can change phases (modes) within a month, so it is more closely related to weekly weather patterns than monthly. The October 2013 monthly precipitation pattern shows some correlation to the precipitation teleconnection pattern for MJO phase 6 this time of year in the East, but little agreement with phase 8. The weekly precipitation anomalies (weeks 1, 2, 3, 4, 5) show some agreement for week 1 to phase 6 but not for the other weeks. The October 2013 monthly temperature pattern shows little similarity to the teleconnections for MJO phase 6 (which is where it resided for the first third of the month) but has some similarity to MJO phase 8 (where it was for just a couple days at the end of October). No consistency can be seen on a weekly basis (weeks 1, 2, 3, 4, 5).
- The Pacific/North American (PNA) pattern
- Description: The PNA teleconnection pattern is associated with strong fluctuations in the strength and location of the East Asian jet stream. PNA-related blocking of the jet stream flow in the Pacific can affect weather downstream over North America, especially the West and especially in the winter half of the year.
- Status: The daily PNA index started the month negative, then slowly transitioned to positive before ending October near zero (neutral), averaging negative for the month as a whole.
- Teleconnections (influence on weather): To the extent teleconnections are known, the temperature teleconnection map for this time of year (October on the maps) shows below-normal temperatures along the West Coast, Alaska, and western Canada and above-normal temperatures in the Southeast with a negative PNA, with near-normal temperatures in between. The precipitation teleconnection map for this time of year (October on the maps) shows a hint of wetter-than-normal conditions in the Great Lakes to Ohio Valley. The upper-level circulation anomaly teleconnection shows below-normal heights over the western half of Canada and the western U.S. and above-normal heights over the southeastern U.S. with a negative PNA.
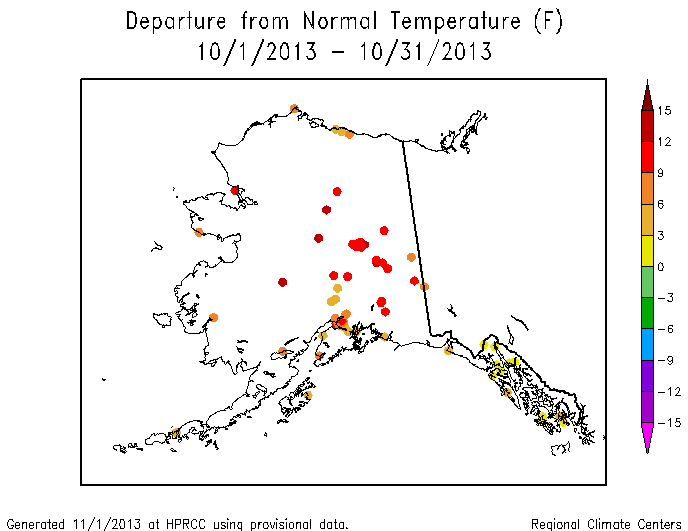
- Observed: The October 2013 temperature anomalies were cooler than normal along the western U.S. coast and warmer than normal in the Southeast, which is consistent with a negative PNA, but they were warmer than normal in Alaska, cooler than normal in the central U.S., and warmer than normal in the Northeast, which is not consistent with a negative PNA. The precipitation anomalies in the Great Lakes to Ohio Valley were mixed, which is not consistent with a negative PNA. The observed upper-level (500 mb) chart for October 2013 is not consistent with a negative PNA.
- The Arctic Oscillation (AO) pattern
- Description: The AO teleconnection pattern relates upper-level circulation over the Arctic to circulation features over the Northern Hemisphere mid-latitudes and is most active during the cold season.
- Status: The daily AO index oscillated around zero for most of the month before ending October strongly positive, averaging positive for the month.
- Teleconnections (influence on weather): To the extent teleconnections are known, a positive AO this time of year (August-October) is typically associated with wetness in the coastal Northwest and coastal Southeast, dryness from the Plains to the Northeast, above-normal temperatures in the north central U.S., and upper-level circulation anomalies which are below normal over Alaska and above normal from the central U.S. to eastern Canada.
- Observed: The October 2013 monthly temperature, precipitation, and upper-level circulation anomaly patterns were generally opposite those expected with a positive AO.
- The North Atlantic Oscillation (NAO) pattern
- Description: The NAO teleconnection pattern relates upper-level circulation over the North Atlantic Ocean to circulation features over the Northern Hemisphere mid-latitudes.
- Status: The daily NAO index was negative to near zero for most of the month, ending October slightly positive, and averaging negative for the month.
- Teleconnections (influence on weather): To the extent teleconnections are known, a negative NAO during this time of year (October on the teleconnection maps) has little correlation with temperature, is weakly associated with drier-than-normal conditions in the Ohio Valley, and is associated with negative upper-level circulation anomalies over the eastern half of the country.
- Observed: The October 2013 monthly temperature, precipitation, and upper-level circulation anomaly patterns are not consistent with those expected with a negative NAO.
- The West Pacific (WP) pattern
- Description: The WP teleconnection pattern is a primary mode of low-frequency variability over the North Pacific and reflects zonal and meridional variations in the location and intensity of the (East Asian) jet stream in the western Pacific.
- Status: The monthly WP index was near zero for the month, but the three-month average WP index was positive.
- Teleconnections (influence on weather): To the extent teleconnections are known, a positive WP during this time of year (October on the teleconnection maps) is associated with above-normal temperatures in the North Central U.S., drier-than-normal conditions in the Northwest, Great Lakes, and Southeast, and above-normal upper-level circulation anomalies over central North America. The teleconnections for a neutral (near zero) WP are not defined.
- Observed: The October 2013 monthly precipitation pattern is consistent with a positive WP in the Pacific Northwest and Southeast, but the temperature and upper-level circulation anomaly patterns are not.
- The East Pacific-North Pacific (EP-NP) pattern
- Description: The EP-NP teleconnection pattern relates SST and upper-level circulation patterns over the eastern and northern Pacific to temperature, precipitation, and circulation anomalies downstream over North America. Its influence during the winter is not as strong as during the other three seasons.
- Status: The tropical system that was Typhoon Wipha moved over the Aleutians and into the Bering Sea in mid-October, resulting in considerable mixing of the surface and subsurface waters in the northeastern North Pacific. Consequently, the SST pattern over the North Pacific during October 2013 saw a reduction of the large pool of warmer-than-normal SSTs and the re-emergence of cooler-than-normal SSTs near the coast. The monthly EP-NP index was positive for much of 2013, turned negative during August and September, pulling down the 3-month running mean into negative territory, but turned positive again during October.
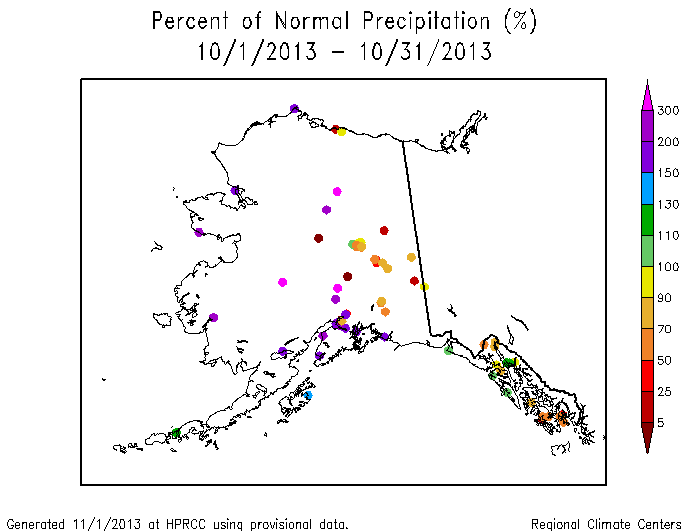
- Teleconnections (influence on weather): To the extent these teleconnections are known, a positive EP-NP index during this time of year (October on the maps) is typically associated with cooler-than-normal temperatures across the U.S. east of the Rockies, warmer-than-normal temperatures along the immediate West Coast and in Alaska, drier-than-normal conditions in the Northwest, above-normal precipitation in southern Alaska, below-normal upper-level circulation anomalies (stronger upper-level trough) over the eastern half of North America, and above-normal upper-level circulation anomalies (stronger upper-level ridge) over western Canada and Alaska.
- Observed: The October monthly temperature anomalies for Alaska and the central U.S. are consistent with a positive EP-NP, but they are inconsistent in the West and East. The October precipitation anomalies for the Pacific Northwest and much of Alaska are consistent with a positive EP-NP. The October 2013 upper-level circulation anomaly pattern is consistent with a positive EP-NP over Alaska and western Canada, but the below-normal upper-level heights over the eastern U.S. seem shifted slightly westward toward the central United States.
 |
 |
Examination of these circulation indices and their teleconnection patterns, and comparison to observed October 2013 temperature, precipitation, and circulation patterns, suggest that the extra-tropical Pacific atmospheric drivers shared some influence on October weather. ENSO was neutral, and thus not a player; the MJO was incoherent for much of the month; and the AO and NAO did not seem to be influential. Those drivers associated with the extra-tropical Pacific (PNA, EP-NP, and WP) appeared to exert some influence on the precipitation pattern in the Pacific Northwest, Alaska (EP-NP), and Southeast (WP), and on the temperature pattern (PNA and EP-NP). The EP-NP seemed to have the strongest influence on the upper-level circulation, but that influence appeared to be tempered by other forces. For example, Typhoon Wipha recurved into the North Pacific, creating a ridge in the circulation over the eastern Pacific and Alaska which forced a trough downstream over central North America. This ridge contributed to record warm temperatures over Alaska and likely shifted the below-normal 500-mb height anomalies (normally associated with a positive EP-NP) westward. Precipitation is not as strongly correlated to any of the atmospheric drivers during the early fall as it is during the winter, with random convective and synoptic processes playing a greater role in precipitation during October, but it should be noted that the NAO and PNA had opposite influences on precipitation in the Ohio Valley. A negative NAO is associated with drier-than-normal conditions while a negative PNA is associated with wetter-than-normal conditions. These two opposing drivers could have contributed to the mixed precipitation anomaly pattern in the Ohio Valley. This month illustrates how competing atmospheric drivers may work in phase in some regions, against each other in others, and be influenced by random atmospheric processes, to create a complex weather pattern.