Note: This Synoptic Discussion describes recent weather events and climate anomalies in relation to the phenomena that cause the weather. These phenomena include the jet stream, fronts and low pressure systems that bring precipitation, high pressure systems that bring dry weather, and the mechanisms which control these features — such as El Niño, La Niña, and other oceanic and atmospheric drivers (PNA, NAO, AO, and others). The report may contain more technical language than other components of the State of the Climate series.
Synoptic Discussion

Upper-level circulation pattern and anomalies averaged for July 2012.
The  weather pattern over North America in July 2012 was dominated by subtropical high pressure (High, or upper-level ridge) associated with the Bermuda High. Cool fronts occasionally penetrated the High, but the main storm track stayed far to the north. Although the cool fronts triggered areas of thundershowers and locally heavy rainfall, mainly along the periphery of the High, descending air ("subsidence") associated with the High played the dominant role in this month's weather — generally inhibiting precipitation from the cool fronts and stopping the formation of most convective showers that are normally triggered by afternoon heating from the sun. The subsidence also contributed to much above-normal temperatures and a near-record low tornado count this month. The High's abnormal dryness and blistering heat brought about a continued expansion of drought across the country, especially from the Great Plains to the Ohio Valley, with devastating impact on crops and livestock. An active summer monsoon season brought above-normal rainfall to parts of the Southwest, but the West (and some areas east of the Rockies) was plagued by numerous large wildfires which resulted in the fourth largest wildfire month for July, nationally, in terms of acres burned.
The dominance of the High can be seen in the persistence of above-normal temperatures across much of the country, and below-normal precipitation in the central regions, in the weekly temperature (weeks 1, 2, 3, 4) and precipitation (weeks 1, 2, 3, 4) anomaly maps. The result of below-normal supply (precipitation) and above-normal demand (evapotranspiration due to above-normal temperatures) in the drought equation was an expanding area of severely dry drought conditions as measured by the weekly Palmer Crop Moisture Index (weeks 1, 2, 3, 4). By the time the month was over, July 2012 ended up with a rank of warmest and 28th driest July, nationally, in the 1895-2012 record.
Nearly seven times as many record warm highs and lows occurred than record cold highs and lows. About 4400 daily high temperature records and over 3600 record warm daily low temperatures were tied or broken. In comparison, about 320 record low temperatures and 880 record cool daily high temperatures were tied or broken. (These numbers are preliminary and are expected to increase as more data arrive.) On a statewide basis, 32 states had the tenth warmest, or warmer, July in the 118-year record, with Virginia ranking warmest on record. The unusual warmth occurred across the country and contributed to the third largest national Residential Energy Demand Temperature Index (REDTI) for July.
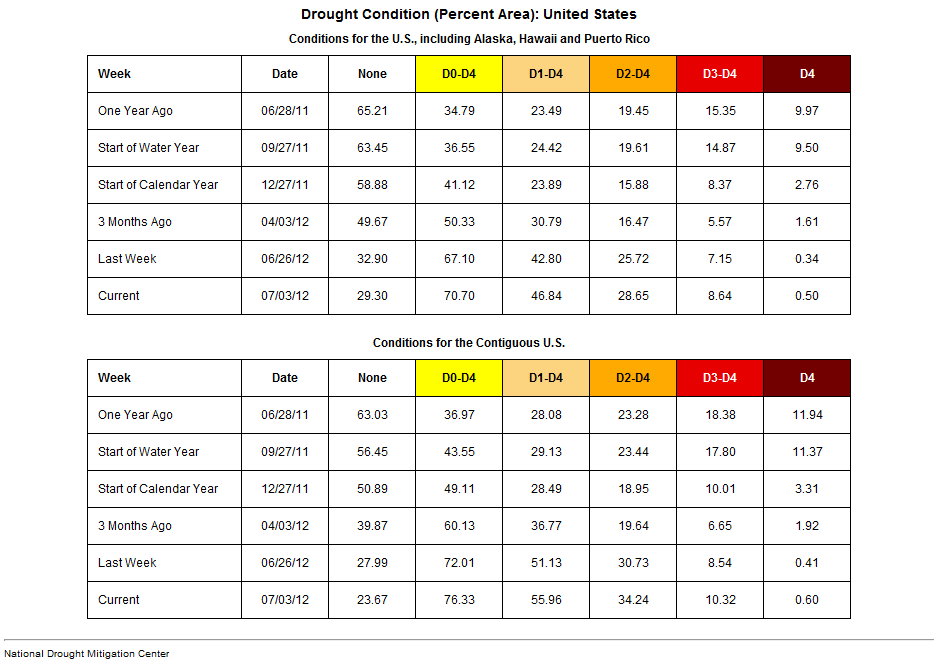
Above-normal precipitation fell along the eastern periphery of the High — from the western Gulf coast to the central Appalachians — where Gulf of Mexico moisture was entrained along cool fronts. Parts of the Southwest were wetter than normal where summer monsoon showers occurred along the western edge of the High. But the weather was predominantly dry beneath the core of the High. Four states (Nebraska [second driest], Iowa [third], Illinois [fourth], and Missouri [ninth]) had the tenth driest, or drier, July in the 1895-2012 record, with Kansas ranking twelfth driest. Maine also ranked in the top ten driest category. On the other hand, three states (California, Nevada, and West Virginia) ranked in the top ten wettest category. The combination of abnormally dry conditions and high evapotranspiration due to excessive heat resulted in an extensive area of severe to extreme short-term drought. Consequently, long-term drought conditions intensified in the Great Plains and Midwest and expanded nationwide (U.S. Drought Monitor for July 31st versus July 3rd, Palmer Drought Severity Index for July versus June). According to the July 31st U.S. Drought Monitor, moderate to exceptional drought grew to cover 63 percent of the contiguous United States, an increase of 7 percent compared to last month. However, the percent area of the country in the worst drought categories (extreme to exceptional drought) doubled, from 10 percent last month to 22 percent this month. According to the Palmer Drought Severity Index, whose record spans the 20th century, about 57 percent of the contiguous U.S. was experiencing moderate to extreme drought. The last time drought was this extensive was in December 1956 when about 58 percent was in moderate to extreme drought.
When averaged together, the mixture of temperature and precipitation extremes gave the U.S. (as noted above) the warmest and 28th driest July in the 118-year record. Averaging extremes tends to cancel them out. But when extremes are combined cumulatively, like in the U.S. Climate Extremes Index (CEI), they may tell a different story. The large spatial extent of unusually warm highs (largest), unusually warm lows (largest), very dry conditions (third largest), and extreme one-day precipitation (eighth largest) gave the U.S. its largest CEI for July, barely surpassing July 2011. All of the regions except the Northwest and West had July regional CEI values in the top ten category. The combination of persistent and unusual warmth and drought over the last several months have contributed to the highest national CEI for the last six months (February-July) and year-to-date (January-July), second highest for the last 12 months (August-July), and fourth highest for the last three months (May-July).
Subtropical highs, and cold fronts and low pressure systems moving in the storm track flow, are influenced by the broadscale atmospheric circulation. Five such large-scale atmospheric circulation drivers were potentially influential during July:
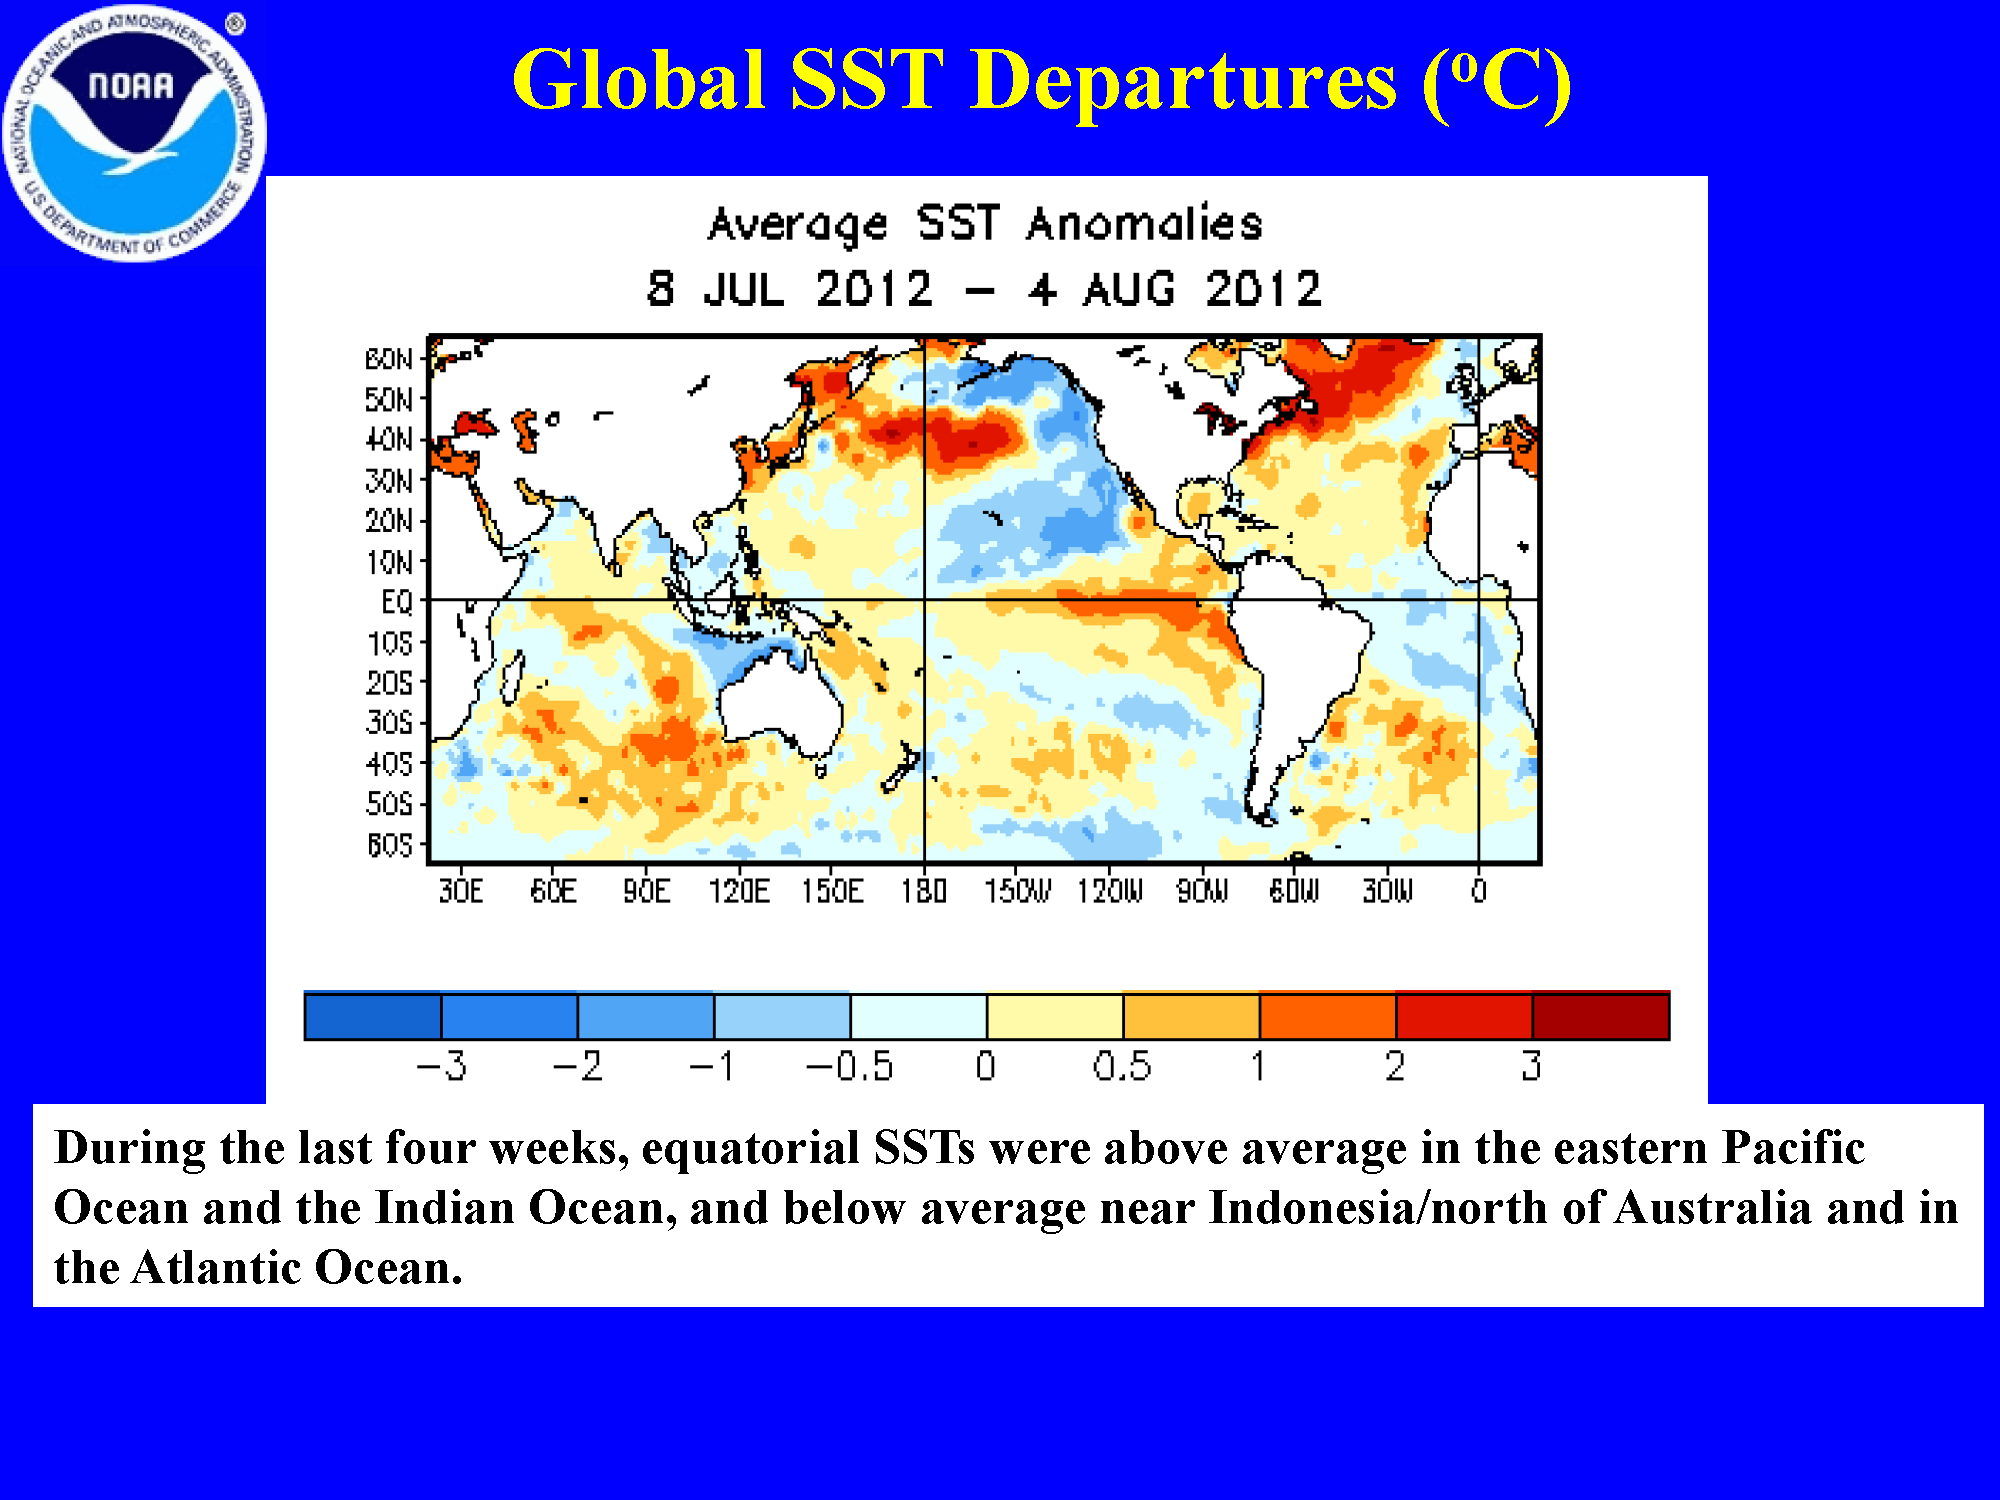
- Ocean temperatures and atmospheric circulation anomalies indicated that the equatorial Pacific continued in an ENSO-neutral state during July, although the equatorial Pacific sea surface temperatures continued to warm. While in a neutral state, ENSO normally is not a player in the month's weather. Historical data can be analyzed to show typical temperature and precipitation patterns associated with the ENSO episodes. For an El Niño, the typical May-July temperature and precipitation anomaly patterns do not match the temperature and precipitation anomaly patterns for May-July 2012. The typical May-July temperature and precipitation anomaly patterns for La Niña have a hint of a resemblance (warm interior U.S.; dry across much of the country) to the May-July 2012 temperature and precipitation anomaly patterns, possibly reflecting the last vestiges of La Niña early in the period.
- The Pacific/North American (PNA) pattern hovered near neutral for most of the month, and was slightly negative during the last half of the month. The temperature teleconnection maps for this time of year (July) show little relationship between temperature and the PNA. The precipitation patterns are weakly correlated this time of year (July on the maps), but show some hint of drier-than-normal conditions from the Great Basin to Central Plains and wetter-than-normal conditions in the Great Lakes with a negative PNA, and vice versa for a positive PNA.
- The Arctic Oscillation (AO) pattern was negative at the beginning of the month, turned positive in mid-July, then fluctuated around neutral (zero) at the end of the month. A negative AO this time of year (May-July) is typically associated with cooler-than-normal temperatures across the northern tier states east of the Rockies and dryness in the Gulf Coast and Northeast, and wet conditions in the Plains. A positive AO this time of year (May-July) is typically associated with warmer-than-normal temperatures from the central Plains to the West Coast and wet conditions in the Southeast but dryness across much of the rest of the country. The May-July averaged upper-level circulation anomalies for a positive AO are below normal over the Arctic and above-normal over the northwest and northeast U.S., while a negative AO has the reverse pattern (above normal anomalies over the Arctic and below normal over the northeastern U.S.). The May-July 2012 upper-level circulation had an above-normal pattern stretching from the central U.S. across eastern Canada and into the Arctic, which does not match either a positive or negative AO.
- The North Atlantic Oscillation (NAO) pattern was negative for most of July, then became neutral (near zero) for the last third of the month. A negative NAO during this time of year (July on the teleconnection maps) is typically associated with wetter-than-normal conditions in the Midwest and Northern Plains. The temperature correlations indicate a transition to above-normal temperatures in the Southern Plains to Southeast and below-normal in the Northern Rockies to Northern Plains.
- The East Pacific-North Pacific (EP-NP) pattern relates sea surface temperature (SST) and upper-level circulation patterns over the eastern and northern Pacific to temperature, precipitation, and circulation anomalies downstream over North America. The EP-NP index has been negative for the last couple years, the July 2012 SST pattern was cooler than normal over the northeast Pacific and down along the west coast of Canada and the U.S., and the July upper-level circulation showed a trough over the northeast Pacific with below-normal anomalies over the Bering Sea area of the North Pacific and Arctic Ocean. A negative EP-NP pattern (below-normal upper-level heights in the northeast Pacific) during this time of year (July on the teleconnection maps) is typically associated with above-normal upper-level anomalies (upper-level ridge) over the central U.S. and southern Canada, warmer-than-normal temperatures over the central to northeastern U.S., and drier-than-normal conditions over parts of the central U.S. (although the correlations are weak for precipitation).
 |
 |

The upper-level circulation anomalies for both July 2012 and May-July 2012 over the northeast Pacific and downstream over North America are generally consistent with the EP-NP pattern. The above-normal heights over the central U.S. are shifted north reflecting a stronger High, with an upper-level trough over western North America coinciding with below-normal sea surface temperatures in the northeastern North Pacific and along the west coast of North America. The pattern of observed temperature anomalies for July 2012 and the last three months (May-July) corresponds to the negative phase of the EP-NP across most of the country. The July 2012 and May-July precipitation patterns also correspond weakly to a negative EP-NP index where the correlations exist. The precipitation pattern also suggests some hint of the positive and negative phases of the AO and PNA fighting to influence our weather. As noted above, some of the indices were near neutral values for part or much of the month. When the atmospheric circulation drivers are neutral or in a state of transition, their influence becomes difficult to trace and can be overwhelmed by other competing forces, including random fluctuations in the atmosphere.