Note: This Synoptic Discussion describes recent weather events and climate anomalies in relation to the phenomena that cause the weather. These phenomena include the jet stream, fronts and low pressure systems that bring precipitation, high pressure systems that bring dry weather, and the mechanisms which control these features — such as El Niño, La Niña, and other oceanic and atmospheric drivers (PNA, NAO, AO, and others). The report may contain more technical language than other components of the State of the Climate series.
Synoptic Discussion

A vigorous  weather pattern dominated the contiguous United States during November 2011. Several strong upper-level low pressure systems, typical of the fall transition season, brought areas of rain and snow with cold temperatures, while southerly winds swept warmer-than-normal air ahead of the storm systems. Snow cover expanded and contracted with the winter storms, reaching 28 percent of the contiguous U.S. by the 21st. Nearly 1100 daily high temperature records were tied or broken during the month, and over 1600 warmest minimum temperature records occurred. Fewer cool records occurred, with nearly 600 lowest minimum temperature records and over 700 coolest maximum temperature records tied or broken. Despite the vigorous circulation, tornado activity was near average for the month, but the weather systems brought beneficial precipitation to the drought areas with the national drought footprint decreasing to about 29.3 percent in moderate to exceptional drought.
During November, warmer-than-average temperatures dominated the eastern half of the country with the warmest temperature anomalies occurring across the Midwest, Mid-Atlantic, and Northeast. Thirteen states from Indiana to Maine had November temperatures ranking among their ten warmest. Cooler-than-average temperatures were present across the West, with California, Idaho, Nevada, Oregon, Washington, and Wyoming having November temperatures cooler than average. Precipitation was also variable across the nation with wetter-than-normal conditions across parts of the Southern Plains and across the Ohio Valley. Drier-than-average conditions were present across the West, the upper Midwest, New England, Texas, and Florida. Minnesota had its ninth driest November on record. When averaged together, the mixture of temperature and precipitation extremes gave the U.S. the 25th warmest and 37th wettest November in the 117-year record.
Cold fronts and low pressure systems moving in the storm track flow are influenced by the broadscale atmospheric circulation. Four such large-scale atmospheric circulation drivers were potentially influential during November:
- Ocean temperatures and atmospheric circulation anomalies indicated that the equatorial Pacific was in a La Niña state. La Niña this time of year (September-November) is associated with temperature and precipitation anomalies across the U.S. — temperatures are typically warmer than normal in the central third of the country, with drier than normal conditions dominating the Southwest to Northeast, and wet conditions along the Pacific Northwest coast.
- The Pacific/North American (PNA) pattern was negative for most of November but trended positive near the end of the month. A negative PNA during the fall (October on the teleconnection maps) typically is associated with cooler-than-normal temperatures in the Northwest and warmer-than-normal temperatures in the Southeast, but the precipitation teleconnections are weak.
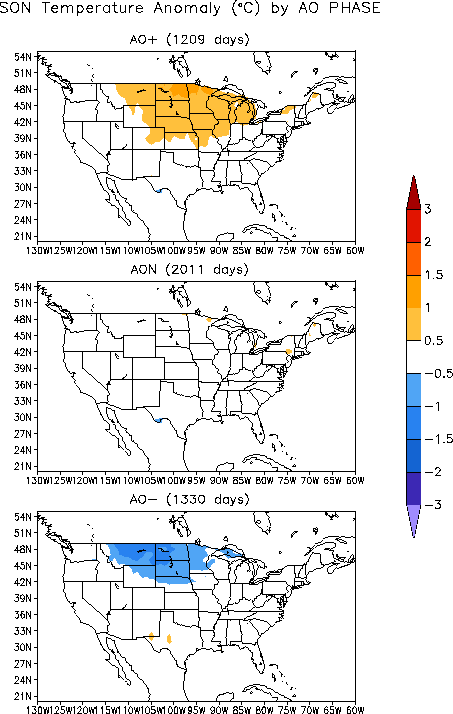
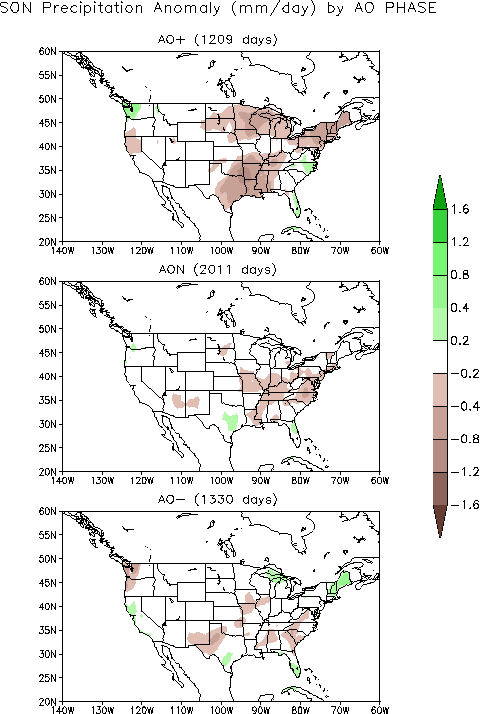
- The Arctic Oscillation (AO) pattern was positive during November and trended even more positive near the end of the month. A positive AO this time of year (September-November) is typically associated with warmer-than-normal temperatures in the Northern Plains, dryness from the Southern Plains to the Ohio Valley and the Northern Plains to the Northeast.
- The North Atlantic Oscillation (NAO) pattern was near neutral during the first half of November then turned positive during the last half of the month. A positive NAO during the fall (October on the teleconnection maps) is typically associated with wetter-than-normal conditions in the Ohio Valley while temperatures show little correlation.
 |
 |
The pattern of observed temperature anomalies for November 2011 and the last three months (September-November) corresponds to the La Niña and AO in the Northern Plains to Great Lakes, and PNA in the Northwest. The November 2011 and September-November 2011 precipitation patterns are a reasonable match for the La Niña pattern across much of the West and the La Niña and AO patterns from the Northern Plains to western Great Lakes, and the NAO pattern for the Ohio Valley.