Did You Know?
Expand "U.S. Climate Normals"
U.S. Climate Normals
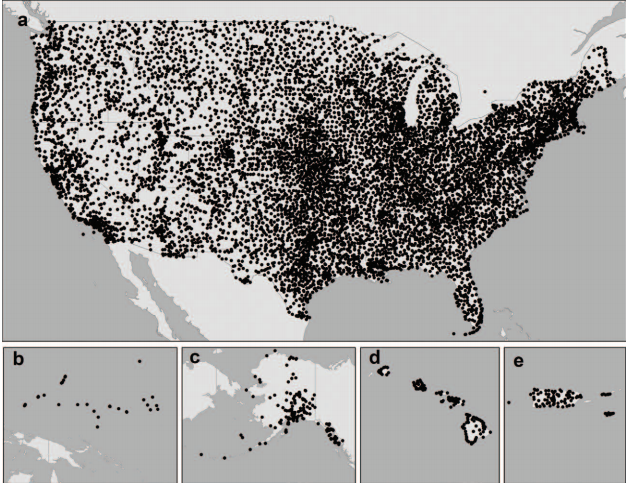
1981-2010 Normals: approximately 9800 stations across (a) the continental U.S. and Canada, (b) the Pacific Ocean, (c) Alaska, (d) Hawaii, and (e) the Caribbean Sea.
Climate Normals are three-decade averages of climatological variables. The most widely-used Normals are those for daily and monthly station-based temperature, precipitation, snowfall and heating and cooling degree days. These come from NOAA's Cooperative and First-Order station networks. Meteorologists and climatologists regularly use Normals for placing recent climate conditions into historical context; such as comparisons with the day's weather conditions on local television. Normals are also utilized in many applications across a variety of sectors. These include regulation of power companies, energy load forecasting, crop selection and planting times, construction planning, building design, and many others.
Several changes and additions were incorporated into the 1981-2010 Normals. Monthly temperature and precipitation Normals utilize underlying data values that have undergone additional quality control to account for things such as stations having been moved. Unlike the 1971-2000 Normals, daily (rather than monthly) data are used extensively in daily temperature Normals as well as heating and cooling degree day Normals, providing greater precision of intra-seasonal features. More details can be found in Arguez et al. 2011.
When the 1991-2020 Normals are released, relevant comparisons between the new version and previous versions will be highlighted. Observational evidence shows that the last 20 years have been the warmest such period on record across the U.S. Therefore, we anticipate that the new Normals will generally be warmer on average for most stations, but not uniformly warmer for all stations and all seasons. In fact, some station Normals in certain locations and seasons may become cooler.
Information on the current Normals, as well as the history of the Normals, please visit U.S. Climate Normals. For general questions about Normals or help accessing the 1971-2000 product, please contact NCEI.
National Overview:
The 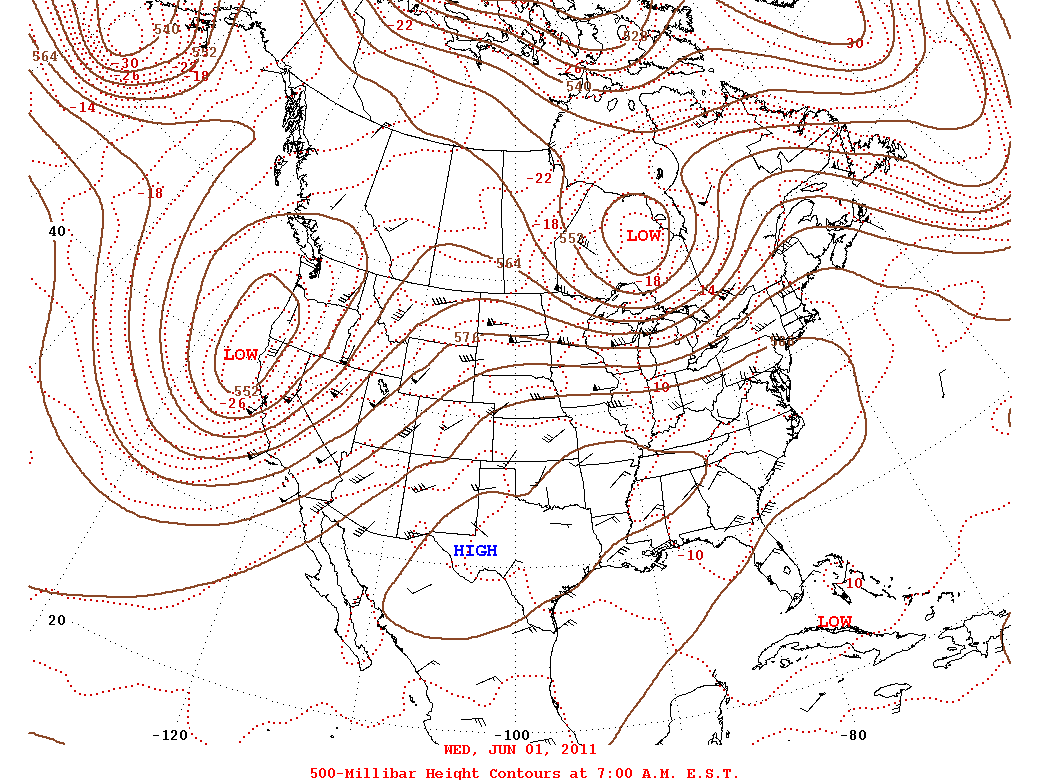 weather pattern over the contiguous United States during June 2011 was a continuation of an upper-level high pressure ridge over the southern to eastern U.S. and an upper low pressure trough over the Northwest, with the storm track mostly keeping to the northern states. Occasional weather systems moved across the middle of the country toward the east, dragging weak fronts into the Southeast. Hot and dry weather was associated with the upper high, while cooler-than-normal weather dominated the Northwest.
More than 4000 daily high temperature records were tied or broken in June, mostly east of the Rockies, and there were 159 reports of the record hottest temperature for June and 42 reports of all-time record hottest temperature ever. Drought intensified across parts of the Southwest to Southeast. While the southern Plains' 1950s drought of record is unsurpassed in terms of duration, the current drought in parts of Texas is more intense than the 1950s drought when measured by the Palmer Hydrological Drought Index. While blanketing the southern U.S. with hot and dry weather, a upper level high pressure system effectively blocked any Gulf of Mexico moisture from feeding into the area. Meanwhile, the upper-level low pressure trough in the Northwest attributed to the cool, wet anomalies in the region.
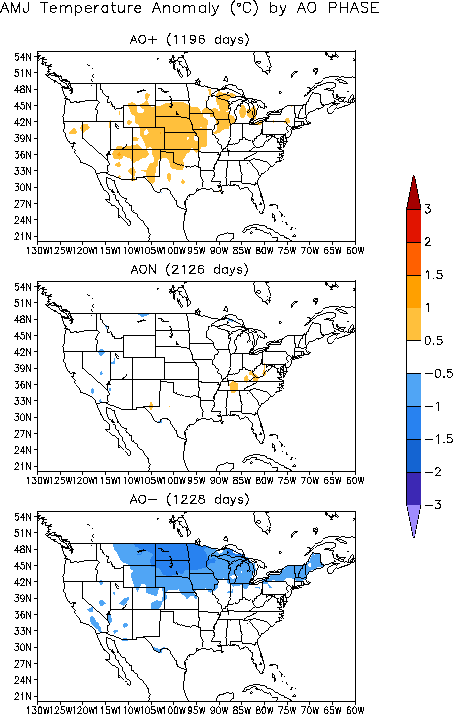
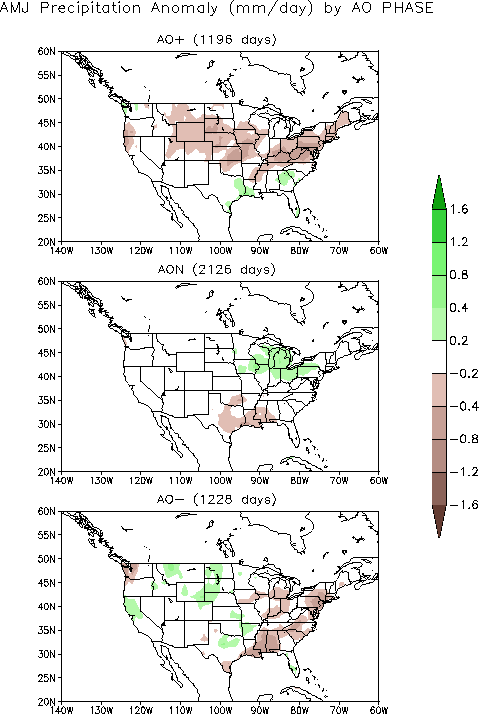
Cold fronts and low pressure systems moving in the storm track flow are influenced by the broadscale atmospheric circulation. Two such large-scale atmospheric circulation drivers were essentially neutral during June. The equatorial Pacific was in an ENSO-neutral state, which means the La Niña has officially ended even though atmospheric circulation anomalies still reflected some aspects of La Niña. The Pacific/North American (PNA) pattern was also neutral and thus not a significant player in the nation's weather this month. But two other large-scale atmospheric circulation drivers were influential during June 2011. The first was the North Atlantic Oscillation (NAO) pattern, which was negative for most of the month. A negative NAO this time of year (summer, represented by July on the NAO teleconnection maps) is typically associated with warmer-than-normal temperatures and drier-than-normal conditions in the southern Plains and Southeast, cooler-than-normal weather in the Northwest and northern Plains, and wetter-than-normal conditions in the northern Plains and Midwest. The second atmospheric circulation index was the Arctic Oscillation (AO) pattern, which was slightly negative for most of the month. A negative AO this time of year (April-June) is typically associated with coolness in the northern Plains and Great Lakes to Northeast, dryness in the Southeast to Northeast and coastal Northwest, and anomalous wetness in northern California and the northern Plains.
The pattern of observed temperature anomalies for June 2011 and the last three months (April-June) is a very good match for the NAO pattern for July (summer). The June and April-June 2011 precipitation patterns are a reasonable match for the NAO and AO patterns in the southern Plains and Southeast.
- Climate Highlights - June
- June 2011 brought extremes in both temperature and precipitation across the United States. An oppressive heat wave accompanied by intensifying drought conditions shattered temperature records in the South and Southwest.
- The average U.S. temperature in June was 70.7 degrees F (21.5 degrees C), which is 1.4 degrees F (0.8 degrees C) above the long-term (1901-2000) average. Precipitation, averaged across the nation, was 2.48 inches (63.0 mm). This was 0.41 inch (10.4 mm) below the long-term average, with large variability in different locations.
- Several locations broke all-time high temperature records during June. On the 26th, Amarillo, Texas set an all time high temperature record of 111.0 degrees F (43.9 degrees C), breaking the record of 109.0 degrees F (42.8 degrees C) set just two days prior. On the 15th, Tallahassee, Florida also recorded an all-time high, 105.0 degrees F (40.6 degrees C). For the month, 42 U.S. locations tied or broke all-time maximum high temperature records.
- In addition to the daily high temperatures, average temperatures during June were also historic in Texas. In Lubbock, the average temperature of 85.8 degrees F (29.9 degrees C) was 8.5 degrees F (4.7 degrees C) above the June average. This surpassed July 1966 (85.4 degrees F or 29.7 degrees C) as the city's warmest month on record. In Midland, the average temperature of 88.0 degrees F (31.1 degrees C) was also the warmest month on record, surpassing the monthly average of 87.2 degrees F (30.7 degrees C) set in August 1964. Additionally, Houston and Galveston had their warmest June on record.
- The expansive heat across Texas resulted in an average statewide temperature of 85.2 degrees F (29.6 degrees C), which was 5.6 degrees F (3.1 degrees C) above normal, surpassing 1953 as the warmest June in 117 years of records. This was the Texas' fourth consecutive June with temperatures at least 2 degrees F (1.1 degrees C) above the long-term average.
- Several other states also had temperatures much above normal. Both Louisiana and Oklahoma (tied) had their second warmest June; Georgia tied for its third warmest. It was the sixth warmest for Arkansas, Delaware (tied), Florida, Mississippi, and New Mexico.
- Along with the heat, parts of the Southwest through much of the Southern Plains and Gulf Coast experienced a continuation of intense drought. New Mexico had its driest June on record while Arizona and Oklahoma had their fourth driest. June was the fifth driest in Texas and the ninth driest in Florida.
- According to the U.S. Drought Monitor, 63 percent of the Southeast was in moderate to exceptional drought at the end of June compared to 51 percent at the end of May. In the South, the percent area in the worst category of drought—called exceptional drought—rose from 28 percent to 47 percent.
- Above average wildfire activity continued across the Southern tier of the United States. Nationwide, 1.35 million acres burned during the month, bringing the year-to-date acreage burned to approximately 4.8 million acres -- the most on record for the period -- and more than twice the decadal average.
- Precipitation was much above normal in most of California, resulting in the state's wettest June on record. Heavier than normal precipitation and prolonged snowmelt during the spring caused June flooding in Idaho, Montana, North Dakota, Utah, and Washington. Abormally high flows on the Missouri River forced record amounts of water to be released from Fort Peck Reservoir in Montana. Additionally, the Souris River crested at a record 1561.72 feet which surpassed the old record of 1558 feet set in 1881.
- According to data from the Storm Prediction Center, there were 177 preliminary tornado reports during June, which is below the national average for the month. On June 1st, a strong tornado tracked 39 miles across Massachusetts, marking the second longest tornado track on record for the state.
- The April-June 2011 Climate Extremes Index was 42 percent, which is twice the mid-range value. Contributing factors to this elevated extent of extremes were a record high combined value of wet and dry extremes and a record value of 1-day precipitation events. The CEI measures the spatial extent of several types of climate extremes (like record or near-record warmth, dry spells, or rainy periods).
- Climate Highlights - 3 - 12 - Month and Year-to-Date Periods
- A persistent pattern set up during the spring (March-May) in which the Pacific Northwest and Northern Rockies saw frequent storm systems and invasions of cold air. In the south, storm systems repeatedly developed in the mid-Mississippi Valley, just a few hundred miles from the drought-stricken Southern Plains, then raced northeastward. In general, drought intensified in the South, while much of the Northeast, Ohio Valley, and Northwest were subjected to historic or near-historic wetness.
- Both Oregon and Washington (tied) - and the Northwest Region - had their coolest April-June period on record. Meanwhile, the South had its second warmest and the Southeast its third warmest such period.
- Record warmth dominated Texas during the past three months. A total of 14 states, mostly in the South and Southeast U.S., experienced an average April-June temperature among their ten warmest.
- Record precipitation due to a persistent storm track across the northern U.S. drove the wettest April-June period in the High Plains and the Ohio Valley area. Within the Ohio Valley area, four states had their wettest April-June on record: Indiana, Ohio, Kentucky, and Michigan.
- Three drought-stricken states - Louisiana, New Mexico, and Texas - had their driest January-June on record. In that time, Louisiana was 11.72 inches (297.7 mm) below the 20th century average of 29.16 inches (740.7 mm). Texas was more than eight inches (203 mm) below average (13.83 inches or 351.3 mm) and New Mexico was nearly 3.5 inches (89 mm) below their average (4.68 inches or 119 mm) at that point in the calendar year.
Alaska Temperature and Precipitation:
-
 Alaska
had its 41st warmest June on record, with a temperature 0.2°F (0.1°C) above the 1971–2000 average.
Alaska
had its 41st warmest June on record, with a temperature 0.2°F (0.1°C) above the 1971–2000 average.
-
 Alaska
had its 33rd warmest April-June on record, with a temperature 0.7°F (0.4°C) above the 1971–2000 average.
Alaska
had its 33rd warmest April-June on record, with a temperature 0.7°F (0.4°C) above the 1971–2000 average.
-
 Alaska
had its 41st warmest year-to-date period on record, with a temperature 0.2°F (0.1°C) below the 1971–2000 average.
Alaska
had its 41st warmest year-to-date period on record, with a temperature 0.2°F (0.1°C) below the 1971–2000 average.
-
 Alaska
had its 22nd wettest June since records began in 1918, with an anomaly that was 8.2 percent above the 1971–2000 average.
Alaska
had its 22nd wettest June since records began in 1918, with an anomaly that was 8.2 percent above the 1971–2000 average.
-
 Alaska
had its 15th driest April-June on record, with an anomaly that was 20.2 percent below the 1971–2000 average.
Alaska
had its 15th driest April-June on record, with an anomaly that was 20.2 percent below the 1971–2000 average.
-
 Alaska
had its 22nd driest year-to-date period on record, with an anomaly that was 9.6 percent below the 1971–2000 average.
Alaska
had its 22nd driest year-to-date period on record, with an anomaly that was 9.6 percent below the 1971–2000 average.
For additional details about recent temperatures and precipitation across the U.S., see the Regional Highlights section below. For information on local temperature and precipitation records during the month, please visit NCDC's Records page. For details and graphics on weather events across the U.S. and the globe please visit NCDC's Global Hazards page.
Regional Highlights:
These regional summaries were provided by the six Regional Climate Centers and reflect conditions in their respective regions. These six regions differ spatially from the nine climatic regions of the National Climatic Data Center.
- Northeast Region: (Information provided by the Northeast Regional Climate Center)
- Temperatures in the Northeast were above normal for the sixth consecutive month. June's average temperature was 66.4 degrees F (19.1 degrees C), which was 0.9 degrees F (0.5 degrees C) above normal. Four of the six New England states averaged below normal, with departures of -0.1 degrees F (-0.1 degrees C) in Maine and Massachusetts, -0.2 degrees F (-0.1 degrees C) in New Hampshire, and -1.0 degrees F (-0.6 degrees C) in Rhode Island. Positive departures ranged from +0.1 degrees F (+0.1 degrees C) in Connecticut to 2.6 degrees F (1.4 degrees C) warmer than normal in Delaware. It was the 6th warmest June since 1895 in Delaware, the 8th warmest in Maryland, and the 10th warmest in New Jersey.
- After four months in a row with above normal precipitation, the Northeast averaged drier than normal in June. The regional rainfall total was 3.74 inches (95mm) or 89 percent of normal. Four states, Connecticut (127 percent), Massachusetts (126 percent), Rhode Island (107 percent), and Vermont (106 percent) averaged wetter than normal; departures among the drier than normal states ranged from 63 percent in Maryland to 99 percent in Maine. Drought concerns were returning to the Mid-Atlantic region. As of June 28, 2011, the US Drought Monitor reported D1 (moderate) drought in southeastern Maryland and southern Delaware and D0 (abnormally dry) conditions elsewhere in eastern Maryland and northern Delaware, as well as the southern third of New Jersey.
- Warm and increasingly humid air hovered over the Northeast on June 8th and 9th, sending the mercury well into the 90's (>32 degrees C) and the heat indices into the 100's (>38 degrees C). Washington, DC, Baltimore, MD, Atlantic City and Newark, NJ topped 100 degrees F (37.8 degrees C) for new records on the 9th. When the mercury reached 102 degrees F (38.9 degrees C) at Atlantic City, NJ it was the earliest occurrence of 100 degrees F (37.8 degrees C) at that location. The early summer warmth prompted some towns in Pennsylvania to close schools without air conditioning, and cooling centers were available for city dwellers in Philadelphia and New York affected by the oppressive heat. The passage of a cold front, which brought relief from the warmth, also initiated episodes of severe weather on the 8th and 9th. Violent storms in St. Lawrence, Franklin and Essex Counties, NY and Rutland, Windsor and Orange Counties, VT resulted in many reports of downed trees and power lines, up to quarter-sized hail and flash flooding. Winds in Rutland County were estimated at 70 mph (31 m/s). Strong storms in New Hampshire cut power to at least 20,000 customers, while three weak tornados were confirmed in Aroostook County, Maine. Most of the tornado damage was confined to downed or snapped trees, with a few reports of minor structural damage.
- For more information, please go to the Northeast Regional Climate Center Home Page.
- Midwest Region: (Information provided by the Midwest Regional Climate Center)
- June precipitation in the Midwest varied considerably. Monthly totals were two to three times normal from southeast Iowa to southeast Illinois and also at the northern edge of Lower Michigan. Totals were less than half of normal rainfall in southwest Missouri and near the Michigan-Ohio border. Drought was scarce in the Midwest during June. A small area of Moderate Drought was introduced in northeast Minnesota only to revert to Abnormally Dry in the US Drought Monitor the following week. More than 750 daily precipitation records were set in the Midwest during the month. In Illinois, statewide precipitation ranked as the 8th wettest June since 1895.
- June temperatures were well above normal at the beginning of the month but cooled to below normal later in the month. Averaged for the month, temperatures were 3 degrees F (2 degrees C) below normal in northern Minnesota and 5 degrees F (3 degrees C) above normal in southern Missouri. Minimum temperatures were warmer, compared to normal, than maximum temperatures. Nearly 2000 daily temperature records were set in June with hundreds each of record high maximums (832), record low maximums (430), and record high minimums (692) but relatively few record low minimums (30).
- Flooding along the Missouri River persisted through the month with major flooding in western Iowa and northwest Missouri. Moderate to minor flooding occurred further down river in Missouri. Interstate 29 in western Iowa and northwest Missouri was closed in multiple locations due to water over the roadway. Bridges across the river were closed due to water on the approaching roads or concerns about their ability to withstand the rushing waters. For more than 100 miles (161 km) from south of Council Bluffs, Iowa to north of St. Joseph, Missouri, all traffic bridges were closed at some point in the month. Levees were overtopped or breached in southwest Iowa and northwest Missouri causing evacuations of several towns and the surrounding rural areas. Freight and passenger train service was disrupted across and along the river. In addition to the many homes and businesses affected, thousands of acres of farmland were under water and unlikely to produce a crop this season.
- Severe weather was widespread in the Midwest during June. Only the 29th had no severe weather reports from the region. Tornadoes were reported in all nine Midwest states and on 12 days, including 10 of 14 days from the 14th to the 27th. A notable tornado on the 22nd hit Churchill Downs racetrack damaging six barns but sparing the people and horses any injuries. Four inch (10 cm) diameter hail fell near Loganville and Reedsburg, Wisconsin on the 5th. Three inch (7.5 cm) hail fell near Jamesport and Rothville, Missouri on the 9th, Platte City, Missouri on the 18th, Sidney, Kentucky on the 21st, and Grafton, Illinois on the 25th.
- Planting progressed at a furious pace in late May and early June when favorable conditions finally allowed farmers an opportunity for field work. Planting season was compressed into a shorter than normal window but most of the intended corn and soybean acres were planted with the expectation of sufficient time to mature.
- For details on the weather and climate events of the Midwest, see the weekly summaries in the MRCC Midwest Climate Watch page.
- Southeast Region: (Information provided by the Southeast Regional Climate Center)
- For the second consecutive year, meteorological summer began with exceptionally warm temperatures across the Southeast region. Mean temperatures in June were between 4 and 6 degrees F (2.2 and 3.3 degrees C) above normal across most of the region, with exception to the Florida Peninsula, Puerto Rico, and the U.S. Virgin Islands. Several locations in the Southeast experienced their warmest June on record, including Birmingham, AL, Mobile, AL, Columbus, GA, and Cape Hatteras, NC. June ranked among the top 5 warmest in several other locations, including Charleston, SC, Miami, FL, Washington, D.C., and Richmond, VA. Tallahassee Regional Airport in Florida recorded an all-time maximum temperature of 105 degrees F (40.6 degrees C) on the 15th of the month, breaking the old record of 104 degrees F (40 degrees C) last set in 1933. The persistence of warm temperatures was also noteworthy. In Columbia, SC, the maximum temperature reached 90 degrees F (32.2 degrees C) or higher on all 30 days of the month, breaking the old record of 27 days set back in 1911 and 1952. Savannah, GA also recorded 90 degree F and higher temperatures on all 30 days, extending a streak of 90 degree and higher temperatures that began in May.
- Precipitation was generally below normal across the Southeast in June, with monthly totals ranging between 25 and 75 percent of normal across most of the region. The driest locations (less than 25 percent of normal) were along the coastal plain of North and South Carolina and along the Florida Keys. Key West, FL recorded 0.71 inches (18.0 mm) of rain for the month, or 16 percent of normal. Florence, SC recorded only 0.30 inches (7.6 mm), a deficit of nearly four inches (101.6 mm). The wettest locations (greater than 200 percent of normal) were in western North Carolina, southwest Florida, Puerto Rico, and the U.S. Virgin Islands. San Juan, PR recorded 13.60 inches (345.4 mm) of rainfall for the month, breaking the old record of 12.22 inches (310.4 mm) set back in 1902. Hot Springs, NC, located along the western ridge of the southern Appalachians, recorded 9.54 inches (242.3 mm) of rainfall, or 246 percent of normal. Interestingly, there were a few cases of coastal stations in close proximity that reported strikingly different monthly rainfall totals. For example, Miami Beach, FL recorded its driest June on record with 1.15 inches (29.2 mm) of rainfall, while just seven miles away the Miami International Airport recorded 12.22 inches (310.4 mm) of rainfall.
- There were 1,886 reports of severe weather across the Southeast in June (1,500 reports of high wind and 386 reports of hail), with at least one report on every day of the month. No tornadoes were reported. Large hail in the shape of spears was reported in Jackson County, NC on the 1st of the month. A lightning strike in downtown Athens, GA damaged the brick facade of a building during a town festival; no injuries were reported. Some arborists in the region suspect that the large amount of wind damage may have been due to trees initially weakened by past droughts which then reached a critically brittle state during the recent dry spell. Wind gusts in excess of 60 mph (26.8 m/s) were recording on the 21st and 28th of the month at the Roanoke Regional Airport.
- Drought conditions continued to worsen across parts of the Southeast in June. Most notably, the regions of extreme and exceptional drought (D3 and D4) expanded across parts of northern Florida, southern Alabama and Georgia, and southeast Florida. The region of severe drought (D2) expanded across eastern North Carolina. The continued dryness in these regions sustained several lightning-generated wildfires, prompting numerous air quality alerts in parts of eastern North Carolina, South Carolina, and Georgia. The extreme heat and dryness also had a negative impact on agriculture. Hay production was down and this created concern among farmers trying to feed cattle and livestock. Farmers in Alabama reported rotted peanuts and were beginning to replant with cotton and soybeans. The corn crop was generally reported to be in poor condition across much of the region, except in Virginia. In south Florida, continued water restrictions limited sugarcane growth. Water supplies were severely affected in some communities. Groundwater levels were near record low levels across parts of central and southern Georgia, requiring municipalities to increase the depth of their wells to maintain water supplies. Towards the end of the month, dust from the Sahara Desert was transported across the Atlantic Ocean and into the Caribbean. Haze and poor visibility from the dust persisted for several days across Puerto Rico and the U.S. Virgin Islands and contributed to a spike in respiratory disease.
- For more information, please go to the Southeast Regional Climate Center Home Page.
- High Plains Region: (Information provided by the High Plains Regional Climate Center)
- June 2011 temperatures were generally lower than normal in the north and higher than normal in the south across the High Plains Region. Average monthly temperatures ranged from near normal to 6.0 degrees F (3.3 degrees C) below normal in the Dakotas, Wyoming, Nebraska, and northern Colorado. Meanwhile, average monthly temperatures ranged from near normal to 7.0 degrees F (3.9 degrees C) above normal in Colorado and Kansas. Many locations in Kansas ranked in the top 10 warmest Junes on record and set many daily high temperature records. Dodge City, Kansas had its 5th warmest June on record (period of record 1874-2011) with an average temperature of 79.8 degrees F (26.6 degrees C). The record, which was set in 1952, held at 81.7 degrees F (27.6 degrees C). Interestingly, Dodge City had 10 days this month in which the maximum temperature was 100 degrees F (37.8 degrees C) or greater. Typically, Dodge City only has 1.5 days at or above 100 degrees F (37.8 degrees C) in June. June 1953 held onto the record with 11 days. One of these particularly hot days was June 26th, when Dodge City tied for its highest maximum temperature of all time with 110 degrees F (43.3 degrees C). The only other time that the temperature had been that high was June 29, 1998.
- This month, large areas of above and below normal precipitation occurred. Areas of southern Colorado and southern Kansas received little to no precipitation, while a swath of above normal precipitation extended through central North Dakota, South Dakota, and into Nebraska. Alamosa, Colorado, which was experiencing extreme drought the entire month, tied for its driest June on record (period of record 1906-2011). This was the third June on record in which Alamosa did not receive any measurable precipitation (other years included 1980 and 1946). Elsewhere, some locations received well over 200 percent of normal precipitation with Pierre, South Dakota being this month's wet spot. Total precipitation at Pierre this June was 8.31 inches (211 mm) which was 4.82 inches (122 mm) above normal and enough to set a new record (period of record 1893-2011). The old record of 7.66 inches (195 mm) occurred just a few years ago, in 2008.
- Meanwhile, flood warnings along the Missouri River continued the entire month. Numerous towns and hundreds of thousands of acres of farmland have been impacted by the flooding. In addition, many roads were closed including parts of I-29 in Iowa, Missouri, and South Dakota. According to the South Dakota State Climate Office, some residents of Pierre, Fort Pierre, and Dakota Dunes evacuated their homes. Major flooding continued this month along not only the Missouri River, but also the Souris River which flows south from Canada into North Dakota. Many towns along the river were impacted including Minot, Burlington, Sawyer, and Velva. According to the North Dakota State Climate Office, in Minot, the state's fourth largest city, 11,000 people were forced to evacuate in just 24 hours and numerous homes and businesses were damaged in the flood. The river crested at a record 1561.72 feet which surpassed the old record of 1558 feet set in 1881.
- In addition to flooding, severe weather was widespread across the Region as severe weather was reported on all but 4 days this month. Storm reports totaled 1340, with 81 tornado reports, 701 hail reports, and 558 wind reports. The period of June 18-20 was particularly active and tornadoes were reported in Colorado, Kansas, Nebraska, and North Dakota. Damage to houses, power lines, grain bins, trees, and center pivot irrigation systems was reported. Heavy rain from these storms also caused flash flooding and washed out roads in western and central Nebraska. An interesting high wind event occurred at the end of the month in Colorado. On June 28th, a collapsing thunderstorm caused 84 mph (134 km/hr) winds at the Kit Carson County Airport in eastern Colorado. Extensive damage to hangars and aircraft occurred.
- The U.S. Drought Monitor had slight changes throughout the month of June. Hot and dry conditions caused an expansion of extreme drought (D4) in parts of south central Colorado. Exceptional drought conditions (D5) were also expanded northward into extreme south central Kansas. Since last month, abnormally dry conditions have also expanded to southwestern Colorado. Heavy rains allowed for some improvement in southeastern Kansas where abnormally dry conditions (D0) and moderate drought conditions (D1) were eliminated, and also in northwestern Kansas, where D1 and severe drought conditions (D2 were erased. Meanwhile, North Dakota, South Dakota, and Wyoming remained drought free, while only small portions of southeast and southwest Nebraska had D0 this month. According to the U.S. Seasonal Drought Outlook released June 16th drought conditions across Colorado and Kansas were expected to improve.
- For more information, please go to the High Plains Regional Climate Center Home Page.
- Southern Region: (Information provided by the Southern Regional Climate Center)
- June was a very warm month for the entire Southern Region, with most stations averaging at least 4 degrees F (2.22 degrees C) above the monthly normal. The highest temperature anomalies occurred in northern Texas and through most of Oklahoma. There, temperatures averaged between 6 to 10 degrees F (3.33 to 5.56 degrees C) above expected monthly values. The region as a whole had an average temperature of 83.43 degrees F ( degrees C), which was the second warmest June on record (1895-2011). Texas had a state average temperature of 85.20 degrees F (29.56 degrees C), which was the warmest June on record (1895-2011). Oklahoma experienced its second warmest June on record (1895-2011) with a state average temperature of 83.40 degrees F (28.56 degrees C). Louisiana also had its second warmest June on record (1895-2011). The state average temperature for the Bayou State was 83.50 degrees F (28.61 degrees C). Both Arkansas and Mississippi experienced their sixth warmest June on record (1895-2011) with state average temperatures of 81.60 degrees F (27.56 degrees C). For Tennessee, it was the twelfth warmest June (1895-2011) with a state average temperature of 76.60 degrees F (24.78 degrees C).
- With the exception of Tennessee, June proved to be a very dry month in the Southern Region. In Tennessee, there was a lot of spatial variation in precipitation totals with the eastern half averaging near normal to above normal, while in the western half, stations averaged near normal to below normal. The state averaged 5.58 inches (141.73 mm) of precipitation and it was the eighteenth wettest June on record (1895-2011). Elsewhere, most stations averaged below 50 percent of normal precipitation. Precipitation late in the month helped augment precipitation totals in Louisiana and therefore most of the state ended up averaging 50 to 90 percent of normal. The state average precipitation total in Louisiana was 3.10 inches (78.74 mm). A similar situation with similar values occurred in Mississippi. The state average precipitation total for the month in Mississippi was 2.83 inches (71.88 mm). In Arkansas, Oklahoma and Texas, conditions were much drier, with dozens of stations averaging less than twenty-five percent of normal precipitation. Arkansas averaged only 1.58 inches (62.23 mm) for the month and it was the eleventh driest June on record (1895-2011). Oklahoma and Texas were the driest states. Oklahoma experienced its fourth warmest June on record (1895-2011), while Texas experienced its fifth driest June on record (1895-2011). The state average precipitation totals for Oklahoma and Texas were 1.18 inches (29.97 mm) and 0.99 inches (25.15 mm), respectively.
- Extreme dryness coupled with anomalously high temperatures throughout the Southern Region has not led to much of a change in areal coverage of drought in general, but it has led to dramatic changes in drought intensity. As was the case last month, northern Mississippi and Tennessee remain drought free. Dryness throughout most of Arkansas and eastern Oklahoma has led to in the introduction of D0, or abnormally dry conditions. The biggest changes in drought intensity occurred in the states of Louisiana, Texas and Oklahoma. As of May 31, 2011, 60.31 percent of Louisiana was in extreme (D3) drought or worse, with only 10.38 in exceptional (D4) drought. As of June 28, 2011, those numbers increased to 90.12 percent in extreme (D3) drought or worse and an astounding 63.50 percent in exceptional (D4) drought. Similarly, in Oklahoma, there was a 11.19 percent areal coverage increase in extreme (D3) drought or worse and a 22.58 percent areal coverage increase in exceptional (D4) drought. In Texas, there was a 9.55 percent increase in the areal coverage of extreme (D3) drought or worse, and a 21.67 percent areal coverage increase in the amount of exceptional (D4) drought. As of June 28, 2011, 72.32 percent of Texas, 32.55 percent of Oklahoma and 63.50 percent of Louisiana are designated as exceptional drought.
- For more information, please go to the Southern Regional Climate Center Home Page.
- Western Region: (Information provided by the Western Regional Climate Center)
- June of 2011 brought unprecedented extremes of wet, dry, snow pack, and atmospheric humidity to the western United States. Temperatures were cooler than normal throughout the West except for the southeast portion of the region where temperatures were slightly to well above normal. At Clayton New Mexico 2011 brought the warmest June on record 75.9 degrees F (24.4 degrees C), which was 6.0 degrees F (3.3 degrees C) above average. The previous warmest June was one year ago.
- Precipitation was far above its usually low normal in central and northern California, and continued to be above normal especially in eastern Montana. Other wet pockets were found in the northern Great Basin and the Wasatch. Even with a rainless month in the desert, preliminary figures show that California experienced its statewide wettest June on record (1895+). At San Francisco downtown, the month was the 2nd wettest June (behind 1884) in a record that begins in July 1849. The southern part of the region was significantly drier than its meager normal, where preliminary figures show that New Mexico experienced its driest June since 1895. The station at Carlsbad New Mexico reported no precipitation for the 223 days preceding June 2, received a scant 0.01 inch on that day (0.2 mm), and then no rain for the rest of June.
- The cool temperatures of the month greatly reduced the melt rate of the deep snowpack that affected most mountain locations outside of Arizona and New Mexico. This has significantly extended the snowmelt season, and the associated streamflow runoff season, far into the summer, with record late runoff, and floods exceeding the flood of record in many small basins in Utah and Colorado. Heavy precipitation combined with deep snow and cool temperatures led to melted snow and rain producing record releases from Fort Peck Reservoir in Montana, by far the greatest flows on the Missouri River since the dam was closed off in 1937.
- Two unusually wet late season storms produced heavy rainfall in parts of California from the 4th to the 6th and again on the 28-29th. Santa Barbara recorded their wettest June on record dating back 108 years and Sacramento Airport broke their June record dating back 70 years with 1.50 inches (38.1 mm). Precipitation was spotty, but some locations in the northern and central parts of the state (coastal and inland) recorded over 4 inches (102 mm) of rain for the month breaking numerous long-term records for June. On average, most of the state receives little or no rain at all for June.
- Extremely dry and windy conditions fanned numerous wildfires in Arizona. The Wallow fire began on May 9th near Alpine, AZ, and eventually erupted into the largest fire in Arizona history with nearly 3,500 personnel involved in the fight at one time. By the end of June the fire had burned over 538,000 acres (218,000 ha) and was 82 percent contained. Thirty-two residences had been destroyed and numerous road closures on state and federal Highways 180, 191, 261 and 373 had occurred. The fire eventually spilled over into New Mexico. The Horseshoe 2 fire in Southeast Arizona started on May 8th near Chiracahua National Monument had burned 223,000 acres (90,000 ha) until its containment on June 25th. Nine residences and 14 outbuildings were damaged or destroyed.
- The Las Conchas fire near Los Alamos began June 26th and quickly spread to over 103,000 acres (42,000 ha) by the end of the month. The fire has threatened the town of Los Alamos and the National Labs and was only 3 percent contained as of July 1. The city of Los Alamos remained evacuated as of month end.
- Las Vegas recorded a temperature of 107 degrees F (41.7 degrees C) and a dew point temperature of -22 degrees F (-30 degrees C) late in the afternoon, for a dew point depression record of 129 degrees F (53.9 degrees C) and relative humidity of 0.6 percent . This is the driest air ever recorded in this desert city, and may be the driest recorded at any climate station in United States history. Death Valley may have exceeded this low humidity, but only sporadic atmospheric moisture measurements exist for that location.
- Heavier than normal precipitation and spring snowmelt caused June flooding in Idaho, Montana, Utah, and Washington. Montana flooding resulted in Presidential Disaster Declaration for 31 counties and 4 tribal reservations with damages estimated at 8.6 million dollars through month end.
See NCDC's Monthly Records web-page for weather and climate records for the most recent month. For additional national, regional, and statewide data and graphics from 1895-present, for any period, please visit the Climate at a Glance page.
PLEASE NOTE: All of the temperature and precipitation ranks and values are based on preliminary data. The ranks will change when the final data are processed, but will not be replaced on these pages. Graphics based on final data are provided on the Temperature and Precipitation Maps page and the Climate at a Glance page as they become available.