Spring 2011 U.S. Climate Extremes
National Overview:
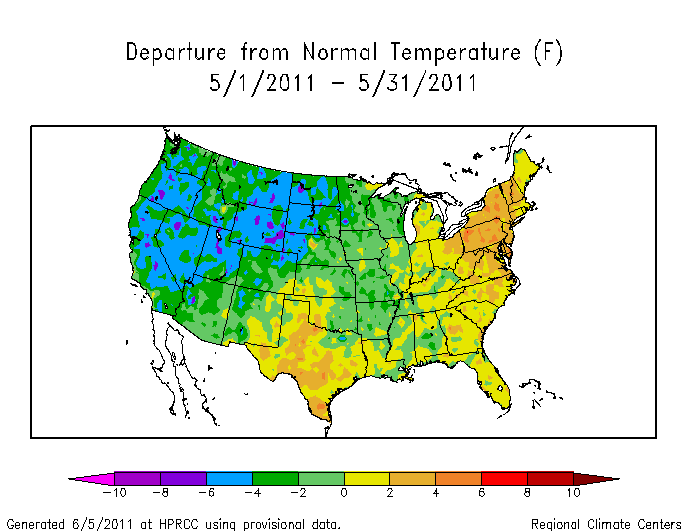
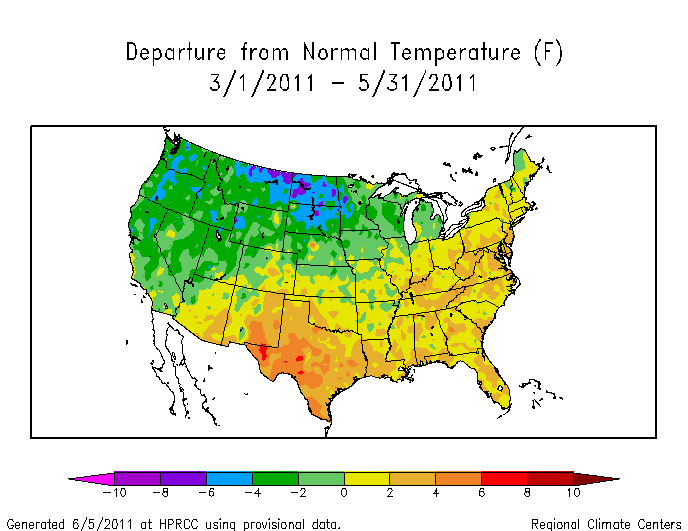
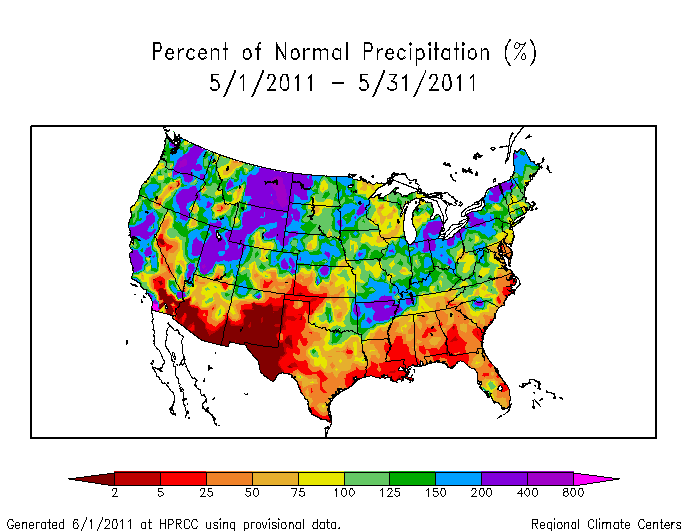
The  weather pattern over the contiguous United States during May 2011 was a continuation of the westerly flow which dominated April, but strong troughs, ridges, and cutoff lows frequently dug into the flow this month. This was a recipe for heavy rain, violent weather, and large temperature swings across parts of the country. The main storm track kept to the northern states, bringing record and near-record precipitation to parts of the northern Rockies and northern High Plains, and helping to keep temperatures below normal across much of the West and northern Plains. The weather was drier than normal north and south of the storm track, with dryness extending across the southern tier states into Mexico as well as across much of the Canadian Prairies. Large cold fronts, with cooler-than-normal Canadian air behind them, swept across the U.S. at times, especially during the middle part of the month. By the end of the month, the Bermuda High strengthened over the southern to eastern third of the country, bringing a reinforcing shot of hot and dry weather.
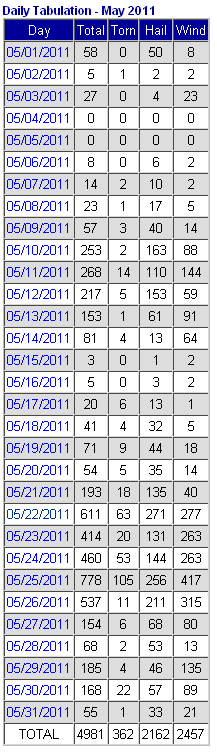
Most of the severe weather occurred from the Plains to Midwest and Northeast during the last half of the month, in association with a couple very strong  upper-level low pressure systems which tracked across the area. Initial estimates by the National Weather Service (NWS) put the tornado count for May 2011 at 362 tornadoes, with 158 deaths — the vast majority of which occurred from a twister that struck Joplin, Missouri. There were over 2,100 reports of hail damage and over 2,400 reports of wind damage.
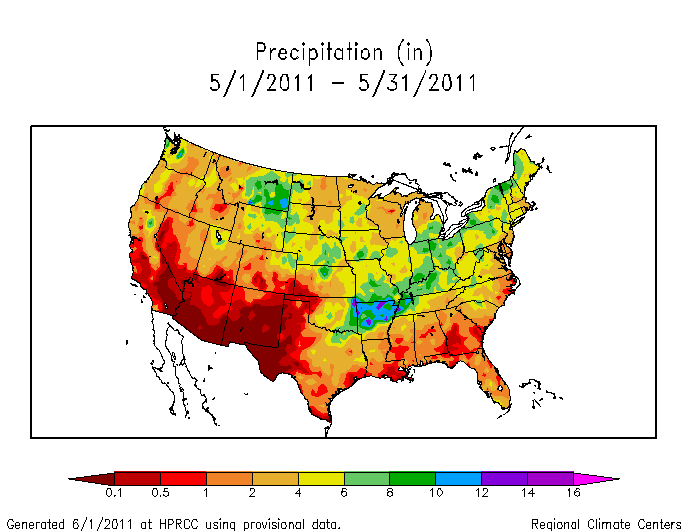
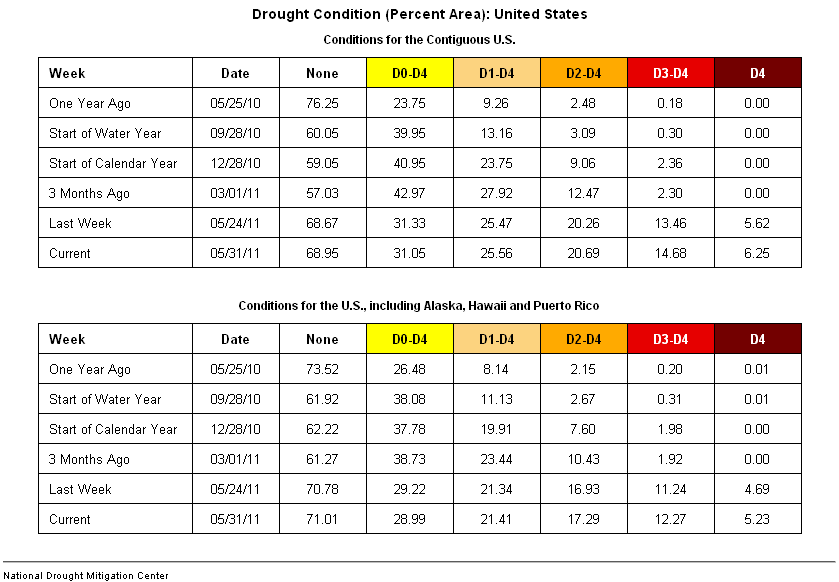
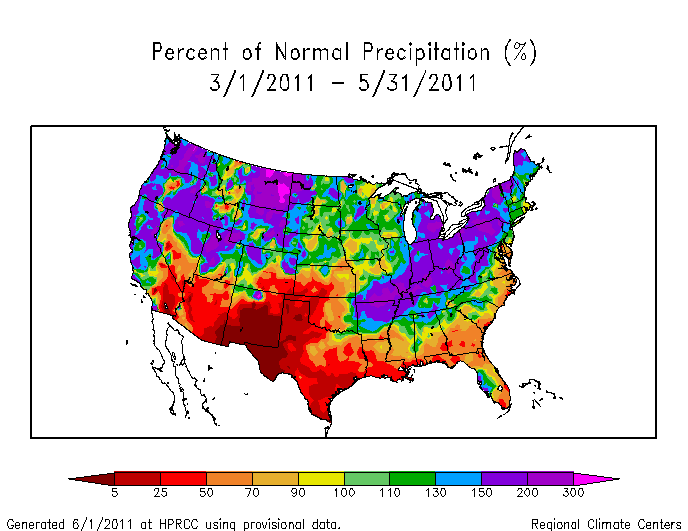
Record precipitation occurred across parts of Montana and Arkansas where over ten inches of rain was measured. Many states in the West and Northeast ranked in the top ten wettest for May, while the southern tier states from Texas to Florida ranked in the top ten driest category. Nationally, about 26 percent of the contiguous U.S. was in moderate to exceptional drought, with the drought epicenter firmly entrenched across the southern Plains. Texas continued to dehydrate and bake. Statewide, the Lone Star State had the driest spring (March-May), 6-month period (December-May), and 8-month period (October-May) in the 1895-2011 record. Significant wildfires accompanied the dryness in the southern Plains and Southwest, as well as in Florida and some in Alaska.
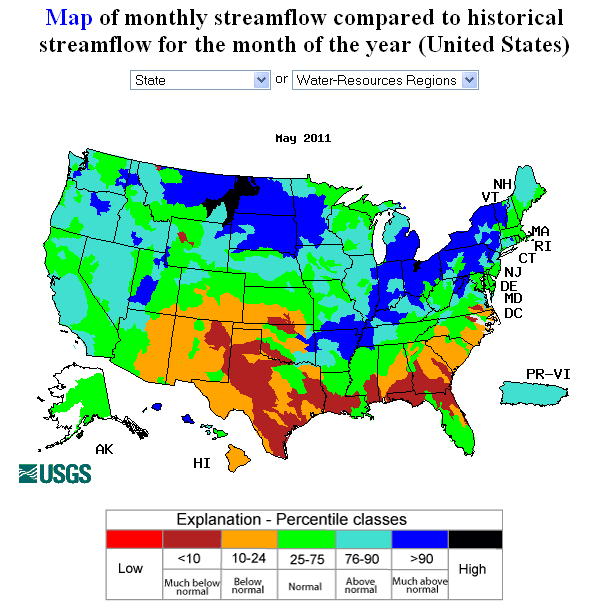
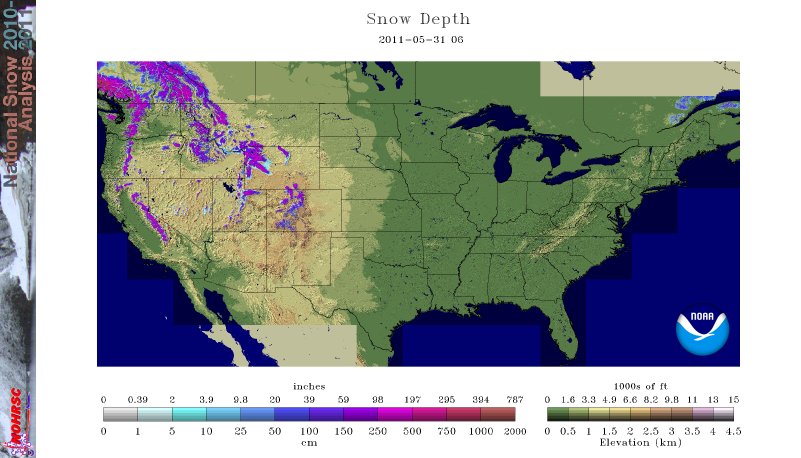
The persistence of upper-level lows over the West resulted in below-normal upper-air (500-millibar) geopotential heights. This type of monthly average pattern in the upper atmosphere is associated with wetter and colder than normal weather. Four western states (Oregon, Utah, Washington, and Wyoming) ranked in the top ten coldest category for May, while one state (Delaware) ranked in the top ten warmest category. Nationally, May 2011 ranked as the 25th coolest and 27th wettest May in the 1895-2011 record. The cooler-than-normal May temperatures helped slow melting of the above-normal snowpack over the western mountains. The melting of the snowpack that did occur combined with above-normal May precipitation to produce above-normal streamflow, increasing the threat of flooding. Although May is late in the snow season, about 11 percent of the country was snow covered at the beginning of the month. The area dropped to about 4 percent by the end of the month, with the snow cover mostly in the western mountains.
Cold fronts and low pressure systems moving in the storm track flow are influenced by the broadscale atmospheric circulation. Three such large-scale atmospheric circulation patterns were influential during May. The first was the La Niña, which is the phenomenon associated with cooler-than-average sea surface temperatures in the eastern tropical Pacific Ocean. La Niña continued to weaken during May with a transition to ENSO-neutral conditions, but atmospheric anomalies associated with La Niña remained significant. At this time of year, La Niña is typically associated with cold temperature anomalies in the western to north central regions, warm anomalies in the southern to east central regions, and dry anomalies across much of the country. The second atmospheric circulation index was the North Atlantic Oscillation (NAO) pattern, which was near neutral at the beginning of May and became positive near the end of the month. A positive NAO this time of year is typically associated with warmer-than-normal temperatures across most of the country and drier-than-normal conditions in the Southeast and parts of the central and western U.S. The third atmospheric circulation index was the Arctic Oscillation (AO) pattern, which also was neutral for most of the month and slightly positive at the end of the month. A neutral AO this time of year is typically associated with anomalous warmth in the central Appalachians, cooler-than-normal temperatures in the Northwest, dryness in the southern to central Plains, and anomalous wetness in parts of the Southeast, Northeast, and Great Lakes.
The pattern of observed temperature anomalies for May and spring (March-May) 2011 generally matched the La Niña and AO patterns for May (spring). The May and spring precipitation pattern generally matched the mid-spring La Niña, NAO, and AO patterns in the southern Plains and Southeast. But the above-normal precipitation pattern for May 2011 in the Midwest and Northwest is closer to the mid-winter (instead of mid-spring) La Niña pattern.
- Climate Highlights - May
- In May 2011 the United States had dramatic shifts in regional temperatures, but overall was slightly cooler and wetter than normal. Spring was marked by record wetness in the Northwest and Ohio Valley while drought conditions intensified across the South.
- The average U.S. temperature in May was 60 degrees F (15.6 degrees C), which is 1.0 degrees F (0.6 degrees C) below the long-term (1901-2000) average. Precipitation during the month was 0.34 inch (8.6 mm) above the long-term average.
- Average May temperatures across the western third of the country were below normal. Washington (tied) and Oregon experienced their sixth coolest May on record with average temperatures more than 3.6 degrees F (2 degrees C) below the 20th century normal. Wyoming and Utah had their seventh and eighth coolest May on record, respectively.
- Precipitation during May was above normal for much of the United States. Only the South and Southeast experienced average precipitation that was below normal. The average precipitation of 4.7 inches (119.4 mm) in the northern High Plains was a May record, 2.19 inches (56.6 mm) above the 20th century average.
- At the state level, average precipitation in every Gulf Coast state was below normal. Georgia had its fifth driest May, while it was sixth driest for Louisiana, eighth driest for both Mississippi and Texas, ninth driest in Florida, and the tenth driest for Alabama.
- A persistent storm track contributed to above normal precipitation for the majority of states across the northern half of the country. Many states were much above normal including: Utah and Wyoming (2nd wettest), Montana (3rd), Vermont (4th), New York (6th tied), and both Ohio and Nebraska (8th tied).
- The overall drought footprint across the contiguous U.S. remained above average, about the same as a month ago, at about 26 percent. The area of the country affected by the two most intense drought categories (Extreme and Exceptional) has increased for fifteen consecutive weeks, a streak dating to mid-February. Much of this very intense drought is focused in the Southern Plains and Southern Rockies.
- According to data from the Storm Prediction Center, tornado activity during May was above average with 368 preliminary tornado reports. This was significantly less than the April 2011 tornado count, despite the fact that May is typically the most active tornado month of the year.
- The EF-5 tornado which hit Joplin, Missouri on May 22nd resulted in 141 fatalities. This was the deadliest single tornado in the modern record (since 1950) and the seventh deadliest tornado of those known to ever affect the United States.
- Climate Highlights - Spring
- A persistent pattern set up during the spring in which the Pacific Northwest and Northern Rockies saw frequent storm systems and invasions of cold air. In the south, storm systems repeatedly developed in the mid-Mississippi Valley, just a few hundred miles from the drought-stricken Southern Plains, then raced northeastward. In general, drought intensified in the south, while much of the Northeast, Ohio Valley and Northwest were subjected to historic or near-historic wetness.
- Persistent and heavy rainfall in the Ohio Valley contributed to historical flooding along the Ohio and Mississippi Rivers. Nine states (Indiana, Kentucky, Ohio, New York, Pennsylvania, Vermont, and West Virginia) in the region had their wettest spring on record. The precipitation values in the Ohio Valley were exceeded only by those in spring 1927, which also produced catastrophic flooding along the Ohio and Mississippi. Additionally, both Washington and Wyoming were record wet.
- Texas had its driest spring (March-May), 6-month period (December-May), and 8-month period (October-May) in the 1895-2011 record. Its statewide-averaged precipitation for spring was a paltry 2.56 inches (65 mm), more than 5 inches (127 mm) below normal. The Lone Star State has not experienced above-average precipitation since September 2010, and each of the spring's three months (March, April, May) delivered bottom-ten precipitation amounts to the Lone Star State. More than half of the state (51 percent) is now designated as in Exception Drought (D4, the most intense category). Nearby, New Mexico had its third-driest spring, while Louisiana had its sixth driest. In contrast, Arkansas, which borders both Texas and Louisiana, had its tenth-wettest spring on record.
- Snowpack in the Northwest and Northern Rockies was much above normal during the late spring, raising concerns about potential flooding once the melt season commenced. The Northwest rather quietly experienced its wettest spring on record with a regional precipitation average that exceeded 10 inches (254 mm) which is 3.76 inches (95.5 mm) above normal. The previous record, 9.39 inches (238.5 mm), was set in 1993.
- Average temperatures were much cooler-than-normal in the Northwest, which had its seventh coolest spring. Within the region, Washington had its third coolest spring and Oregon its fifth coolest.
- Much warmer-than-normal temperatures dominated the South. The average temperature in Texas was 3.7 degrees F (2.1 degrees C) above normal, making this the second warmest spring in Texas, bested only by the 2006 anomaly of 4.3 degrees F (2.4 degrees C). Other states that were much warmer-than-normal included: Delaware (5th warmest), Louisiana (7th), New Mexico (8th) and New Jersey (10th)
- Alaska had its 2nd driest May and its driest spring since records began in 1918.
- The Spring (March - May) Climate Extremes Index was elevated in 2011, primarily the result of extremes in the precipitation indicators. Wet extremes covered approximately one third of the CONUS and extremes in 1-day precipitation were the most extensive on record (1910 - present) (around 16 percent coverage across the CONUS). The number of days experiencing precipitation was also elevated covering more than one third of the CONUS. Extremes in wetness affected a large portion of the Northwest, West North Central and Northeast regions. Dry extremes covered approximately half of the South region, which had its 9th driest spring on record. Extremes in cold maximum temperatures were abundant over the West North Central region, where the average temperature was more than 2 degrees F (1.1 degrees C) cooler than the 20th century average and was the 16th coolest such period on record.
- Climate Highlights - Year-to-Date Period
- For the year-to-date, the nationwide near-average precipitation masks regional extremes that resulted from persistent weather regimes. To date, 2011 has been record dry for New Mexico and exceptionally dry for both Louisiana and Texas. On the flip side, record year-to-date precipitation has fallen in Montana, New York, and Pennsylvania, which broke its previous January-May record by more than two inches.
- Special Report: Spring Extreme Events
- The spring of 2011 brought several historical climatological events to parts of the United States. NCDC released today a special report describing these extreme events:
2011 Spring Extremes
Alaska Temperature and Precipitation:
-
 Alaska
had its 24th warmest May on record, with a temperature 1.4°F (0.8°C) above the 1971–2000 average.
Alaska
had its 24th warmest May on record, with a temperature 1.4°F (0.8°C) above the 1971–2000 average.
-
 Alaska
had its 43rd coldest Spring on record, with a temperature 0.9°F (0.5°C) below the 1971–2000 average.
Alaska
had its 43rd coldest Spring on record, with a temperature 0.9°F (0.5°C) below the 1971–2000 average.
-
 Alaska
had its 42nd warmest year-to-date period on record, with a temperature 0.2°F (0.1°C) below the 1971–2000 average.
Alaska
had its 42nd warmest year-to-date period on record, with a temperature 0.2°F (0.1°C) below the 1971–2000 average.
-
 Alaska
had its 2nd driest May since records began in 1918, with an anomaly that was 50.2 percent below the 1971–2000 average.
Alaska
had its 2nd driest May since records began in 1918, with an anomaly that was 50.2 percent below the 1971–2000 average.
-
 Alaska
had its driest Spring on record, with an anomaly that was 49 percent below the 1971–2000 average.
Alaska
had its driest Spring on record, with an anomaly that was 49 percent below the 1971–2000 average.
-
 Alaska
had its 17th driest year-to-date period on record, with an anomaly that was 15.0 percent below the 1971–2000 average.
Alaska
had its 17th driest year-to-date period on record, with an anomaly that was 15.0 percent below the 1971–2000 average.
For additional details about recent temperatures and precipitation across the U.S., see the Regional Highlights section below. For information on local temperature and precipitation records during the month, please visit NCDC's Records page. For details and graphics on weather events across the U.S. and the globe please visit NCDC's Global Hazards page.
Regional Highlights:
These regional summaries were provided by the six Regional Climate Centers and reflect conditions in their respective regions. These six regions differ spatially from the nine climatic regions of the National Climatic Data Center.
- Northeast Region: (Information provided by the Northeast Regional Climate Center)
- The Northeast averaged warmer than normal in May. The average temperature of 58.8 degrees F (14.9 degrees C) was 2.5 degrees F (1.4 degrees C) above normal. It was the 19th warmest May since 1895. Each of the states in the Northeast had warmer than normal temperature averages; departures ranged from +0.4 degrees F (0.2 degrees C) in Rhode Island to +3.7 degrees F (2.1 degrees C) in Delaware, where it was the 4th warmest May in 117 years. Spring 2011 (March - May) averaged 1.1 degrees F (0.6 degrees C) warmer than normal. The Northeast's average of 46.8 degrees F (8.2 degrees C) made this the 24th warmest spring since 1895. Six states had averages that were within the top 20 warmest in 117 years: Delaware (5th), New Jersey (10th), Maryland (11th), Connecticut (16th), West Virginia (19th), and New Hampshire (20th).
- Precipitation totals averaged above normal for the fourth consecutive month. The region averaged 5.15 inches (131 mm), which was 129 percent of normal. The rainfall pattern this month yielded over 150 percent of the normal amounts in northern and central portions of the region, while coastal areas, including eastern Maryland, southern New Jersey, Rhode Island and Delaware had as little as 25 percent of the normal May total. State averages reflected that pattern, with five states - Delaware, Maryland, Massachusetts, New Jersey and Rhode Island - averaging below normal. Departures ranged from 58 percent of normal in Rhode Island to 172 percent of normal in Vermont. With a total of 16.18 inches 411 mm), the Northeast saw its 2nd wettest spring since 1895. Four states: New York, Pennsylvania, Vermont and West Virginia, had their wettest spring in 117 years; Maine had its 10th wettest. The two smallest states in the region, Delaware and Rhode Island, were the only states to average drier than normal, with 99 and 70 percent, respectively. Overall, the Northeast averaged 145 percent of normal; state departures ranged from the aforementioned 70 percent in Rhode Island to 169 percent of the normal amount in Pennsylvania. Summing up the year-to-date (January through May), it was the wettest in 117 years in New York and Pennsylvania, and the 2nd wettest in the Northeast.
- Wet conditions left their mark on several states in the region. High water from snowmelt and heavy rain flooded lakes and rivers in central New York, causing some municipalities to restrict boating in order to minimize additional damage and erosion. In addition, the normal May 1 opening of the Erie Canal was delayed due to high water. Only the stretch from Rochester westward was opened on time; the rest of the canal was closed through the end of the month. Lake Champlain waters rose to a record 103.2 feet (31.45 m) at Rouses Point, NY on May 6 and remained above the flood stage of 100 ft (30.48 m) through the end of the month. High winds during the month exacerbated the flood damage, driving flood debris into shore-side structures while undermining roads and eroding beaches. The damage to roads, parks and businesses in Vermont, under water for weeks, was conservatively estimated at $6 million. The New York side of Lake Champlain also experienced significant flooding. Damage estimates were unavailable, however, officials expected them to be in the same range as in Vermont. Adding insult to injury, a severe weather outbreak brought high winds, baseball size hail and 3-5 inches (76-127 mm) of rain to northern New York and Vermont on the 26th. Flash flooding from the storms caused at least $1.7 million in damages in St. Johnsbury, VT and $1.0 million in Barre, VT.
- For more information, please go to the Northeast Regional Climate Center Home Page.
- Midwest Region: (Information provided by the Midwest Regional Climate Center)
- Average daily temperatures during May ranged from 1degree to 3 degrees F (0.8 to 1.7 degrees C) below normal in the western half of the region, to near normal to 2 degrees F (1.1 degrees C) above normal in the eastern half of the region. However, this does not really tell the story of temperature variability during the month. The first week of May was generally much colder than normal across the region, while the second week was much warmer than normal. The third and fourth weeks exhibited a pattern much like that for the month - cooler in the west, and warmer in the east.
- Most of the Midwest received normal to above normal rainfall, with the exception of Wisconsin and the Arrowhead of Minnesota, where precipitation was about 75 percent of normal. Rainfall was heaviest from southern Missouri through the Ohio Valley and into the southeastern Great Lakes. The persistent wet weather in this area had a significant impact on spring planting progress. At the end of the month Ohio reported only 19 percent of corn planted, compared to an average of 93 percent, and 7 percent of soybeans planted compared to an average of 76 percent. Planting was also well behind in Indiana and Kentucky. In contrast, Iowa spring planting, which was far behind the normal pace in April, surged ahead of the typical progress in early May with 84% of the corn and 47% of the soybeans planted during a generally dry first two weeks of the month.
- Severe thunderstorms covered the region this month with no state left untouched), and all nine Midwestern states reported tornadoes this month. Storms were frequent in the central and eastern portions of the region. Severe storms were most numerous the last ten days of the month, starting with a major outbreak of severe weather on May 22nd. Joplin, Missouri took a direct hit by an EF5 tornado that resulted in a 14-mile path of devastation, killing 138 people and injuring 1150 others. This tornado ranks as the deadliest single tornado on record for the state of Missouri. Another tornado touching down in Minneapolis, MN resulted in one fatality on that day. Another outbreak of severe weather occurred on May 25th mostly in the southern half of the region. There were more than 1,000 severe weather reports that day, with the majority of those in Missouri, Illinois, Indiana, Kentucky, and Ohio.
- Record flooding on the Ohio River and major flooding on the Mississippi River due to heavy spring rain, and in the case of the Mississippi River, snow melt, gradually subsided during the month. The peak of the flooding for the Midwestern states occurred the first few days of the month. However, streamflows at the end of May were still above normal across the region and some minor to moderate flooding was still occurring on the Mississippi River, the Illinois River, and Wabash River due to heavy rain the last 10 days of the month.
- For details on the weather and climate events of the Midwest, see the weekly summaries in the MRCC Midwest Climate Watch page.
- Southeast Region: (Information provided by the Southeast Regional Climate Center)
- Mean temperatures were generally above normal across the Southeast region in May. Departures from normal ranged from 1-2 degrees F (0.5-1.1 degrees C) across most of Florida, Alabama, and Georgia to 2-4 degrees F (1.1-2.2 degrees C) across the Carolinas and Virginia. In contrast, mean temperatures were 1-2 degrees F (0.5-1.1 degrees C) below normal across Puerto Rico and the U.S. Virgin Islands. Across the Southeast, there were 438 daily maximum and 197 daily high minimum temperature records tied or broken during the month. More than half of these occurred during the last week of the month as a ridge of high pressure settled over the eastern U.S. Waycross, GA recorded a maximum temperature of 104 degrees F (40 degrees C) on the 23rd of the month, making it the highest May temperature ever recorded in a record extending back to 1902. May 31st marked the earliest date in the calendar year that the temperature reached the century mark (100 degrees F) at Greenville, NC in a record extending back to 1928. It also marked only the fourth time that the temperature equaled or exceeded 90 degrees F (32.2 degrees C) in May at Cape Hatteras, NC in a record extending back to 1893. On the 26th of the month, Brunswick, GA and Norfolk, VA set records for the warmest minimum temperature for any day in May with overnight lows of 78 degrees F (25.5 degrees C) and 77 degrees F (25 degrees C), respectively. In contrast, a stretch of unseasonably cool weather resulted in over 500 daily minimum and daily low maximum temperature records either tied or broken between the 5th and 18th of the month. Athens, GA recorded a minimum temperature of 37 degrees F (2.8 degrees C) on the 5th, which tied the lowest temperature ever recorded in May since 1945.
- Precipitation in May was generally below normal across the Southeast, except for small areas in Virginia, North Carolina, and southwest Florida. In some of these areas, training thunderstorms produced prodigious rainfall totals. On the 27th of the month, over 3 inches (76.2 mm) of rain fell in less than two hours across Chapel Hill and Durham, NC, resulting in significant urban flooding. Both Puerto Rico and the U.S. Virgin Islands received above average rainfall for the month. Aibonito, PR, located in the eastern interior of the island, recorded its wettest May on record with 15.3 inches (388.6 mm) of precipitation. In contrast, monthly precipitation totals were less than 50 percent of normal across much of South Carolina, Georgia, Alabama, Florida, and eastern North Carolina. The driest locations (less than 10 percent of normal) were found across portions of the Alabama and north Florida coasts, southwestern Georgia, and eastern South Carolina. It was the second driest May in Charleston, SC and the third driest May in Columbus, GA in records extending back to 1938 and 1948, respectively. Mobile, AL recorded its third driest May on record with only 0.42 inches (10.7 mm) of precipitation, a deficit of close to 6 inches (152.4 mm). On the 18th of the month, Mount Mitchell recorded its latest snowfall in a calendar year since official records began on the mountain in 1980.
- There were 813 reports of severe weather across the Southeast in May, including six confirmed tornadoes in northern Alabama. Most of the reports occurred in two outbreaks. A series of strong storms with damaging wind and large hail tracked southeastward across the Carolinas on the 10th of the month. Numerous reports of baseball and softball-sized hail were reported in Horry County, SC and Brunswick County, NC. A line of strong storms spawned six tornadoes across northern Alabama on the 25th and 26th of the month. Four of the tornadoes were classified as EF-0 and uprooted many trees. An EF-1 tornado destroyed a small barn near the town of Springfield. The most severe tornado was an EF-2 that touched down in Colbert County southeast of Florence. This tornado tore large sections of roofing off several buildings, including the roof of a chicken barn that was tossed over 100 yards (91.4 meters). A separate cluster of strong storms on the 26th produced damaging winds, hail up to softball-size, and frequent lightning across central Georgia. According to the Georgia State Climate Office, three people died from falling trees and more than 200,000 people lost power in the Atlanta metro area.
- The lack of precipitation in May resulted in an increase in drought severity, especially across the southern tier of the region. There was an emergence of severe drought (D2) conditions across the North Carolina coast, extreme drought (D3) conditions across southern Alabama, north Florida, and southern Georgia, and exceptional drought (D4) conditions across parts of southeast Florida. Stream flow and shallow groundwater levels continued to decline across much of the region. Daily record low flows were reported in several streams across eastern sections of Georgia and North Carolina, though no water supply problems were reported. The hot, dry conditions placed stress on numerous crops across the region. The lack of moisture made it difficult to plant peanuts in Alabama and forced many farmers to replant their cotton. There were also widespread reports of heat stress to crops, as well as worm and insect problems.
- For more information, please go to the Southeast Regional Climate Center Home Page.
- High Plains Region: (Information provided by the High Plains Regional Climate Center)
- Temperatures were cool across the High Plains Region this month. Average monthly temperatures were near normal in Kansas and up to 8 degrees F (4.4 degrees C) below normal across Wyoming, the panhandle of Nebraska, and the Dakotas. Each of these areas had locations which ranked in the top 10 coolest Mays on record. In Wyoming, record and near record temperatures were widespread as many locations ranked in the top 5 coolest Mays on record. Medicine Bow, Wyoming, which is located in southern Wyoming, had an average temperature of 43.4 degrees F (6.3 degrees C) which was 6.7 degrees F (3.7 degrees C) below normal. This broke the old record of 43.5 degrees F (6.4 degrees C) which was set just last year (period of record 1949-2011). The cool weather has slowed planting activities and crop progress across large portions of the Region. By the end of the month, crop development was behind average in Nebraska, South Dakota, and North Dakota. According to the National Agricultural Statistics Service, the average starting date for field work in North Dakota was May 7th which was the latest spring start date since 1979. While the cooler weather was a hindrance to much of the planting and crop progress, these conditions helped improve the declining winter wheat crop in Kansas.
- Precipitation varied somewhat across the High Plains Region this month. In general, heavy precipitation occurred from about central Kansas northward, and little to no precipitation fell across parts of southern Colorado and Kansas where drought conditions persisted. Several locations near the Colorado/Kansas border received less than 5 percent of normal precipitation this month and exceptional drought conditions (the highest intensity of drought according to the U.S. Drought Monitor) developed there. The main impact from these dry conditions was the decline in the winter wheat crops. Towards the end of the month, much needed rains fell in many parts of the Region and improved drought conditions. Abnormally dry conditions (D0) were eliminated from Wyoming and nearly all parts of Nebraska. Northeastern Colorado and north-central Kansas had one to two category improvements as well. According to the U.S. Seasonal Drought Outlook released May 19th drought conditions across Colorado and Kansas were expected to improve. Ample precipitation fell in areas of Wyoming, Nebraska, northeastern Colorado, eastern South Dakota, and western areas of the Dakotas. Precipitation in some locations even ranged from 200-300 percent of normal. The recent heavy precipitation, along with mountain snowpack and cool temperatures has increased flooding concerns throughout the High Plains Region. According to the Wyoming State Climate Office, statewide snow water equivalent (SWE) topped 327 percent of normal. In comparison, at the end of last month, the statewide SWE was about 150 percent of normal. Much of the increase in SWE resulted from additional precipitation and cooler temperatures which delayed melting. Record precipitation occurred in parts of Wyoming and Montana this month. Lander, Wyoming had its wettest May on record with 6.79 inches (17 cm) of precipitation. This beat the old record of 6.13 inches (16 cm) set in 2008 (period of record 1891-2011). Interestingly, the May 2011 precipitation was also the 3rd wettest month on record in Lander. The record was set in April 1900 with 7.19 inches (18 cm). Newcastle, Wyoming also recorded its wettest May on record (period of record 1906-2011). 8.29 inches (21 cm) of precipitation fell in Newcastle which was 325 percent of normal. This crushed the old record of 6.00 inches (15 cm) which was recorded in 1991. This new May record also went down as the wettest month. The previous record was set in June 1999 with 6.35 inches (16 cm). According to the U.S. Army Corps of Engineers, reservoir releases from Missouri River reservoirs are forecast to reach unprecedented levels. People living along the Missouri River have already been encouraged to evacuate as significant flooding will impact towns and agricultural lands in the Dakotas. Flooding is also anticipated along the Missouri River down to the Mississippi River. Unfortunately, flooded areas have the potential to be inundated for several months.
- The month of May did not bring any relief to the many flooded areas seen across the state. In northeastern South Dakota, water continued to rise near Waubay, SD, which is surrounded on three sides by Blue Dog Lake, Rush Lake, and Bitter Lake. South Dakota Governor, Dennis Daugaard, visited the area in mid-May to survey the damage and share information with the local residents. Officials shared estimates that Bitter Lake, which has the lower elevation of the three lakes, could possibly rise another two feet before equalizing and in the process spread out over another 1000 acres of land. Many other communities in South Dakota also saw significant flooding impacts. Butte County, including the community of Belle Fourche, saw many roads and water crossings close and the Belle Fourche River reached record levels. The Belle Fourche River was not the only swollen river in northwestern South Dakota as the Little Missouri River near Camp Crook set a new flow record of 20,200 cubic feet per second. A road was breached to protect a bridge on the Little Missouri near Camp Crook. In Hayti, SD Highway 21 south of town became impassable due to Marsh Lake expansion, leaving Hayti only accessible by one road. The Black Hills saw a number of flooding impacts and even had a couple of flash flood warnings during the month of May due to a high amount of rainfall and runoff. The US Forest Service closed a number of campgrounds and roads due to the flooding. At the end of the month, the majority of the attention in the state turned towards communities along the Missouri River, especially the towns of Ft. Pierre, Pierre, and Dakota Dunes. Heavy rains in Montana (Billings reported their wettest month ever in May) on top of already wet conditions and up to 200 percent of seasonal snowpack caused the Army Corp of Engineers to release record amounts of water from the Oahe Dam. The release of water from the dam will peak at 150,000 cubic feet per second by mid-June, which is 30,000 cubic feet more than the original plan. This flow is more than twice the previous record release. This announcement resulted in the activation of a number of South Dakota National Guard members and the start of emergency levee construction and sandbagging. Officials expect more than 3,000 people in Pierre and Fort Pierre to be affected by the rising water. Communities downstream were also warned to begin preparations for flooding. This included the communities of Yankton and Dakota Dunes. As sandbagging began in Yankton, the 2,500 residents of Dakota Dunes were told to prepare to evacuate in the early part of June. Due to the severe flooding experiences across the state of South Dakota so far this year, 28 counties received federal disaster declarations. Damage in the counties included in the declaration is estimated to be $7.1 million.
- For more information, please go to the High Plains Regional Climate Center Home Page.
- Southern Region: (Information provided by the Southern Regional Climate Center)
- For the bulk of the Southern Region, the month of May was a relatively average month with respect to temperature. With the exception of Arkansas and Texas, most of the region averaged within about two degrees F (1.11 degrees C) of the monthly average. State average temperatures in the region were as follows: 67.20 degrees F (19.56 degrees C) in Arkansas, 73.70 degrees F (23.17 degrees C) in Louisiana, 70.50 degrees F (21.39 degrees C) in Mississippi, 67.40 degrees F (19.67 degrees C) in Oklahoma, 65.90 degrees F (18.83 degrees C) in Tennessee, and 74.10 degrees F (23.39 degrees C) in Texas. In Arkansas, temperatures averaged 2-4 degrees F (1.11-2.22 degrees C) below normal, and it was the thirtieth coldest May on record (1895-2011). Conversely, Texas experienced a warmer than normal month, with many stations averaging 2-4 degrees F (1.11-2.22 degrees C) above the monthly average. For Texas, it was the twenty-first warmest May on record (1895-2011).
- With the exception of Arkansas, western Tennessee and northeastern Oklahoma, the month of May was an extremely dry month in the Southern Region. A majority of the region averaged below 50 percent of normal precipitation for the month. The driest areas for the month include western and southern Texas, southern Louisiana and Mississippi. The majority of stations in those areas averaged less than 25 percent of normal precipitation for the month. In the Trans Pecos climate division of Texas, most stations did not see any measurable precipitation for the entire month. In Arkansas, wetter than normal conditions were observed. Many stations in the state, with the exception of the extreme south, reported between 150 to 200 percent of normal values. This was also the case for the western tip of Tennessee and the northeastern corner of Oklahoma. State averaged precipitation totals for the month were as follows: Arkansas received 8.46 inches (214.89 mm), Louisiana received 1.58 (40.13 mm), Mississippi received 1.85 inches (46.99 mm), Oklahoma received 4.18 inches (106.17 mm), Tennessee received 4.87 inches (123.70 mm), and Texas received 1.57 inches (39.88 mm). Arkansas experienced its eleventh wettest May on record (1895-2011). Louisiana experienced its sixth driest May on record (1895-2011), while Mississippi experienced its eighth driest May on record (1895-2011). The only other ranking in the region that fell outside the middle quartiles was in Texas, which experienced its tenth driest May on record (1895-2011).
- Extreme dryness throughout most of the Southern Region has led to little change in drought conditions for the month of May. Unfortunately, most of the precipitation that fell in the region, occurred in areas that were mostly drought-free. Such was the case for Arkansas, Tennessee, and eastern Oklahoma. Within the region, the total areal coverage of drought has changed very little over the past month. In northwestern Texas, drier than normal conditions has led to an expansion of exceptional drought. This was also the case for east-central Texas and west-central Louisiana. Dry conditions prevailed in southern Louisiana, and as a result, much of that region is now experiencing extreme drought conditions. There was some minor improvements in central Oklahoma, with a reduction in the amount of extreme drought there, however; much of the area is still abnormally dry to moderate drought.
- In Texas, the drought has already caused over $1 billion in agricultural losses, a number that is expected to reach the $4 billion mark seen in 2009 if conditions do not improve significantly during the summer of 2011. Wheat production this season has been less than 50% of normal production, with only irrigated crops having any success. Likewise, the outlook is bleak for cotton in most areas with farmers not relying on irrigation delaying planting because of a lack of soil moisture. The overall 2011 cotton yield in both the High Plains and Low Rolling Plains is expected to be between 50-75% of the 2010 cotton yield. The drought has had a large impact on livestock as ranchers across Texas are facing the tough decision of whether to continue the supplemental feeding of cattle or to sell cattle. (Information provided by the Texas State Office of Climatology).
- On May 23, 2011, a tornado in Stewart County, Tennessee led to two injuries. Much of the damage in the storm occurred in the Big Rock area. Damage reports indicate that the storm destroyed a fire station, a post office and dozens of homes.
- On May 24, 2011, dozens of tornadoes ripped through Arkansas, Oklahoma and north-central Texas. In Arkansas one person was killed and four others were injured when a twisted touched down in Johnson County. Numerous homes were damaged. In Oklahoma, four citizens were killed and several were injured due to tornadic activity. The fatalities occurred just west of Oklahoma city. In Piedmont, Oklahoma, three children were injured.
- On May 24, 2011, a massive hailstorm caused significant damage to more than 50 American Airlines aircraft at Dallas-Fort Worth International Airport, leadings to hundreds of delays and cancellations. A spokesperson with the Southwestern Insurance Information Service expects as much as $800 million in insurance claims due to the severe weather in North Central Texas during May. (Information provided by the Texas State Office of Climatology).
- The major weather story for the month of May in the Southern Region is the flooding of the Mississippi River. In total, this particular flood affected four states in our region (Tennessee, Mississippi, Arkansas and Louisiana) and proved to be one of the most devastating floods in the Mississippi basin. Flood stage records were set all along the waterway and flooding is comparable to what was experienced in 1993, and more historically speaking, the flood of 1927. The flood was the primary result of heavy precipitation totals in April coupled with a heavy spring snowmelt runoff. In Tennessee, the city of Dyersburg experienced extreme flooding. Hundreds of homes and businesses were flooded. The flooding there was so extreme that the Forked Deer River experienced reverse flow, in that the river was flowing backwards. In Memphis, over 5000 citizens were asked to evacuate. In Arkansas, levee breaks on the Black River caused major flooding in the Pocahontas area. Arkansas Online reported that flooding had resulted in at least three feet of standing water in areas between Pocahontas and Portia. The site also reported that in Pocahontas, at least 100 homes were flooded when a levee break resulted in four feet of standing water in the Robil subdivision. In Mississippi, every county that borders the Mississippi River was declared a federal disaster area. In Tunica County, flooding resulted in at least six feet of standing water. The Mississippi town of Vicksburg observed a river crest of 57.1 feet (17.40 m); the highest ever for the Mississippi River at that reach. The previous record was 56.2 feet (17.12 m), which was set during the flood of 1927. The Mississippi river was even higher in Natchez, with a record crest of 61.9 feet (18.87 m). The previous record was 58.0 feet (17.68 m), set in February, 1937. In Louisiana, heavy loads on the Mississippi river led to the opening of the Bonnet Carre Spillway on May 9, 2011. This spillway acts to divert water out of the Mississippi River and into Lake Pontchartrain. The spillway is located just upstream of New Orleans. Because the Mississippi River discharge approached 1.5 million cubic feet per second (42,000 cubic meters per second) at Baton Rouge, the Corps of Engineers opened the Morganza Spillway. The spillway is located in Pointe Coupee Parish and had only been opened once before in 1973. The spillway is designed to divert water out of the Mississippi River and into the Atchafalya Basin. In an attempt to spare localities in the lower Atchafalya, only a small handful of gates were opened. The combined efforts in opening both spillways saved the cities of Baton Rouge and New Orleans. In Baton Rouge, the Mississippi River crested between 43 and 44 feet (13.11 and 13.41 m), while in New Orleans, it crested just under 17 feet (5.18 m).
- For more information, please go to the Southern Regional Climate Center Home Page.
- Western Region: (Information provided by the Western Regional Climate Center)
- Cool and wet were two words that described May's weather in Montana. The wet conditions eventually led to major flooding over most of the state at some point during the month. A split westerly flow, with trough of low pressure aloft (Fig. 2) produced regular disturbances with moisture to provide large amounts of rainfall, mainly to eastern Montana. During May, temperatures averaged from near normal around Anaconda, to much below normal across the eastern one-half of the state. Precipitation totals varied widely, with highest amounts in the central and east.
- Temperatures across the state (Fig. 1) in May averaged 48.7F, over four degrees below average. This produced the 12th coolest May. May 2010 was one degree cooler than May 2011. Temperatures averaged coolest across southeastern Montana (Fig. 3). This was the fourth consectutive month of below normal temperatures. Seventy degree temperatures were scarse during the month. Glasgow reached only 70F on the 16th. The last time the temperature at Glasgow did not warm above 70F in May was in 1902. They did reach the 70s in April 1902, however. This was the first time that Lewistown has not been 70F or warmer in May since records began in 1896. The old record was May 29, 1995.
- Precipitation was above average most areas (Fig. 1), especially across the eastern one-half of the state. Below normal areas were primarily west of the divide. The statewide average of 4.65 inches was a 2.00-inch surplus or 181 percent of average for the month. This was the wettest of record, and the seventh consecutive month of above normal precipitation. The precipitation excess over the average in the past 12 months is 5.99 inches. Precipitation anomalies were greatest over the eastern one-half of the state (Fig. 4). Over the Rockies, deep snowpack remained at some locations. Some areas actually added to their snowpack during the month, with Placer Basin picking up 21 inches on the 20th and 13 inches on the 29th. Albro Lake, in the Tobacco Roots, measured 21 inches of new snow on the 29th. Snow-on-ground totals were 110-140 inches at a few higher locations
See NCDC's Monthly Records web-page for weather and climate records for the most recent month. For additional national, regional, and statewide data and graphics from 1895-present, for any period, please visit the Climate at a Glance page.
PLEASE NOTE: All of the temperature and precipitation ranks and values are based on preliminary data. The ranks will change when the final data are processed, but will not be replaced on these pages. Graphics based on final data are provided on the Temperature and Precipitation Maps page and the Climate at a Glance page as they become available.