Global Highlights
- The combined average temperature over global land and ocean surfaces for November 2013 was record highest for the 134-year period of record, at 0.78°C (1.40°F) above the 20th century average of 12.9°C (55.2°F).
- The global land surface temperature was 1.43°C (2.57°F) above the 20th century average of 5.9°C (42.6°F), the second highest for November on record, behind 2010. For the global oceans, the November average sea surface temperature was 0.54°C (0.97°F) above the 20th century average of 15.8°C (60.4°F), tying with 2009 as the third highest for November.
- The combined global land and ocean average surface temperature for the September–November period was 0.68°C (1.22°F) above the 20th century average of 14.0°C (57.1°F), the second warmest such period on record, behind only 2005.
- The September–November worldwide land surface temperature was 1.08°C (1.94°F) above the 20th century average, the third warmest such period on record. The global ocean surface temperature for the same period was 0.52°C (0.94°F) above the 20th century average, tying with 2009 and 2012 as the fourth warmest September–November on record.
- The combined global land and ocean average surface temperature for the year-to-date (January–November) was 0.62°C (1.12°F) above the 20th century average of 14.0°C (57.2°F), tying with 2002 as the fourth warmest such period on record.
Introduction
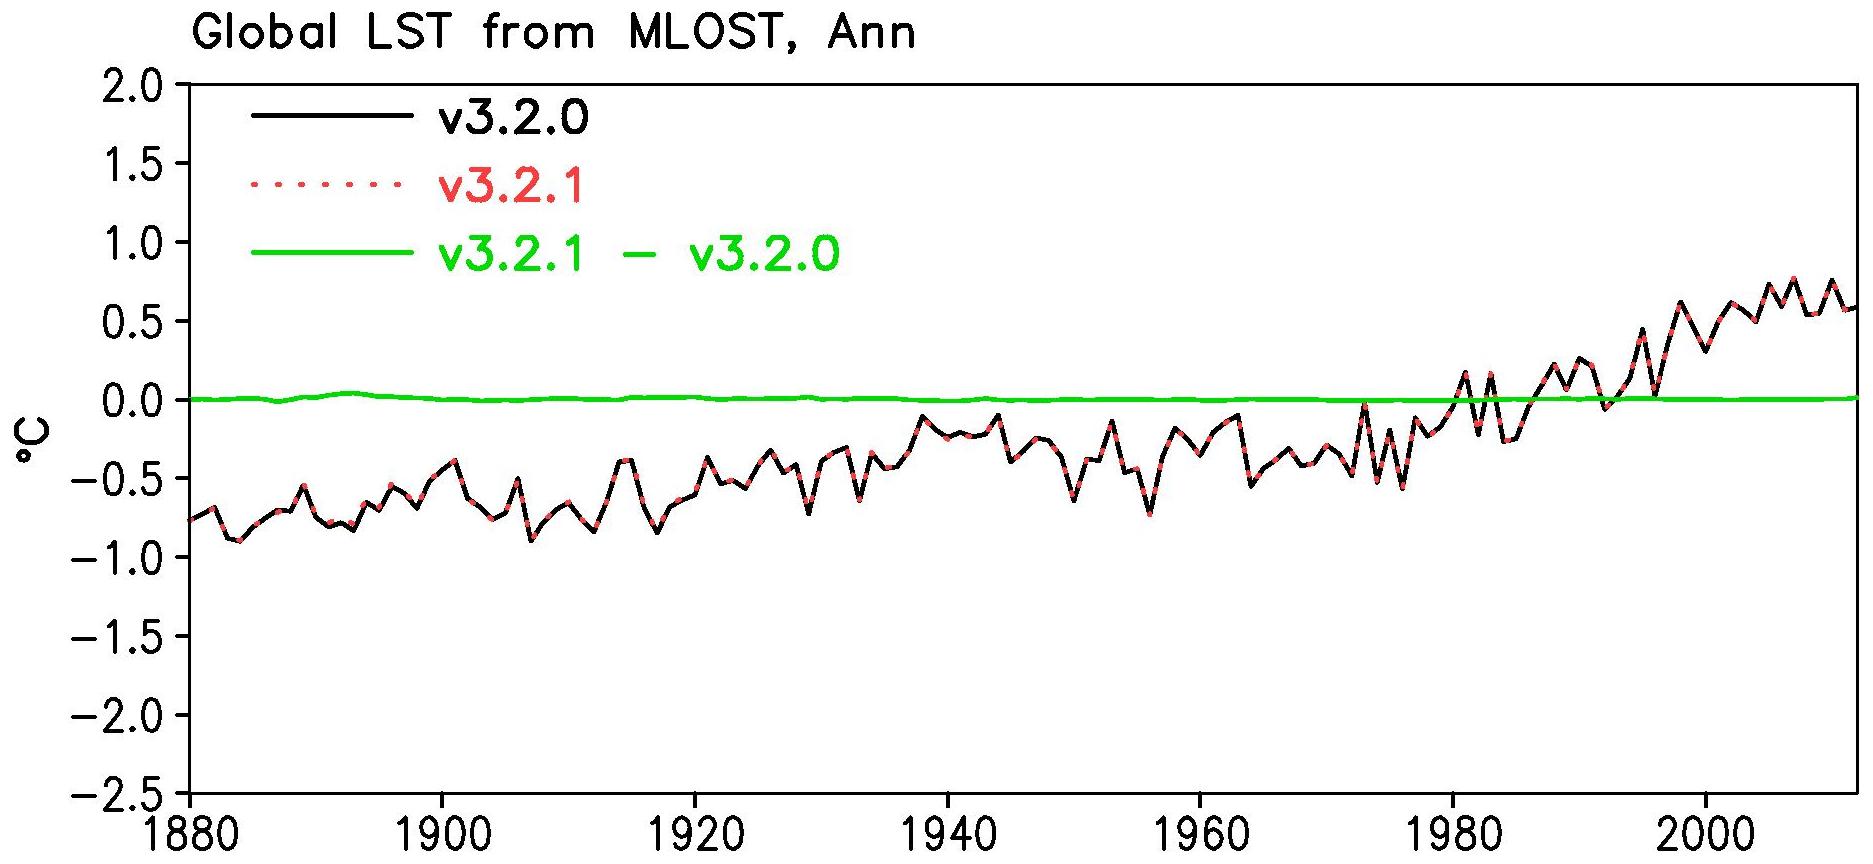
Temperature anomalies and percentiles are shown on the gridded maps below. The anomaly map on the left is a product of a merged land surface temperature (Global Historical Climatology Network, GHCN) and sea surface temperature (ERSST.v3b) anomaly analysis developed by Smith et al. (2008). Temperature anomalies for land and ocean are analyzed separately and then merged to form the global analysis. For more information, please visit NCDC's Global Surface Temperature Anomalies page. The November 2013 Global State of the Climate report introduces percentile maps that complement the information provided by the anomaly maps. These new maps on the right provide additional information by placing the temperature anomaly observed for a specific place and time period into historical perspective, showing how the most current month, season, or year compares with the past.
Temperatures
In the atmosphere, 500-millibar height pressure anomalies correlate well with temperatures at the Earth's surface. The average position of the upper-level ridges of high pressure and troughs of low pressure—depicted by positive and negative 500-millibar height anomalies on the  November 2013 and
  September–November 2013 maps—is generally reflected by areas of positive and negative temperature anomalies at the surface, respectively.
November
The average temperature across global land and ocean surfaces during November 2013 was record highest for November in the 134-year period of record, at 0.78°C (1.40°F) above the 20th century average. This surpasses the previous record set in 2004 by 0.03°C (0.05°F) and is also the sixth highest monthly departure from average among all months on record and the highest since March 2010, one of the last months in which El Niño conditions were present in the eastern and central equatorial Pacific Ocean. During November, warmer-than-average temperatures across most of the world's ocean surfaces contributed to the anomalous warmth. Even with ENSO-neutral conditions holding for the 19th straight month, the November global ocean temperature tied with 2009 as the third highest for November, at 0.54°C (0.97°F) above the 20th century average. Regionally, the tropical oceans (20°N–20°S) were 10th warmest on record for November, while the Northern and Southern Hemisphere oceans above 20° latitude (outside the tropics) both tied as second warmest, at 0.64°C (1.15°F) and 0.53°C (0.95°F) above their long-term averages, respectively. With respect to specific areas, according to the Land & Ocean Temperature Percentiles map above, parts of the north east and south west Pacific, small sections of the eastern Atlantic Ocean, and various sections of the Indian Ocean, including much of the south central portion, were record warm for November. Many other regions across all of the oceans were much warmer than average. NOAA's Climate Prediction Center forecasts ENSO-neutral conditions to continue in the central and eastern equatorial Pacific Ocean into the Northern Hemisphere summer 2014.
Most of the world's land areas experienced warmer-than-average monthly temperatures, including much of Eurasia, coastal Africa, Central America, and central South America. Much of southern Russia, north west Kazakhstan, south India, and southern Madagascar were record warm. Meanwhile, northern Australia, parts of North America, south west Greenland, and parts of the Southern Ocean near South America were cooler than average. No regions of the globe were record cold. Overall, the globally-averaged temperature over land surfaces was the second highest for November in the 134-year period of record, at 1.43°C (2.57°F) above the 20th century average.
Select national information is highlighted below:- According to Roshydromet, Russia observed its warmest November since national records began in 1891. Some areas of the Urals, Siberia, south of the Far East region, and on the Arctic islands in the Kara Sea had temperatures that were more than 8°C (14°F) higher than the monthly average.
- The average November temperature across the United Kingdom was 0.7°C (1.3°F) below the 1981–2010 average.
- Spain was 0.5°C (0.9°F) below the 1971–2000 average temperature for the month, although the first half was 2°–3°C (4°–5°F) above average while the second half was 3°–4°C (5°–7°F) below average, the coolest such period since 1985.
- The average November temperature across Norway was 1.5°C (2.7°F) higher than the 1981–2010 average, with some regions 2°–3°C (4°–5°F) above average.
- The average temperature was higher than the 1971–2000 average across all of Hungary for November, with departures up to +3°C (+5°F) in the western half and more than +4°C (+7°F) in the far east.
- November temperatures were 3.9°–5.2°C (7.0°–9.4°F) above average across the Republic of Moldova. According to Serviciul Hidrometeorologic de Stat, this type of event in the north occurs every 20–30 years and every 10–15 years in the south.
- According to the Fiji Meteorological Service, most regions of the country were considerably warmer than the 1971–2000 average, with maximum and minimum temperature anomalies exceeding 1°C (1.8°F) at more than half of the 21 official monitoring stations. New November monthly warm minimum temperature records were set at four stations, with periods of records ranging from 35 to 71 years.
- Croatia was "very warm" (91st– 98th percentile) in part of the north and across the south and "warm" across much of the remainder of the country, according to Državni hidrometeorološki zavod. No regions were considered "cold".
| November | Anomaly | Rank (out of 134 years) | Records | ||||
|---|---|---|---|---|---|---|---|
| °C | °F | Year(s) | °C | °F | |||
| Global | |||||||
| Land | +1.43 ± 0.11 | +2.57 ± 0.20 | Warmest | 2nd | 2010 | +1.62 | +2.92 |
| Coolest | 133rd | 1892 | -0.95 | -1.71 | |||
| Ocean | +0.54 ± 0.04 | +0.97 ± 0.07 | Warmest | 3rd | 1997 | +0.56 | +1.01 |
| Coolest | 132nd | 1909 | -0.49 | -0.88 | |||
| Ties: 2009 | |||||||
| Land and Ocean | +0.78 ± 0.07 | +1.40 ± 0.13 | Warmest | 1st | 2013 | +0.78 | +1.40 |
| Coolest | 134th | 1907 | -0.52 | -0.94 | |||
| Northern Hemisphere | |||||||
| Land | +1.70 ± 0.11 | +3.06 ± 0.20 | Warmest | 2nd | 2010 | +2.02 | +3.64 |
| Coolest | 133rd | 1892 | -1.19 | -2.14 | |||
| Ocean | +0.58 ± 0.05 | +1.04 ± 0.09 | Warmest | 4th | 2006 | +0.67 | +1.21 |
| Coolest | 131st | 1909, 1912 | -0.52 | -0.94 | |||
| Land and Ocean | +1.00 ± 0.08 | +1.80 ± 0.14 | Warmest | 2nd | 2010 | +1.04 | +1.87 |
| Coolest | 133rd | 1892 | -0.73 | -1.31 | |||
| Southern Hemisphere | |||||||
| Land | +0.72 ± 0.11 | +1.30 ± 0.20 | Warmest | 12th | 2009 | +1.23 | +2.21 |
| Coolest | 123rd | 1917 | -0.76 | -1.37 | |||
| Ties: 1995, 2011 | |||||||
| Ocean | +0.51 ± 0.04 | +0.92 ± 0.07 | Warmest | 3rd | 1997 | +0.57 | +1.03 |
| Coolest | 132nd | 1910 | -0.45 | -0.81 | |||
| Land and Ocean | +0.55 ± 0.06 | +0.99 ± 0.11 | Warmest | 4th | 2009 | +0.65 | +1.17 |
| Coolest | 131st | 1910 | -0.49 | -0.88 | |||
| Ties: 2003 | |||||||
| Arctic | |||||||
| Land and Ocean | +2.01 ± 0.63 | +3.62 ± 1.13 | Warmest | 3rd | 2010 | +2.36 | +4.25 |
| Coolest | 132nd | 1890 | -2.43 | -4.37 | |||
Seasonal (September–November)
September–November (Northern Hemisphere fall / Southern Hemisphere spring) was the second warmest such period across global land and ocean surfaces since records began in 1880, behind only 2005, at 0.68°C (1.22°F) above the 20th century average. The Northern Hemisphere was also second warmest, while the Southern Hemisphere was fourth warmest for the period.
Globally, the average ocean temperature for September–November was the fourth highest on record for the period, at 0.58°C (1.04°F) above average. As indicated by the Land & Ocean Temperature Percentiles map above, very few regions were below average, most notably the Southern Ocean off the tip of South America. Many areas were much warmer than average, with sections of the eastern Atlantic, parts of the south central and southeast Indian Ocean, and parts of the south central and western equatorial Pacific Ocean observing record warmth.
The average land surface temperature was third highest on record for September–November. The Northern Hemisphere fall was third warmest for the period, while the Southern Hemisphere spring temperature was fourth warmest on record. Parts of Southern Australia, southern Pakistan, a section of north east Kazakhstan, and eastern Tanzania were record warm. No region of the world's land areas was record cold, although part of south west Greenland was much cooler than average, as shown by the Percentiles map.
Select national information is highlighted below:- Record warmth continued in Australia towards the latter part of 2013, as the country observed its highest average and maximum spring (September–November) temperatures in its 104-year period of record at 1.57°C (2.83°F) and 2.07°C (3.73°F) above the 1961–1990 average, respectively. The nationally-averaged minimum spring temperature was fourth highest on record, at 1.07°C (1.93°F) above normal.
- Fall was 1.4°C (2.5°F) above the 1981–2010 average in Norway, with the southern mountains and some regions in the north observing temperature departures above average of +2.0°C (+3.6°F).
| September–November | Anomaly | Rank (out of 134 years) | Records | ||||
|---|---|---|---|---|---|---|---|
| °C | °F | Year(s) | °C | °F | |||
| Global | |||||||
| Land | +1.08 ± 0.18 | +1.94 ± 0.32 | Warmest | 3rd | 2005 | +1.21 | +2.18 |
| Coolest | 132nd | 1881, 1912 | -0.77 | -1.39 | |||
| Ocean | +0.52 ± 0.04 | +0.94 ± 0.07 | Warmest | 4th | 2003 | +0.57 | +1.03 |
| Coolest | 131st | 1909 | -0.46 | -0.83 | |||
| Ties: 2009, 2012 | |||||||
| Land and Ocean | +0.68 ± 0.09 | +1.22 ± 0.16 | Warmest | 2nd | 2005 | +0.69 | +1.24 |
| Coolest | 133rd | 1912 | -0.52 | -0.94 | |||
| Northern Hemisphere | |||||||
| Land | +1.15 ± 0.18 | +2.07 ± 0.32 | Warmest | 3rd | 2005 | +1.36 | +2.45 |
| Coolest | 132nd | 1912 | -0.96 | -1.73 | |||
| Ocean | +0.58 ± 0.04 | +1.04 ± 0.07 | Warmest | 4th | 2006 | +0.65 | +1.17 |
| Coolest | 131st | 1912 | -0.53 | -0.95 | |||
| Land and Ocean | +0.79 ± 0.11 | +1.42 ± 0.20 | Warmest | 2nd | 2005 | +0.87 | +1.57 |
| Coolest | 133rd | 1912 | -0.69 | -1.24 | |||
| Southern Hemisphere | |||||||
| Land | +0.92 ± 0.15 | +1.66 ± 0.27 | Warmest | 4th | 2009 | +1.02 | +1.84 |
| Coolest | 131st | 1905 | -0.57 | -1.03 | |||
| Ocean | +0.49 ± 0.04 | +0.88 ± 0.07 | Warmest | 5th | 1997 | +0.58 | +1.04 |
| Coolest | 130th | 1910 | -0.43 | -0.77 | |||
| Ties: 2002 | |||||||
| Land and Ocean | +0.56 ± 0.07 | +1.01 ± 0.13 | Warmest | 4th | 1997 | +0.63 | +1.13 |
| Coolest | 131st | 1910 | -0.45 | -0.81 | |||
| Ties: 2002 | |||||||
| Arctic | |||||||
| Land and Ocean | +1.16 ± 0.25 | +2.09 ± 0.45 | Warmest | 4th | 2005 | +1.60 | +2.88 |
| Coolest | 131st | 1902 | -1.34 | -2.41 | |||
| Ties: 2008 | |||||||
The most current data November be accessed via the Global Surface Temperature Anomalies page.
Year-to-date (January–November)
...
The globally-averaged temperature across land and ocean surfaces for the first eleven months of 2013 (January–November) was 0.62°C (1.06°F) above the 20th century average, tying with 2002 as the fourth warmest January–November on record. The average global land temperature for this period also tied with 2002 as the fourth highest on record, at 0.98°C (1.82°F) above the long-term average, while the average global ocean temperature tied with 2006 as the eighth warmest in the 134-year period of record, at 0.48°C (0.86°F) above average. ENSO-neutral conditions were present in the eastern and central equatorial Pacific Ocean during the entire year-to-date (this phase began in April 2012). The record warmest January–November (0.68°C / 1.22°F above average) occurred in 2010, when a warm El Niño phase was present during January–April before transitioning to La Niña conditions during the summer. Images of sea surface temperature conditions are available from the weekly SST page.
| January–November | Anomaly | Rank (out of 134 years) | Records | ||||
|---|---|---|---|---|---|---|---|
| °C | °F | Year(s) | °C | °F | |||
| Global | |||||||
| Land | +0.98 ± 0.21 | +1.76 ± 0.38 | Warmest | 4th | 2010 | +1.12 | +2.02 |
| Coolest | 131st | 1884 | -0.62 | -1.12 | |||
| Ties: 2002 | |||||||
| Ocean | +0.48 ± 0.04 | +0.86 ± 0.07 | Warmest | 8th | 1998 | +0.53 | +0.95 |
| Coolest | 127th | 1911 | -0.46 | -0.83 | |||
| Ties: 2006 | |||||||
| Land and Ocean | +0.62 ± 0.10 | +1.12 ± 0.18 | Warmest | 4th | 2010 | +0.68 | +1.22 |
| Coolest | 131st | 1911 | -0.46 | -0.83 | |||
| Ties: 2002 | |||||||
| Northern Hemisphere | |||||||
| Land | +1.01 ± 0.26 | +1.82 ± 0.47 | Warmest | 6th | 2007, 2010 | +1.22 | +2.20 |
| Coolest | 129th | 1884 | -0.72 | -1.30 | |||
| Ocean | +0.52 ± 0.05 | +0.94 ± 0.09 | Warmest | 4th | 2005 | +0.56 | +1.01 |
| Coolest | 131st | 1910 | -0.47 | -0.85 | |||
| Ties: 2003 | |||||||
| Land and Ocean | +0.70 ± 0.15 | +1.26 ± 0.27 | Warmest | 4th | 2010 | +0.79 | +1.42 |
| Coolest | 131st | 1912, 1913 | -0.46 | -0.83 | |||
| Southern Hemisphere | |||||||
| Land | +0.88 ± 0.12 | +1.58 ± 0.22 | Warmest | 3rd | 2005 | +0.93 | +1.67 |
| Coolest | 132nd | 1917 | -0.66 | -1.19 | |||
| Ocean | +0.47 ± 0.04 | +0.85 ± 0.07 | Warmest | 6th | 1998 | +0.55 | +0.99 |
| Coolest | 129th | 1911 | -0.49 | -0.88 | |||
| Ties: 2001, 2004, 2005, 2006 | |||||||
| Land and Ocean | +0.53 ± 0.07 | +0.95 ± 0.13 | Warmest | 7th | 1998 | +0.60 | +1.08 |
| Coolest | 128th | 1911 | -0.49 | -0.88 | |||
| Arctic | |||||||
| Land and Ocean | +0.84 ± 0.13 | +1.51 ± 0.23 | Warmest | 12th | 2007 | +1.37 | +2.47 |
| Coolest | 123rd | 1902 | -1.17 | -2.11 | |||
The most current data November be accessed via the Global Surface Temperature Anomalies page.
Precipitation
The maps below represent precipitation percent of normal (left) and precipitation percentiles (right) based on the GHCN dataset of land surface stations using a base period of 1961–1990. As is typical, precipitation anomalies during November 2013 varied significantly around the world. As indicated by the November precipitation percentiles map below, record wetness was observed during November over sections of coastal China, central Japan, north central Australia, and north central Mexico. Record dryness was scattered across different parts of the globe, including some small sections of coastal South America, parts of north west Africa, a few regions of central and southern Asia, and parts of far west and southern Australia.
- Austria observed precipitation that was 160 percent of the 1981–2010 average for November, making this the country's wettest November since 2002. Regions from Unterkärnten to Middle Burgenland had November precipitation totals that were their highest since 1949.
- The September–November period was about 40 percent wetter than average across The Netherlands. De Bilt had its third wettest fall since records began in 1906.
References
- Peterson, T.C. and R.S. Vose, 1997: An Overview of the Global Historical Climatology Network Database. Bull. Amer. Meteorol. Soc., 78, 2837-2849.
- Quayle, R.G., T.C. Peterson, A.N. Basist, and C. S. Godfrey, 1999: An operational near-real-time global temperature index. Geophys. Res. Lett., 26, 333-335.
- Smith, T.M. and R.W. Reynolds, 2005: A global merged land air and sea surface temperature reconstruction based on historical observations (1880-1997), J. Clim., 18, 2021-2036.
- Smith et al., 2008, Improvements to NOAA's Historical Merged Land-Ocean Surface Temperature Analysis (1880-2006), J. Climate., 21, 2283-2293.