NH Snow Cover Extent
| March 2015 | Snow Cover Extent | Anomaly 1991-2020 | Trend per decade | Rank (49 years) | Record | ||||||
|---|---|---|---|---|---|---|---|---|---|---|---|
| million km² | million mi² | million km² | million mi² | million km² | million mi² | Year(s) | million km² | million mi² | |||
| Northern Hemisphere | 38.46 | 14.85 | -1.33 | -0.51 | -0.43 | -0.17 | Largest | 43rd | 1985 | 44.28 | 17.10 |
| Smallest | 7th | 1990 | 37.12 | 14.33 | |||||||
| North America | 15.06 | 5.81 | -0.64 | -0.25 | -0.05 | -0.02 | Largest | 40th | 1969 | 17.29 | 6.68 |
| Smallest | 11th | 1968 | 14.04 | 5.42 | |||||||
| Ties: 2010 | |||||||||||
| Eurasia | 23.40 | 9.03 | -0.69 | -0.27 | -0.37 | -0.14 | Largest | 41st | 1981 | 27.95 | 10.79 |
| Smallest | 9th | 2002 | 21.18 | 8.18 | |||||||
Data Source: Global Snow Laboratory, Rutgers University. Period of record: 1967–2015 (49 years)

During March 2015, the Northern Hemisphere snow cover extent (SCE) was 38.46 million square km (14.85 million square miles), 1.67 million square km (640,000 square miles) below the 1981-2010 average. This was the seventh smallest March SCE in the 49-year period of record for the Northern Hemisphere and was slightly larger than the SCE of the previous March in 2014. Both North America and Eurasia had below average SCE.
The March North American SCE was 15.06 million square km (5.82 million square miles), 580,000 square km (220,000 square miles) below average and tied 2010 as the 10th smallest on record. For March, the contiguous U.S. SCE was the fifth smallest on record, the Alaska SCE tied the 14th smallest on record, while the Canada SCE was slightly above average. Below-average snow cover was observed across the western two-thirds of the contiguous U.S., southwestern parts of Canada, and in southern Alaska. Above-average snow cover was observed across the Canadian Rockies, the Great Lakes region, and in the northeastern United States.
The Eurasian SCE during March was 23.40 million square km (9.03 million square miles), 1.09 million square km (420,000 square miles) below average. This was the ninth smallest March SCE on record for Eurasia. Below-average snow cover was observed across most of Europe, with the exception of the Alps, western Iran, northern China, and much of Mongolia. Above-average snow cover was observed across Kazakhstan, northeastern China, parts of the Tibetan Plateau and the Himalayas.
Sea Ice Extent
| March 2015 | Sea Ice Extent | Anomaly 1991-2020 | Trend per decade | Rank (37 years) | Record | ||||
|---|---|---|---|---|---|---|---|---|---|
| million km² | million mi² | Year(s) | million km² | million mi² | |||||
| Northern Hemisphere | 14.37 | 5.55 | -4.39% | -2.53% | Largest | 37th | 1979 | 16.34 | 6.31 |
| Smallest | 1st | 2015 | 14.37 | 5.55 | |||||
| Southern Hemisphere | 4.96 | 1.92 | +21.57% | +5.39% | Largest | 3rd | 2008 | 5.28 | 2.04 |
| Smallest | 35th | 2006 | 3.21 | 1.24 | |||||
| Globe | 19.33 | 7.46 | +1.15% | -0.84% | Largest | 23rd | 2008 | 20.46 | 7.90 |
| Smallest | 15th | 2006 | 17.63 | 6.81 | |||||
| Ties: 1980 | |||||||||
Data Source: National Snow and Ice Data Center (NSIDC). Period of record: 1979–2015 (37 years)

According to the National Snow and Ice Data Center (NSIDC), the Northern Hemisphere sea ice extent — which is measured from passive microwave instruments onboard NOAA satellites — averaged for March 2015 was 14.39 million square km (5.56 million square miles), 1.13 million square km (430,000 square miles), or 7.28 percent, below the 1981-2010 average. This was the smallest March Arctic sea ice extent on record and 60,000, square km (20,000 square miles) smaller than the previous record set in 2006. Typically during March sea ice in the Arctic grows early in the month, reaches the annual maximum in mid-month, and shrinks at the end of the month. This year, the Arctic sea ice extent reached its annual maximum in late February and was nearly constant throughout the entire month of March. The sea ice extent varied less than 300,000 square km (116,000 square miles) throughout the month. When sea ice was averaged for March, below average ice coverage was observed across most of the Pacific side of the Arctic, particularly in the Sea of Okhotsk. Below-average ice coverage was also observed in the Barents Sea. Above-average sea ice extent was observed on the Atlantic side in Baffin Bay and off the coast of Newfoundland. For March, the Arctic sea ice extent is decreasing at an average rate of 2.58 percent per decade.
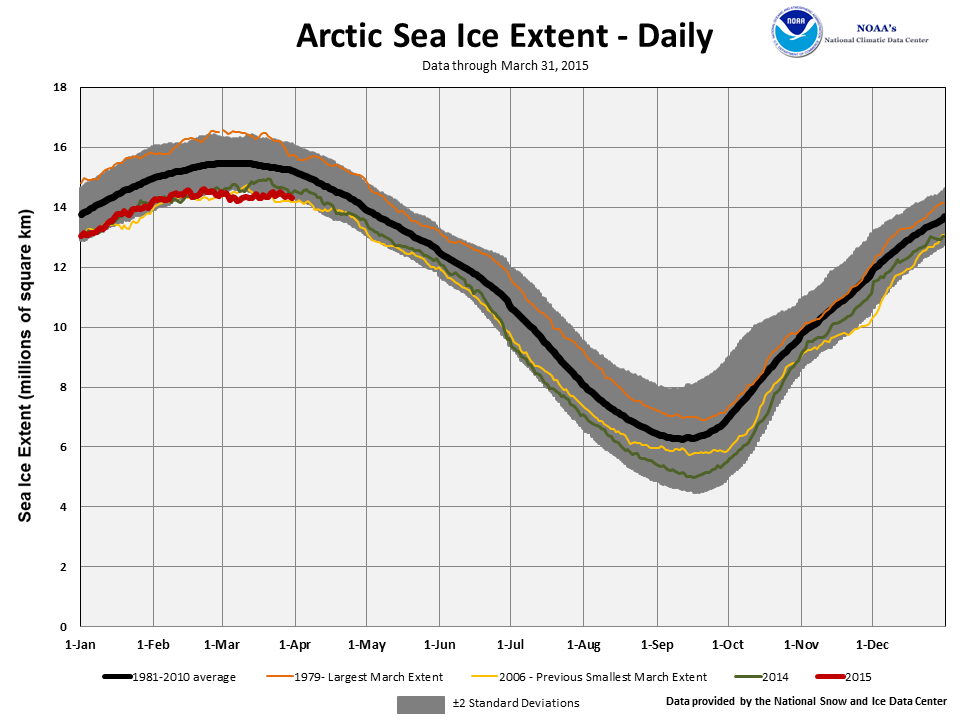
The annual maximum sea ice extent for the Arctic occurred on February 25th at 14.54 million square km (5.61 million square miles). This was the lowest maximum Arctic sea ice extent in the satellite record. Below-average ice was experienced in most regions with the exception of the Labrador Sea and the Davis Strait. The maximum extent is 1.10 million square km (425,000 square miles) below the 1981-2010 average and 130,000 square km (50,200 square miles) below the previous record smallest annual maximum that occurred in 2011. The February 25th date of the maximum was 15 days earlier than the 1981-2010 average of March 12. The earliest date of the annual maximum was February 24th in 1996. Since the annual maximum has occurred, Arctic sea ice will continue to decline during the spring and summer and reach its annual minimum in September.
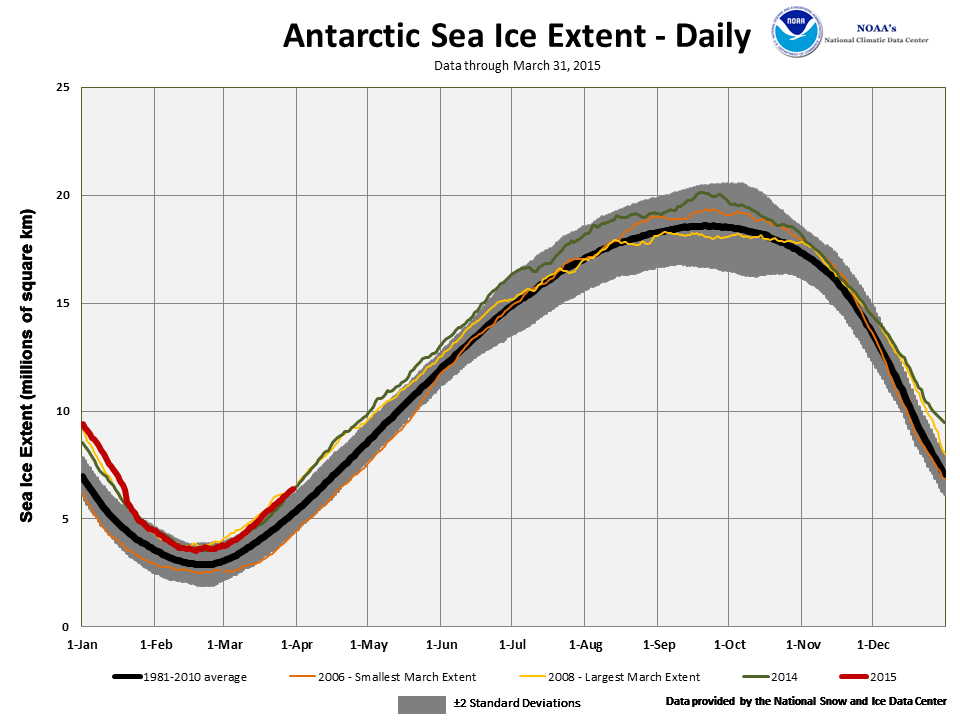
The March 2015 Southern Hemisphere sea ice extent was 5.48 million square km (2.12 million square miles), 1.07 million square km (420,000 square miles), or 24.26 percent, above the 1981-2010 average. This was the second largest March Antarctic sea ice extent on record. The record largest March Antarctic sea ice extent occurred in 2008 at 5.74 million square km (2.22 million square miles). Antarctic sea ice extent during March is increasing at an average rate of 5.0 percent per decade.
When combining the Northern and Southern Hemisphere sea ice extents, the globally-averaged sea ice extent during March was 19.87 million square km (7.67 million square miles), 0.3 percent below the 1981-2010 average. This was the smallest March global sea ice extent since 2011. Global sea ice extent during March is decreasing at an average rate of 0.9 percent per decade.
For further information on the Northern and Southern Hemisphere snow and ice conditions, please visit the NSIDC News page.