NH Snow Cover Extent
| January 2015 | Snow Cover Extent | Anomaly 1991-2020 | Trend per decade | Rank (49 years) | Record | ||||||
|---|---|---|---|---|---|---|---|---|---|---|---|
| million km² | million mi² | million km² | million mi² | million km² | million mi² | Year(s) | million km² | million mi² | |||
| Northern Hemisphere | 47.32 | 18.27 | +0.08 | +0.03 | +0.12 | +0.05 | Largest | 22nd | 2008 | 50.28 | 19.41 |
| Smallest | 28th | 1981 | 41.89 | 16.17 | |||||||
| North America | 17.37 | 6.71 | -0.22 | -0.08 | -0.02 | -0.01 | Largest | 30th | 1985 | 18.82 | 7.27 |
| Smallest | 18th | 1981 | 16.07 | 6.20 | |||||||
| Ties: 1975, 2014 | |||||||||||
| Eurasia | 29.96 | 11.57 | +0.31 | +0.12 | +0.14 | +0.05 | Largest | 18th | 2008 | 32.27 | 12.46 |
| Smallest | 32nd | 1981 | 25.82 | 9.97 | |||||||
Data Source: Global Snow Laboratory, Rutgers University. Period of record: 1967–2015 (49 years)

The Northern Hemisphere snow cover extent (SCE) during January was 47.32 million square km (18.27 million square miles), 450,000 square km (170,000 square miles) above the 1981-2010 average. This was the 22nd largest January SCE in the 49-year period of record for the Northern Hemisphere. The North American SCE was below average while the Eurasian SCE was above average.
During January, the North American SCE was 17.37 million square km (6.71 million square miles), 170,000 square km (60,000 square miles) below average. This was the 23rd largest January SCE on record and slightly smaller than the SCE the previous January in 2014. The January contiguous U.S. SCE was below average and the 18th smallest on record, while the Canadian SCE was slightly above average. Below-average snow cover was observed across the southern Canadian Rockies, much of the western U.S., and parts of the Ohio River Valley. Above-average snow cover was observed in the High Plains of the U.S. and the Great Lakes region.
The Eurasian January SCE was 29.96 million square km (11.57 million square miles), 640,000 square km (250,000 square miles) above the 1981-2010 average. This was the 18th largest January SCE on record for Eurasia. Above-average snow cover was observed across central and western China and much of Europe and Asia Minor. Below-average snow cover was observed in Mongolia and western Iran.
Sea Ice Extent
| January 2015 | Sea Ice Extent | Anomaly 1991-2020 | Trend per decade | Rank (37 years) | Record | ||||
|---|---|---|---|---|---|---|---|---|---|
| million km² | million mi² | Year(s) | million km² | million mi² | |||||
| Northern Hemisphere | 13.60 | 5.25 | -2.72% | -3.15% | Largest | 34th | 1979 | 15.41 | 5.95 |
| Smallest | 3rd | 2011 | 13.46 | 5.20 | |||||
| Southern Hemisphere | 6.85 | 2.64 | +35.91% | +4.56% | Largest | 1st | 2015 | 6.85 | 2.64 |
| Smallest | 36th | 2006 | 4.16 | 1.61 | |||||
| Globe | 20.45 | 7.90 | +7.52% | -1.10% | Largest | 2nd | 1979 | 20.81 | 8.03 |
| Smallest | 35th | 2006 | 17.63 | 6.81 | |||||
Data Source: National Snow and Ice Data Center (NSIDC). Period of record: 1979–2015 (37 years)
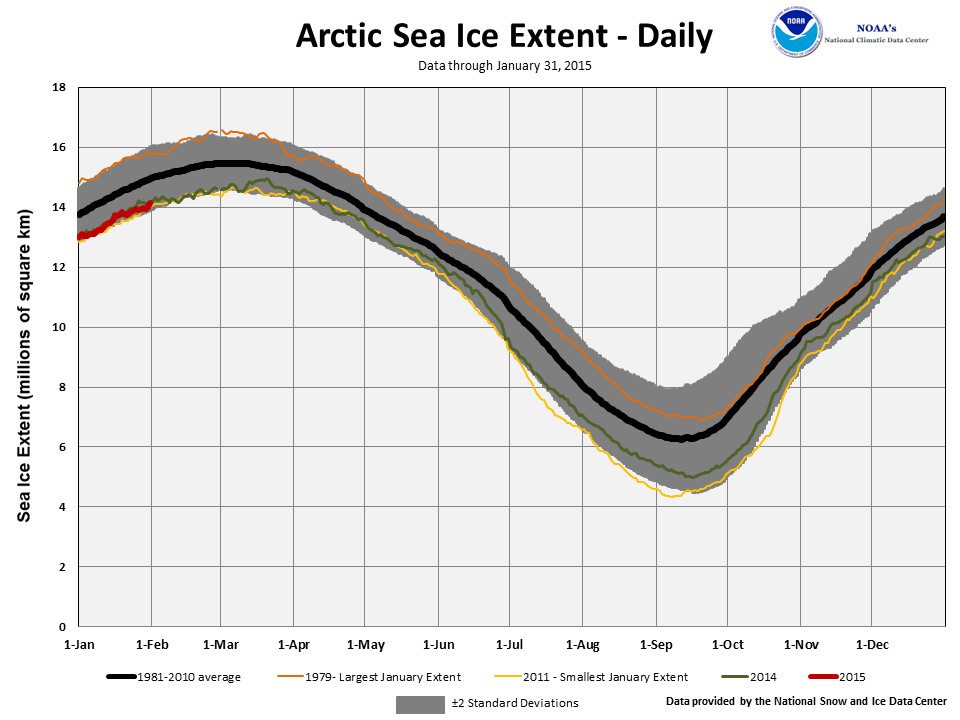
According to the National Snow and Ice Data Center (NSIDC), the Northern Hemisphere sea ice extent — which is measured from passive microwave instruments onboard NOAA satellites — averaged for January 2015 was 13.62 million square km (5.26 million square miles), 910,000 square km (350,000 miles), or 6.26 percent, below the 1981-2010 average. This was the third smallest January Arctic sea ice extent on record, with smaller January sea ice extents observed only in 2011 and 2006. Below-average sea ice was observed across the Bering Sea and the Sea of Okhotsk, while most regions on the Atlantic side of the Arctic had near-average sea ice coverage. The near-average sea ice in the Barents Sea was particularly noteworthy because it contrasted most winter seasons since 2004 when the region has observed much below average sea ice coverage. January Arctic ice extent is decreasing at an average rate of 3.3 percent per decade.

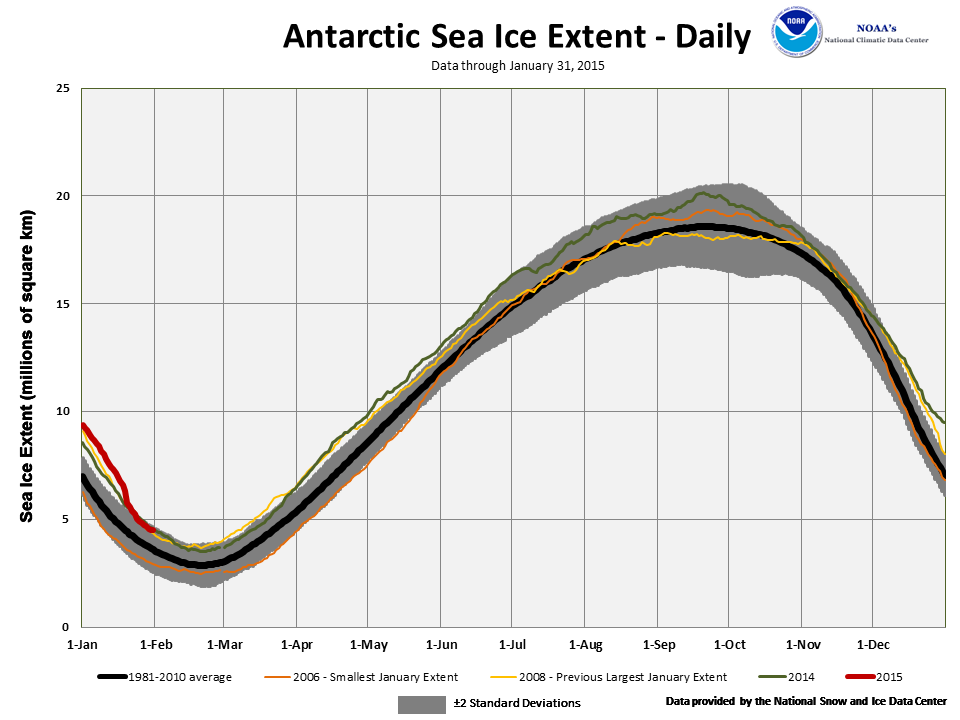
The January Southern Hemisphere sea ice extent was 7.46 million square km (2.88 million square miles), 2.30 million square km (890,000 square miles), or 44.57 percent, above the 1981-2010 average. This was the largest January Southern Hemisphere sea ice extent on record and surpassed the previous record that occurred in 2008 by 580,000 square km (220,000 square miles), which is approximately the size of Madagascar. Seven of the last 12 months have had record large Antarctic sea ice extent. During January, large portions of the northern Weddell Sea and northern Ross Sea had much above-average sea ice compared to the 1981-2010 average. By the end of the January, sea ice began to retreat rapidly in the northern Ross Sea, but remained nearly constant in the northern Weddell Sea. January Southern Hemisphere sea ice extent is increasing at an average rate of 5.2 percent per decade.
When combining the Northern Hemisphere and Southern Hemisphere sea ice extents, the globally-averaged sea ice extent during January was 21.08 million square km (8.14 million square miles), 7.06 percent above the 1981-2010 average and the second largest January global sea ice extent on record. This was 170,000 square km (60,000 square miles) smaller than the record large January Global sea ice extent that occurred in 1979, when both the Antarctic and Arctic monthly sea ice extents were above average. Global sea ice extent during January is decreasing at an average rate of 1.0 percent per decade.
For further information on the Northern and Southern Hemisphere snow and ice conditions, please visit the NSIDC News page.