NH Snow Cover Extent
| February 2014 | Snow Cover Extent | Anomaly 1991-2020 | Trend per decade | Rank (48 years) | Record | ||||||
|---|---|---|---|---|---|---|---|---|---|---|---|
| million km² | million mi² | million km² | million mi² | million km² | million mi² | Year(s) | million km² | million mi² | |||
| Northern Hemisphere | 46.81 | 18.07 | +1.03 | +0.40 | -0.06 | -0.02 | Largest | 20th | 1978 | 51.32 | 19.81 |
| Smallest | 28th | 1990 | 42.16 | 16.28 | |||||||
| Ties: 1983 | |||||||||||
| North America | 17.91 | 6.92 | +0.70 | +0.27 | +0.06 | +0.02 | Largest | 8th | 1978 | 19.04 | 7.35 |
| Smallest | 41st | 1991 | 15.63 | 6.03 | |||||||
| Eurasia | 28.90 | 11.16 | +0.34 | +0.13 | -0.12 | -0.05 | Largest | 23rd | 1972 | 33.26 | 12.84 |
| Smallest | 26th | 2002 | 25.91 | 10.00 | |||||||
Data Source: Global Snow Laboratory, Rutgers University. Period of record: 1967–2014 (48 years)
The Northern Hemisphere snow cover extent (SCE) during February 2014 was 46.81 million square km (18.07 million square miles), 1.22 million square km (470,000 square miles) above the 1981-2010 average. This was the 17th largest February snow cover extent for the Northern Hemisphere in the 48-year period of record, and the smallest since 2009. Both North America and Eurasia had above-average SCE for February. During the Northern Hemisphere winter season (December 2013 – February 2014), the Northern Hemisphere SCE was 660,000 square km (255,000 square miles) above the 1981-2010 average, and the 18th largest winter SCE for the hemisphere overall and the smallest winter SCE for the Northern Hemisphere since 2008/09.

During February, the North American SCE was above average, ranking as the ninth largest February SCE on record. The monthly SCE was 17.91 million square km (6.92 million square miles), 790,000 square km (310,000 square miles) above the 1981-2010 average, and the largest February SCE for North America since 2011. Numerous winter storms impacted the U.S. and Canada during February, causing above-average snow cover across the Pacific Northwest of the U.S., the Canadian Rockies, and most of the eastern two-thirds of the contiguous United States. Below-average snow cover was observed across the southwestern United States. The contiguous U.S, Canada, and Alaska all had above-average SCE during February. For the winter season, the North American SCE was 600,000 square km (230,000 square miles) above the 1981-2010 average, and the 11th largest winter SCE for North America, and the largest since 2010/11.
The Eurasian February SCE was 28.90 million square km (11.16 million square miles), 420,000 square km (160,000 square miles) above the 1981-2010 average — the 21st largest February SCE on record. This was the smallest February SCE for Eurasia since 2009. Below-average snow cover was observed across much of Europe and Turkey. Above-average SCE was observed across the Alps, western Asia, and central and eastern China. For the entire winter season, the Eurasian SCE was 60,000 square km (23,000 square miles) above the 1981-2010 average, the 23rd smallest winter SCE on record, and the smallest since 2008/09.
Sea Ice Extent
| February 2014 | Sea Ice Extent | Anomaly 1991-2020 | Trend per decade | Rank (36 years) | Record | ||||
|---|---|---|---|---|---|---|---|---|---|
| million km² | million mi² | Year(s) | million km² | million mi² | |||||
| Northern Hemisphere | 14.42 | 5.57 | -2.96% | -2.89% | Largest | 33rd | 1979 | 16.18 | 6.25 |
| Smallest | 4th | 2006 | 14.32 | 5.53 | |||||
| Southern Hemisphere | 3.84 | 1.48 | +24.27% | +4.21% | Largest | 2nd | 2008 | 3.89 | 1.50 |
| Smallest | 35th | 1993 | 2.48 | 0.96 | |||||
| Ties: 2013 | |||||||||
| Globe | 18.26 | 7.05 | +1.73% | -1.67% | Largest | 24th | 1979 | 19.32 | 7.46 |
| Smallest | 13th | 2011 | 16.88 | 6.52 | |||||
Data Source: National Snow and Ice Data Center (NSIDC). Period of record: 1979–2014 (36 years)

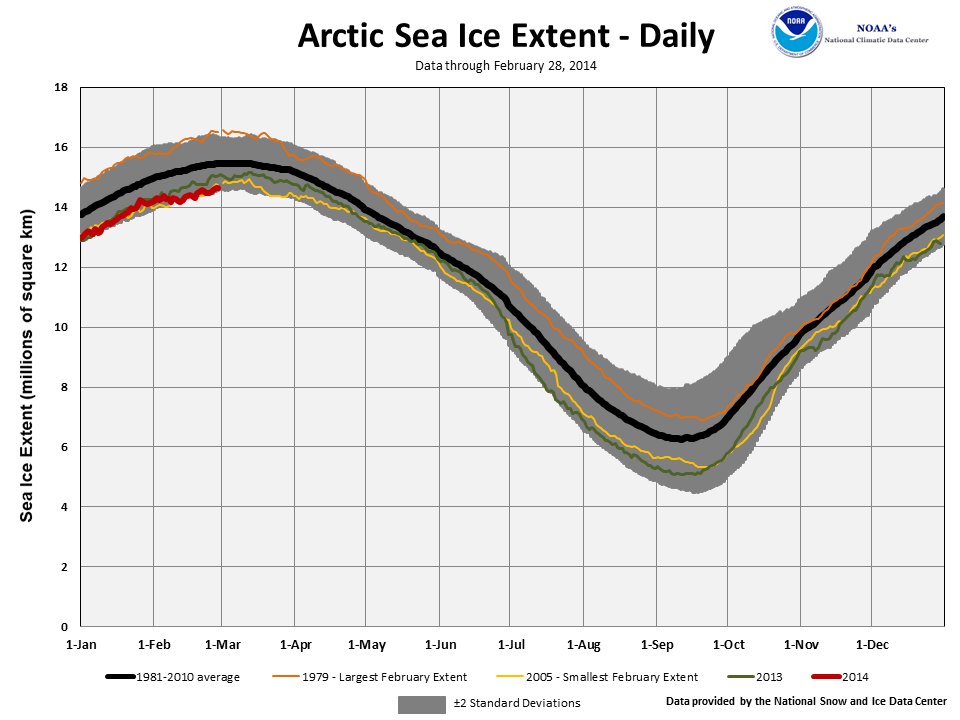
According to the National Snow and Ice Data Center (NSIDC), the Northern Hemisphere sea ice extent — which is measured from passive microwave instruments onboard NOAA satellites — averaged for February 2014 was 14.44 million square km (5.58 million square miles), about 910,000 square km (350,000 square miles), or 5.9 percent, below the 1981-2010 average. This ranked as the fourth smallest February sea ice extent on record. During the course of the month, Arctic sea ice expanded at a slower than average rate, with the ice extent declining at certain points during the month. The ice growth rate was about 25 percent below the 1981-2010 average. The Arctic sea ice extent will continue to expand until March, when the annual maximum extent will occur. Below-average sea ice was observed in the Barents Sea and the Sea of Okhotsk. Below-average ice was also observed in the Bering Sea, which has observed above-average ice cover the past several winters. February Arctic sea ice extent is decreasing at an average rate of 2.9 percent per decade.
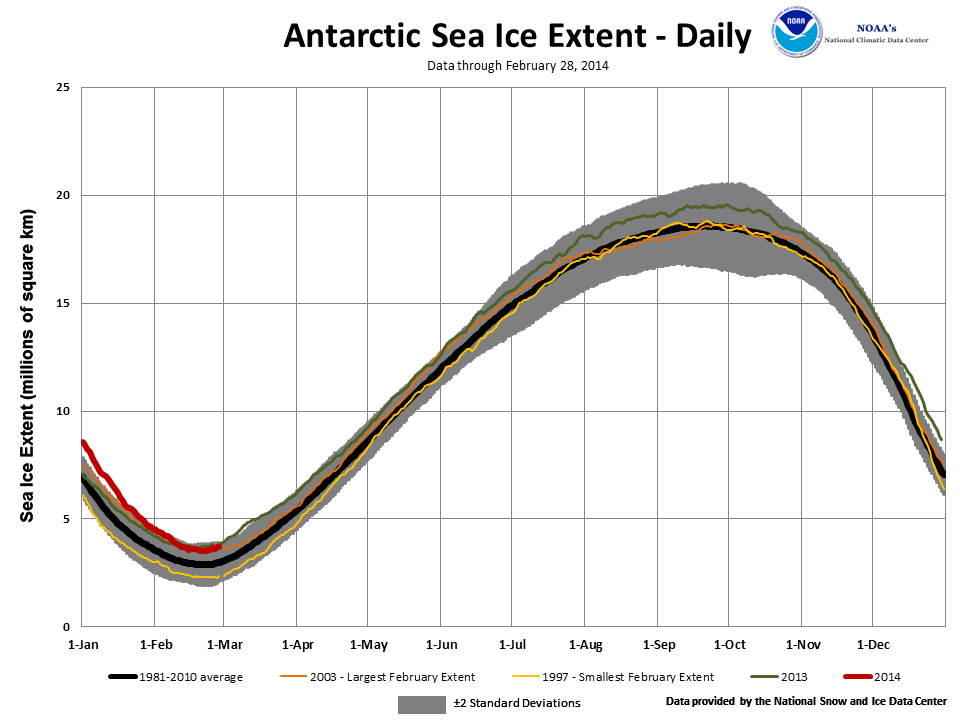
The February 2014 Southern Hemisphere sea ice extent was 3.84 million square km (1.48 million square miles), which was 800,000 square km (310,000 square miles), or 26.3 percent, above the 1981-2010 average. This was the fourth largest February Antarctic sea ice extent on record. February Southern Hemisphere sea ice extent is increasing at an average rate of 4.3 percent per decade, with substantial interannual variability. The Antarctic reached its annual minimum extent on February 20th at 3.52 million square km (1.36 million square miles). This was the 4th largest minimum sea ice extent on record for the Southern Hemisphere. Larger minimum extents occurred in 2003, 2008, and 2013. The 1981-2010 average minimum extent is 2.81 million square km (1.09 million square miles).
When combining the Northern and Southern Hemisphere sea ice extents, the globally-averaged sea ice extent during February was 18.28 million square km (7.06 million square miles), 0.6 percent below the 1981-2010 average and the 15th smallest February global sea ice extent on record. Global sea ice extent during February is decreasing at an average rate of 1.7 percent per decade.
For further information on the Northern and Southern Hemisphere snow and ice conditions, please visit the NSIDC News page.