Issued: 16 January 2015
NH Snow Cover Extent

The Northern Hemisphere snow cover extent (SCE) during winter (December 2013–February 2014) was 46.2 million square km (17.8 million square miles), 660,000 square km (255,000 square miles) above the 1981-2010 average of 45.5 million square km (17.6 million square miles). This was the 18th largest winter SCE since records begain in 1967 for the Northern Hemisphere, but the smallest since the winter of 2008/09. This was also the seventh consecutive winter with above-average SCE for the Northern Hemisphere. Both North America and Eurasia had above-average winter SCE. Northern Hemisphere winter SCE has changed only slightly in the 48-year record, with a seasonal increase of about 0.4 percent per decade. For the spring season (March-May), the three-month average SCE for the Northern Hemisphere was 1.8 million square km (700,000 square miles) below the 1981-2010 average. This ranked as the third smallest spring SCE on record for the Northern Hemisphere; only the spring seasons of 1968 and 1990 had smaller SCEs. The North American spring SCE was slightly above average while the Eurasian was the second smallest on record. Spring Northern Hemisphere SCE has decreased at an average rate of 1.9 percent per decade.
Across North America during the 2013/14 winter, the SCE was 17.7 million square km (6.8 million square miles), 600,000 square km (230,000 square miles) above the 1981-2010 average. This ranked as the 11th largest winter SCE for the continent and the largest since 2010/11. During the winter of 2013/14, much of the eastern half of North America was much cooler than average and experienced above-average snow cover. The western half of North America was much warmer than average, and experienced below-average snow cover. For the spring season, the North American SCE was 12.9 million square km (5.0 million square miles), 250,000 square km (97,000 square miles) above average, the 20th largest spring SCE for the continent.
In Eurasia, SCE during the 2013/14 winter was 28.3 million square km (10.9 million square miles), 60,000 square km (23,000 square miles) above the 1981-2010 average. This was the 23rd smallest winter SCE on record, and the smallest since 2008/09. This was also the fifth consecutive winter with above average snow cover for Eurasia. For the spring season, Eurasian SCE decreased to 15.1 million square km (5.8 million square miles), 2.05 million square km (790,000 square miles) below average. This was the second smallest spring SCE on record for Eurasia. Snow cover was below average during all of spring in Eurasia with the monthly extents ranking as the fourth smallest March, record smallest April, and sixth smallest May. Only the spring of 2009 had a smaller SCE for Eurasia.
Sea Ice Extent
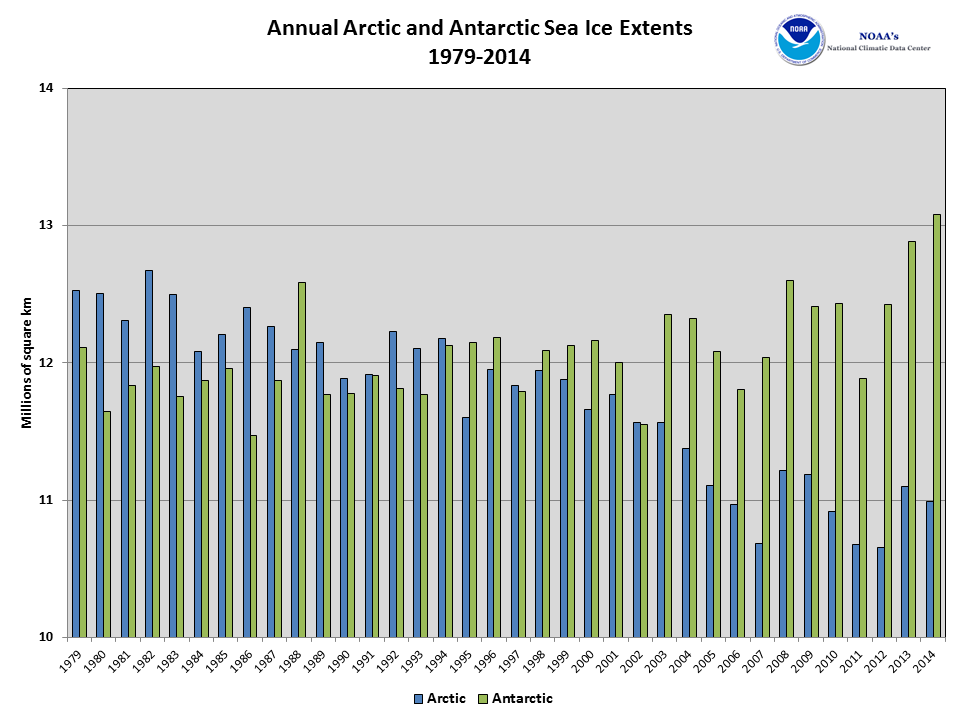
Arctic sea ice, which is measured from passive microwave instruments onboard NOAA satellites, usually expands during the cold season to a March maximum, and then contracts during the warm season to a September minimum. According to the National Snow and Ice Data Center (NSIDC), during each month of 2014, the Arctic sea ice extent was below average. When averaged for the entire year, the Arctic sea ice extent was 820,000 square km (317,000 square miles) below the 1981-2010 average and the sixth smallest annual Arctic sea ice extent on record.
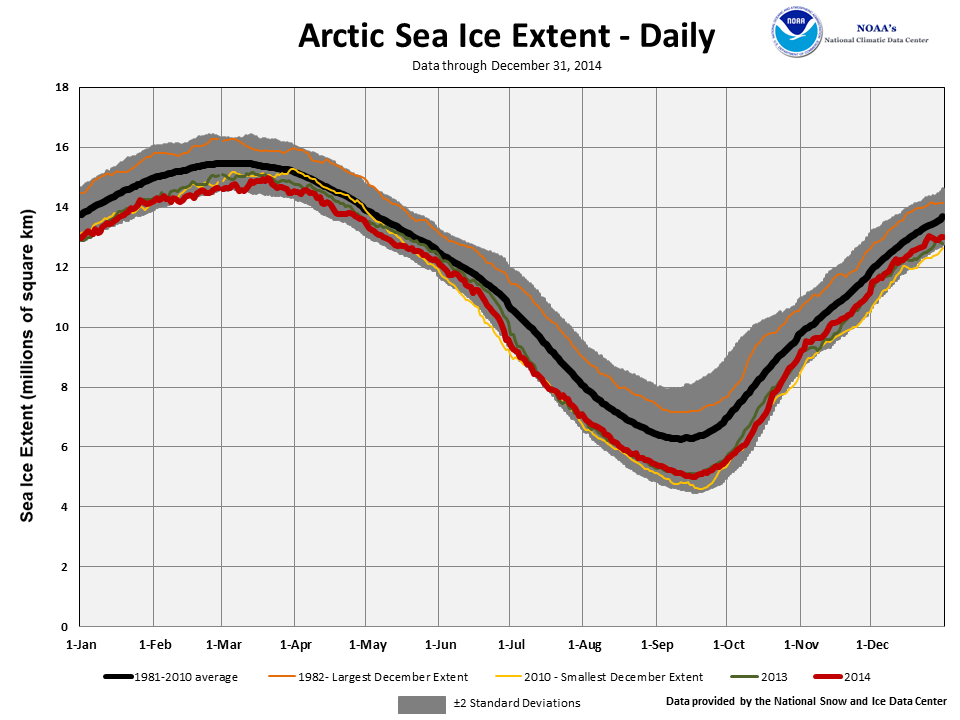
On March 21st, Arctic sea ice reached its annual maximum extent at 14.91 million square kilometers (5.76 million square miles). The 2014 annual maximum extent was the fifth smallest on record. The sea ice maximum occurred 12 days later than average, the fifth latest date on record. The latest annual maximum occurred on March 31st in 2010, while the smallest annual maximum occurred in 2011 at 15.63 million square km (5.65 million square miles). The ten smallest maximum extents have occurred since 2004.
On September 17th, the Artic sea ice extent reached its annual minimum, two days later than average. The 2014 minimum was 5.02 million square km (1.94 million square miles), 1.20 million square km (463,000 square miles) below the 1981-2010 average, but 1.61 million square km (622,000 square miles) larger than the record smallest annual minimum extent that occurred in 2012. The 2014 minimum extent was the sixth smallest in the satellite record. From the annual maximum extent that occurred on March 21st to the minimum extent, the Arctic lost a total of 9.89 million square km (3.82 million square miles) of ice, which was the ninth largest amount on record, but the lowest amount of seasonal ice loss since 2006. The 2014 ice loss was 1.92 million square km (741,000 square miles) less than the record ice loss that occurred in 2012.
Antarctic sea ice typically contracts during the Southern Hemisphere warm season to a minimum extent in late summer (February or March) and expands during the cold season to a September maximum extent. Antarctic sea ice was much above-average during all of 2014, with record large ice extents for six months from April to October. When averaged for the entire year, the Antarctic sea ice extent was 1.06 million square km (409,000 square miles) above the 1981-2010 average and the record largest annual Antarctic sea ice extent on record.
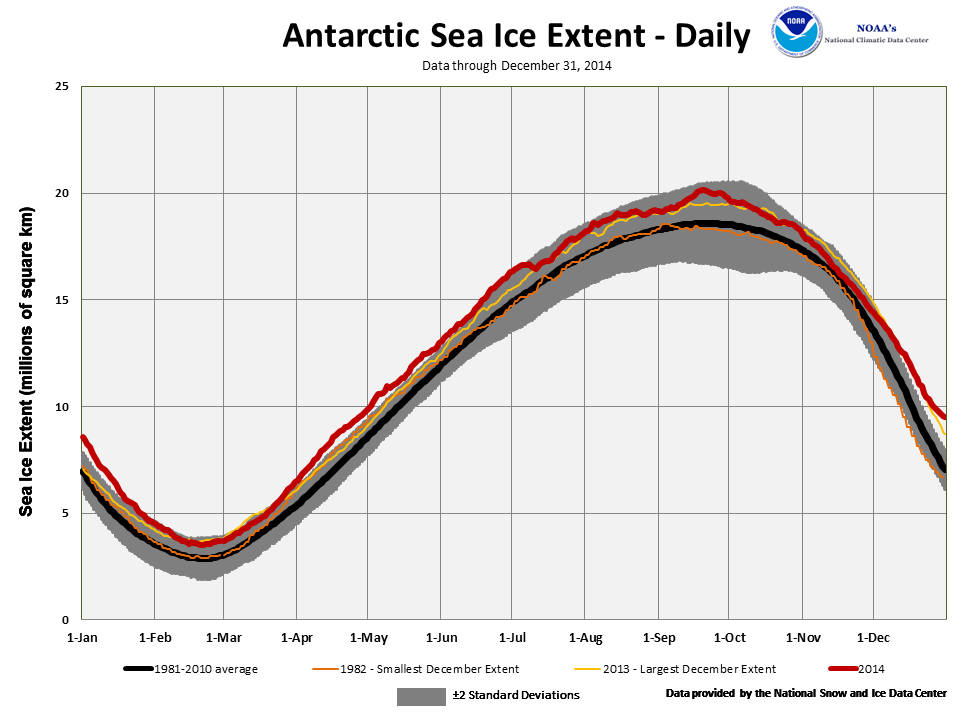
The Antarctic reached its annual minimum extent on February 20th at 3.52 million square km (1.36 million square miles). This was the fourth largest minimum sea ice extent on record for the Southern Hemisphere. Larger minimum extents occurred in 2003, 2008, and 2013. The 1981-2010 average minimum extent is 2.81 million square km (1.09 million square miles).
On September 22nd, Antarctic sea ice reached its annual maximum extent at 20.11 million square km (7.76 million square miles), 1.54 million square km (595,000 square miles) above the 1981-2010 average and the largest Antarctic sea ice extent in the 1979-2014 satellite record. This beat the previous record set just last year by approximately 560,000 square km (216,000 square miles) and marked the third consecutive year that a new record maximum sea ice extent has been set in the Antarctic. This was the first time in the satellite record that daily Antarctic sea ice extent exceeded 20 million square km.
When combining the Northern Hemisphere and Southern Hemisphere sea ice extents, we can examine global sea ice conditions. On a monthly scale, the global monthly sea ice extent was above average during most of 2014, with the exception of February and November. The above-average monthly global sea ice extent was driven largely by the record and near-record large Antarctic sea ice each month. The global sea ice departure from average peaked in April when the global sea ice extent was 23.14 million square km (9.14 million square miles), 990,000 square km (380,000 square miles) above the 1981-2010 average. This was the third largest April global sea ice extent on record. On the annual scale, averaging the global sea ice extent for each month of the year, the average global sea ice extent was 24.07 million square km (9.29 million square miles) during 2014, 240,000 square km (93,000 square miles) above average. This was the 11th largest annual global sea ice extent in the 1979-2014 period of record, and the largest since 1996. Annual global sea ice extent is decreasing at an average rate of 319,000 square km (123,000 square miles) per decade with Arctic sea ice decreasing and Antarctic sea ice slightly increasing. Arctic annual sea ice extent is decreasing at an average rate of 518,000 square km (200,000 square miles) per decade, while Antarctic annual sea ice extent is increasing at an average rate of 199,000 square km (77,000 square miles) per decade.
For further information on the Northern and Southern Hemisphere snow and ice conditions, please visit the NSIDC News page.