Issued: 21 January 2014
NH Snow Cover Extent
Snow Extent data were provided by the Global Snow Laboratory, Rutgers University. Period of record is 1966-2013 (48 years). The Rutgers Global Snow Lab made adjustments to the calculation of the Northern Hemisphere snow cover extent. This resulted in some minor changes to the seasonal snow cover extents for the Northern Hemisphere, North America, and Eurasia. The numbers presented in this report reflect the updated methods and might not match numbers reported earlier in the year. For more information please visit: The Rutgers Global Snow Lab.

The Northern Hemisphere snow cover extent during winter (December 2012–February 2013) was 47.7 million square km (18.4 million square miles), 2.2 million square km (0.8 million square miles) above the 1981-2010 average of 45.5 million square km (17.6 million square miles). This was the fourth largest winter snow cover extent on record for the Northern Hemisphere. Only the winter seasons of 1977/78, 2009/10, and 2010/11 had larger winter snow cover extents. Both North America and Eurasia had above-average winter snow cover extent. Northern Hemisphere winter snow cover extent has changed only slightly in the 48-year record, with a seasonal increase of about 0.4 percent per decade. For the spring season (March-May), the Northern Hemisphere snow cover extent was closer to average. The three-month average snow cover extent for the Northern Hemisphere was 30.18 million square km (11.65 million square miles), 390,000 square km (151,000 square miles) above the 1981-2010 average. This ranked as the 23rd largest (25th smallest) spring snow cover extent on record for the Northern Hemisphere. The North American snow cover extent was above average and ranked as the 10th largest spring snow cover extent on record. The Eurasian snow cover extent was below average and ranked as the 14th smallest spring snow cover extent on record. Spring Northern Hemisphere snow cover extent has decreased at an average rate of 1.9 percent per decade.

Across North America during the 2012/13 winter, the snow cover extent was 17.67 million square km (6.82 million square miles), 500,000 square km (193,000 square miles) above the 1981-2010 average. This ranked as the 14th largest winter snow cover extent for the continent. The North American winter snow cover extent has been highly variable over the past few years — the winter of 2009/10 had the largest winter snow cover extent on record for the continent, the 2010/11 winter had the third largest winter snow cover extent, the 2011/12 winter had the fourth smallest snow cover extent, while the winter of 2012/13 had a snow cover extent closer to average. For the spring season, the North American snow cover extent was 13.49 million square km (5.21 million square miles), 830,000 square km (320,000 square miles) above average. This was the 10th largest spring snow cover extent for the continent and the largest since 1997. The contiguous U.S. was impacted by several late-season winter storms with many locations receiving more snow during the spring than the preceding winter.
In Eurasia, snow cover extent during the 2012/13 winter was 30.02 million square km (11.59 million square miles), 1.71 million square km (660,000 square miles) above the 1981-2010 average. This marked the third largest winter snow cover extent on record for Eurasia and the largest since 2003. The largest winter snow cover extent for Eurasia occurred during the winter season of 1977/78 when the snow cover extent was 30.71 million square km (11.86 million square miles). For the spring season, Eurasian snow cover extent decreased to 16.70 million square km (6.45 million square miles), 430,000 square km (166,000 square miles) below average. This was the 14th smallest spring snow cover extent on record for the continent. During May, the Eurasian snow cover dipped to 7.3 million square km (2.82 million square miles), which was 2.5 million square km (1.0 million square miles) below average and set a new record low May snow cover extent.
Sea Ice Extent
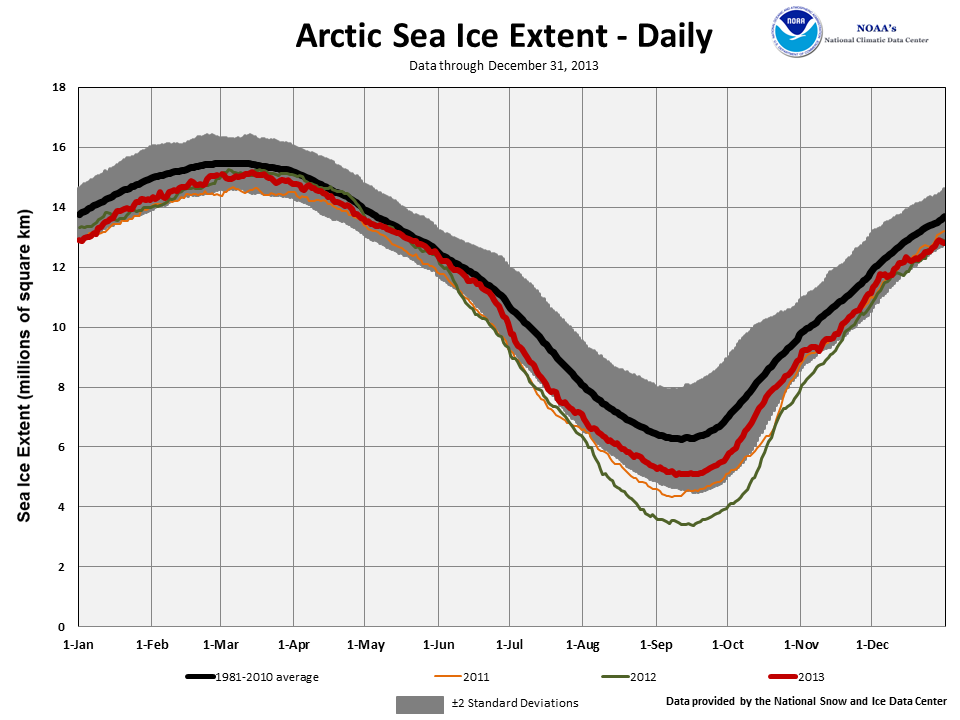
Arctic sea ice, which is measured from passive microwave instruments onboard NOAA satellites, usually expands during the cold season to a March maximum, and then contracts during the warm season to a September minimum. According to data from the National Snow and Ice Data Center (NSIDC), during each month of 2013, the Arctic sea ice extent was below average. On March 15th, Arctic sea ice reached its annual maximum extent at 15.13 million square km (5.84 million square miles), which is 510,000 square km (197,000 square miles) below the 1981-2010 average maximum extent. During the entire 2012-2013 growth season, the Arctic sea ice extent grew by a record 11.72 million square km (4.53 million square miles), driven largely by the record small sea ice extent which occurred in September 2012. The 2013 annual maximum extent was the sixth smallest on record, and the ten smallest maximum extents have occurred in the last ten years, between 2004 and 2013.
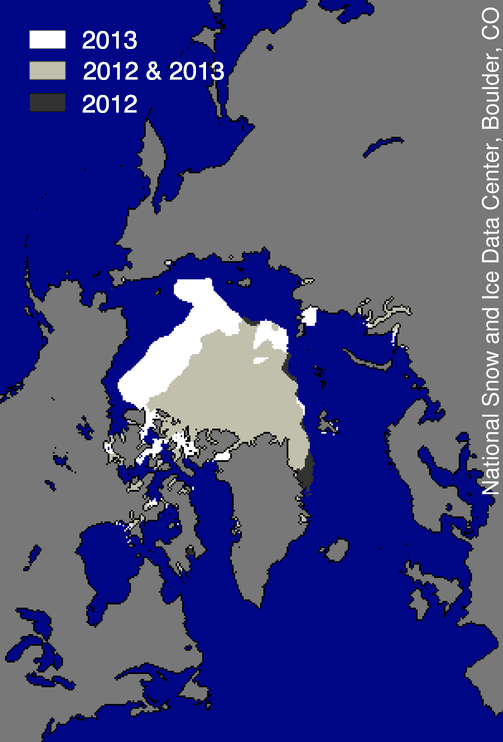
On September 13th, the Arctic sea ice extent reached its annual minimum, marking the end of the summer melt season and the beginning of the winter growth season. The annual minimum extent was 5.10 million square km (1.97 million square miles), marking the sixth smallest annual minimum extent on record. The 2013 minimum was 1.69 million square km (653,000 square miles) larger than the record minimum extent that occurred on September 16th, 2012 and about 1.12 million square km (432,000 square miles) smaller than the 1981-2010 average. During the 2013 melt season, the Arctic sea ice shrank approximately 9.69 million square km (3.85 million square km) between the March maximum and the September minimum. The largest amount of ice lost during a single melt season occurred in 2012, when the Arctic sea ice shrank 11.83 million square km (4.57 million square miles).
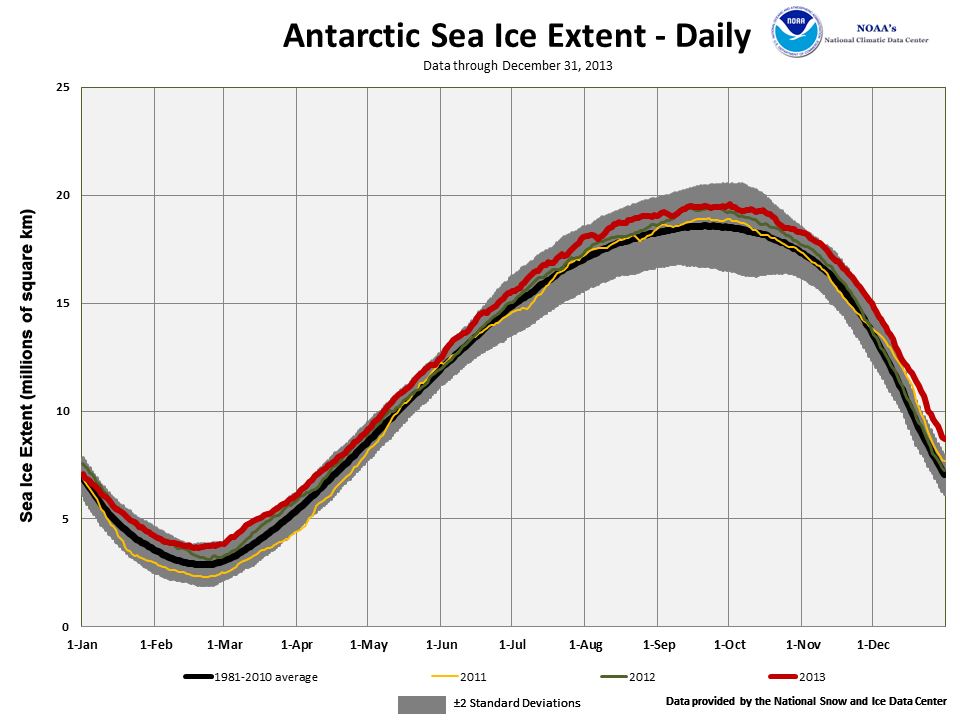
Antarctic sea ice typically contracts during the Southern Hemisphere warm season to a minimum extent in late summer (February or March) and expands during the cold season to a September maximum extent. The Antarctic sea ice minimum extent occurred on February 20th at 3.68 million square km (1.42 million square miles) and began its annual expansion. This marked the second largest annual minimum sea ice extent for the Antarctic. The largest annual sea ice minimum extent occurred in February 2008 at 3.69 million square km (1.43 million square miles).
On September 22nd, the Antarctic sea ice extent reached its annual maximum. The annual maximum extent was 19.47 million square km (7.52 million square miles), marking the largest annual maximum extent on record. The 2013 maximum was about 30,000 square km (11,600 square miles) larger than the previous record large Antarctic annual maximum sea ice extent, which occurred in 2012, and 2.6 percent higher than the 1981-2010 average. On October 1st, the Antarctic sea ice extent reached its annual maximum. The annual maximum extent was 19.50 million square km (7.53 million square miles), marking the largest annual maximum extent on record. The 2013 maximum was about 33,000 square km (12,700 square miles) larger than the previous record large Antarctic annual maximum sea ice extent, which occurred in 2012, and about 2.7 percent higher than the 1981-2010 average. The Antarctic sea ice extent was also record large for each of the months between August and November.
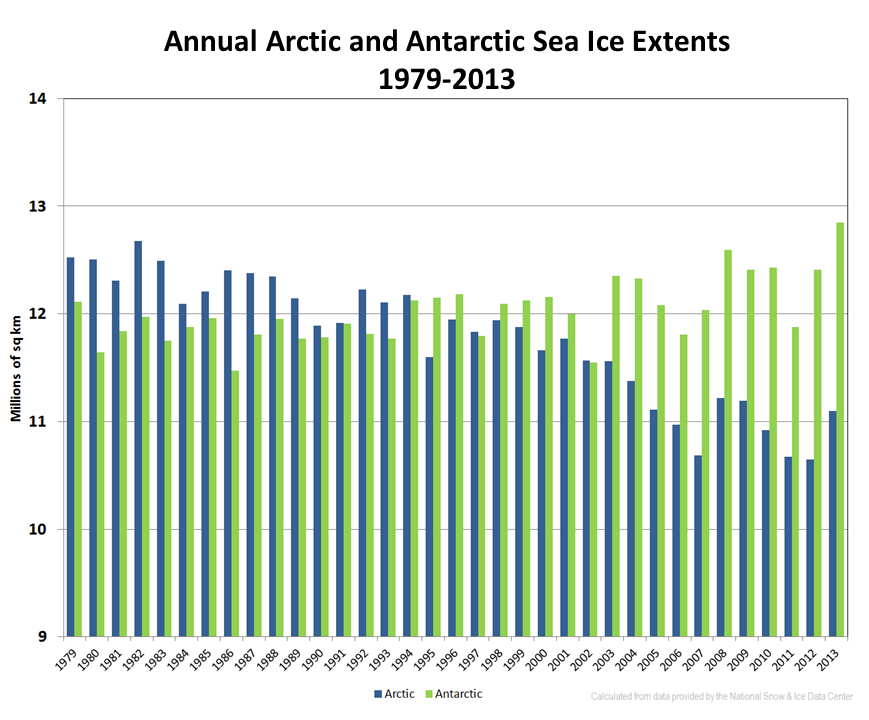
When combining the Northern Hemisphere and Southern Hemisphere sea ice extents, we can examine global sea ice conditions. On a monthly scale, the global sea ice extent was above average several months and below-average several months. Global sea ice extent was below average in January, July, August, and September, while it was above average in February, March, April, May, June, October, November, and December. The global sea ice departure from average peaked in December when the global sea ice extent was 25.01 million square km (9.66 million square miles), 680,000 square km (270,000 square miles) above the 1981-2010 average. This was the fifth largest December global sea ice extent on record. On the annual scale, averaging the global sea ice extent for each month of the year, the average global sea ice extent was 23.94 million square km (9.24 million square miles) during 2013, 120,000 square km (46,000 square miles) above average. This was the 15th largest annual global sea ice extent in the 1979-2013 period of record. Annual global sea ice extent is decreasing at an average rate of 355,000 square km (137,000 square miles) per decade with Arctic sea ice decreasing and Antarctic sea ice slightly increasing. Arctic annual sea ice extent is decreasing at an average rate of 535,000 square km (207,000 square miles) per decade, while Antarctic annual sea ice extent is increasing at an average rate of 180,000 square km (69,000 square miles) per decade.
For further information on the Northern and Southern Hemisphere snow and ice conditions, please visit the NSIDC News page.