El Niño Continues to Develop
This report was issued on 15 September 2009
Sea Surface Temperatures (SSTs) and Mixed Layer Conditions:

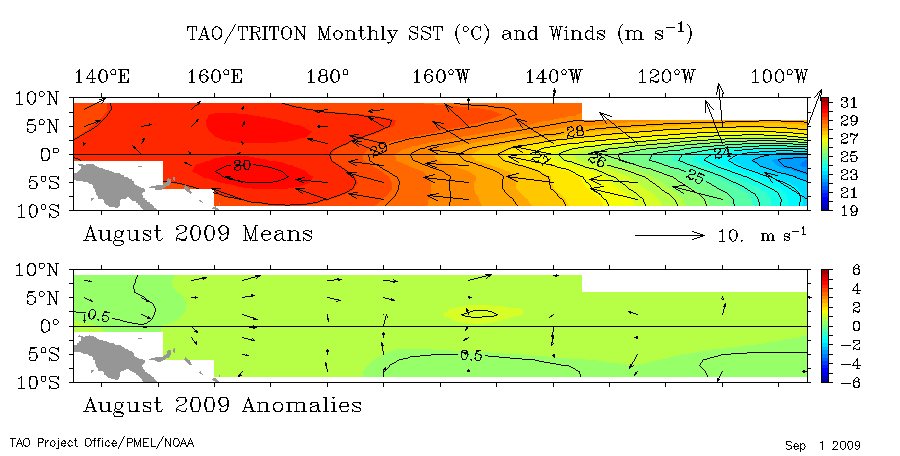
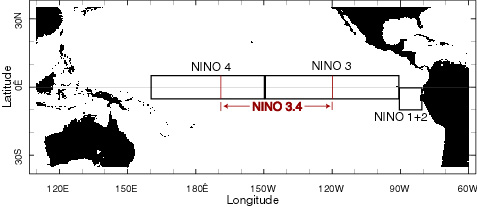
A weak El Niño warming signal continued across the equatorial tropical Pacific Ocean in August. The sea surface temperature (SST) anomaly for the Niño 3.4 region fell slightly from July, but remained above the El Niño threshold of 0.5°C (0.9°F) for a third consecutive month. Since May, the SST anomalies of all four Niño regions have been above average. The most recent three–month (June – August) average anomaly also exceeded the El Niño threshold for the second consecutive 3–month period. Additionally, August 2009 is the fourth consecutive month in which warm SST anomalies were present in all of the Niño regions. This behavior and timing is historically consistent with the development of a weak to moderate El Niño event that is expected to peak toward the end of the year.


For the most recent equatorial Pacific Ocean surface temperatures, please visit NOAA's Tropical Atmosphere Ocean (TAO) project and for weekly or monthly Niño region average SST and anomaly values, visit the Climate Prediction Center's Atmospheric and SST Index values page (NOTE: For NOAA's official ENSO classification scheme, please see NOAA's El Niño/La Niña Index Definition).

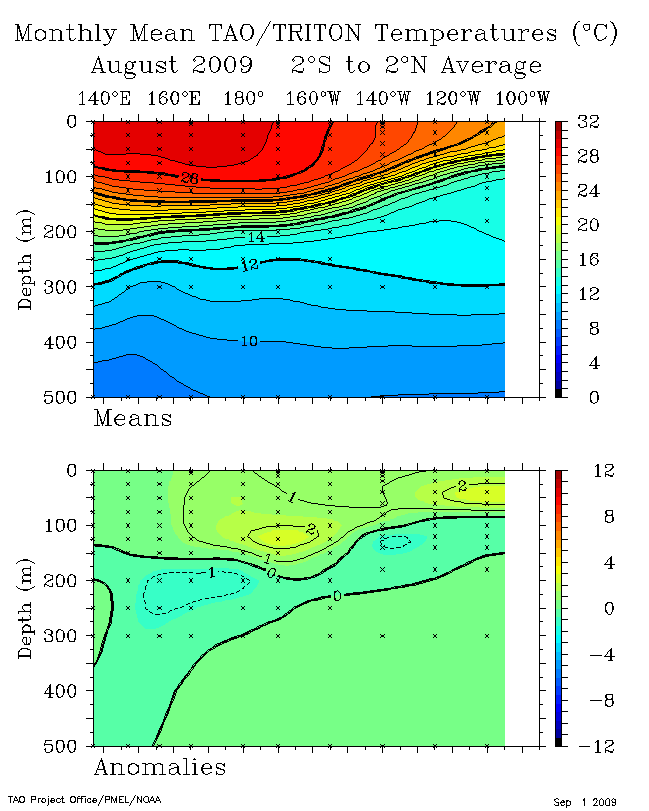
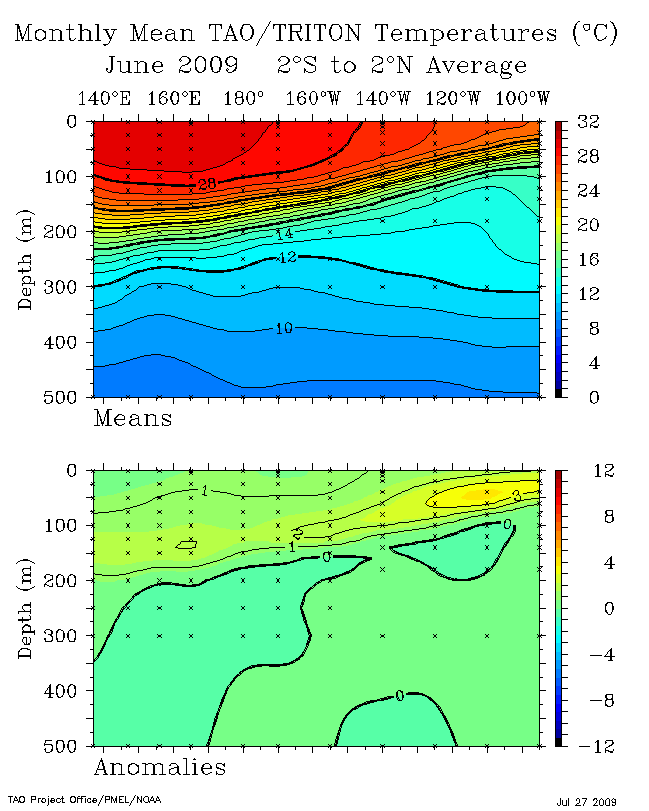
Sub surface oceanic heat content anomalies for the equatorial Pacific Ocean increased slightly in the latter half of August, though overall mixed layer heat content in August was much closer to average than the initial period of El Niño warmth experienced in June, when anomalies exceeding 3.0°C (5.4°F) were seen in shallow depths of the eastern part of the basin. On average for August, anomalies exceeding +2.0°C (3.6°F) were present east of the Date Line, while weaker positive anomalies were present near the surface across the entire equatorial region.
During an El Niño (warm phase) event, positive (warm) heat content anomalies are present in the mixed layer of the equatorial Pacific Ocean, with the most above–average heat occurring at shallow depths in the eastern portion of the basin. During La Niña (cool phase) events, the mixed layer heat content tends to fall below normal, especially east of the Date Line.

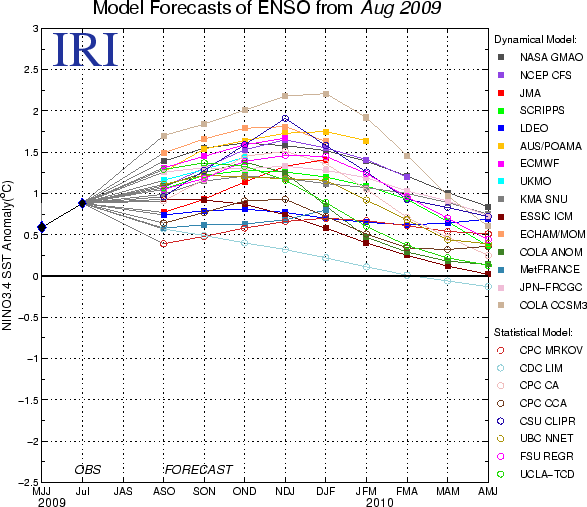
While some computer guidance has backed off from earlier forecasts of a moderate to strong El Niño event by the end of 2009, current observations, recent trends, and the majority of dynamic computer models continue to indicate the likelihood of a continued strengthening of El Niño over the next several months, and the persistence of a moderate El Niño into early 2010. Historically, impacts over the United States from El Niño tend to be weak during the summer and strengthen toward the winter months. Fall Atlantic hurricane activity may be suppressed during an El Niño due to increased vertical wind shear above the tropical Atlantic. For a comprehensive list of El Niño impacts on the United States, other countries, and globally, please visit NOAA's Pacific Marine Environmental Laboratory El Niño Impacts page.
Equatorial Zonal Winds (U–Component Winds) and Sea–Level Topography:

During August, the equatorial Pacific trade winds were just slightly below average east of the Date Line, while to the west, the zonal flow was near to slightly above average. These near–normal trade winds are historically consistent with weak or developing warm phase events. As sea surface temperature anomalies increase as an El Niño strengthens, the associated trade winds east of the Date Line tend to decrease as the atmospheric pressure gradient over the region is degraded.


Sea level is another important indicator of the presence of an El Niño or La Niña event. Above average sea level occurs when warm ocean water thermally expands, while cool water will result in contraction and below average sea levels. Sea level in the Pacific is measured by a sensor on the NASA/JPL Jason satellite. Consistent with a developing El Niño, August saw above average sea levels in the equatorial Pacific Ocean east of the Data Line. By late in the month, a sizable region of positive sea level anomalies had expanded to cover much of the Niño 3.4 region. This pool of higher than average sea level spread eastward toward the end of the month, with some locations experiencing anomalies over 4 inches (˜ 100 mm) above normal.
Outgoing Longwave Radiation (OLR):

The developing yet still weak El Niño was reflected in the variable nature of outgoing longwave radiation (OLR), and thus convection, near the Date Line in August. After a below normal July, ORL near the Date Line was slightly above average during the first half of August before returning to below average values toward the end of the month. For the month as a whole, the August OLR index — based on monthly average ORL for the equatorial Pacific between 160° W – 160° E longitude — was +0.2 W m–2, or slightly above average. This OLR index value is an increase of 1.0 W m–2 from July, but is well below the values seen in the most recent cool phase event of the past year.
The map below on the left shows the spatial pattern of global OLR (in W m–2) measured by satellite during August, while the image to the right is the average OLR over the previous three months. OLR in the equatorial Pacific near the Date Line is an indicator of relative cloudiness and precipitation — important variables tied to El Niño and La Niña events. During El Niño, convection tends to increase near the Date Line and decrease to the west. This is reflected by below average OLR in the vicinity of the equatorial Date Line, and above average OLR in the western Pacific.


Southern Oscillation Index (SOI):

The Southern Oscillation Index (SOI), a standardized measure of the surface pressure difference between Tahiti and Darwin (Australia), was –0.7 for August, a decrease of 0.8 from July, and the fourth month since March 2009, that SOI values have been negative.
Typically, prolonged periods of negative SOI values correspond to warmer–than–normal sea surface temperatures and El Niño episodes, while positive SOI values occur in conjunction with ENSO cold phases. However, slightly positive SOI values have occasionally occurred during ENSO warm phase events. The recent SOI values, which have fluctuated near the long–term average, but are predominantly slightly below normal, are historically consistent with a developing El Niño.
Additional Links
- ENSO Monitoring
- NOAA El Niño / La Niña Index Definition
- NOAA's Pacific Marine Environmental Laboratory (PMEL):
- NOAA's Climate Prediction Center (CPC):
- NOAA's Physical Science Laboratory
- NASA/JPL Ocean Surface Topography from Space
- Australian Bureau of Meteorology (BoM) Climate Driver Update
- IRI - International Research Institute