The data presented in this drought report are preliminary. Ranks, anomalies, and percent areas may change as more complete data are received and processed, but they will not be replaced on these pages.
|
Contents Of This Report: |
|
National Drought Overview
|
|
Percent area of the U.S. very warm, very cold, very wet, or very dry for January-December 2020. Very warm and very wet are defined as temperatures or precipitation in the upper tenth percentile of the historical record. Very cold and very dry are defined as temperatures or precipitation in the lowest tenth percentile of the historical record.
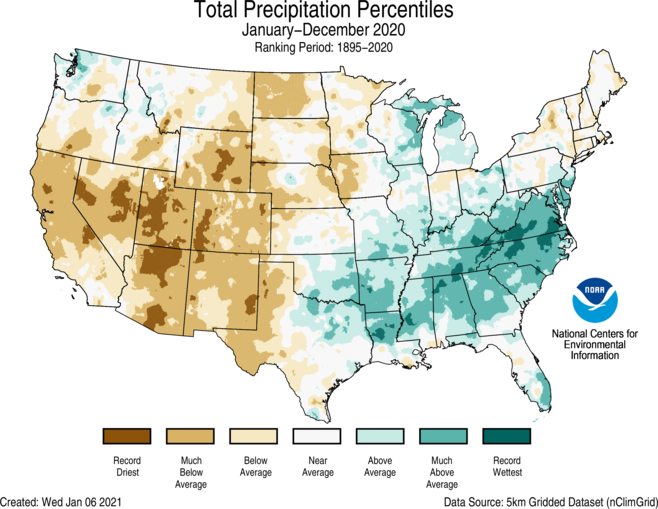
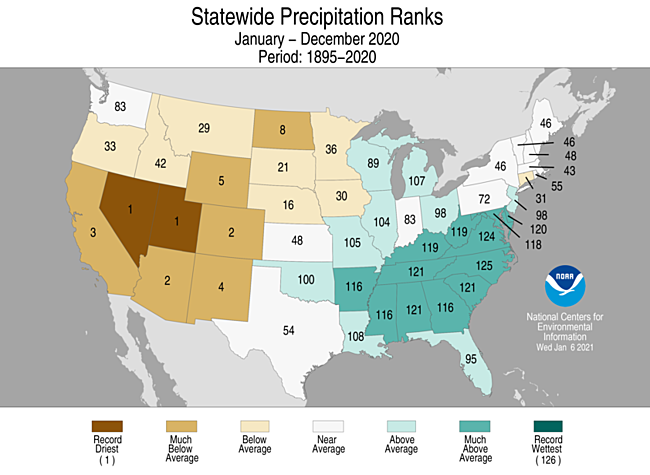
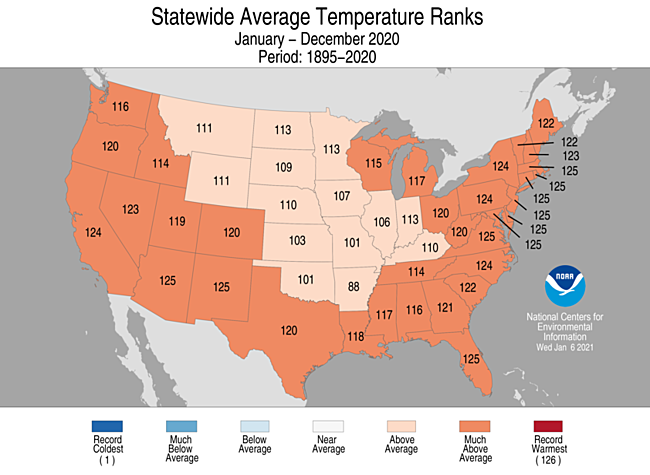
Overall, when integrated across the nation and across the entire year, 2020 was a warm year with precipitation averaging near the middle of the historical distribution. The annual nationwide ranks were fifth warmest and 63rd wettest (64th driest), based on data for 1895-2020. But this was a year of extremes as considerable variation occurred throughout the year and across the country. The year was unusually wet in the Southeast, where North Carolina had the second wettest year on record, and extremely dry in the Southwest, where Nevada and Utah ranked driest on record for the year. Ten states across the Southwest, Southeast and East Coast had the second warmest year on record.
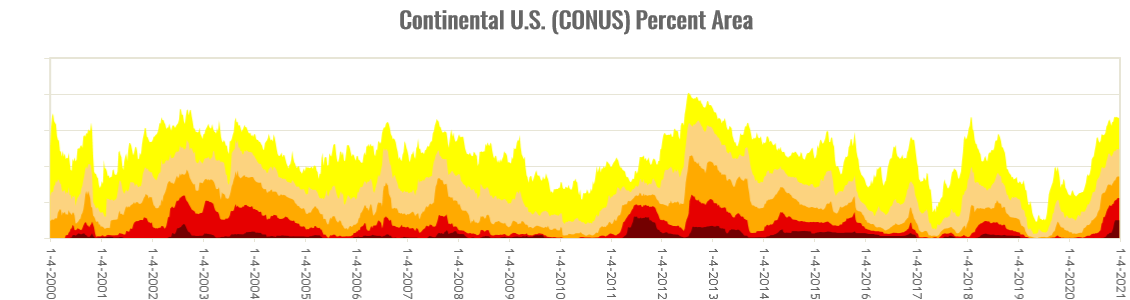
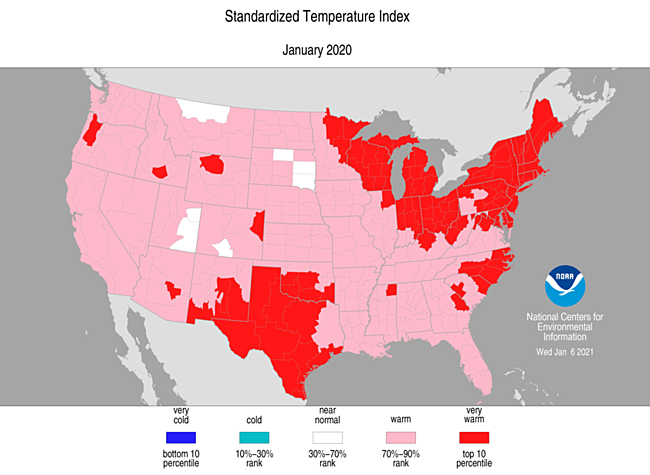
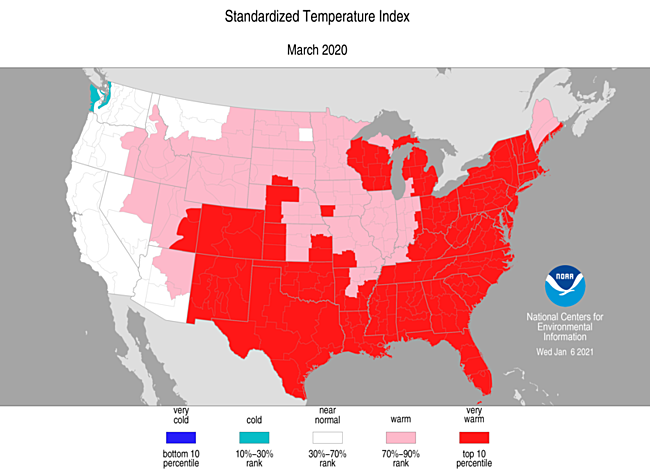
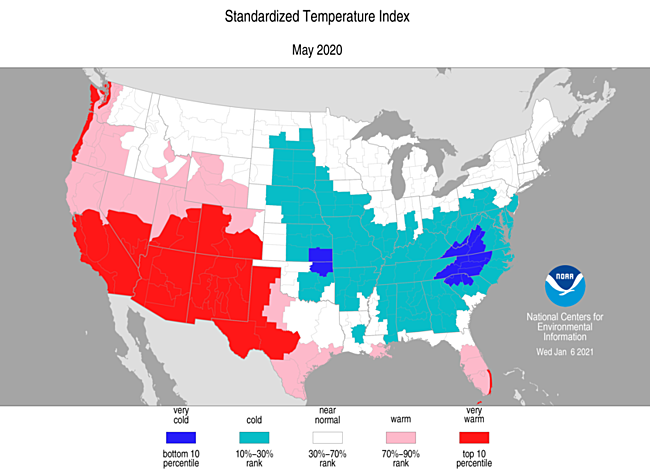
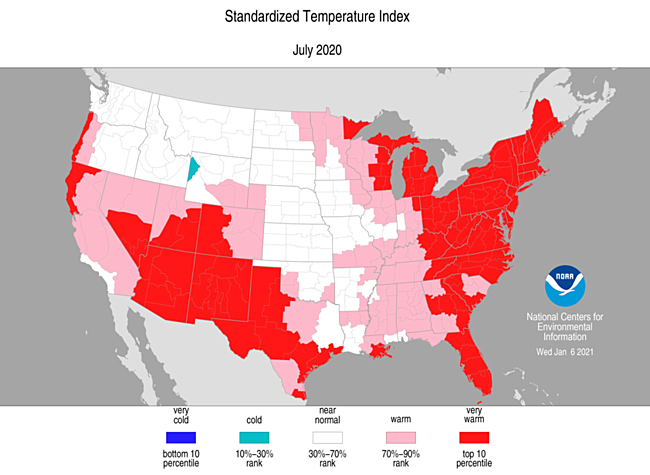
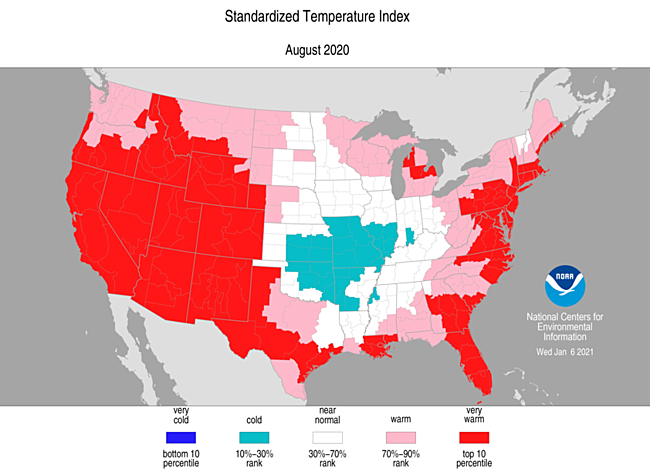
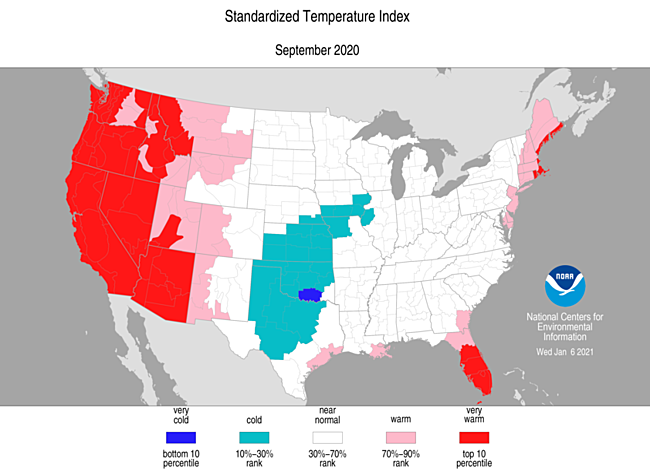
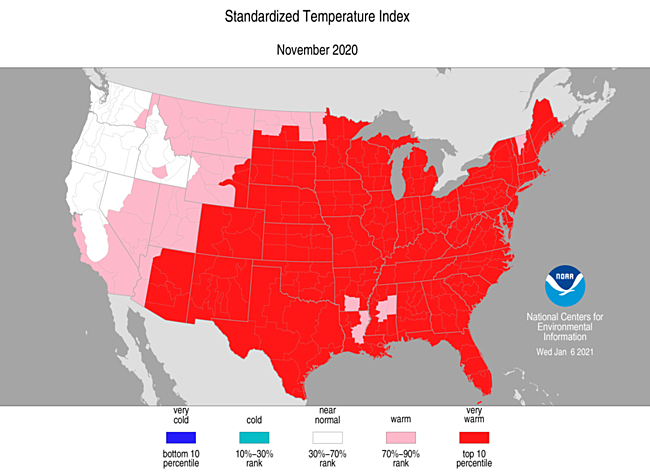
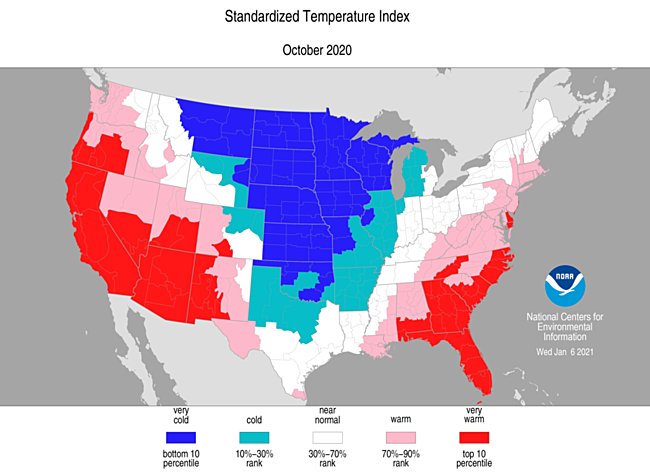
Weather conditions varied across the country from month to month during 2020, with some short-term very dry conditions occurring and unusual anomalous warmth frequently occurring. About five percent or more of the contiguous U.S. (CONUS) was very dry during every month except December, with ten percent or more very dry in February (11.7%), April (13.6%), July (14.0%), August (30.8%), September (14.0%), and October (18.6%). Dryness in August was severe with almost a third of the CONUS very dry. Expansive very wet conditions were not as frequent as the dry conditions — except early in the year. Five percent or more of the contiguous U.S. (CONUS) was very wet during every month except June, November, and December, with ten percent or more very wet during February (12.9%), March (16.4%), and July (10.0%). During January to March, more of the country was very wet than very dry, but starting in April more of the country was very dry than very wet. Unusually warm temperatures dominated much of the country during most months. At least ten percent of the CONUS was very warm in every month but February and April. A fifth (20%) or more was very warm in January (23.1%), March (48.2%), May (21.0%), July (37.3%), August (46.4%), September (22.3%), and November (68.6%). A third or more of the CONUS was very warm during March, July, August, and November, and two-thirds was very warm in November. Above-normal temperatures enhance evapotranspiration which worsens drought conditions, especially in the summer months. Extensive areas of excessive heat and excessive dryness occurred during July, August, and September. Only one month had ten percent or more of the CONUS very cold — October (23.0%).
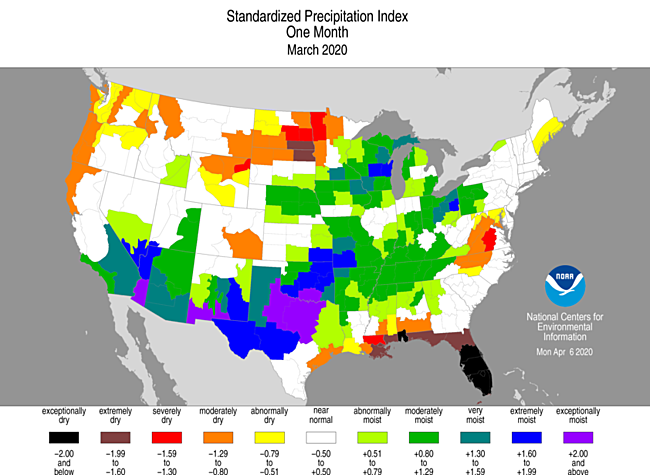
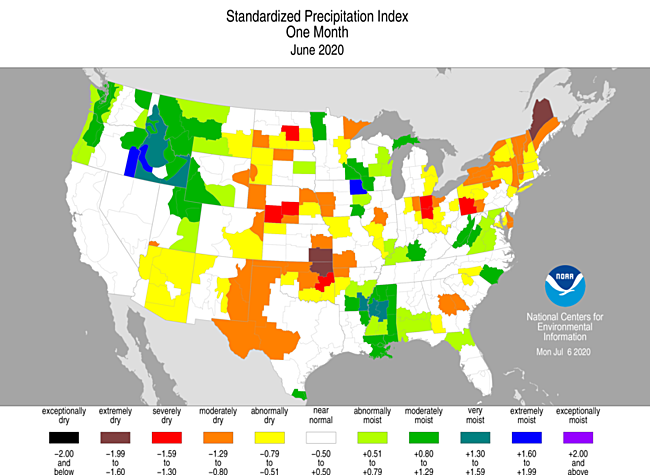
The Palmer Z Index incorporates moisture supply (precipitation) and moisture demand (evapotranspiration) to depict the total moisture status each month. The Palmer Z Index maps below show the monthly moisture status for each month in 2020:
 |
 |
 |
 |
 |
 |
 |
 |
 |
 |
 |
 |
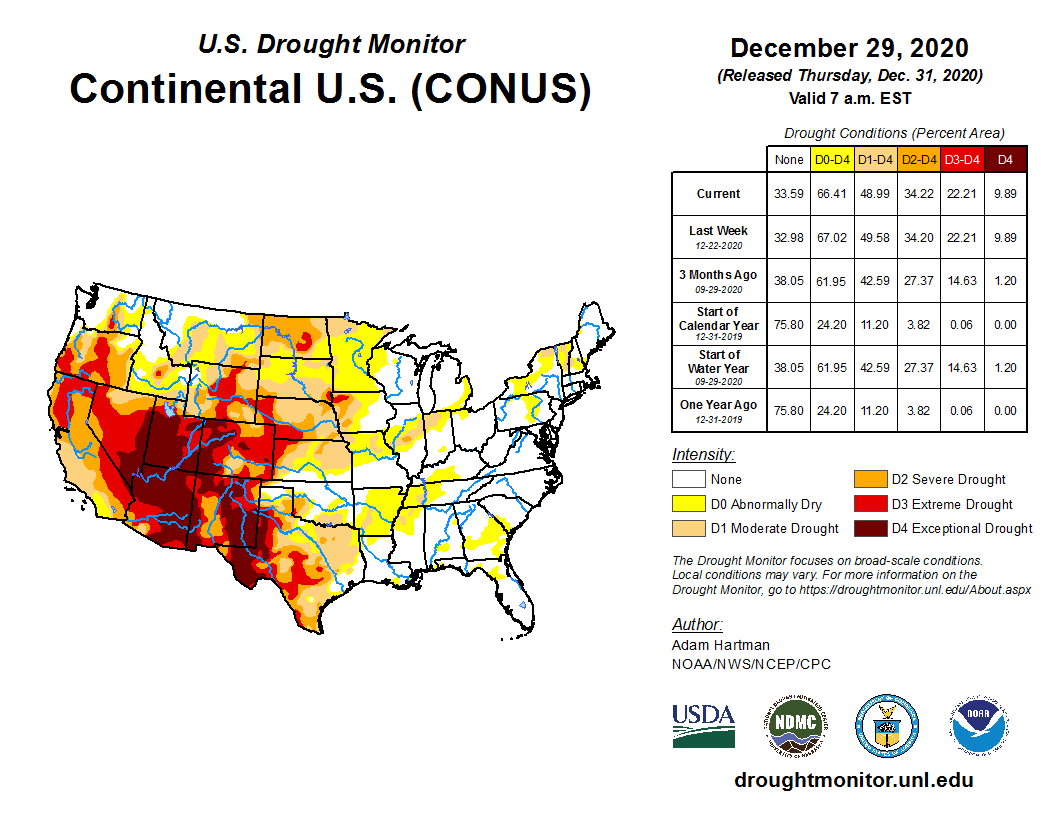
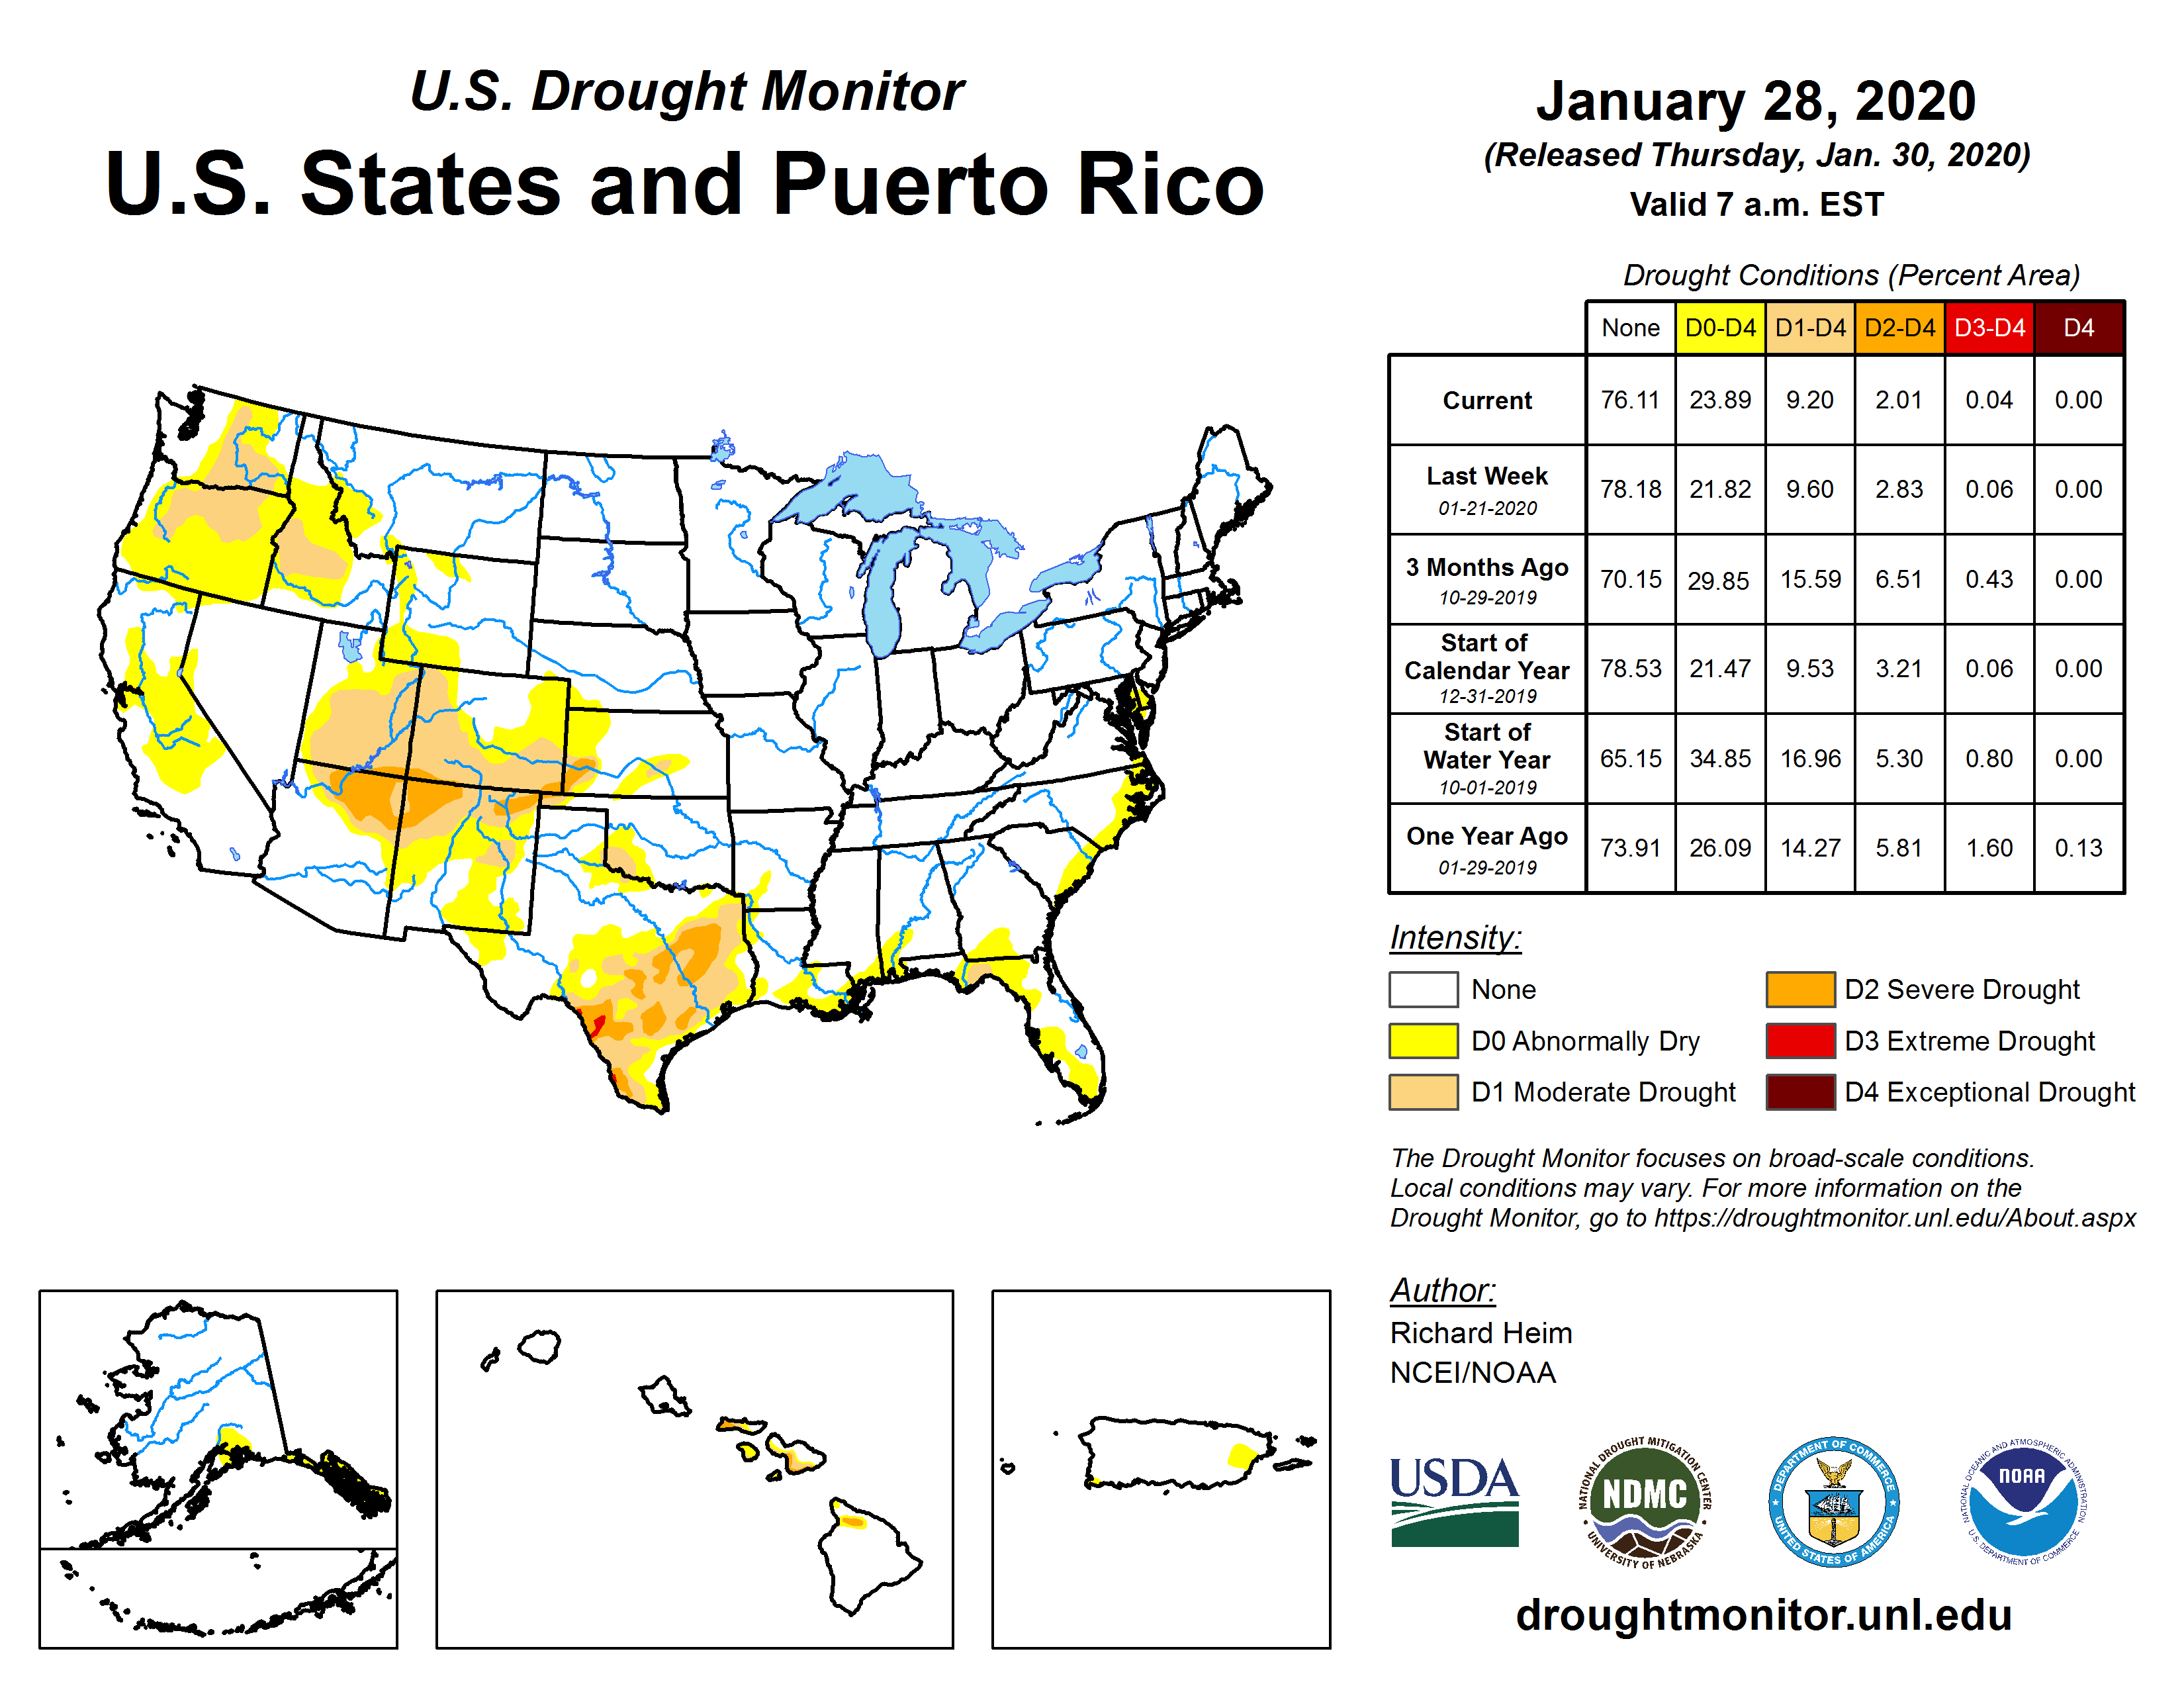
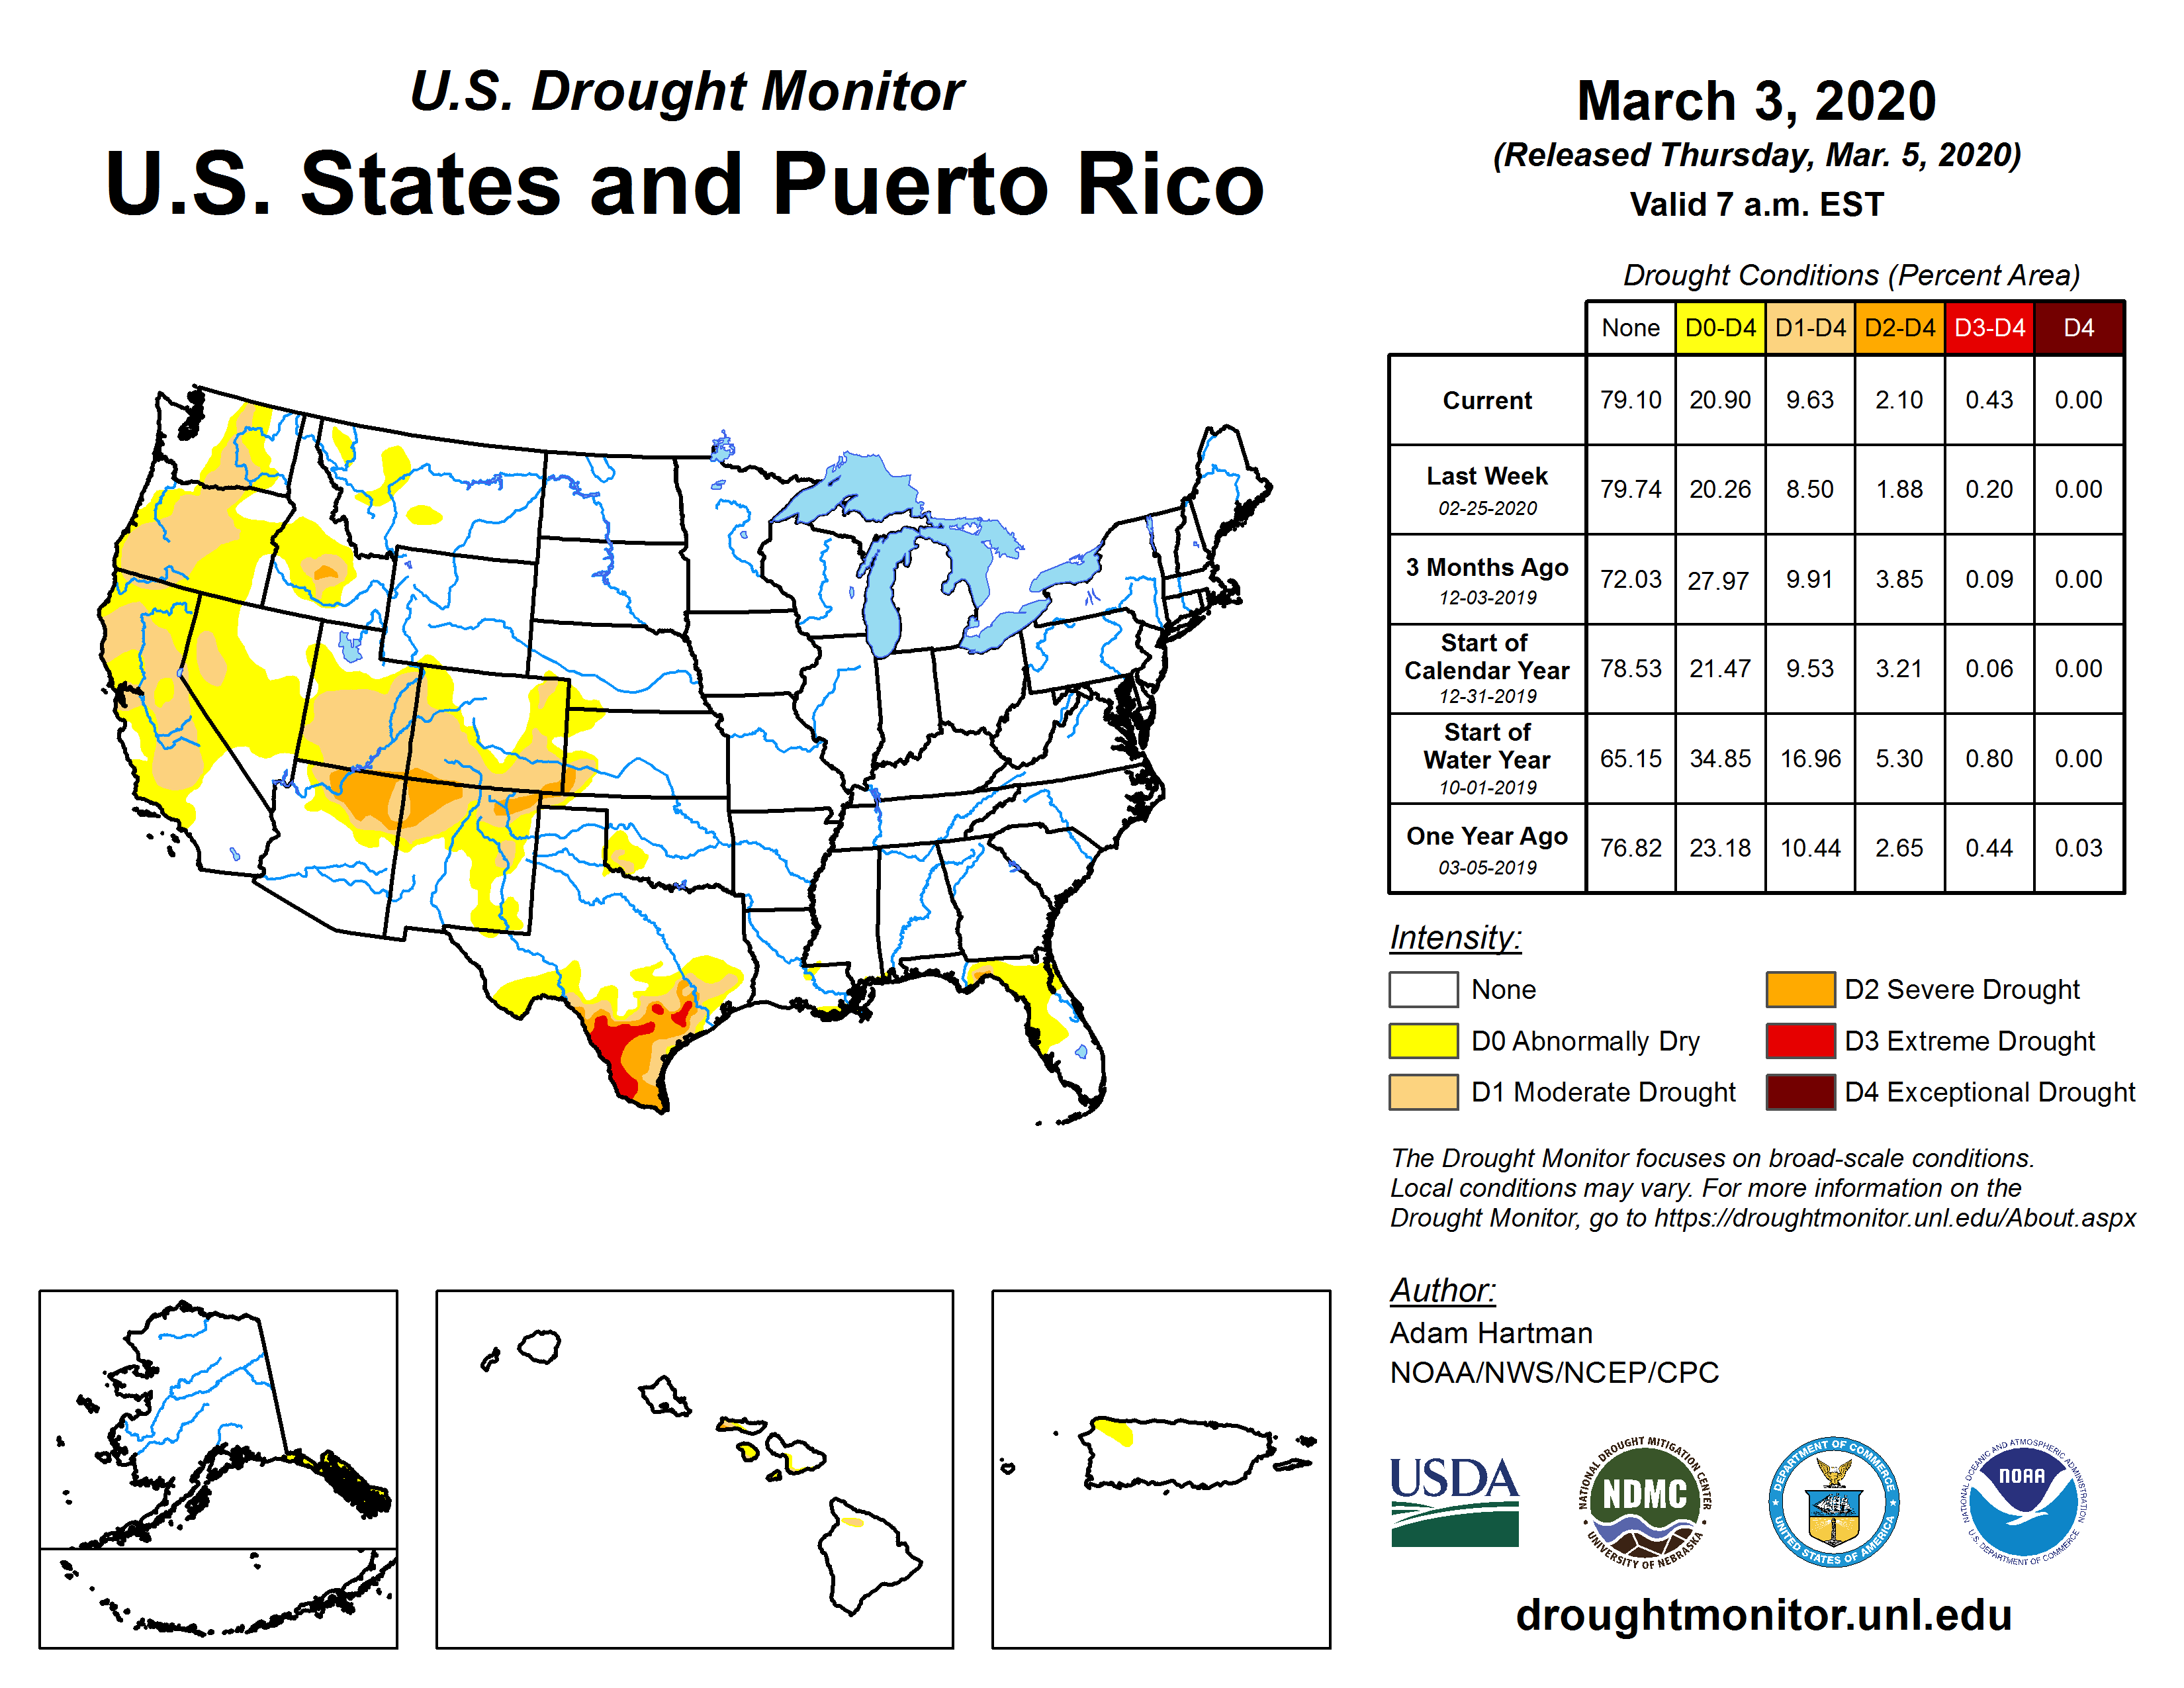
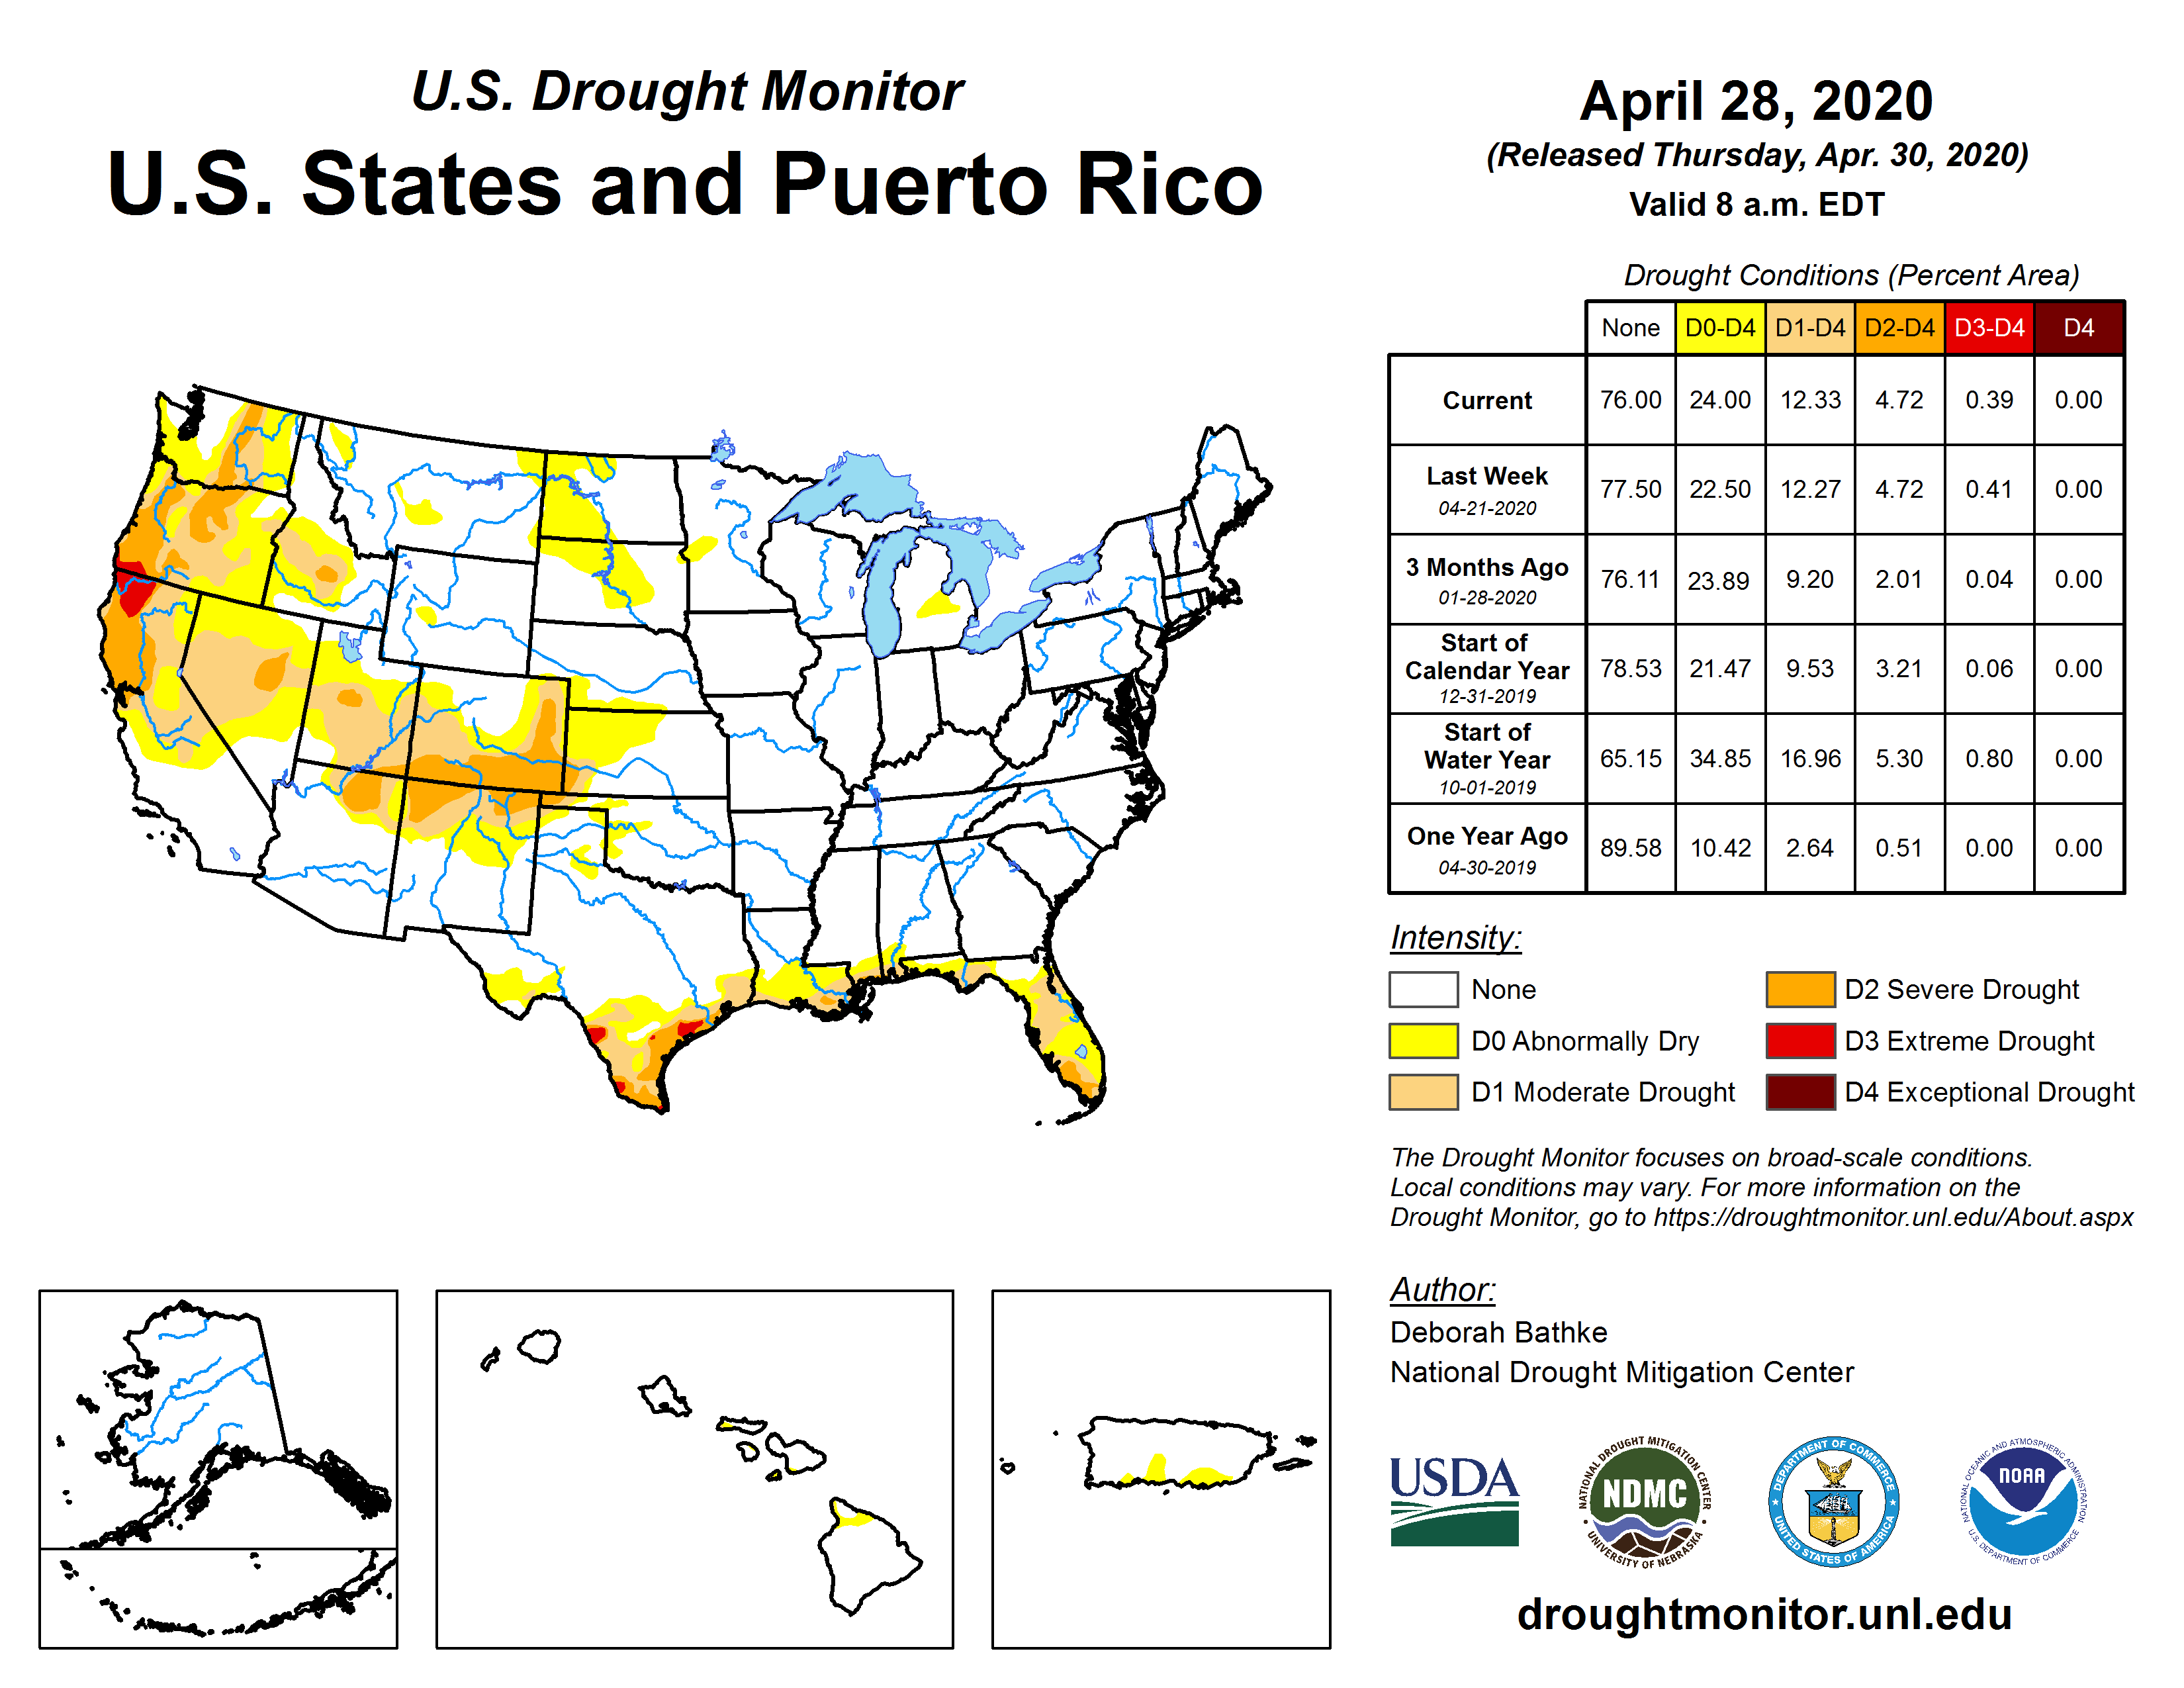
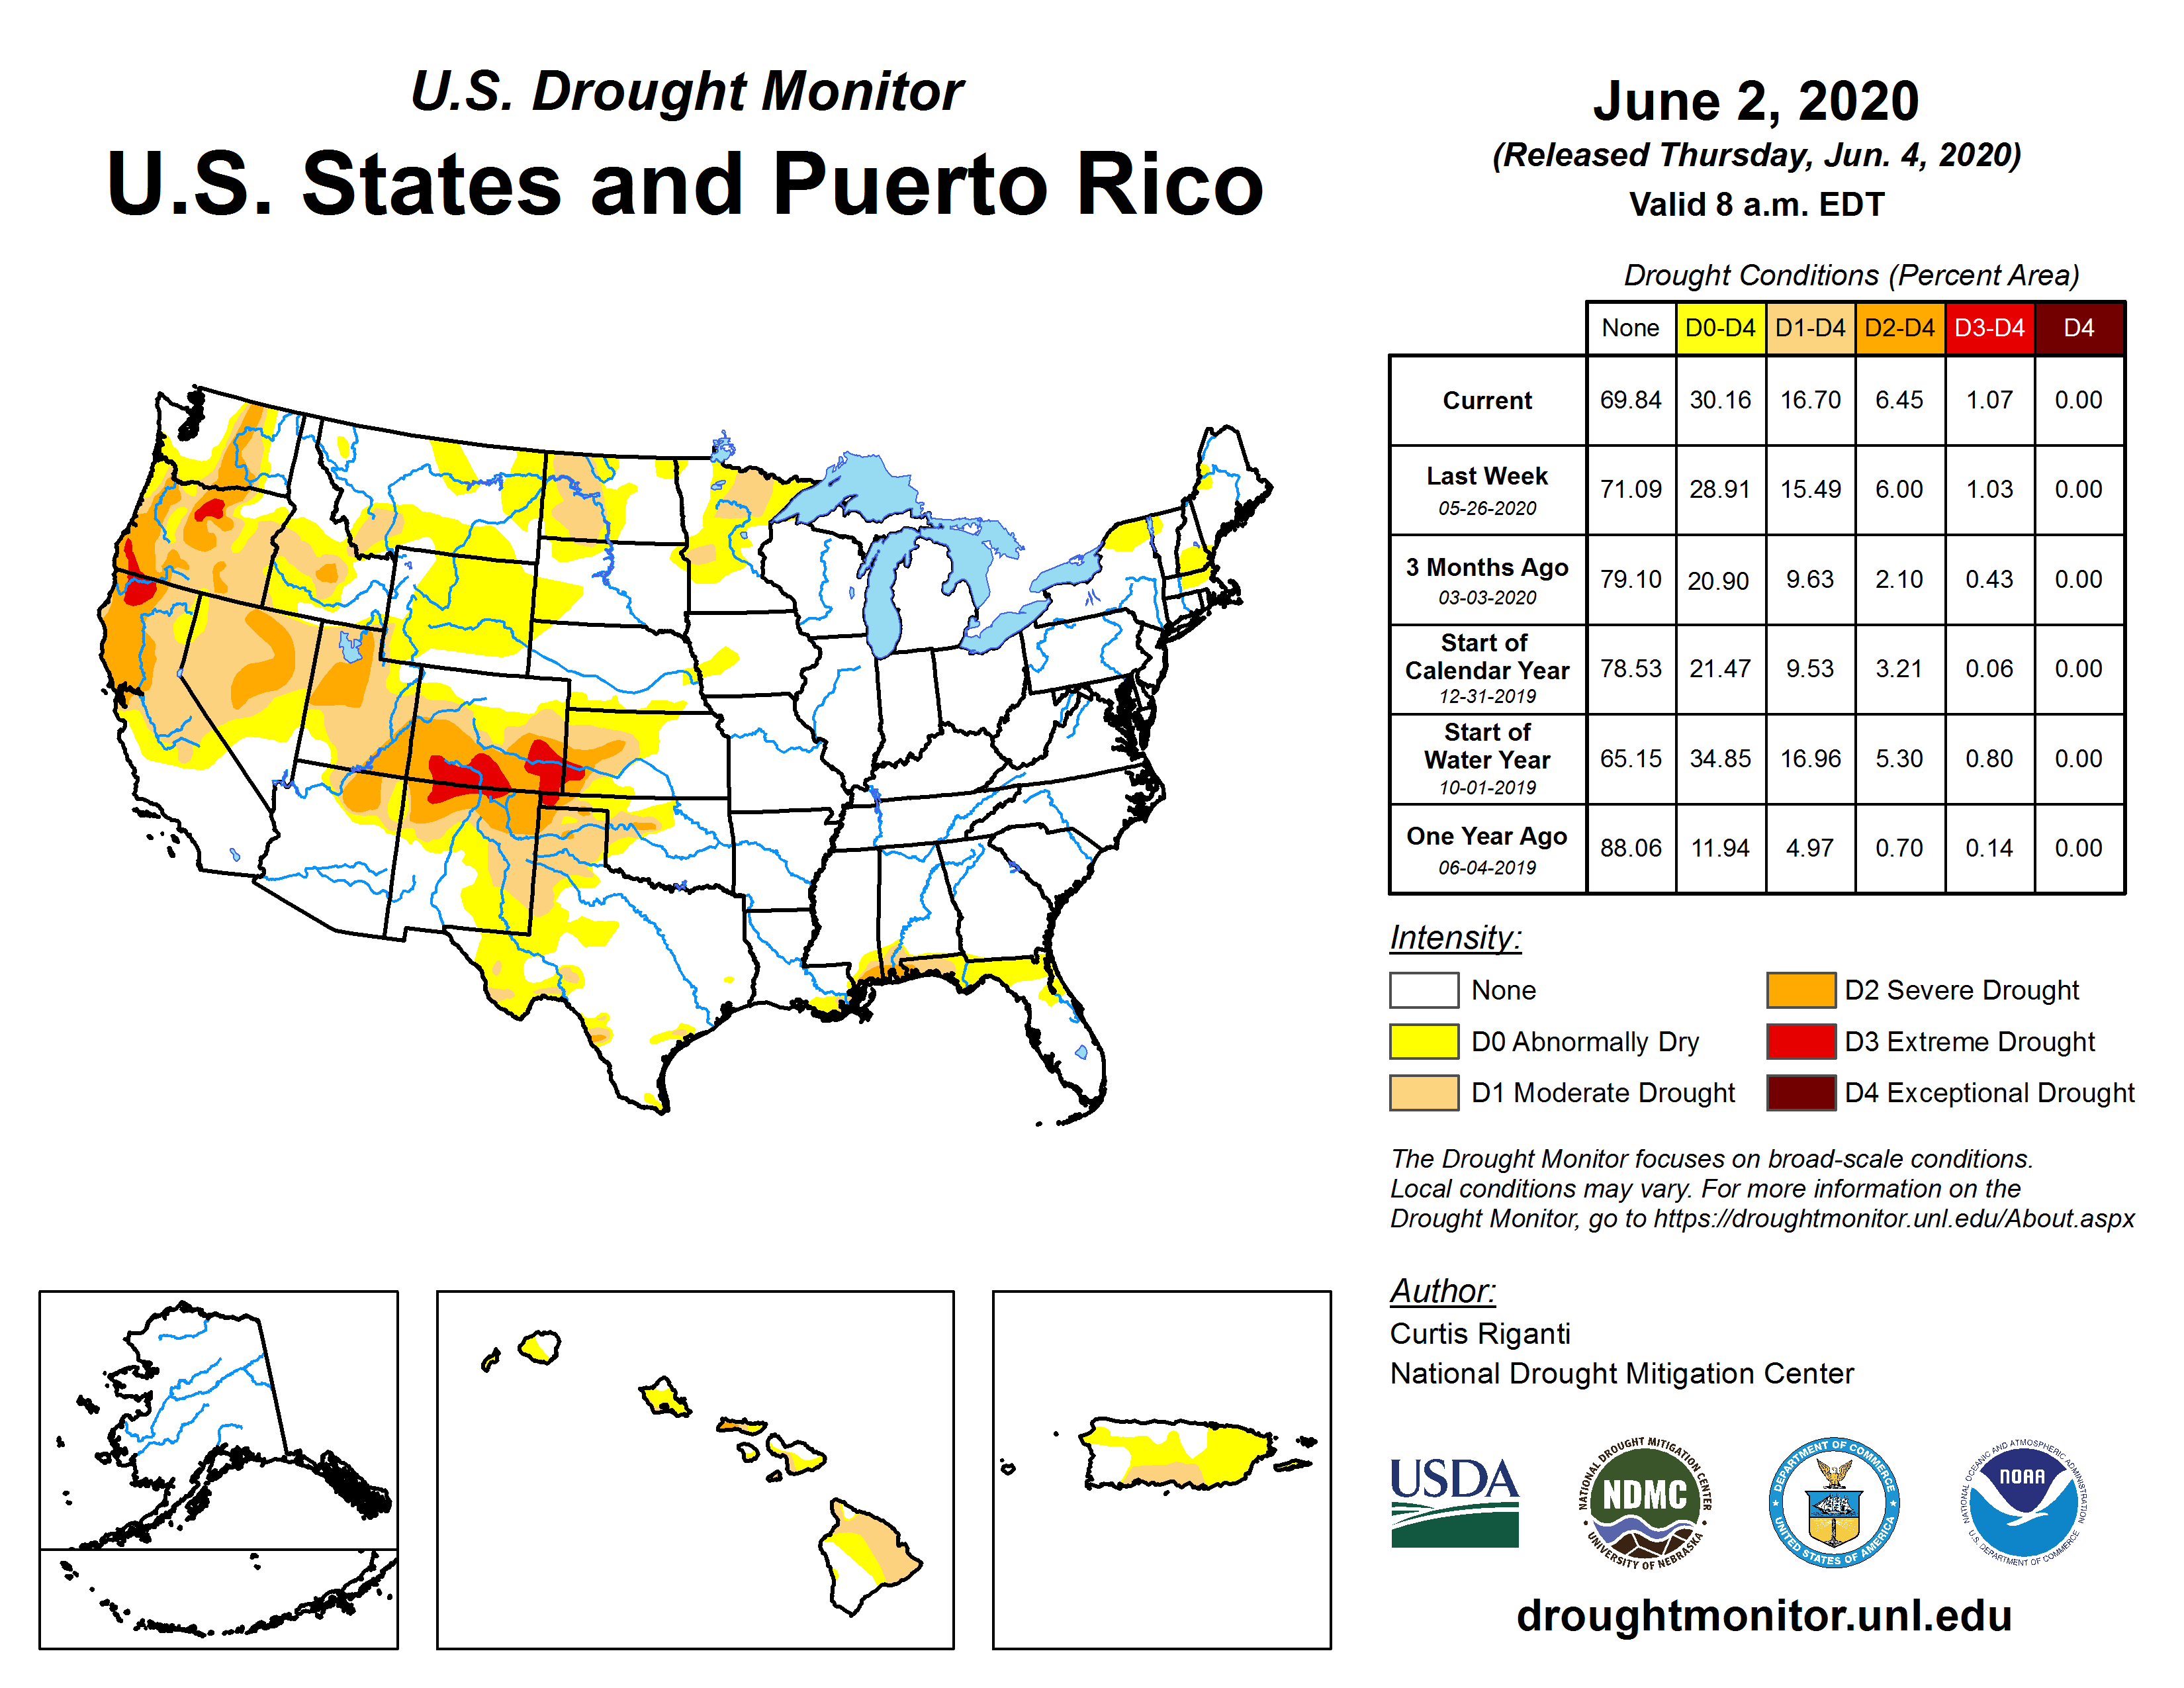
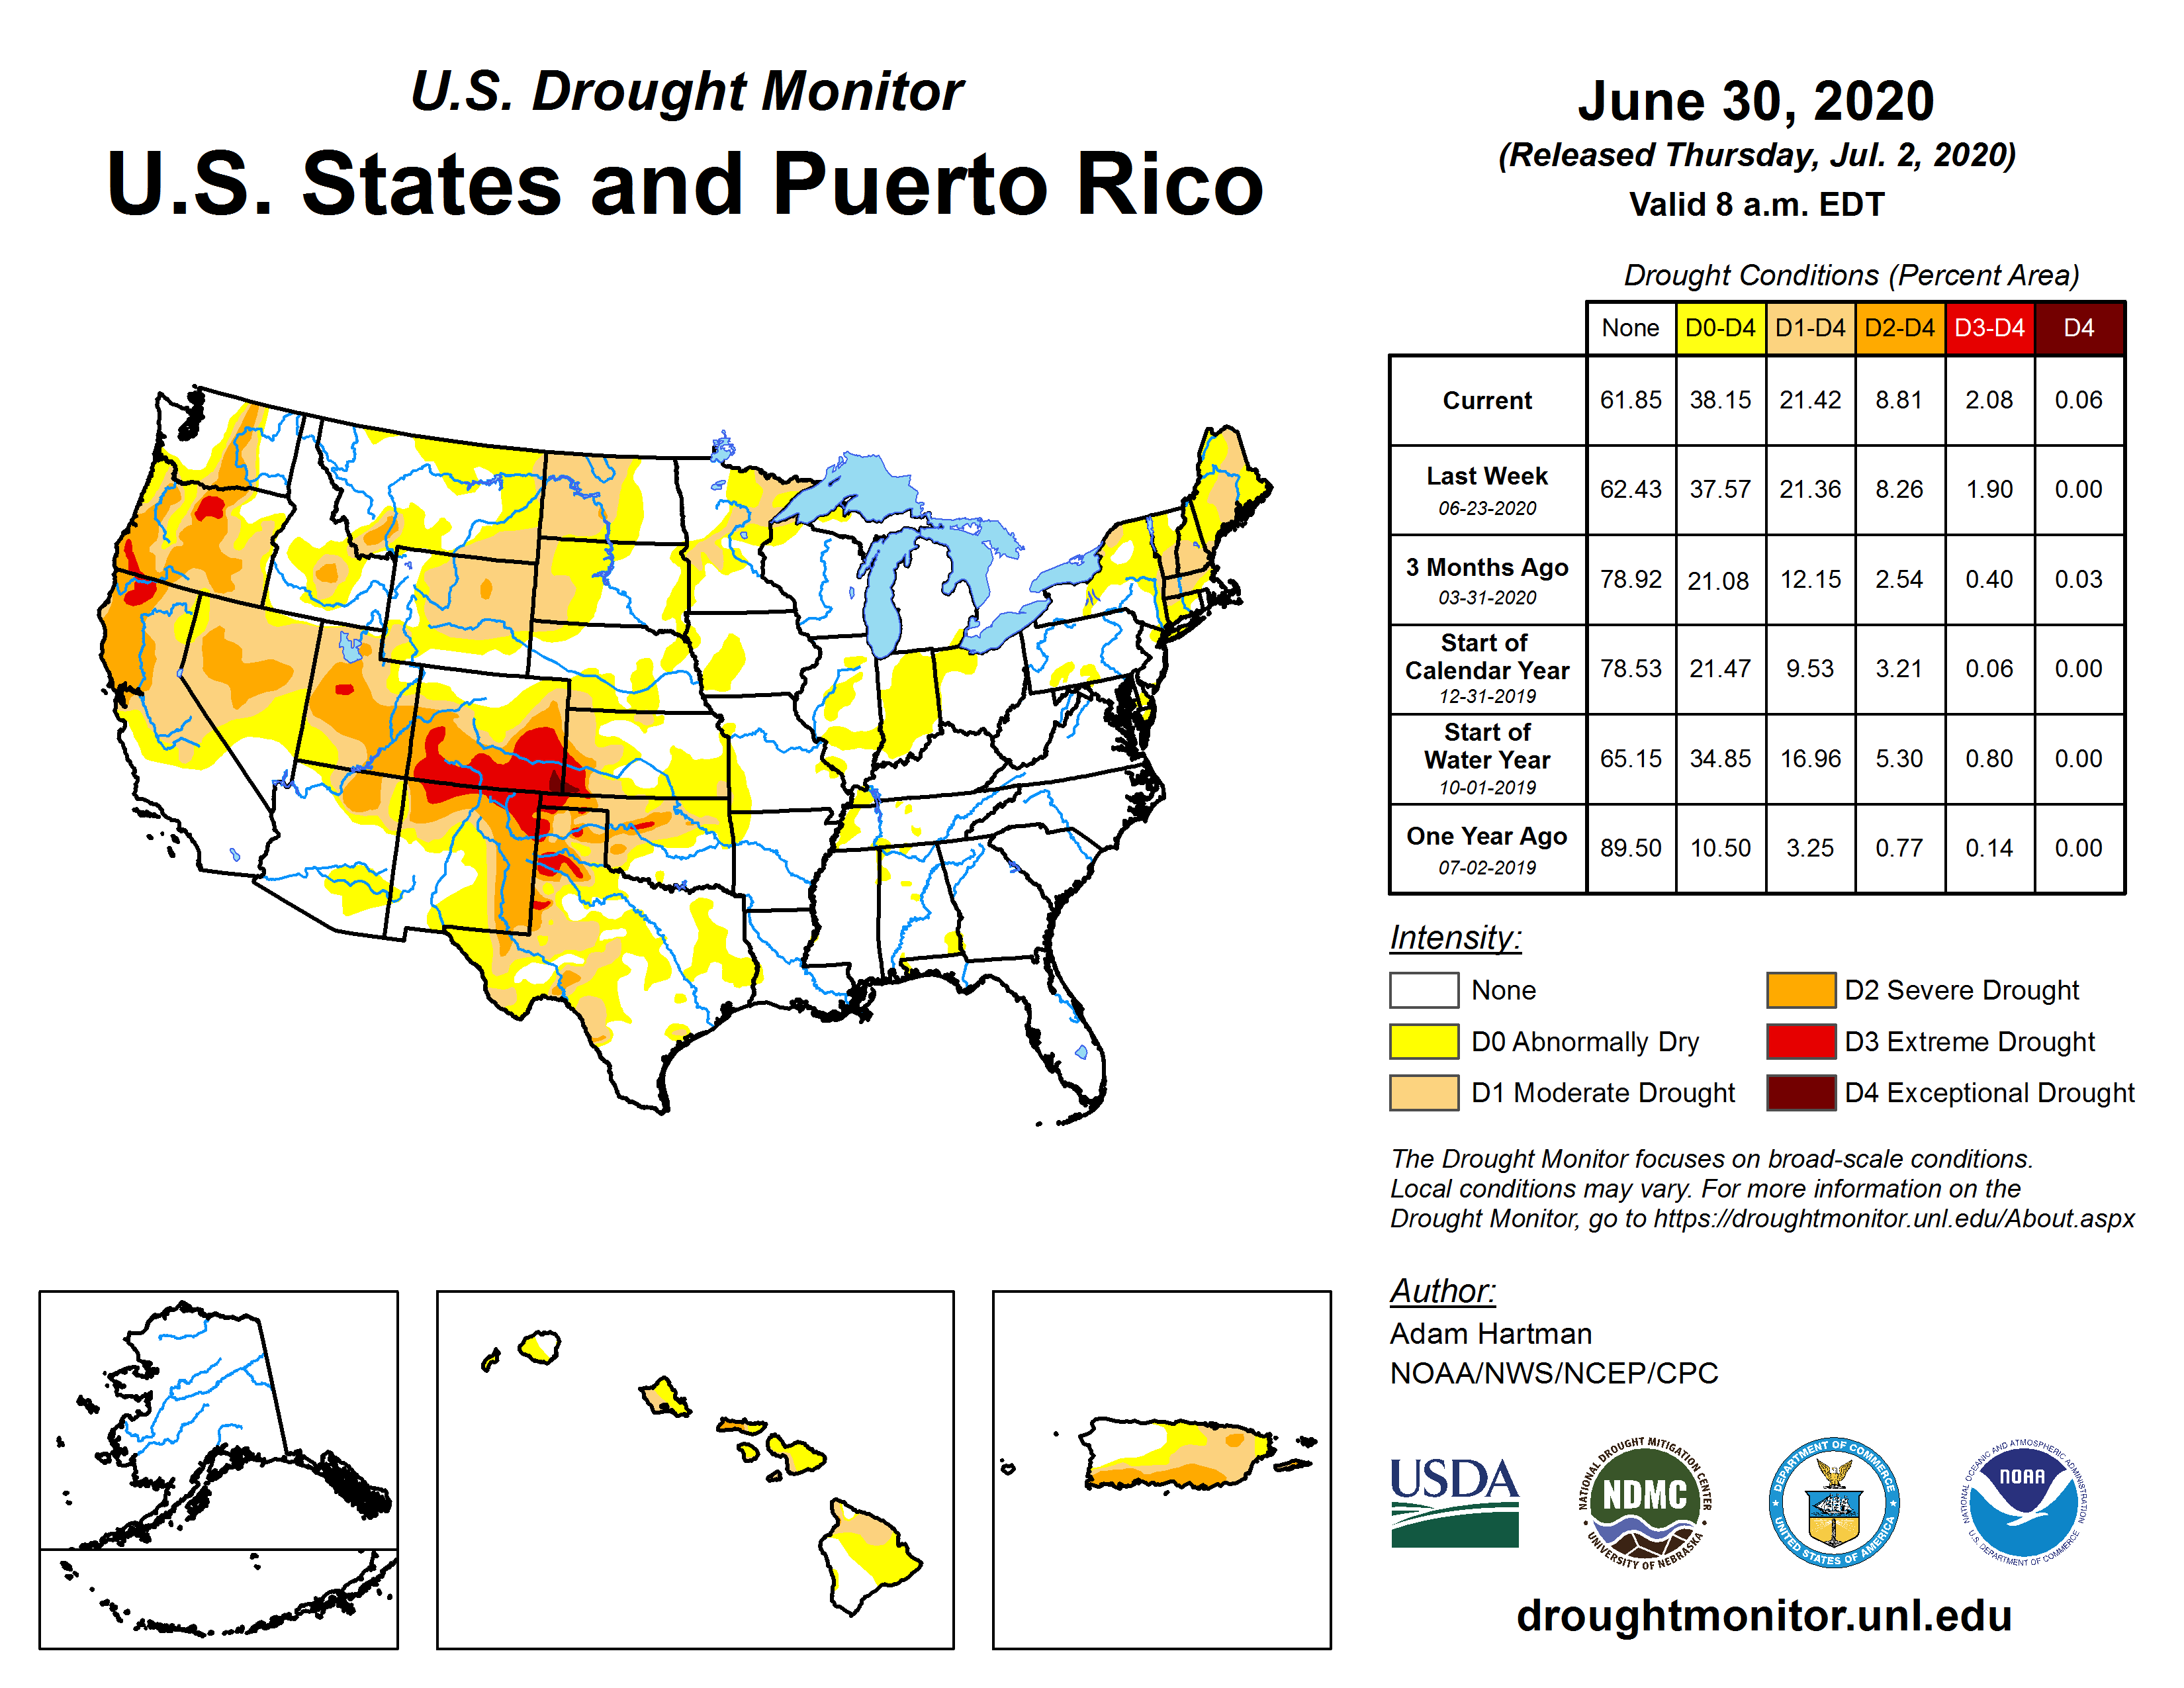
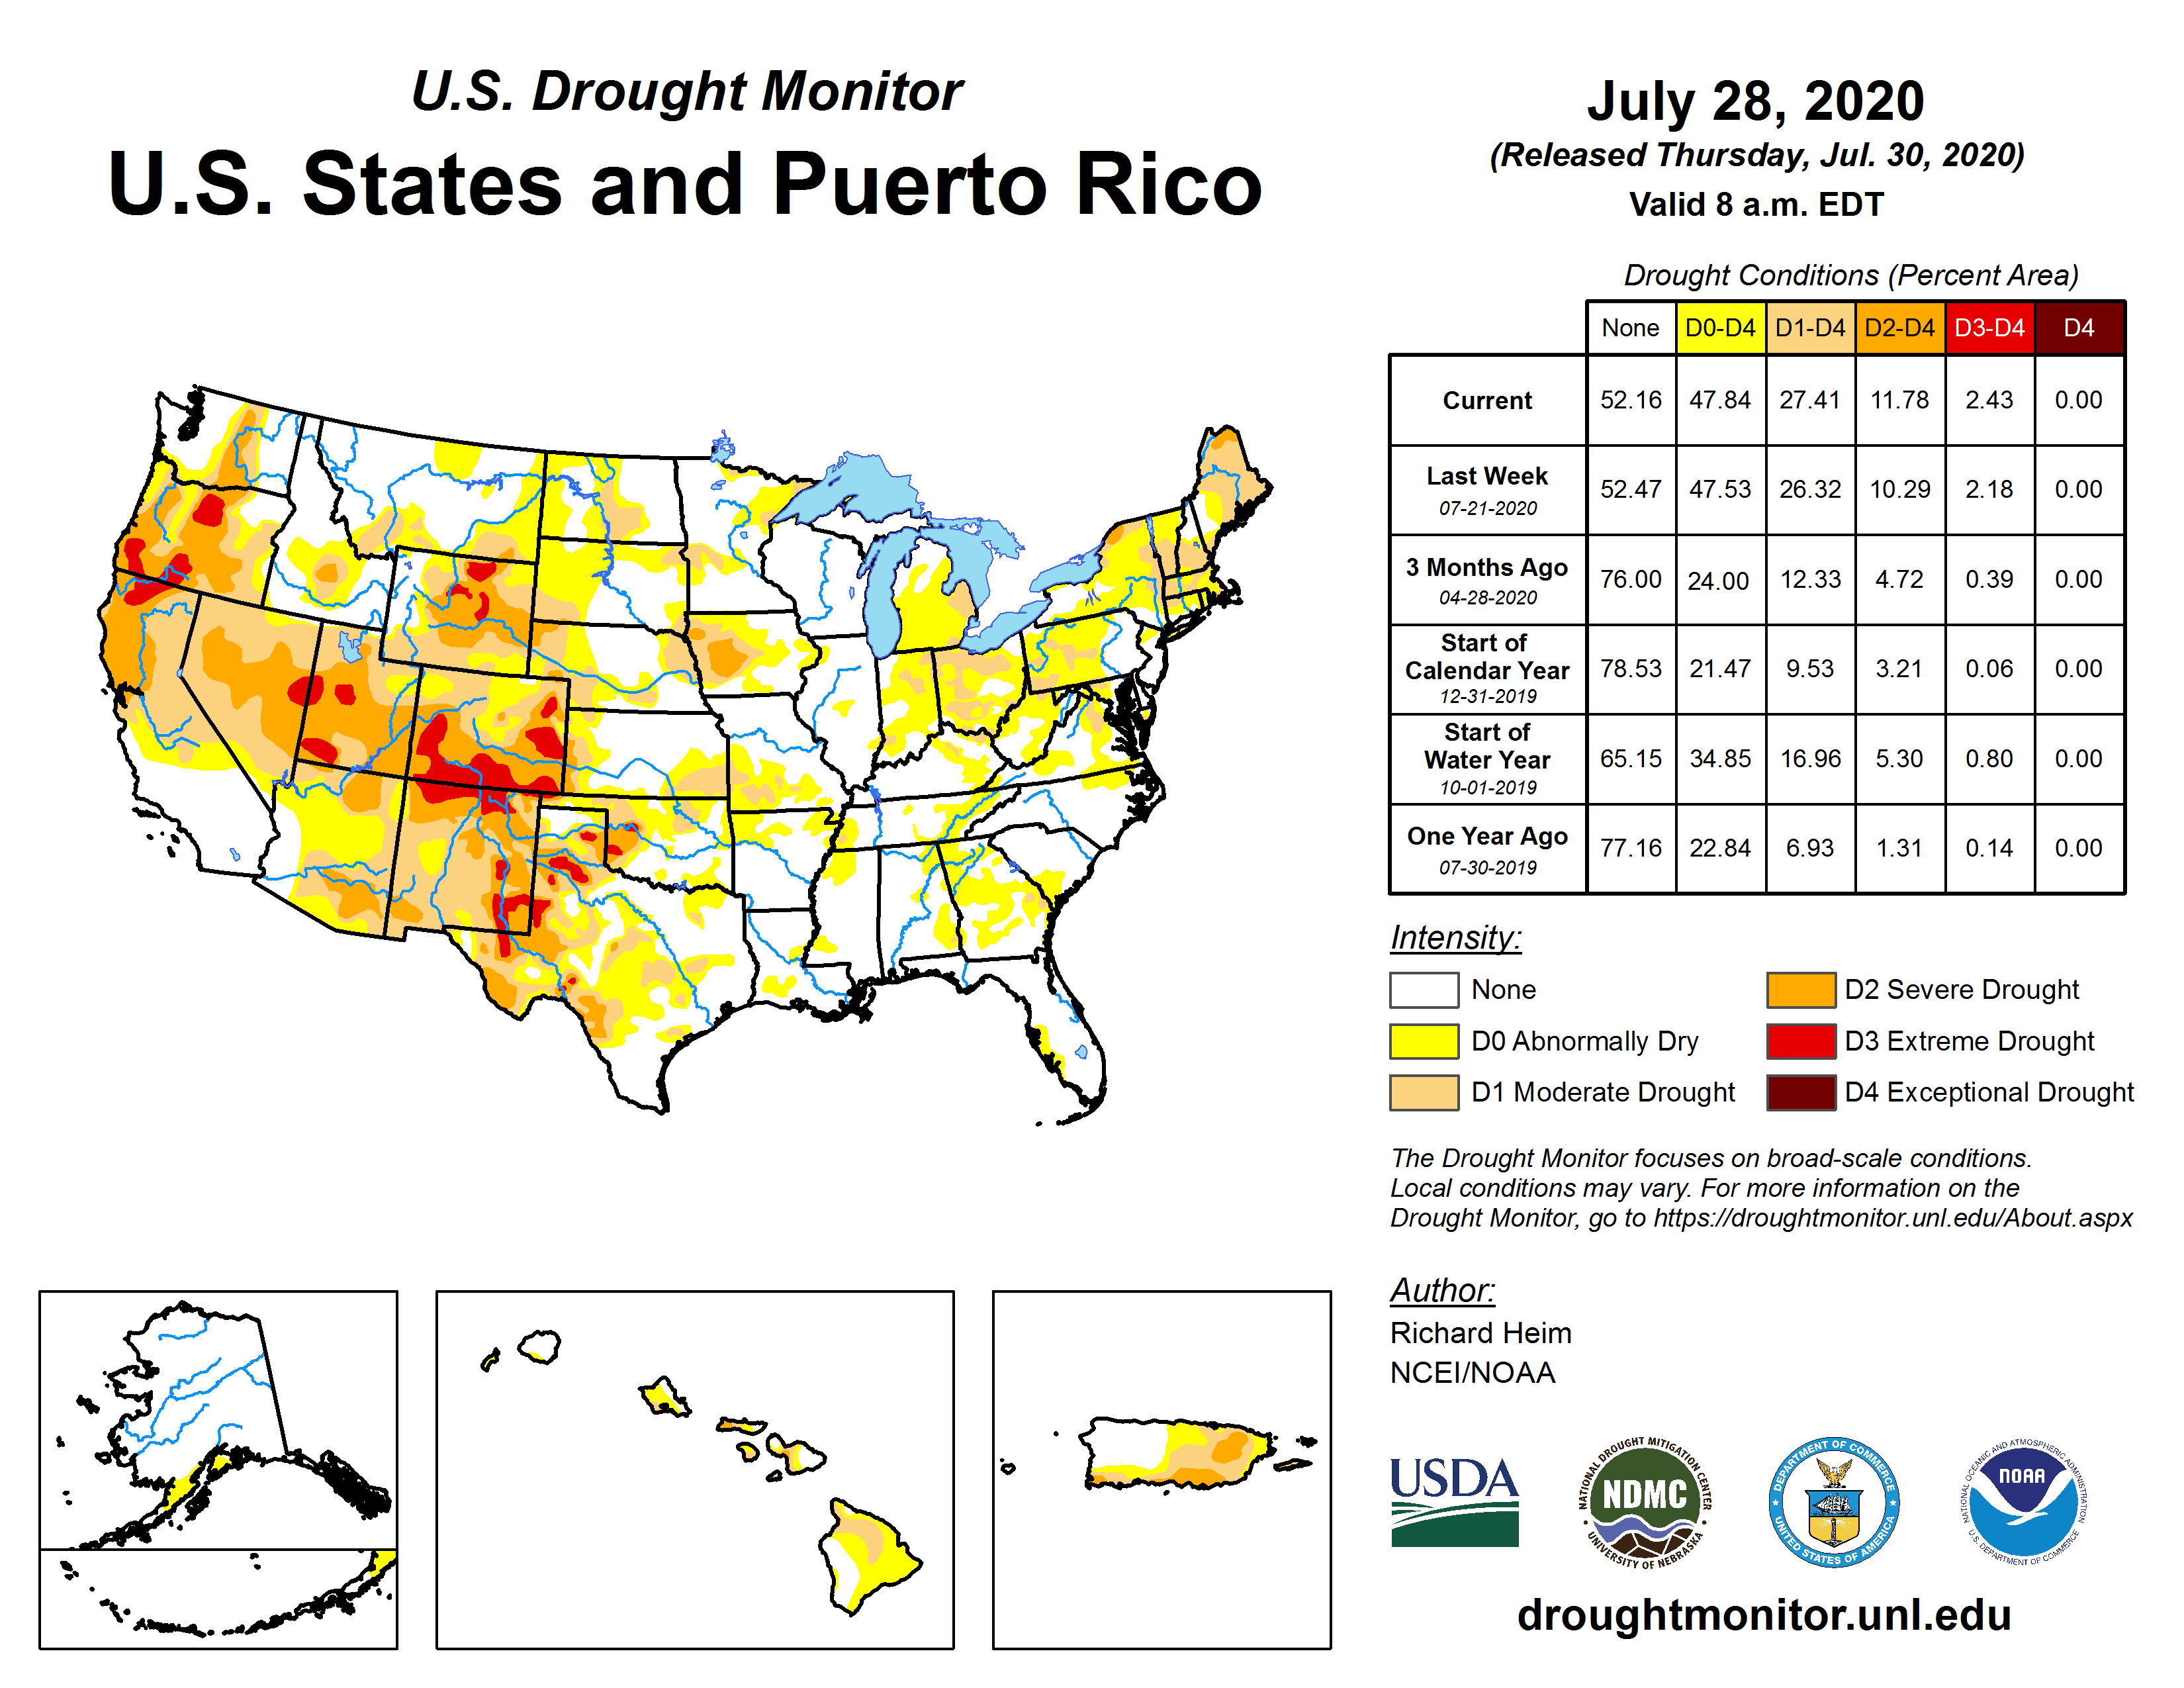
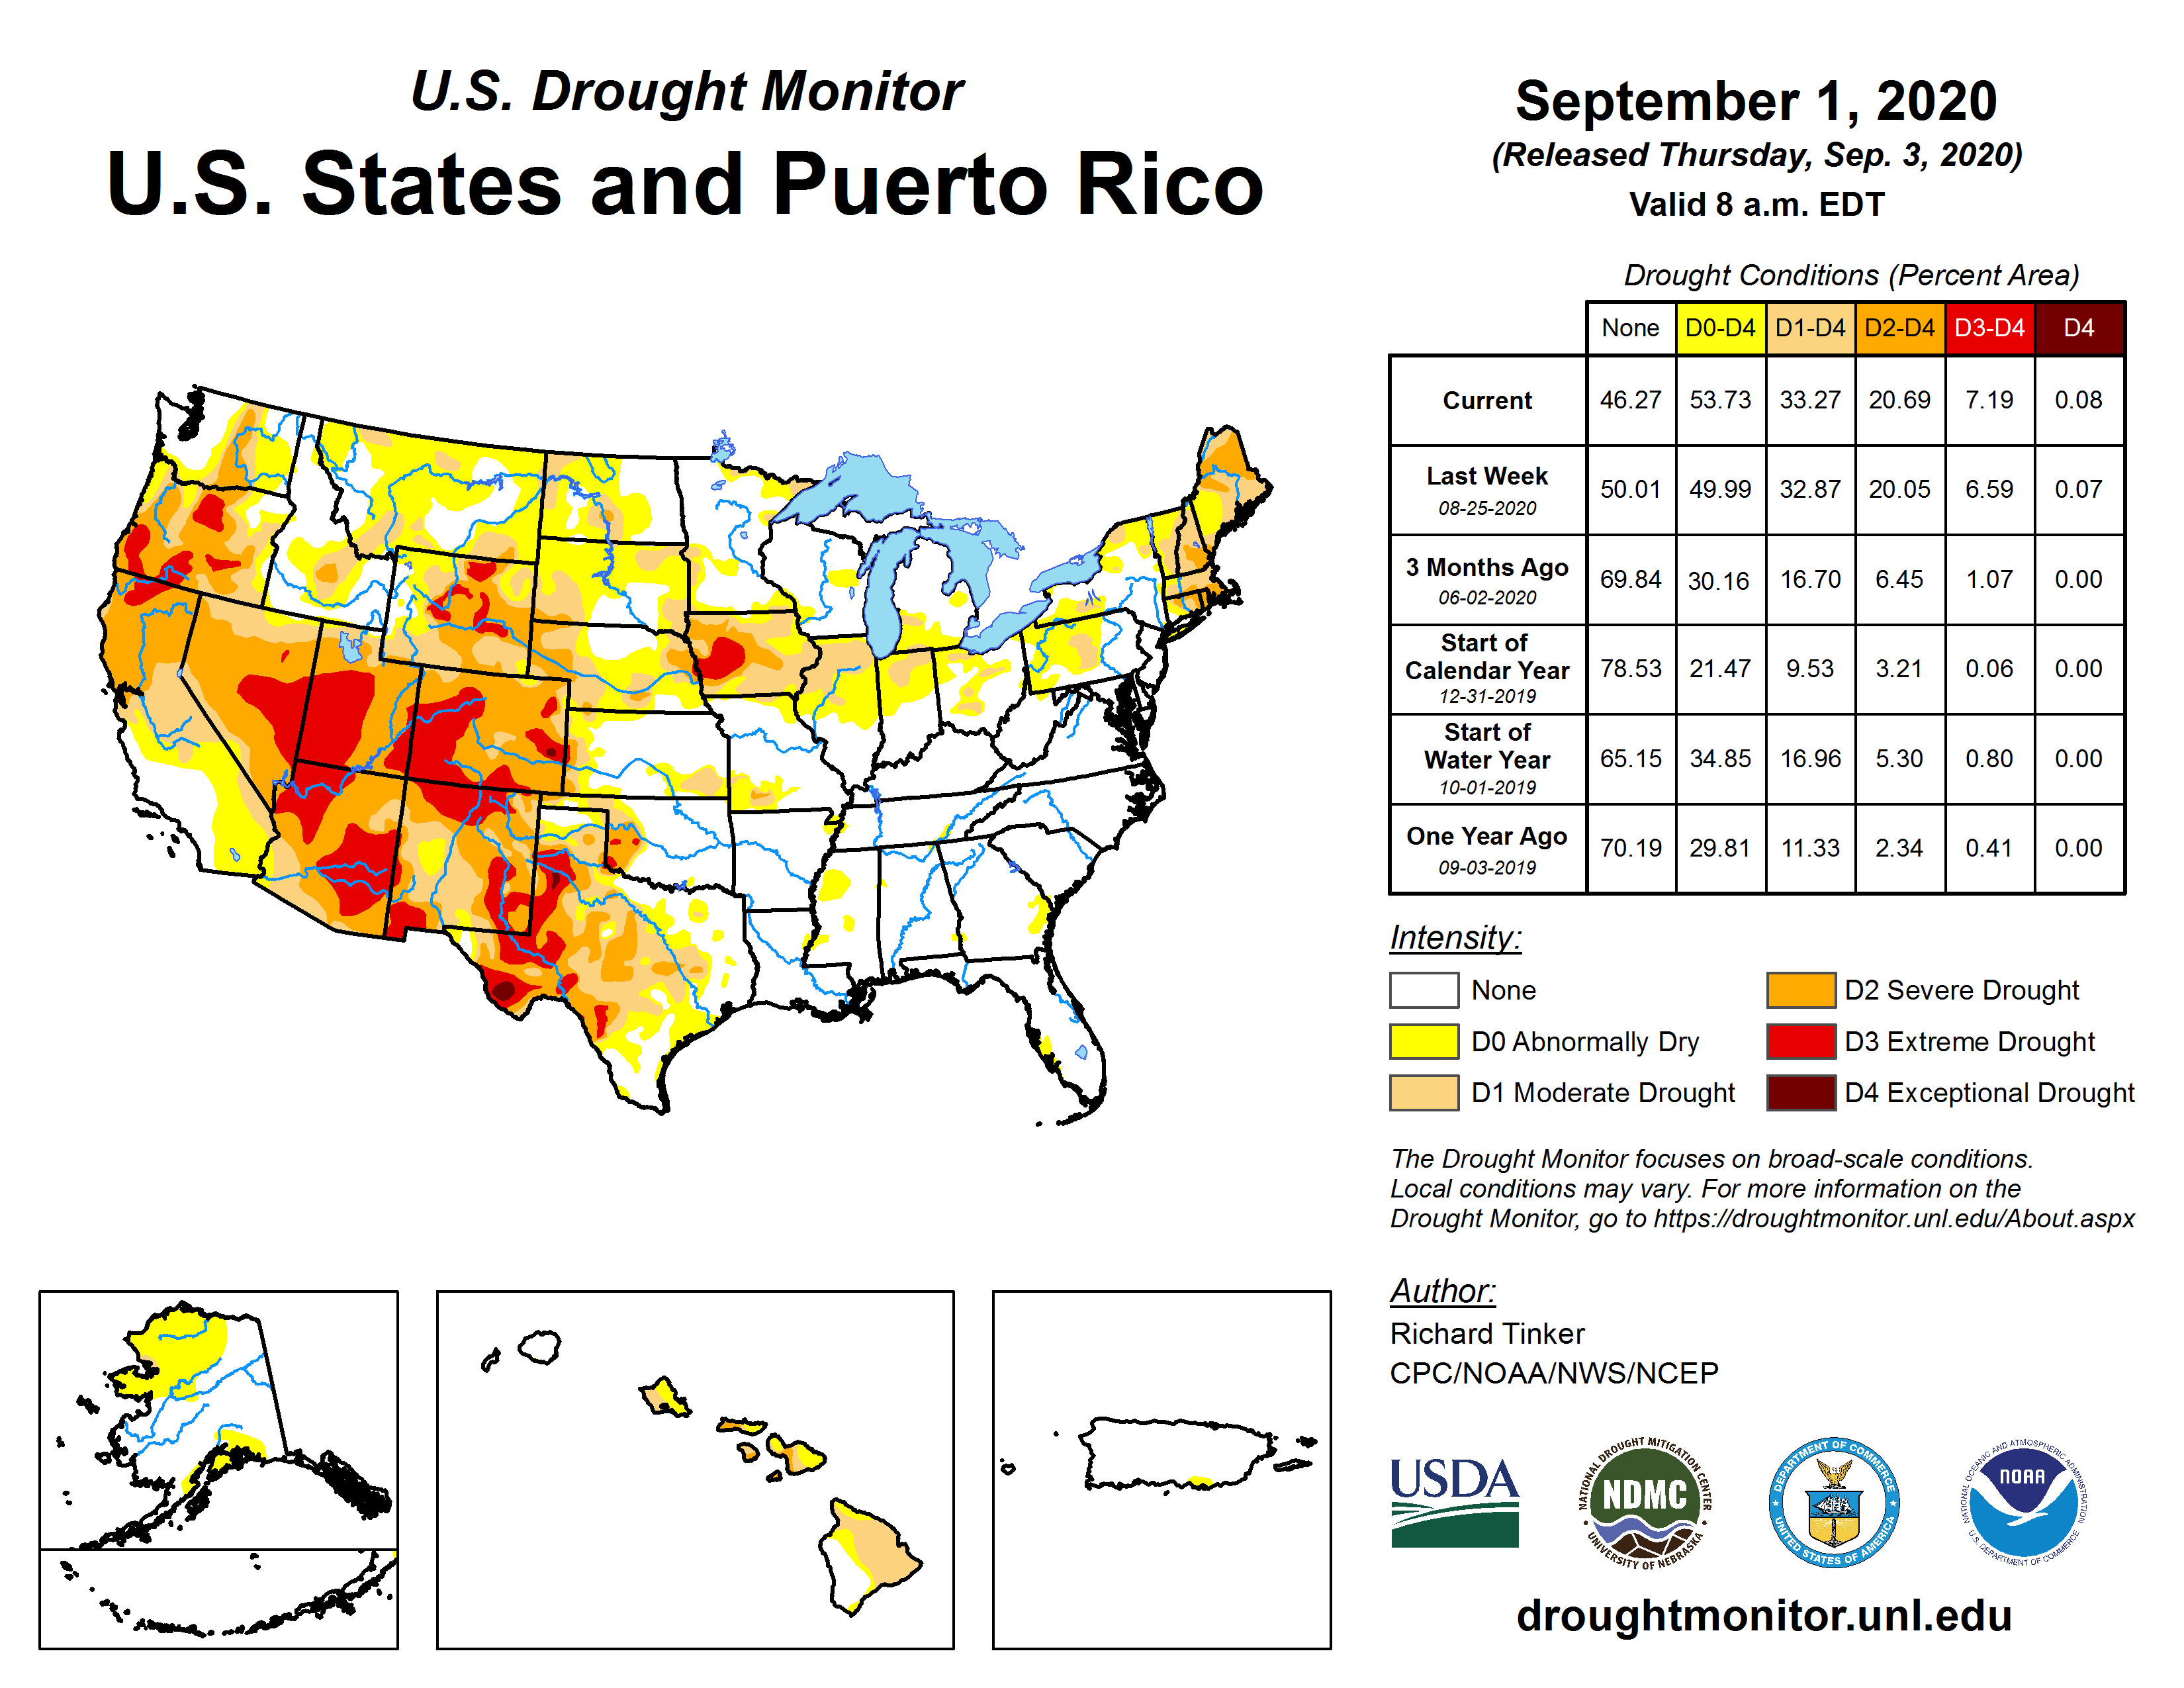
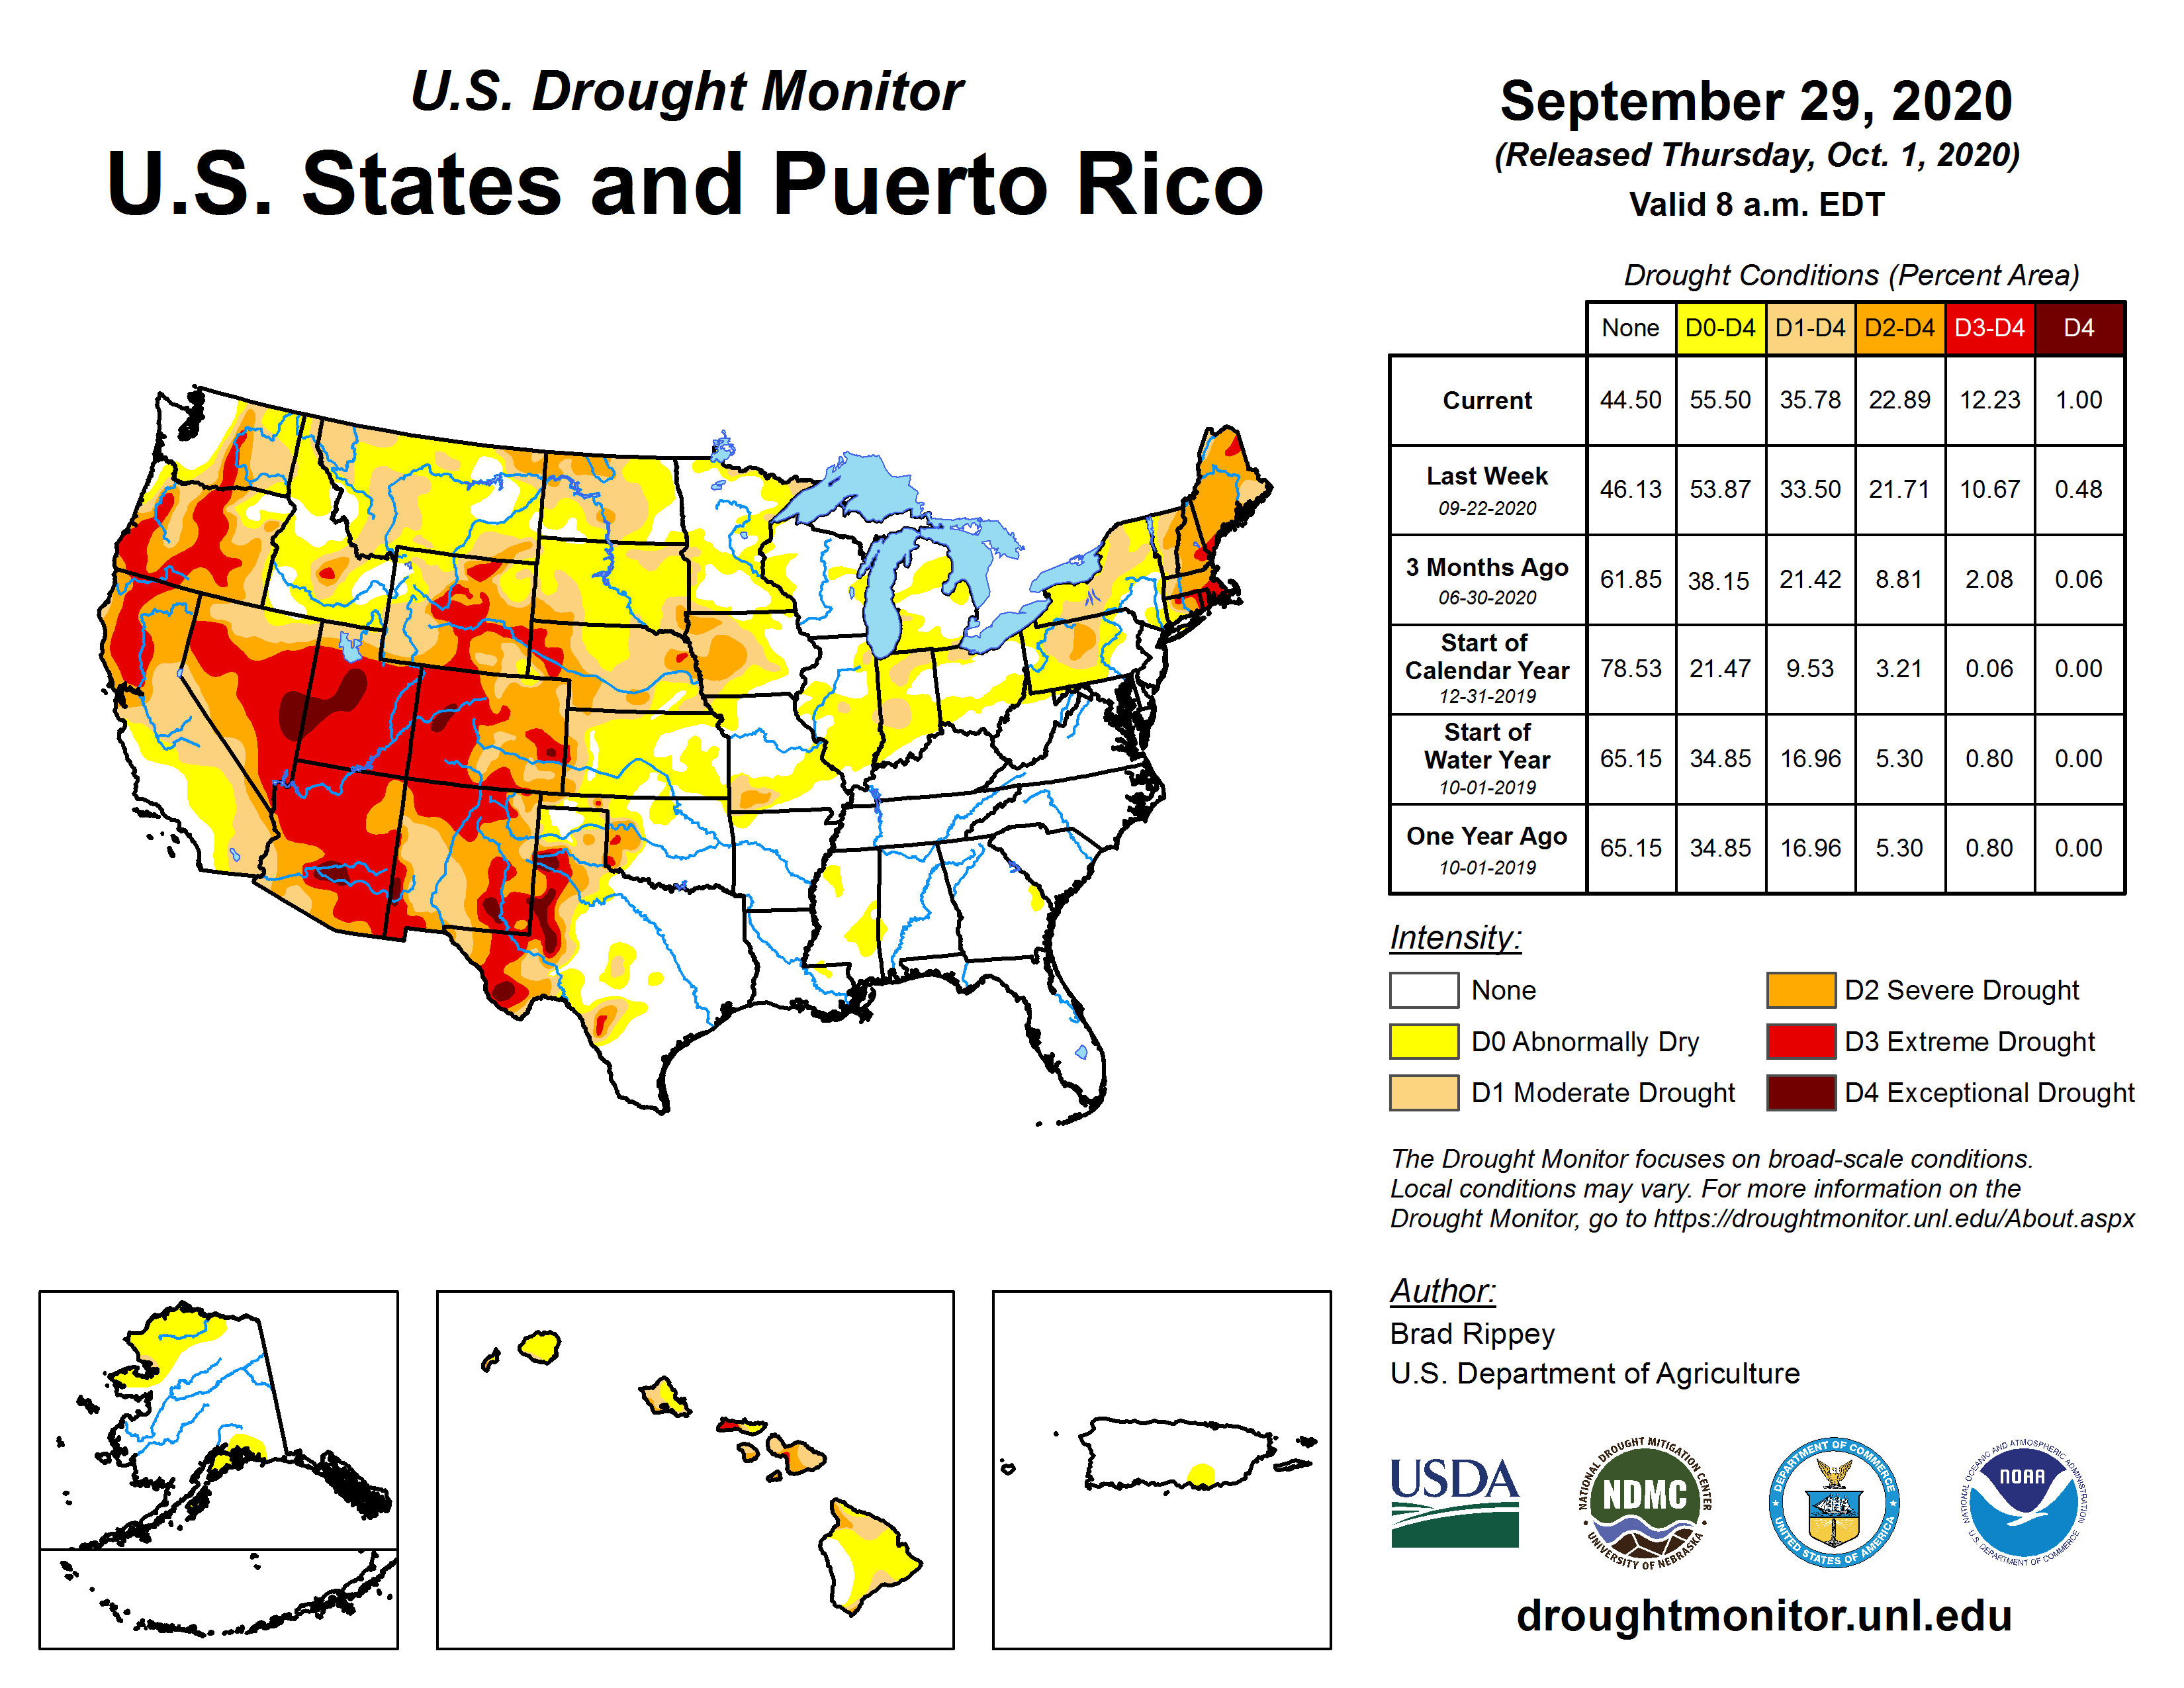
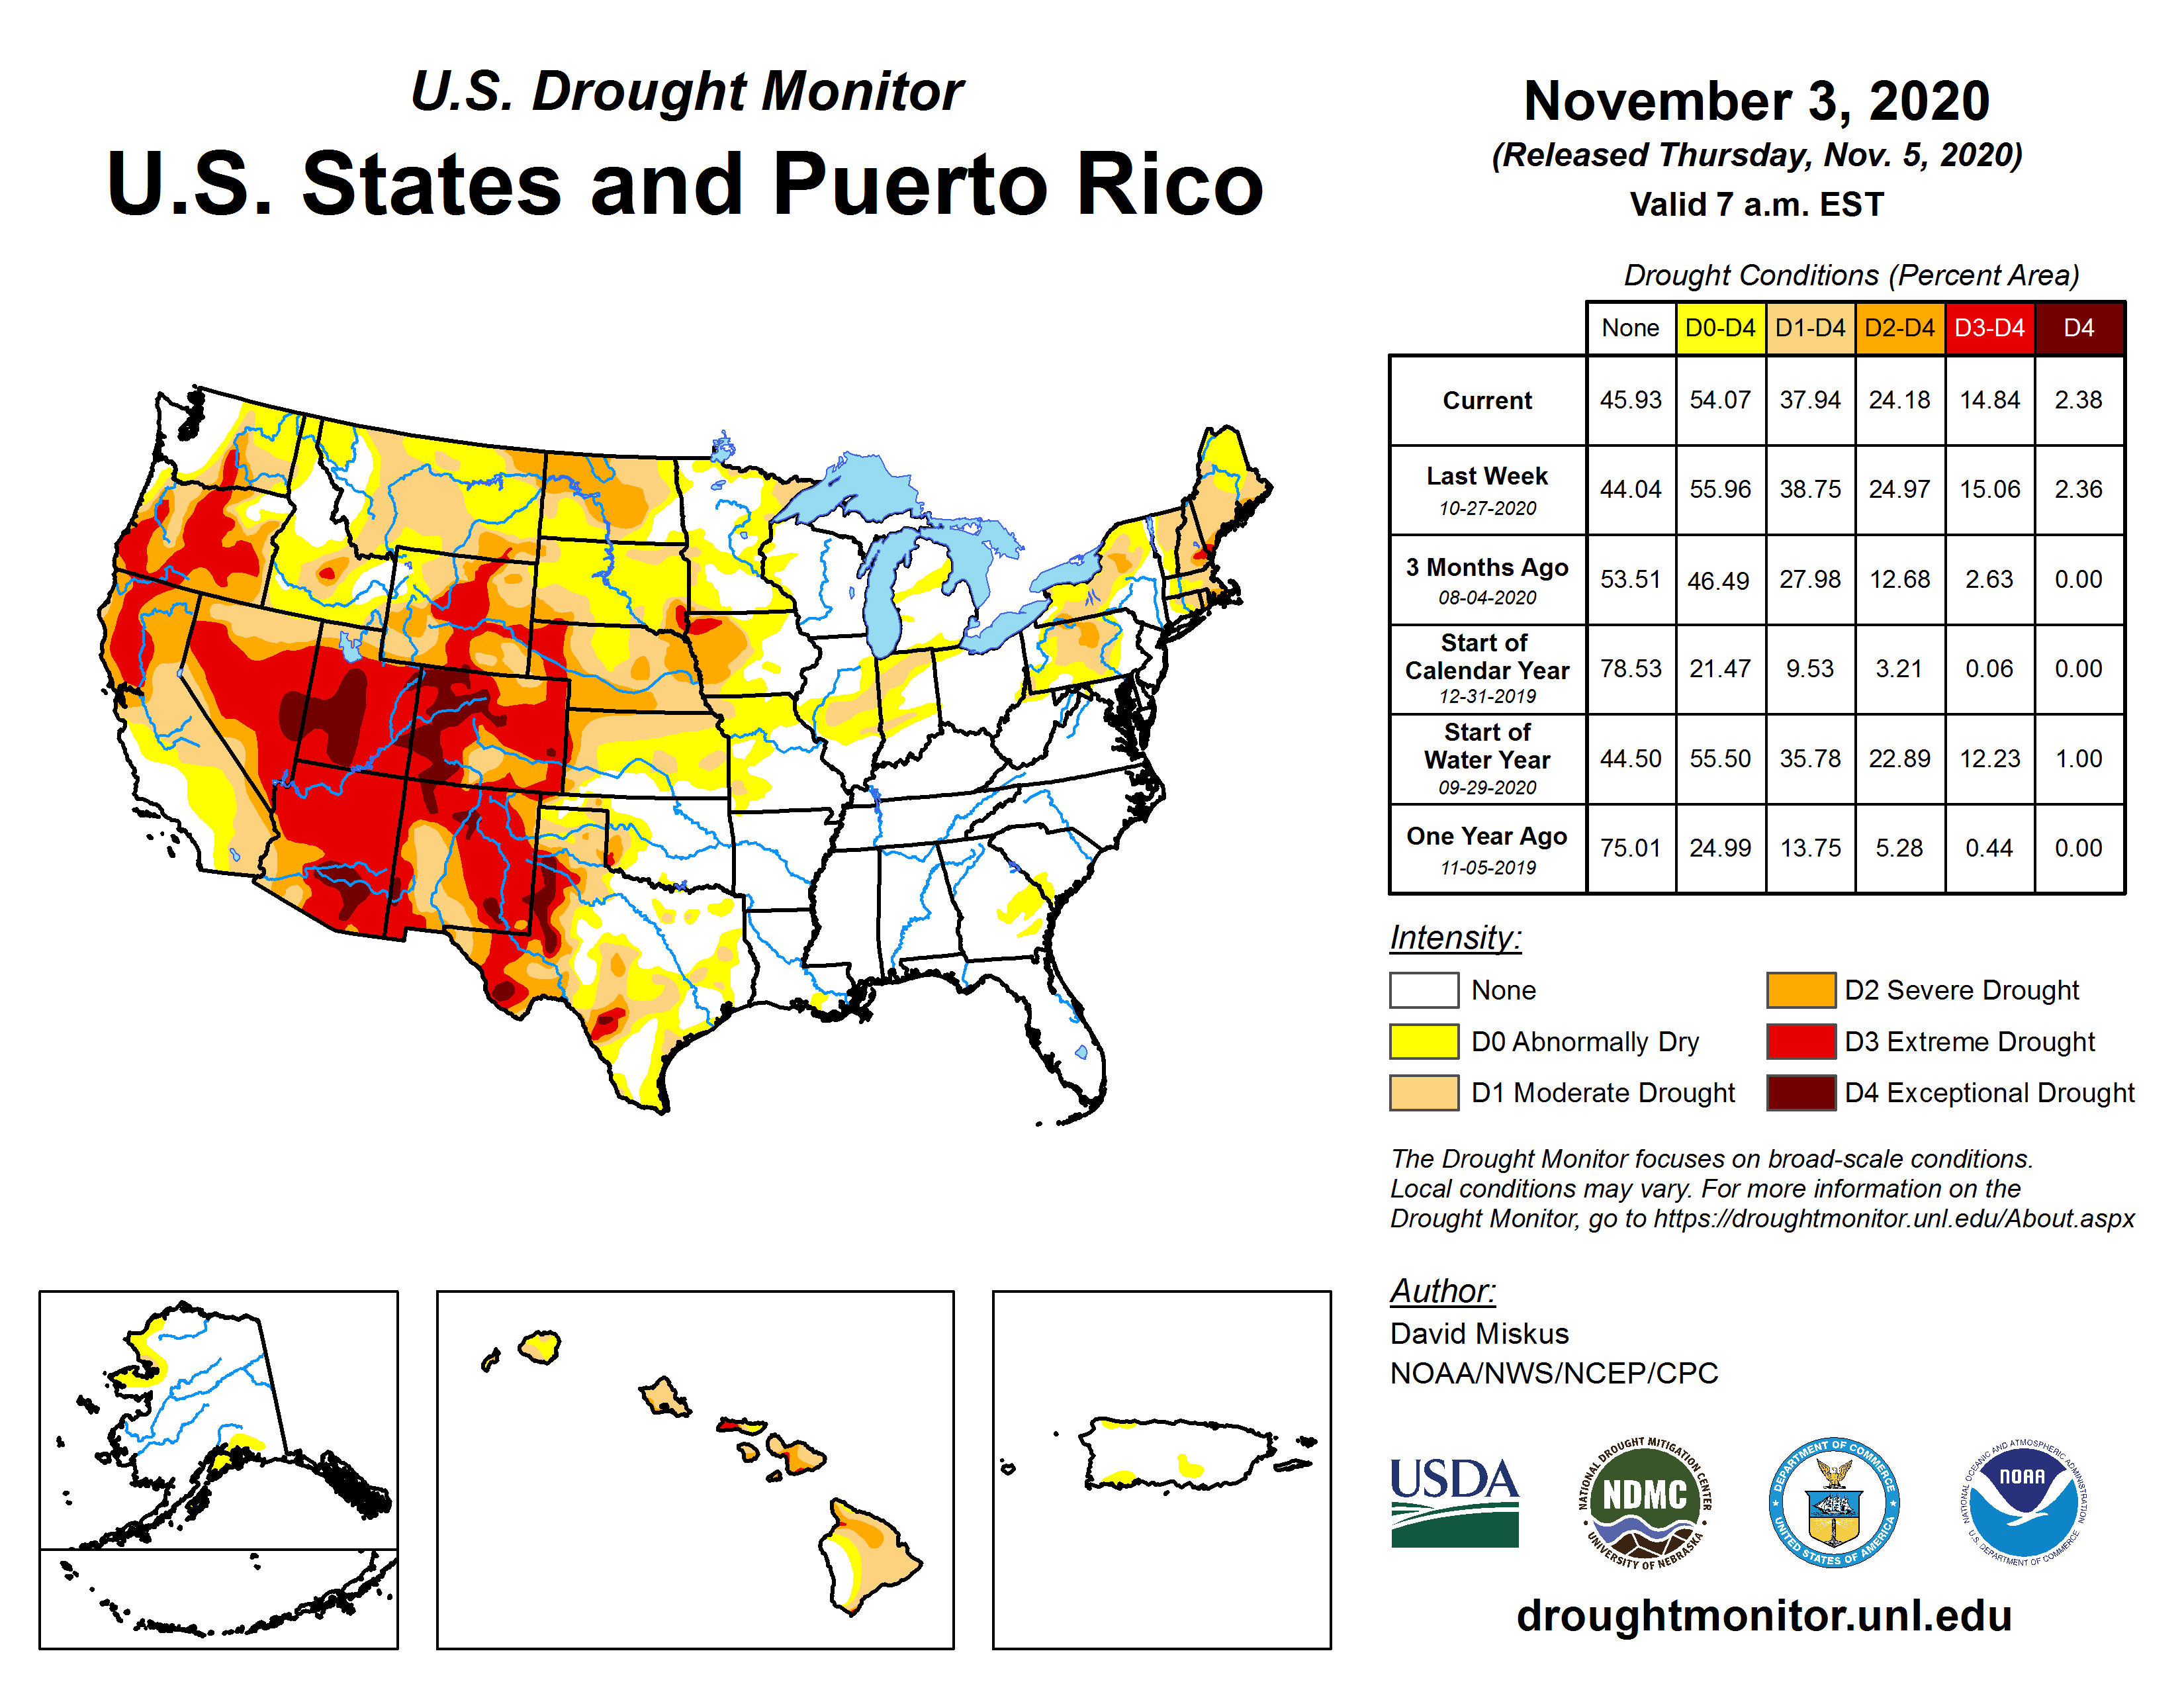
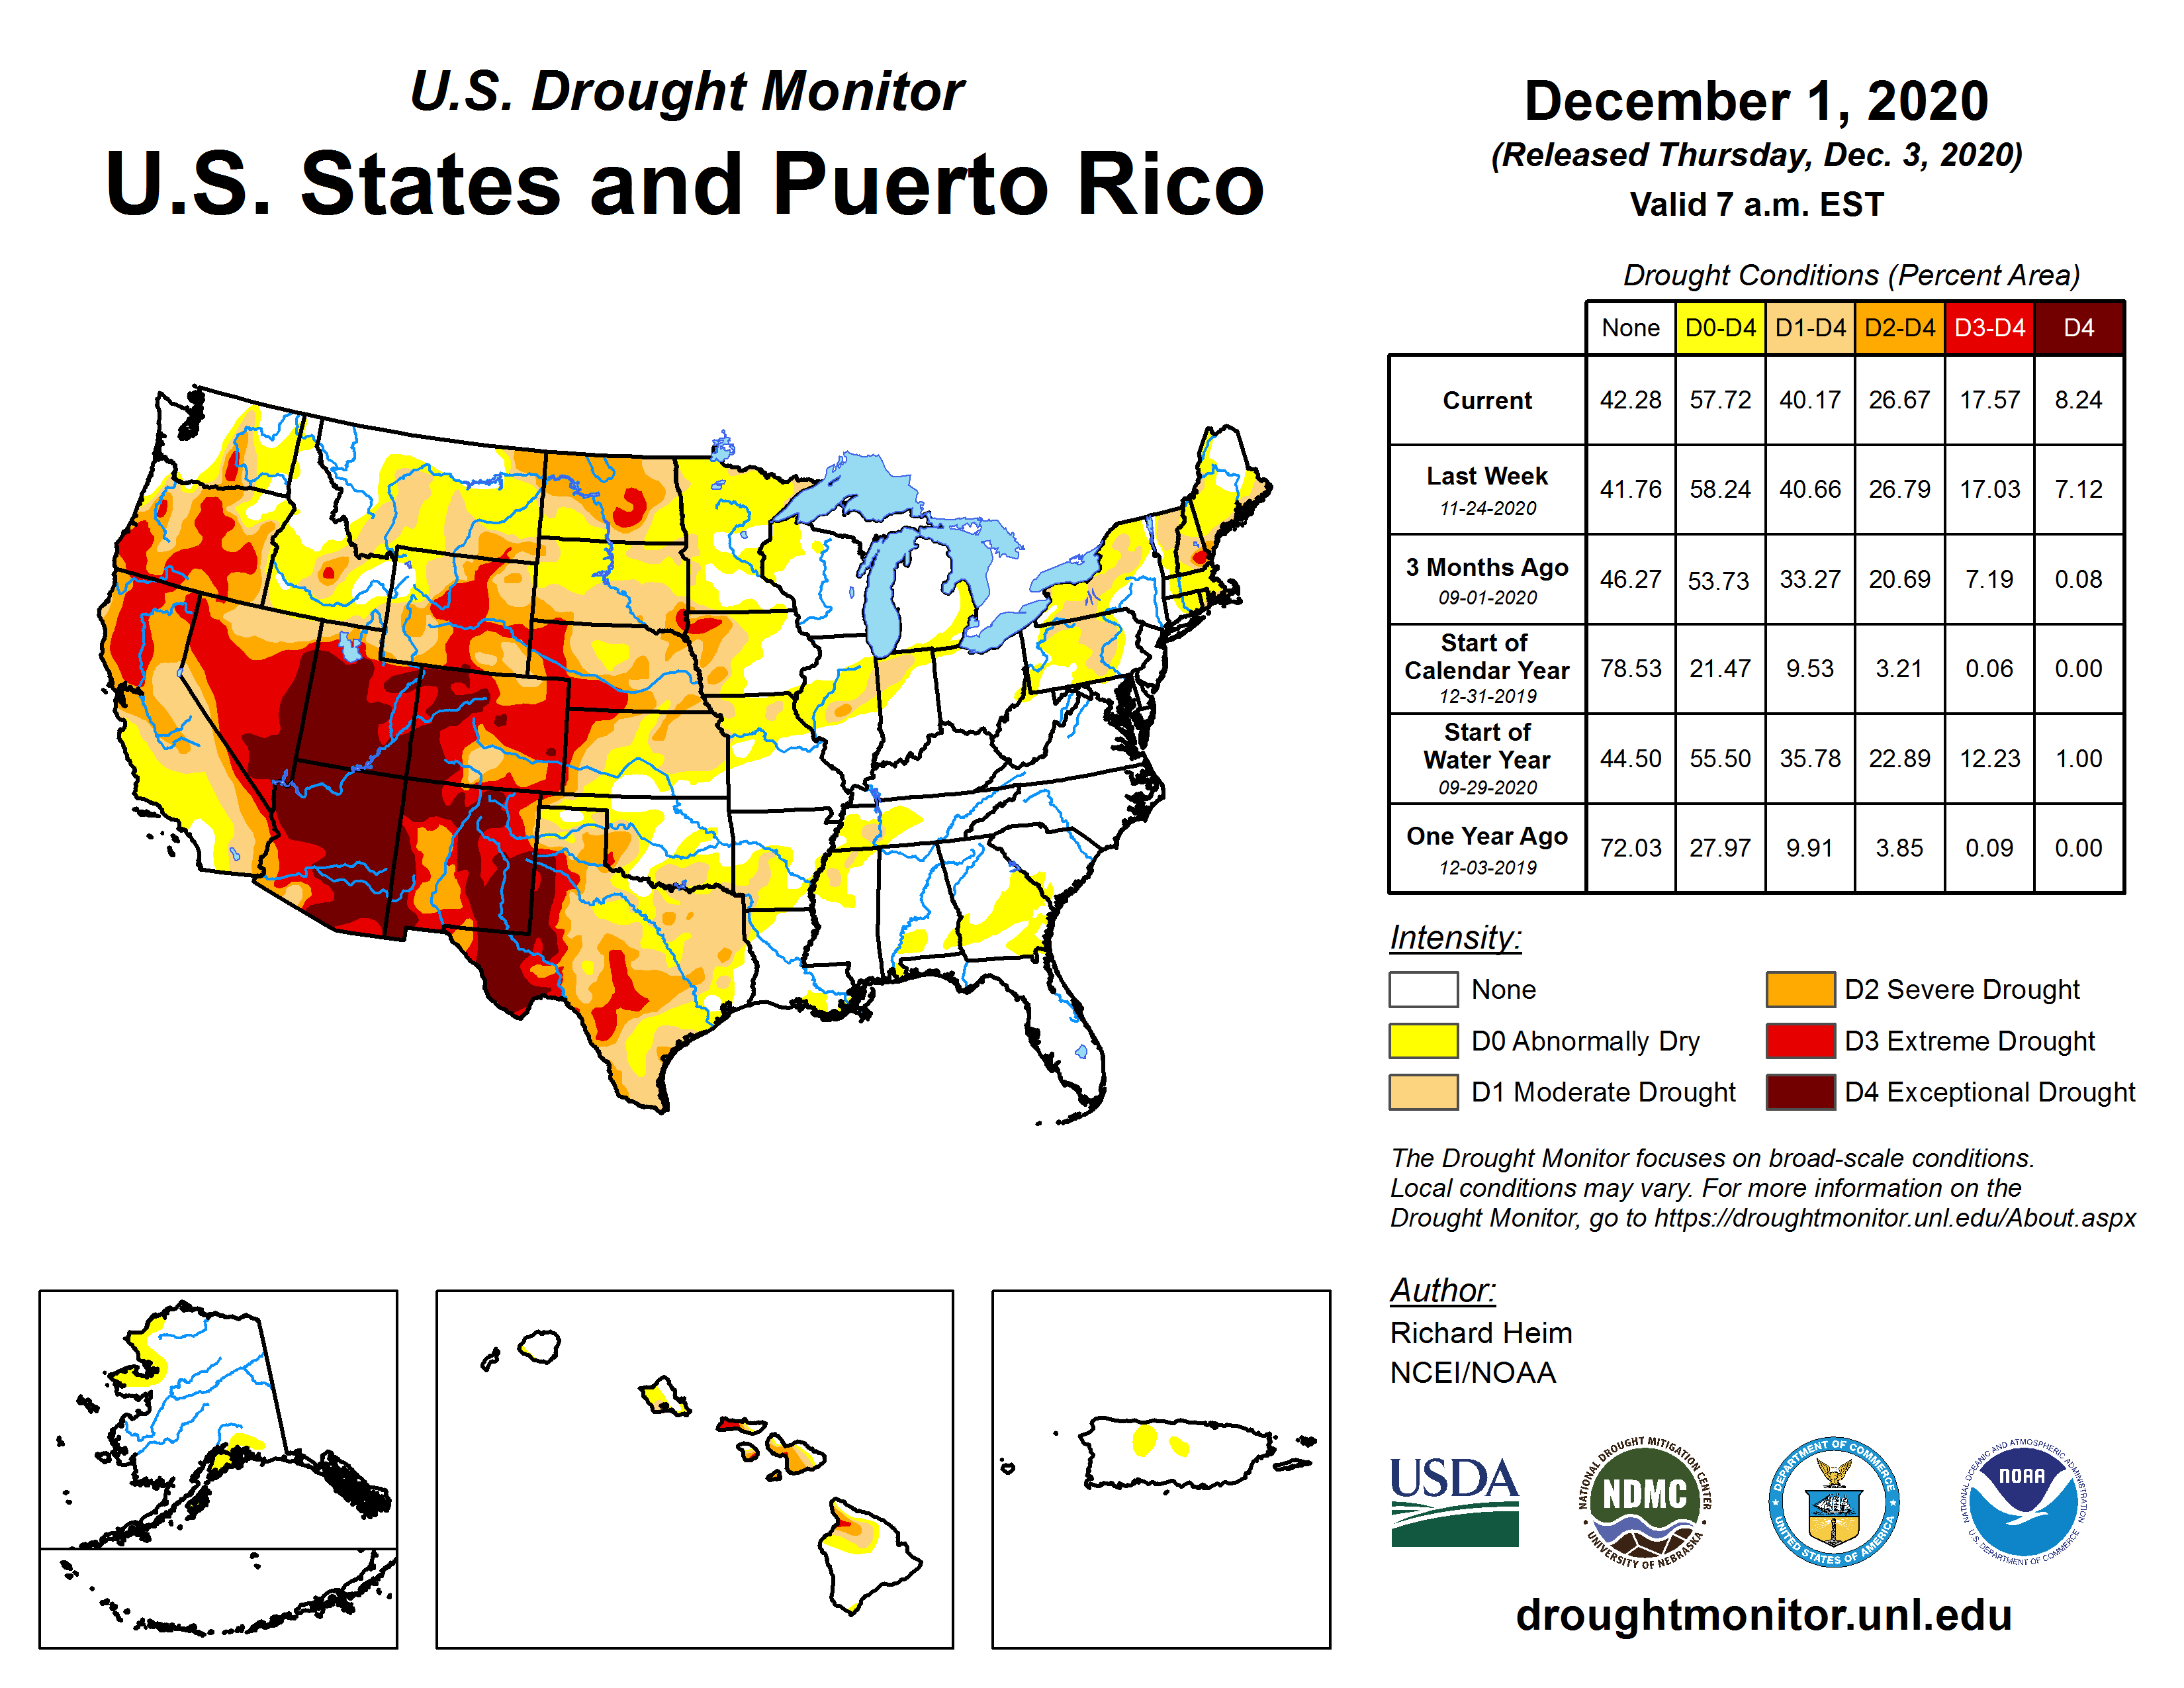
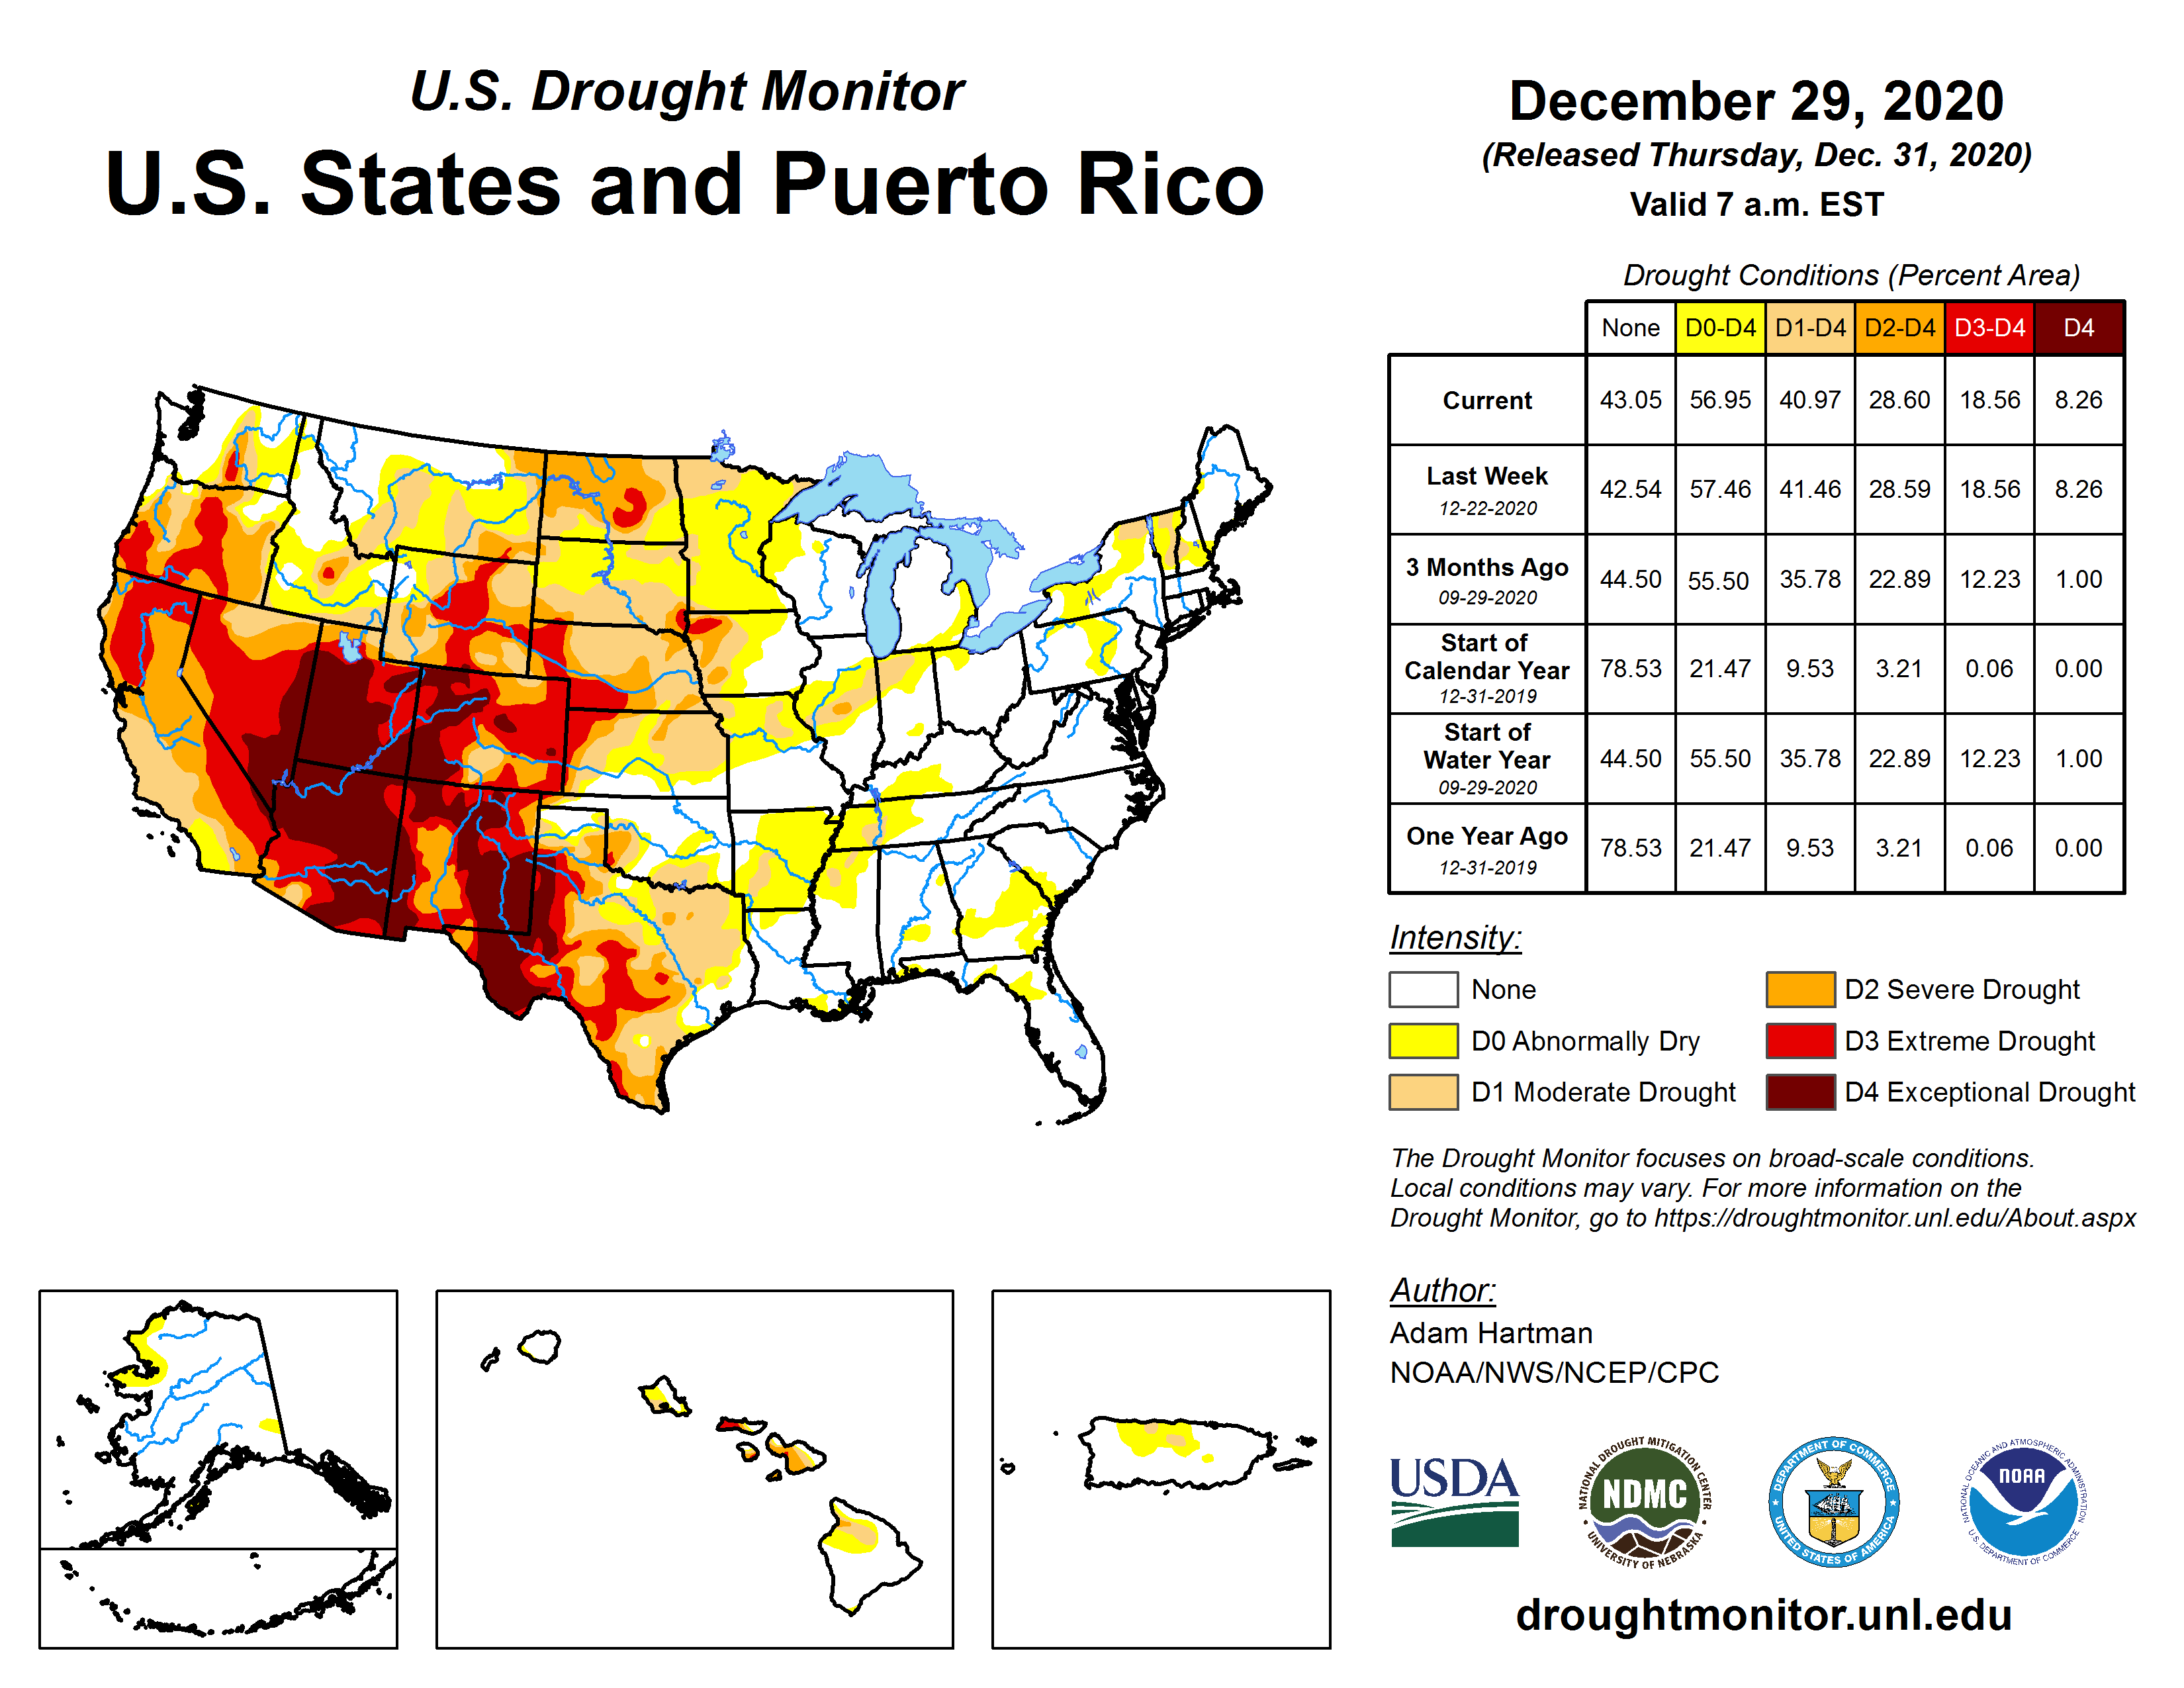
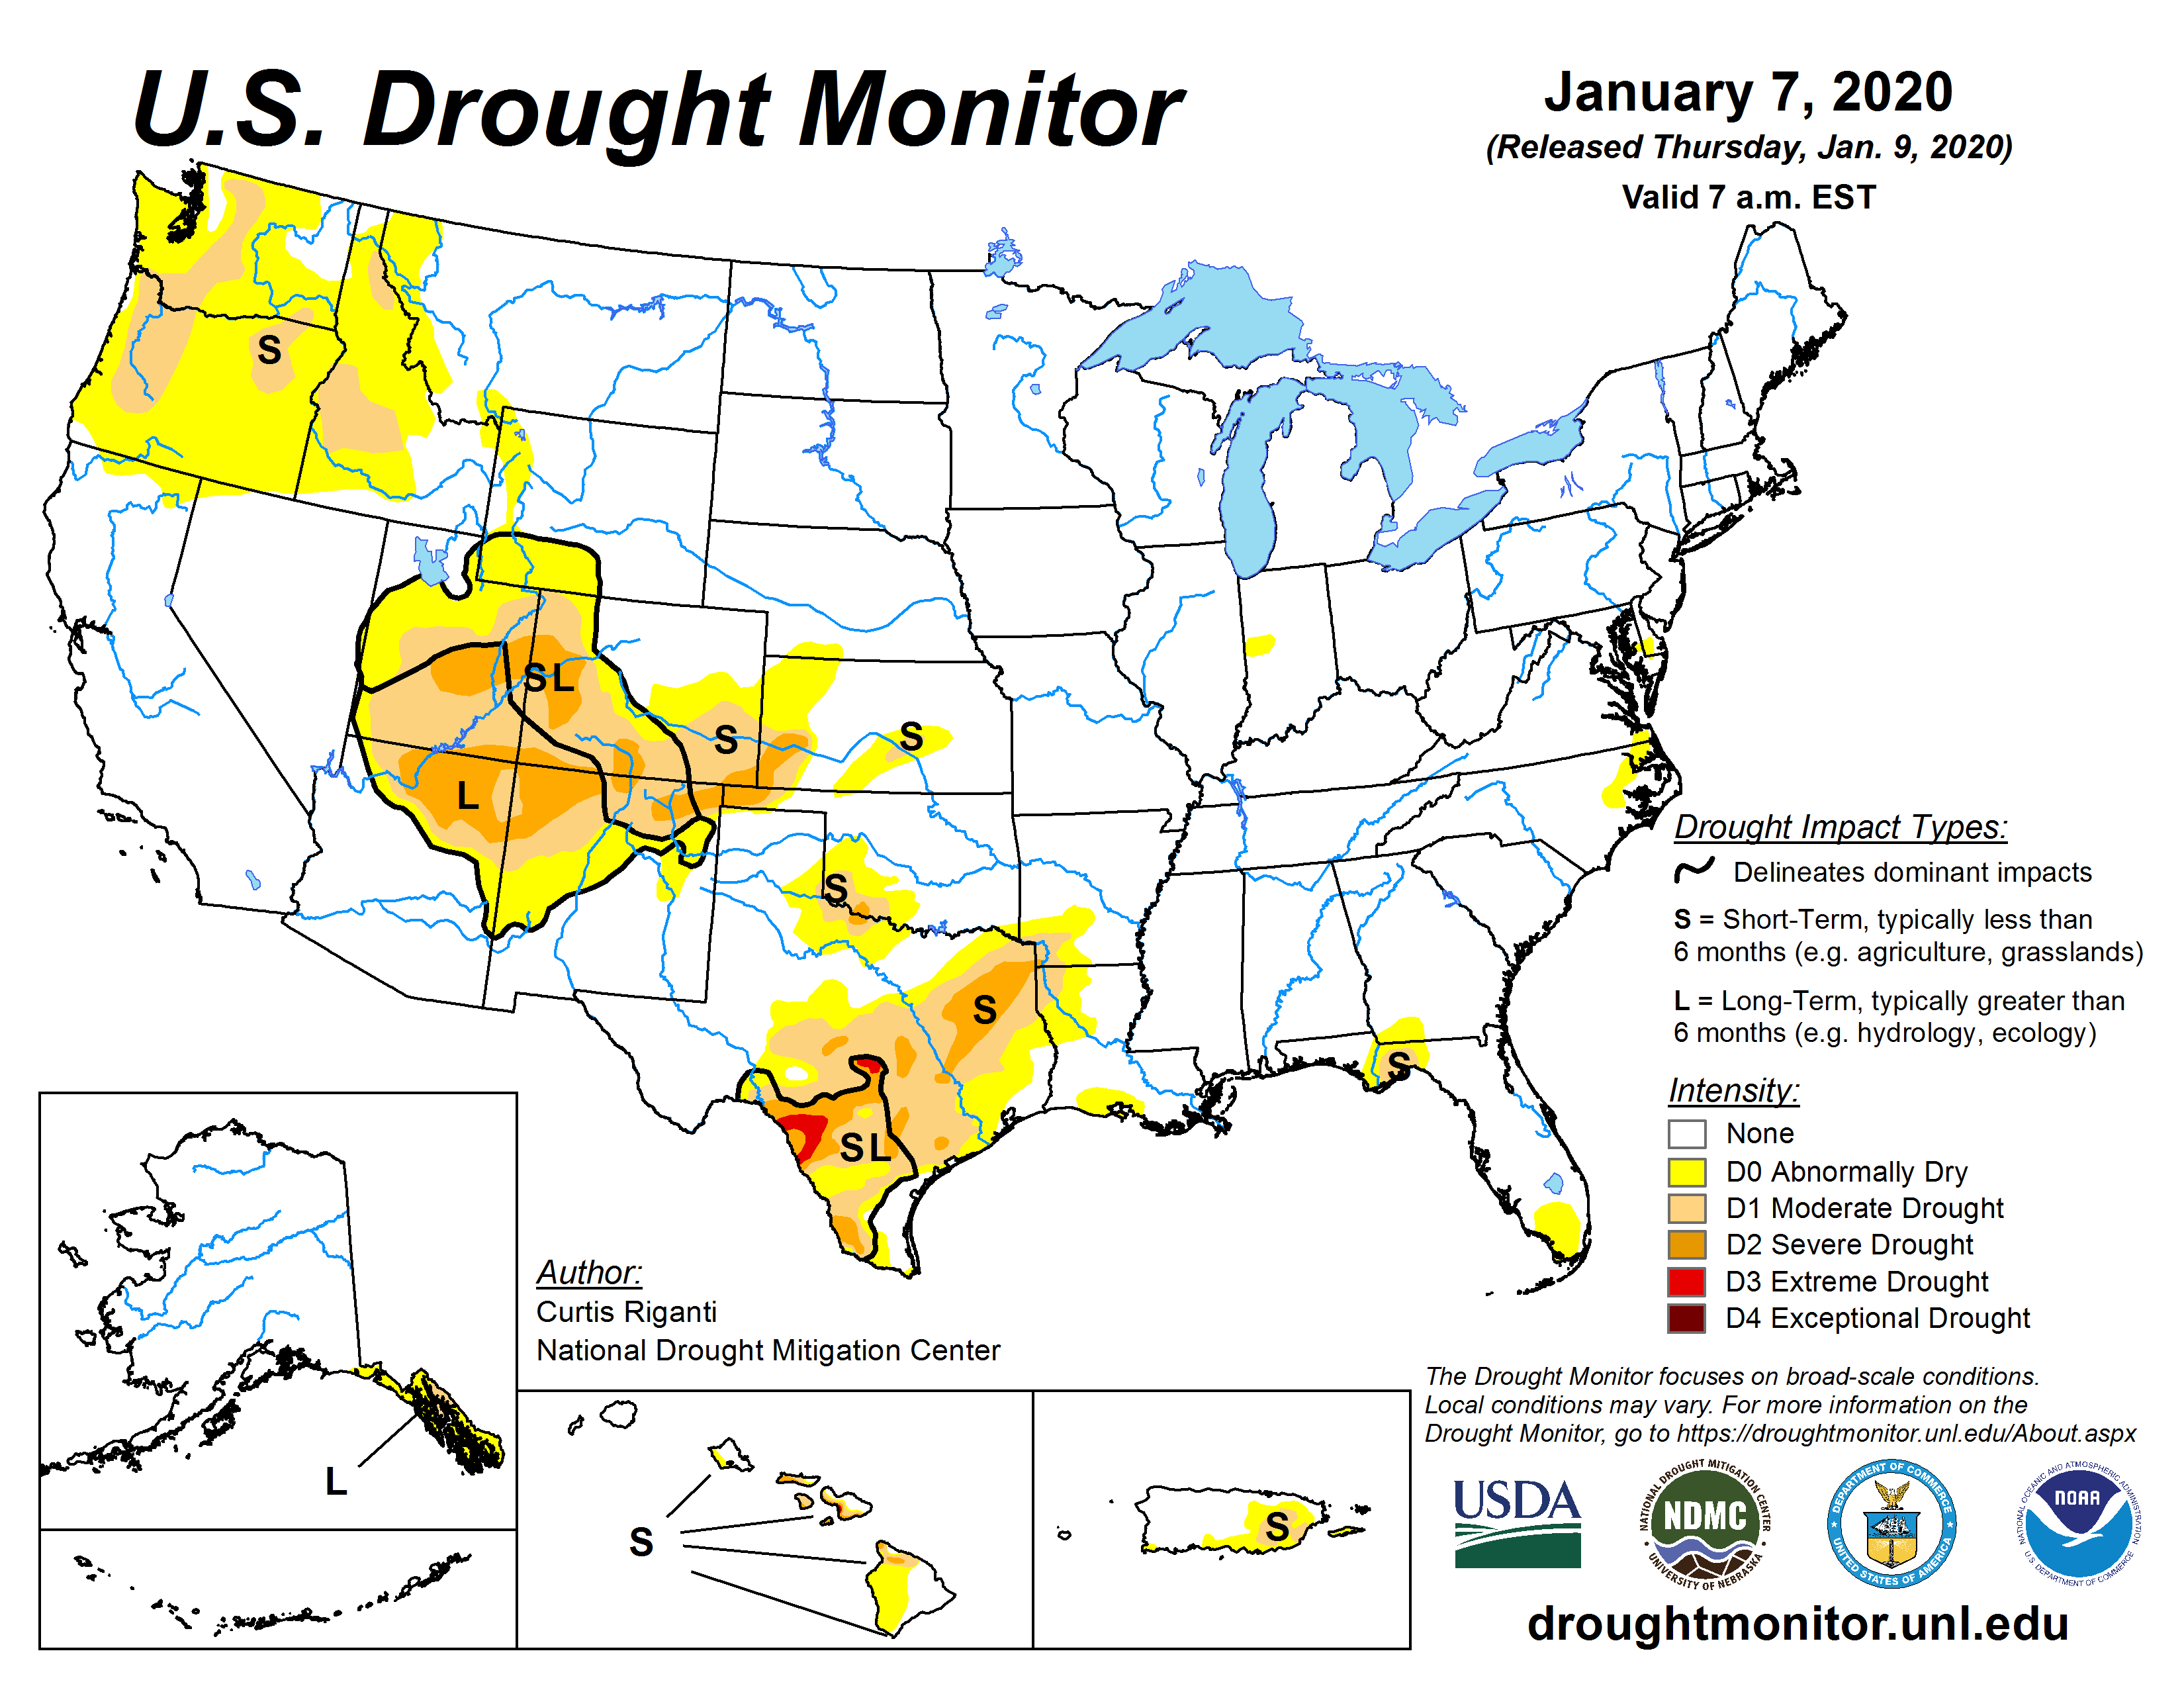
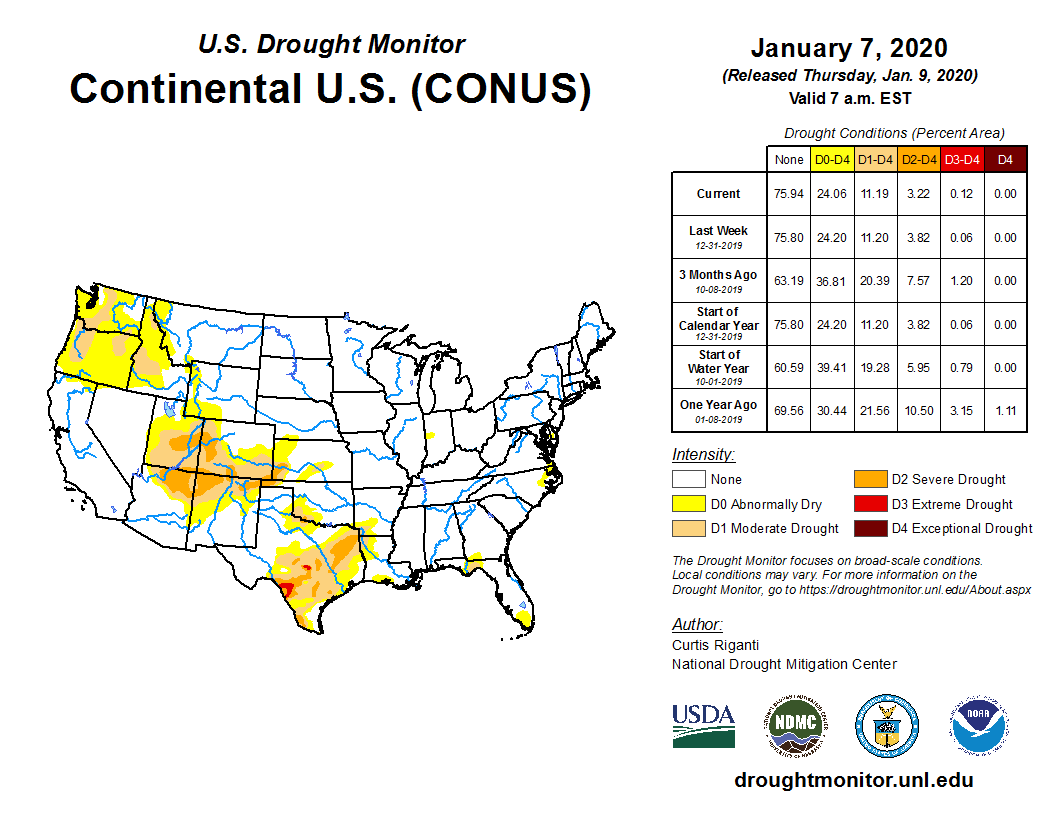
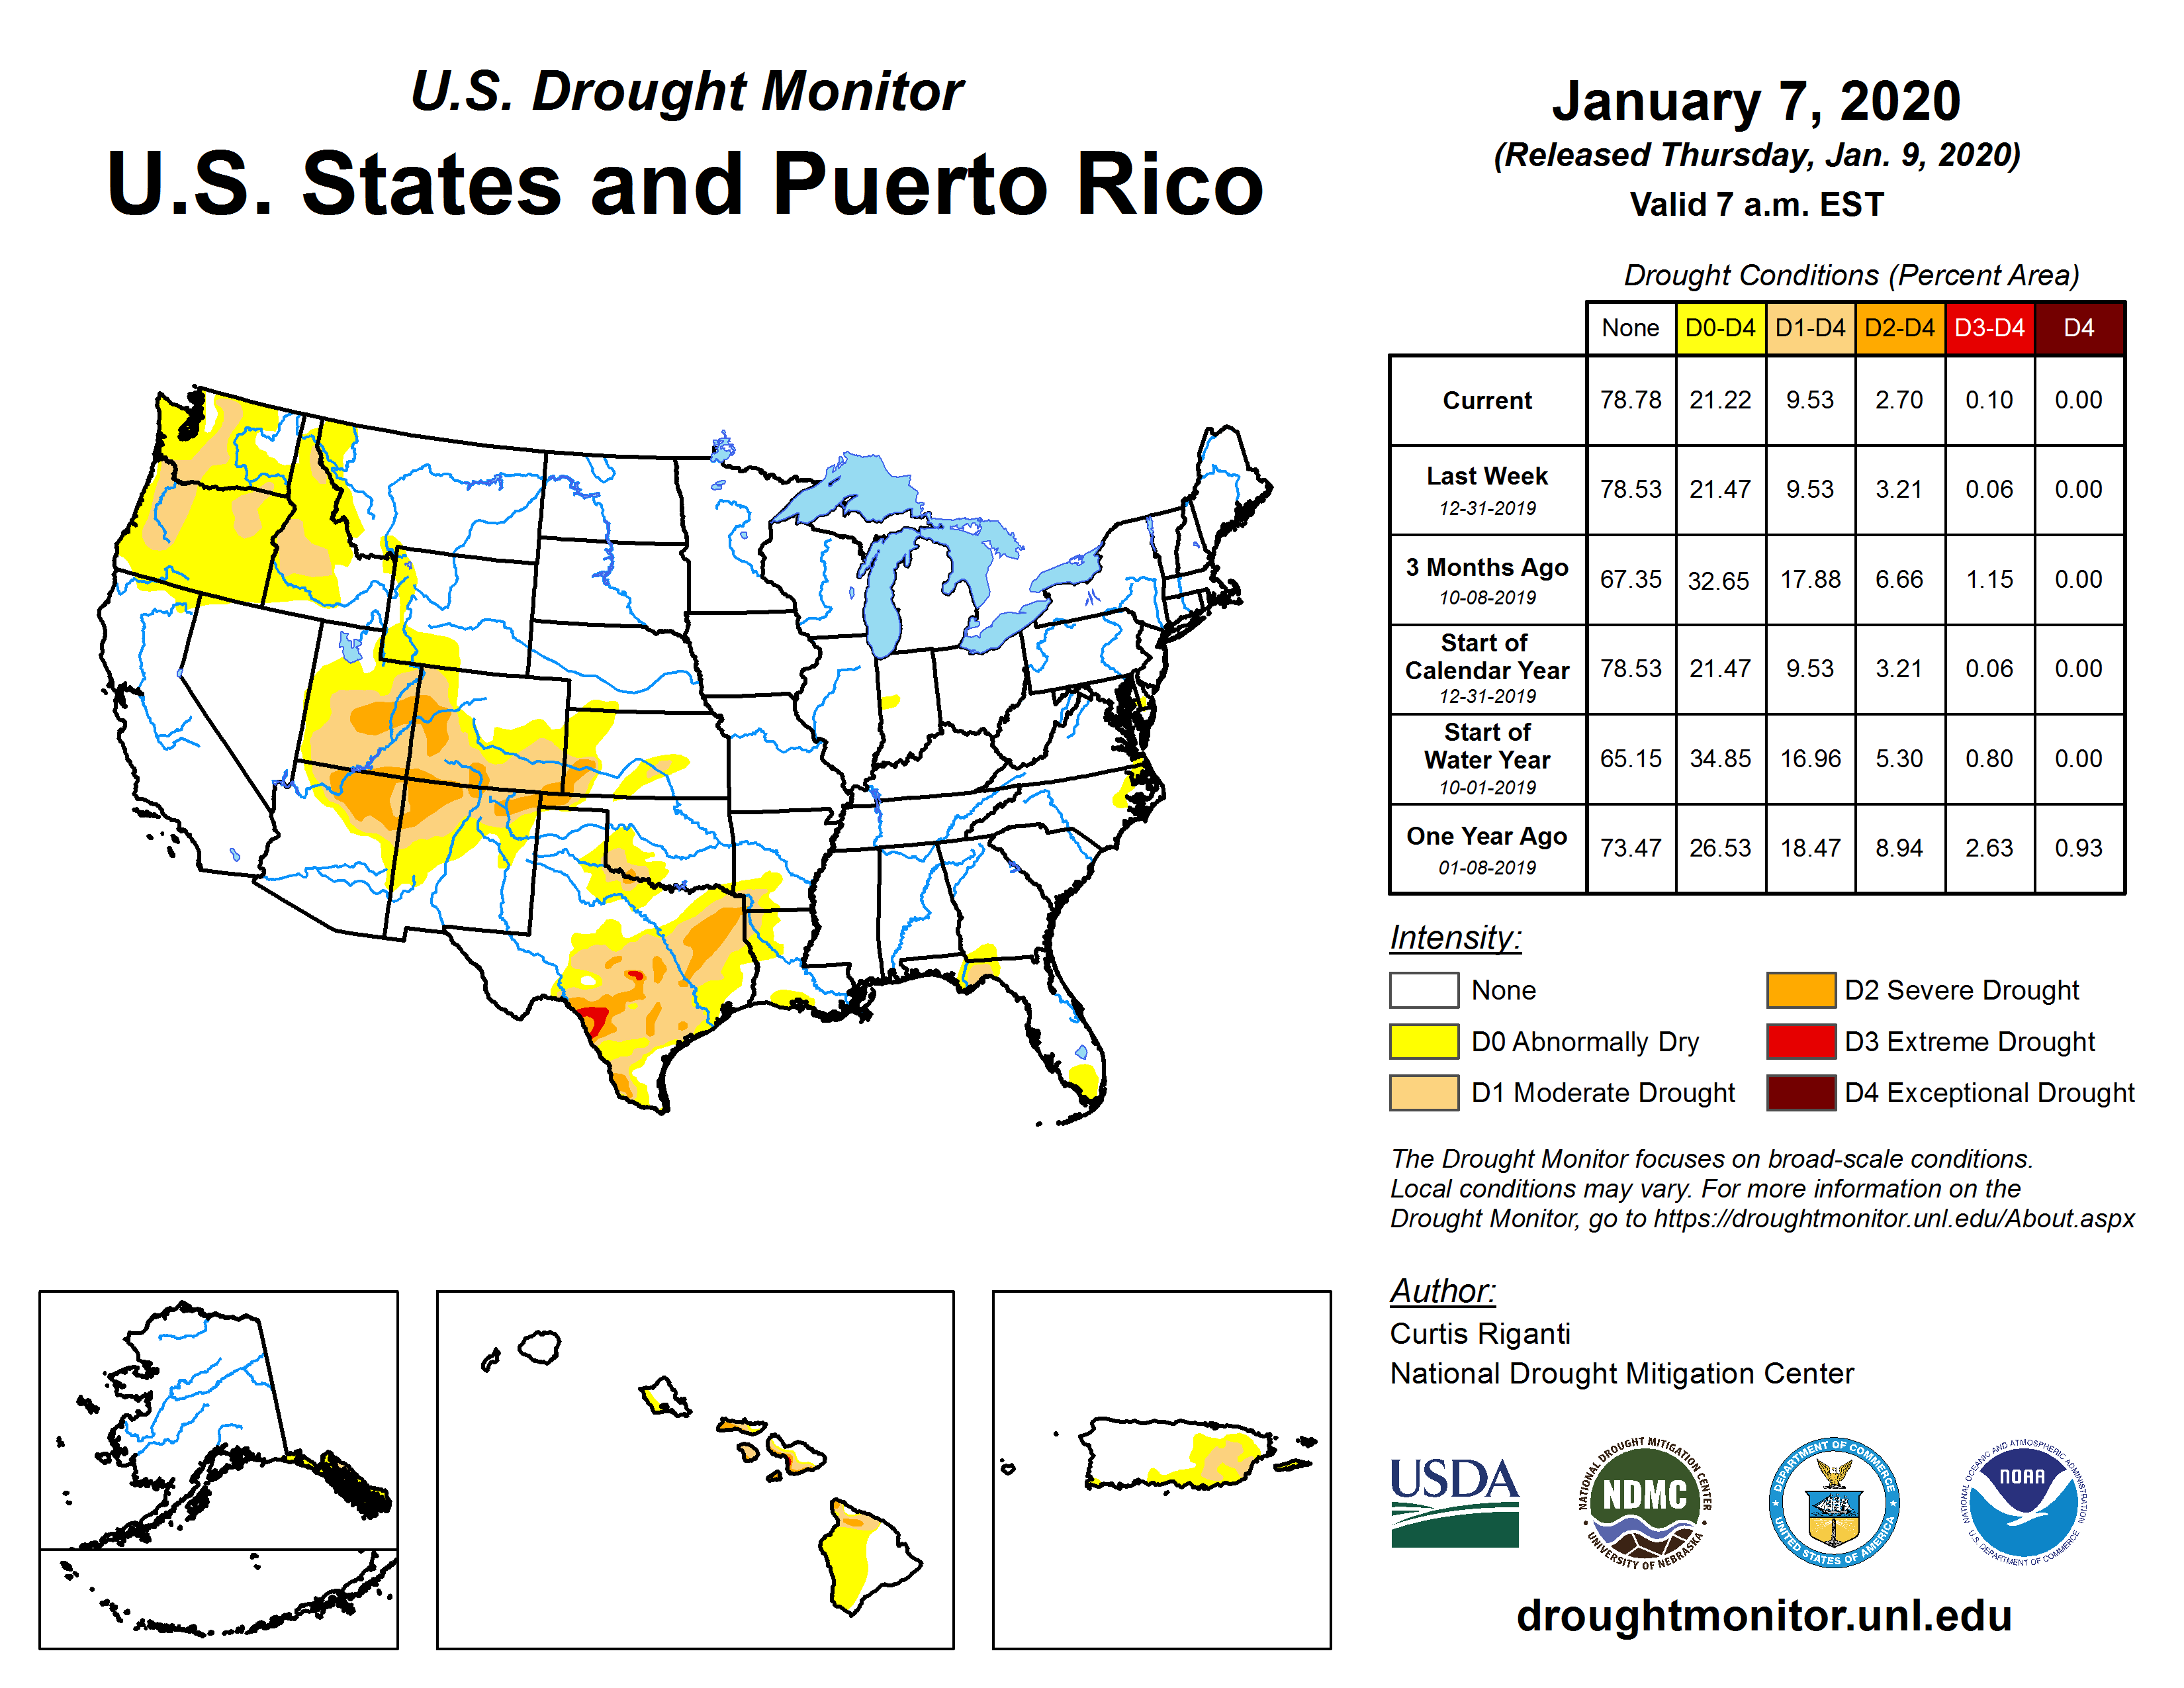
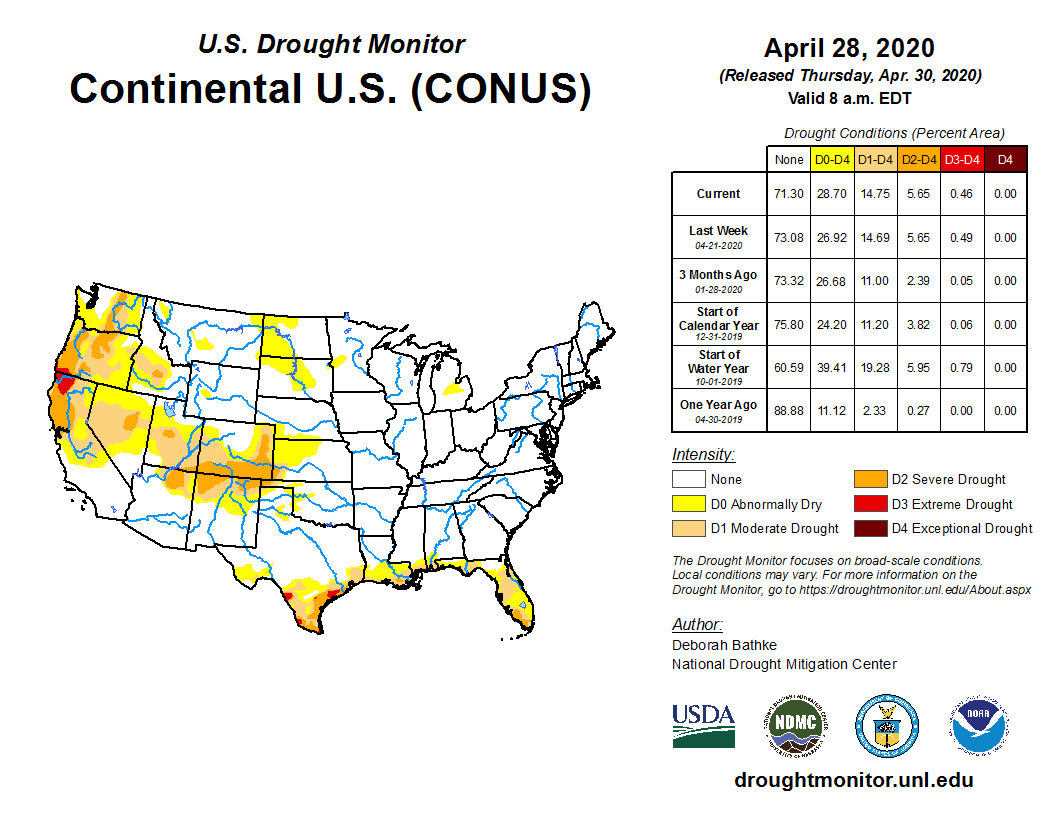
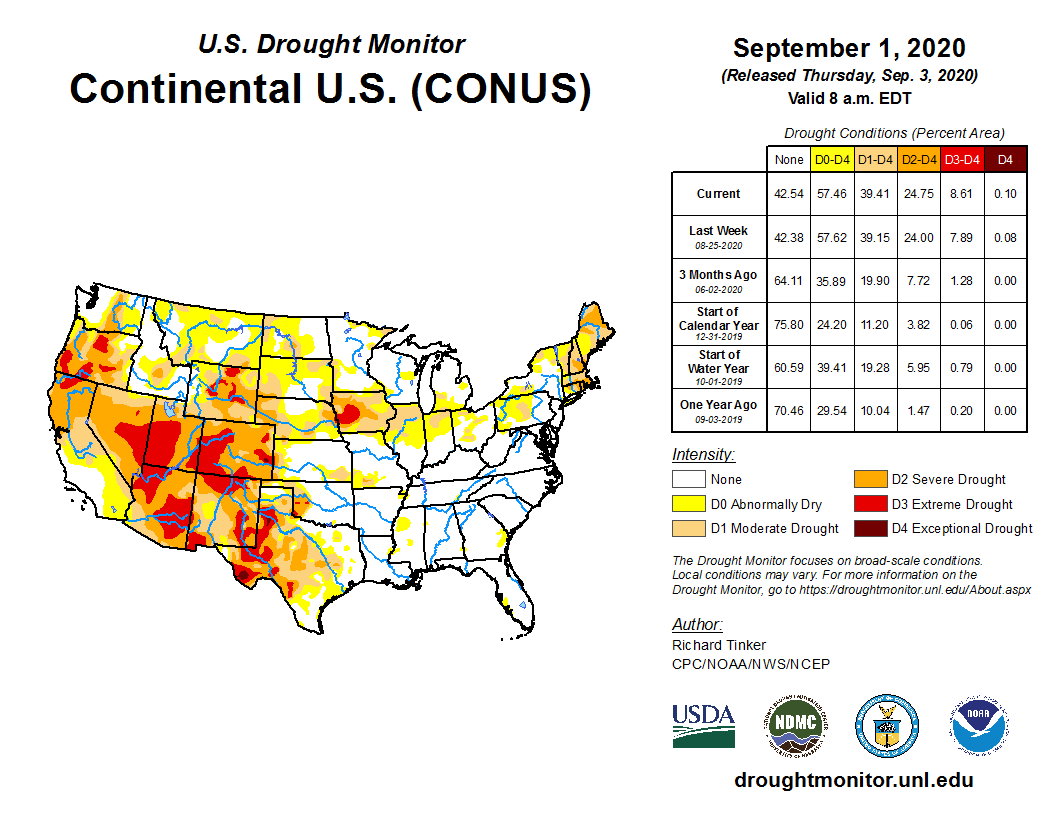
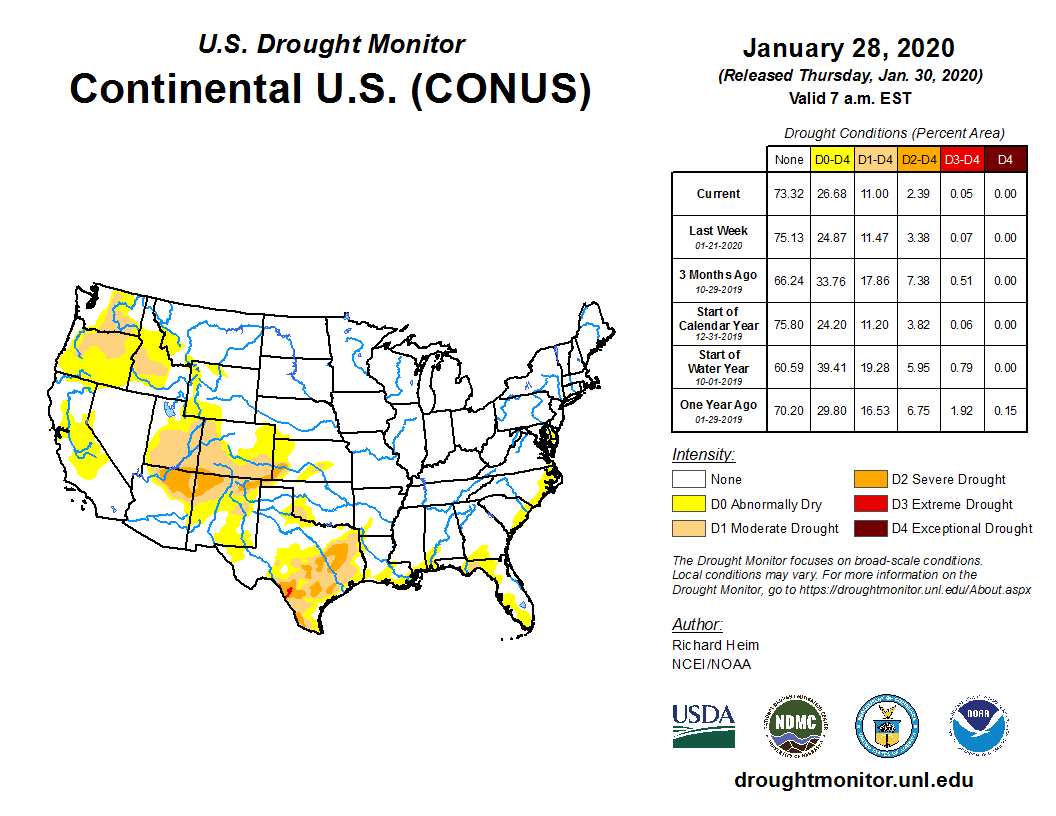
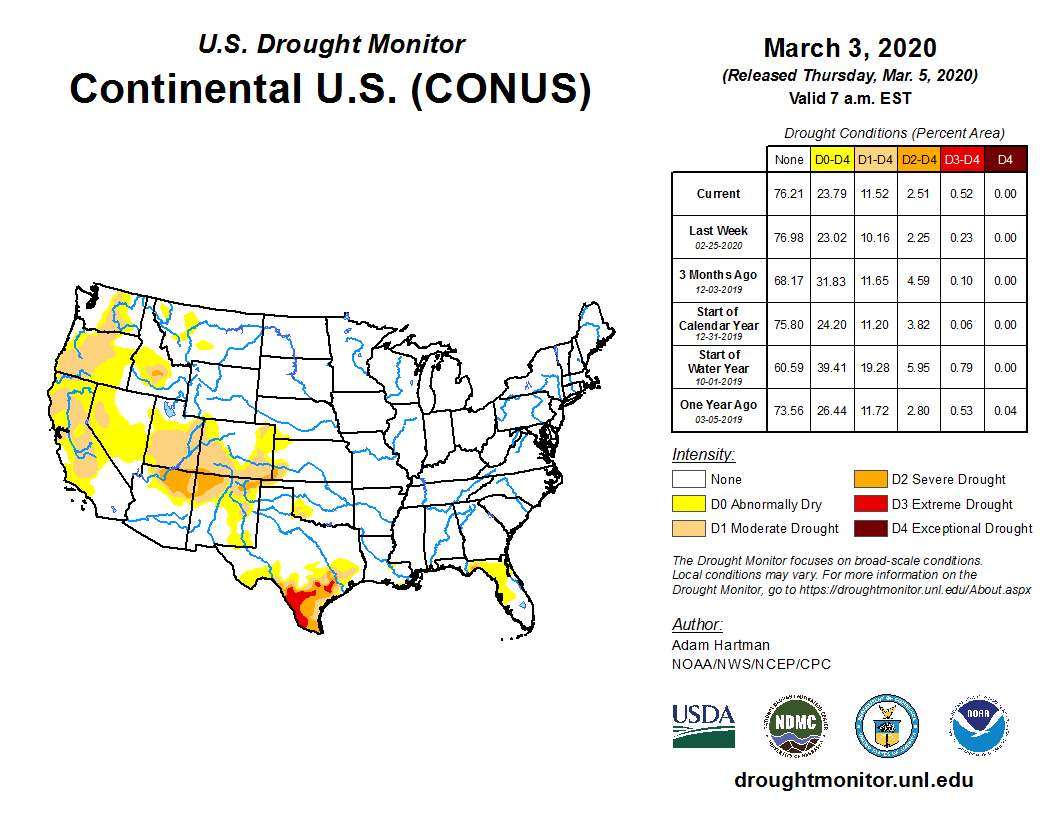
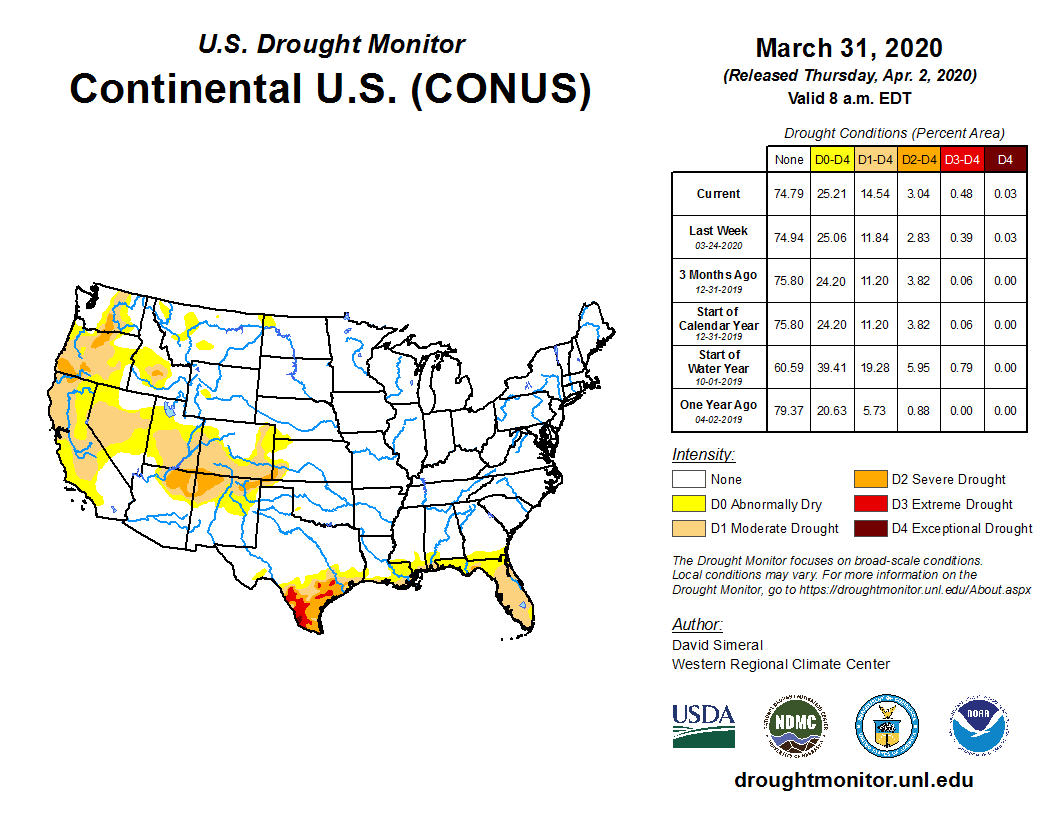
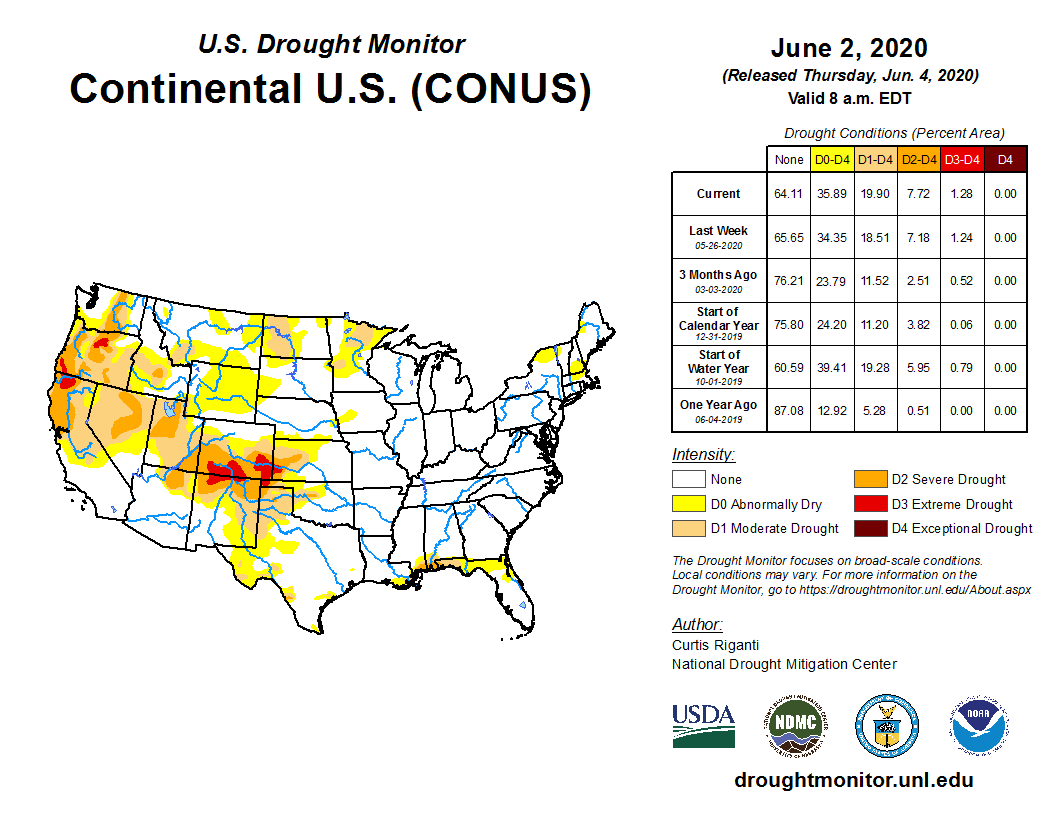
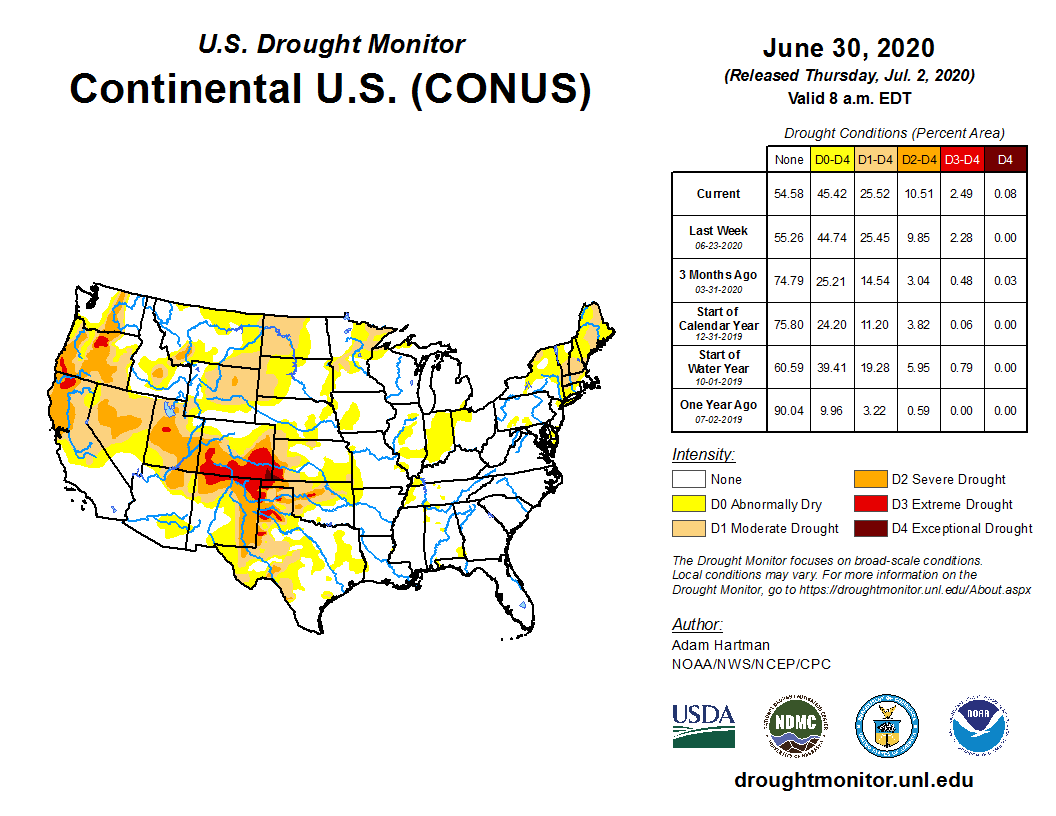
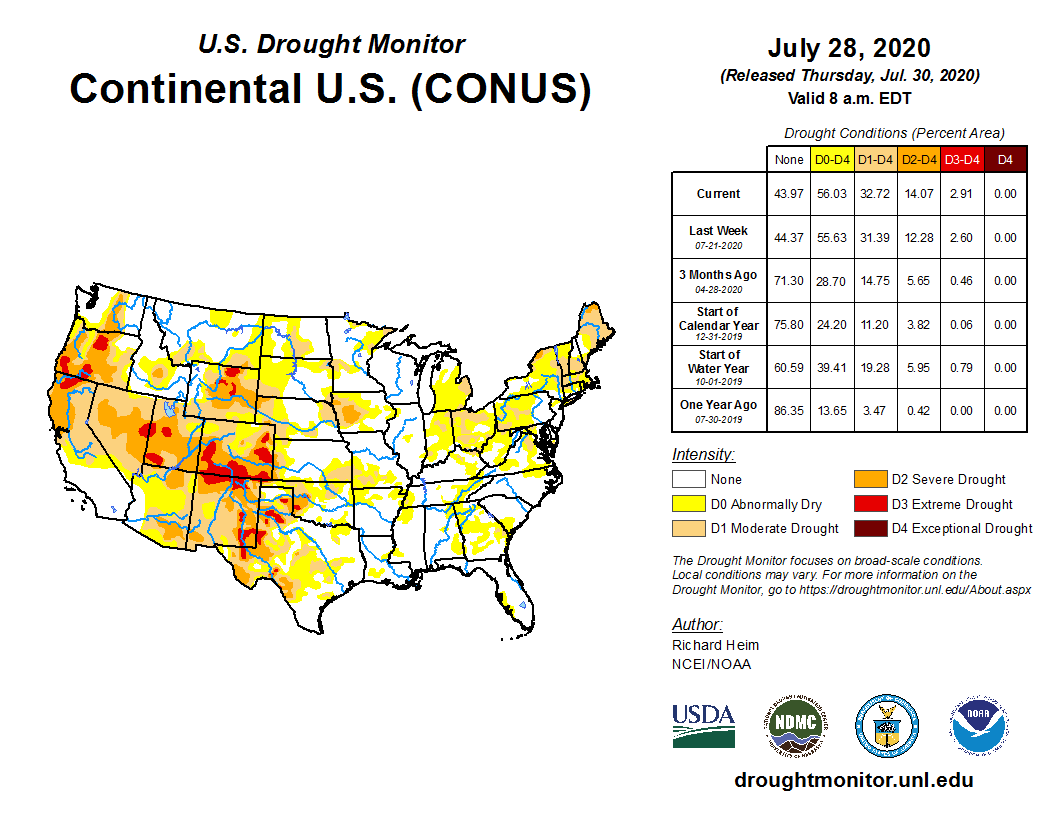
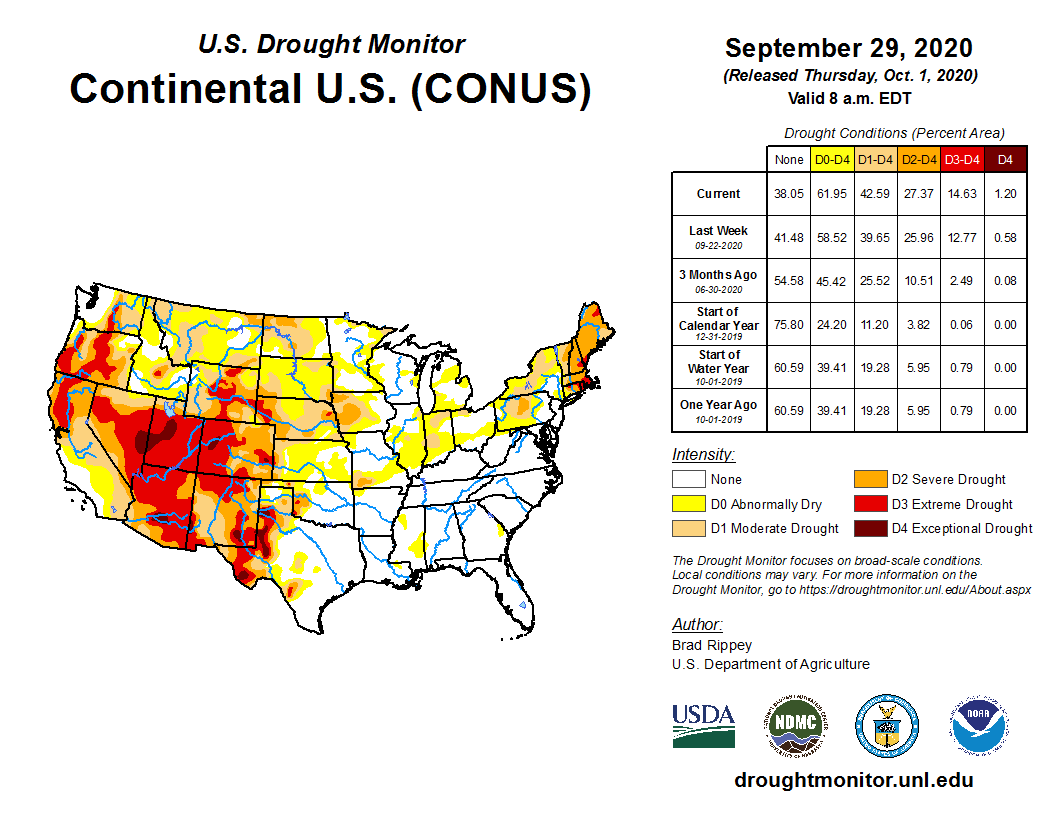
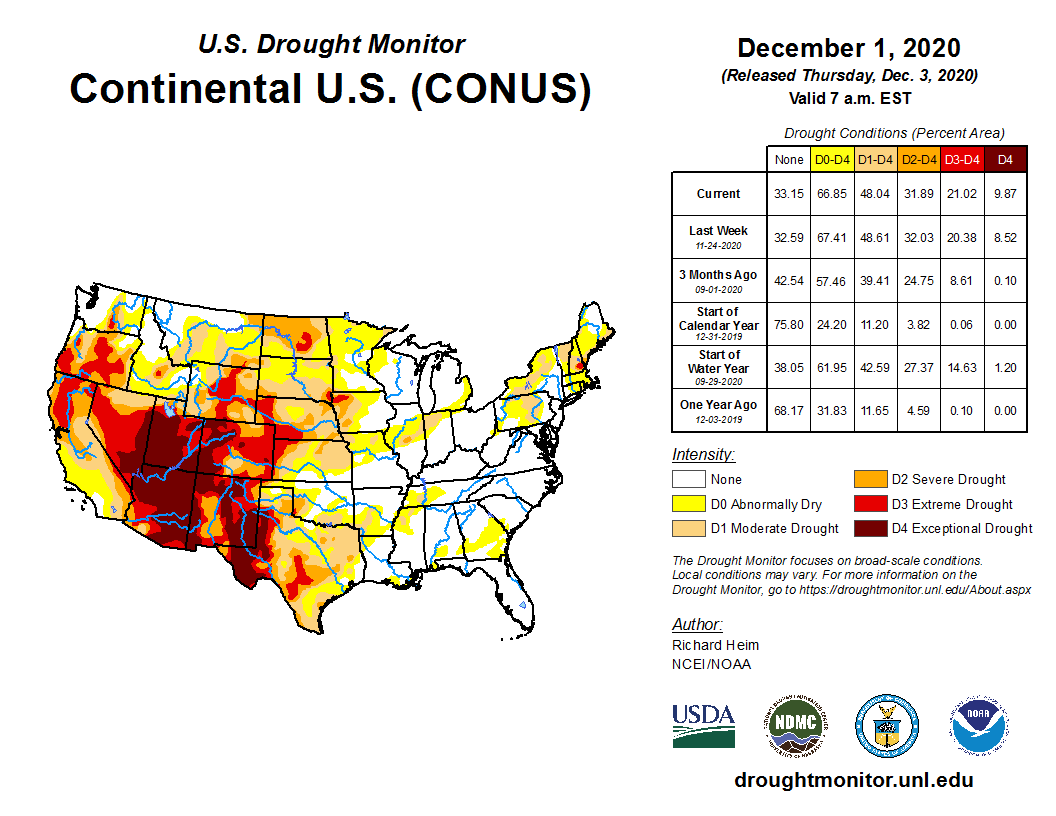
On a national scale, during 2020 drought steadily increased month after month. The year began (January 7) with drought and abnormal dryness in the Pacific Northwest, Southwest, Texas, and parts of Hawaii and Puerto Rico, covering about 11.2 percent of the CONUS (9.5 percent of the 50 States and Puerto Rico) according to U.S. Drought Monitor (USDM) statistics. The drought coverage expanded slowly during the first four months of the year, reaching 14.8 percent of the CONUS (12.3 percent of the U.S. including Puerto Rico) by the end of April and covering more of the West and the immediate Gulf of Mexico coast. The weather turned excessively hot and dry in the Southwest during May, July, and August; in parts of the Plains during June and August; and in parts of the Northeast during June. As a result, rapid expansion occurred during May-August, with drought covering most of the West and New England, much of the Plains, and parts of the Midwest by the end of summer (the end of August percentages were 39.4 percent of the CONUS and 33.3 percent of the U.S. including Puerto Rico). The national drought area continued to grow during the fall and early winter but at a slower pace. It was abnormally warm and dry in the Southwest and New England in September, the Southwest again in October, and parts of the Southwest and Plains in November. Drought abated in the Northeast as beneficial precipitation returned; drought continued in the Plains and Midwest; and, with persistent heat and dryness, drought intensified in the West. The year ended (December 29) with nearly half of the CONUS in drought (49.0 percent of the CONUS and 41.0 percent of the U.S. including Puerto Rico).
The U.S. Drought Monitor maps for the end of each month in 2020:
 |
 |
 |
 |
 |
 |
 |
 |
 |
 |
 |
 |
| Palmer Drought Index* monthly statistics, which go back to the beginning of the 20th century, indicate that 4.4 percent of the CONUS was in moderate to extreme drought at the beginning of 2020 (end of January). The percentage increased throughout the year, reaching a couple plateaus (12.4% in May and 35.2% in October) before decreasing slightly in December, ending the year at 36.7 percent. |
Percent area in drought of the CONUS or all of the U.S., based on the USDM and Palmer Drought Index, January-December 2020.
|
|
|
*This drought statistic is based on the Palmer Drought Index, a widely used measure of drought. The Palmer Drought Index uses numerical values derived from weather and climate data to classify moisture conditions throughout the contiguous United States and includes drought categories on a scale from mild to moderate, severe and extreme.
[top]
Regional Drought Overview
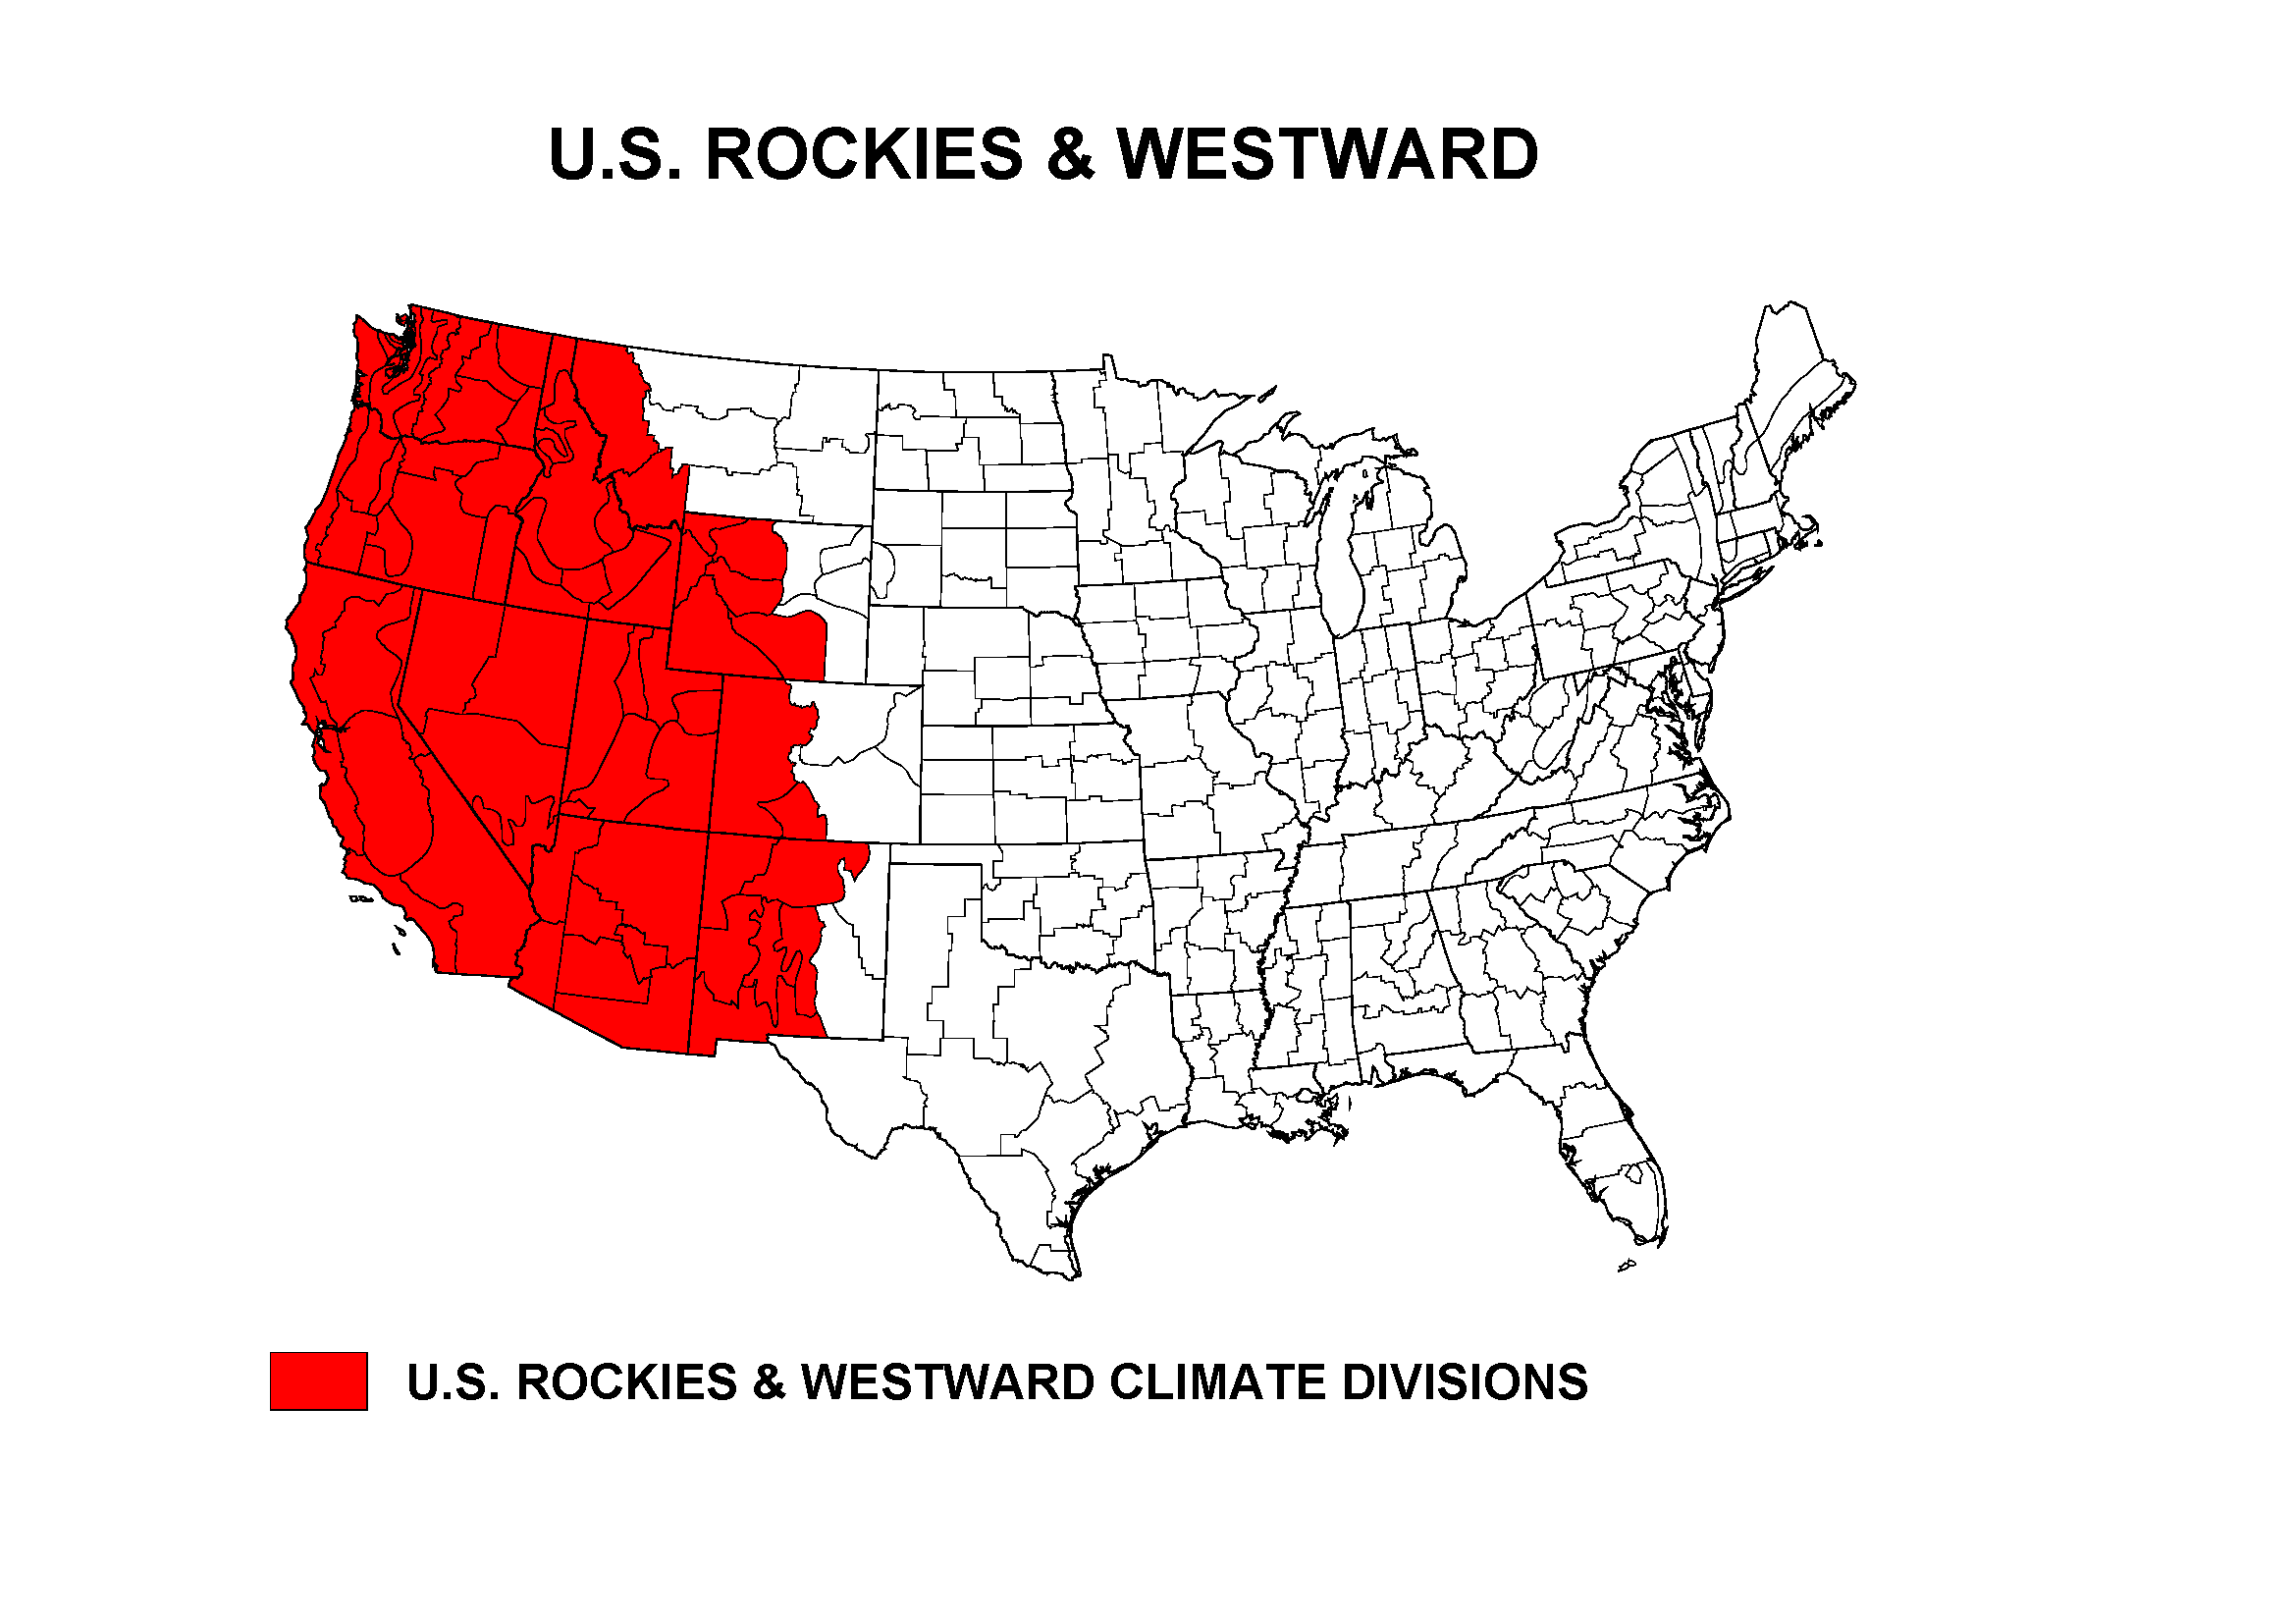
West Overview
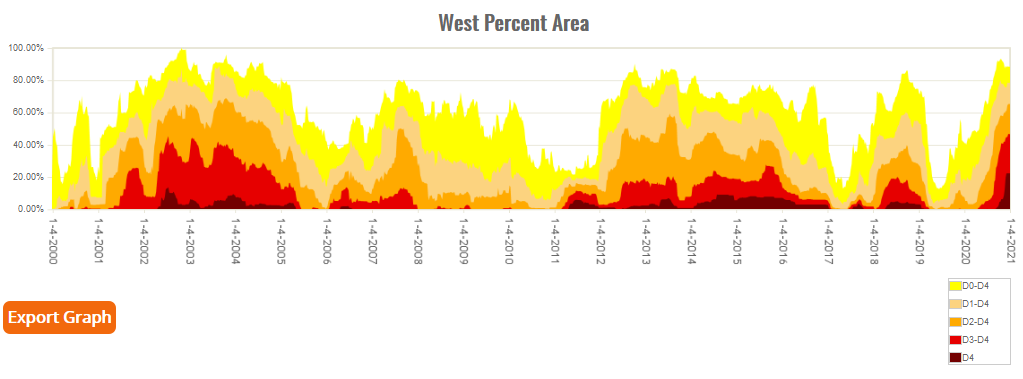
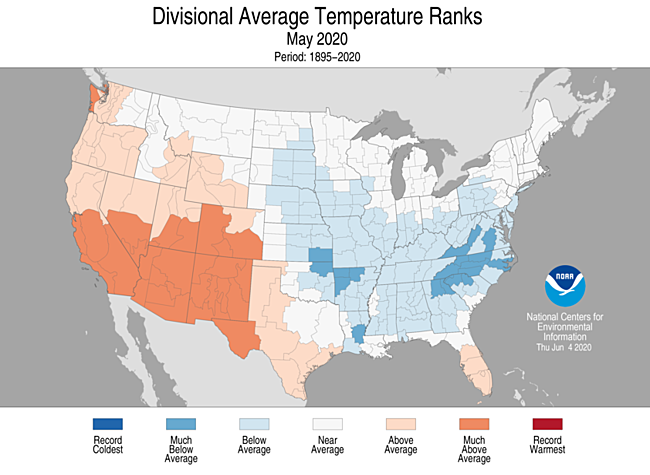
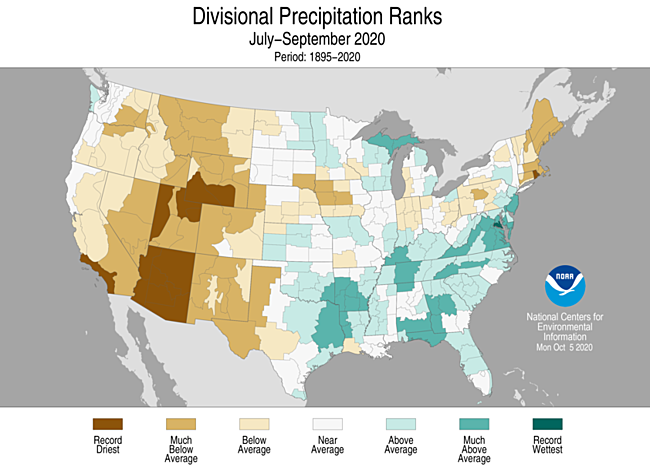
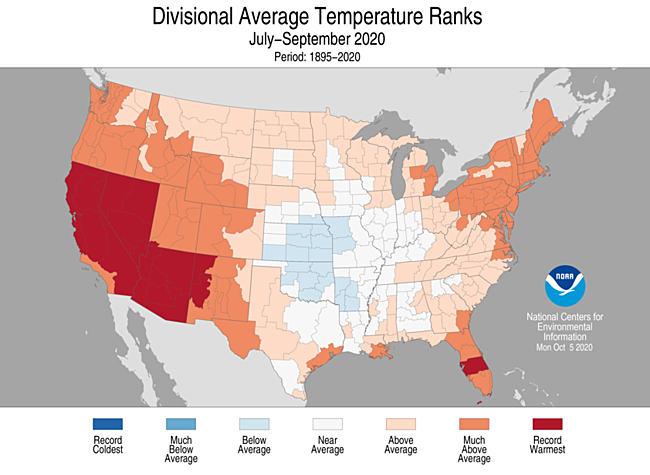
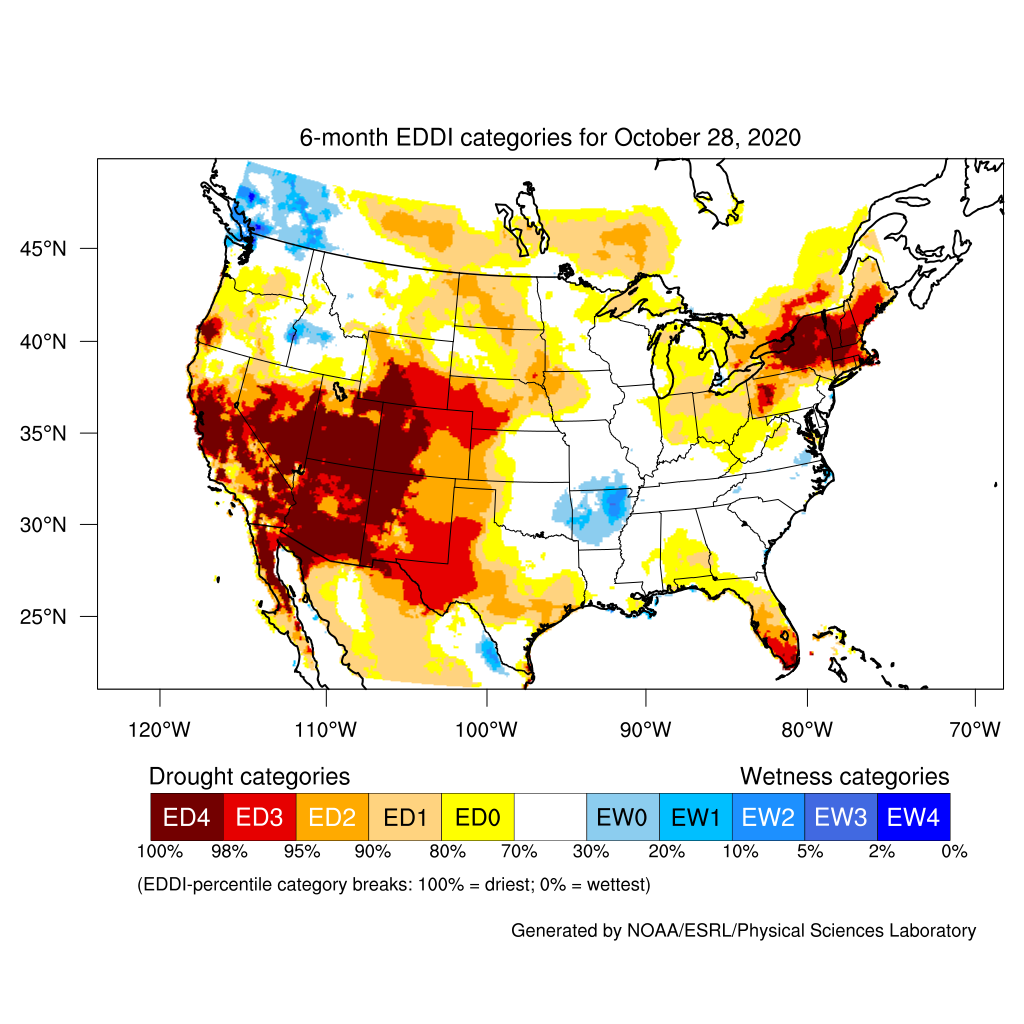
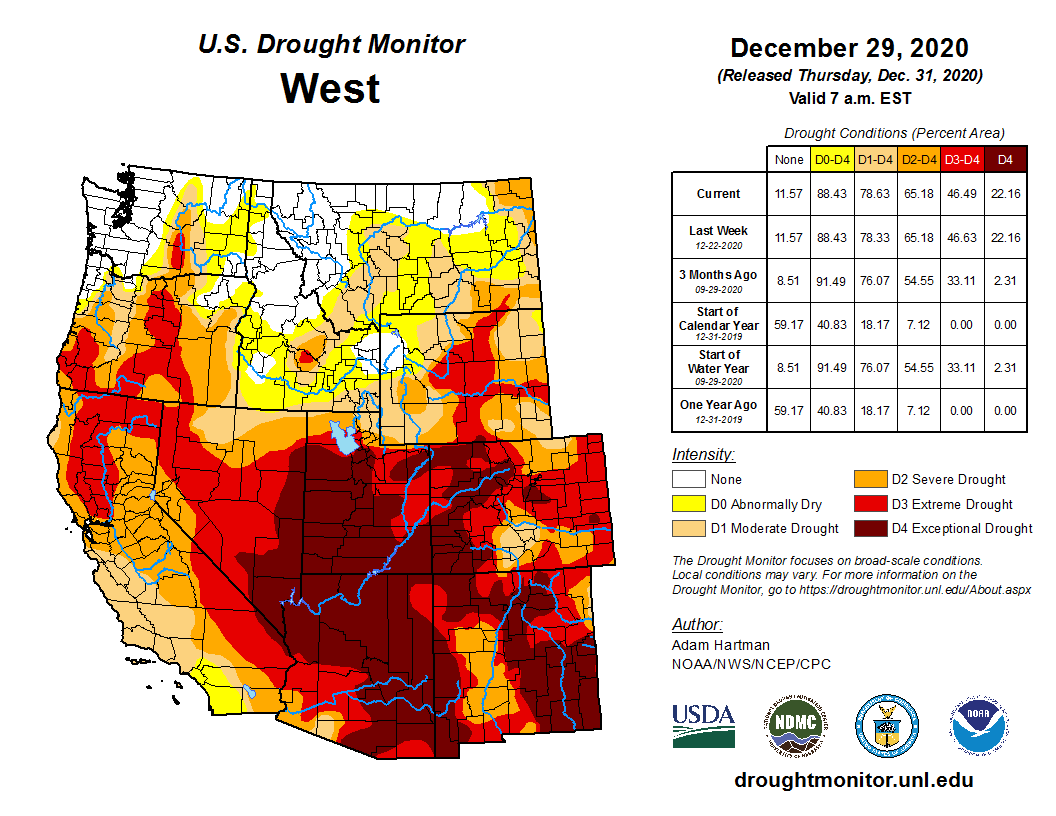
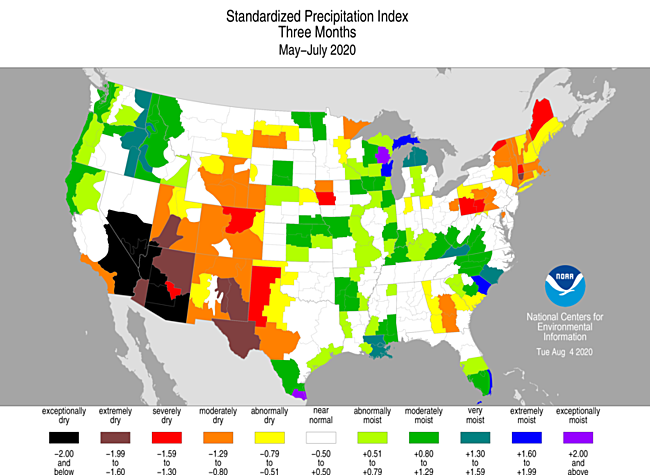
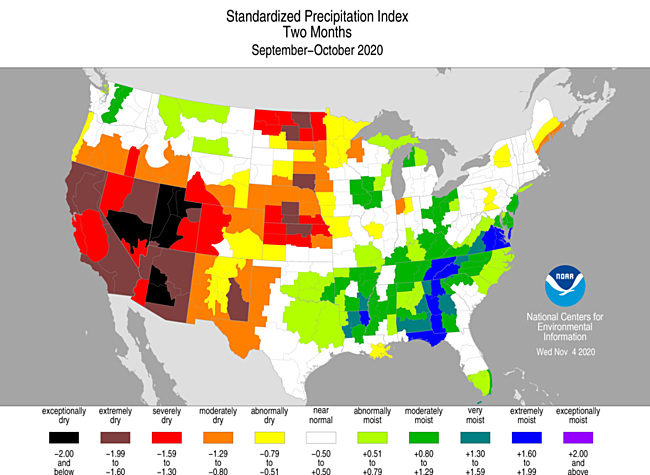
The year began with moderate drought to severe drought in the Four Corners area of the Southwest and moderate drought in the Pacific Northwest, both reflecting lingering dryness from the previous six to nine months. Drought expanded across the West as the year progressed, with rapid expansion occurring in May (from 30.0% to 40.1% area in moderate to extreme drought, or a 10.1% increase for the region) and July-September (from 45.2% to 76.1% in moderate to exceptional drought). This was a period of very warm and dry weather for much of the West, especially the Southwest (May precipitation and temperature ranks; July-September precipitation and temperature ranks) and Wyoming (which had the driest July-August in the 1895-2020 record). The lack of precipitation from the failure of the summer monsoon worsened drought conditions in the Southwest and the excessively hot temperatures increased evapotranspiration which exacerbated conditions. The western drought area peaked at about 80.1% in moderate to exceptional drought on October 13 and held steady at about 75-79% for the rest of the year. But the continued dry conditions expanded exceptional (D4) drought to about 22.2% of the West by year's end.
|
|
Based on the Palmer Index, the West began 2020 with 6.3% of the region in moderate to extreme drought. The drought area rapidly expanded, reaching 32.5% of the region by the end of April. The area decreased slightly in May to 28.3%, but resumed its rise the next month, reaching 61.1% by the end of August. It dipped again slightly in November, but rose in December, ending the year at 80.6%.
Regionally, the West had the third driest and fourth warmest year in 2020. Record and near-record warmth and dryness occurred during several time periods. These include the driest and second warmest July-October, driest July-December, warmest August-October, and second warmest May-October. January-December temperatures across the West have shown a significant warming trend since the 1980s. Overall annual precipitation shows large multi-year swings from wet to dry, but no significant long-term trend. The increasing temperature trend, however, means more evapotranspiration is occurring than before and this makes the dry spells, when they happen, result in increasingly more intense droughts.
|
|
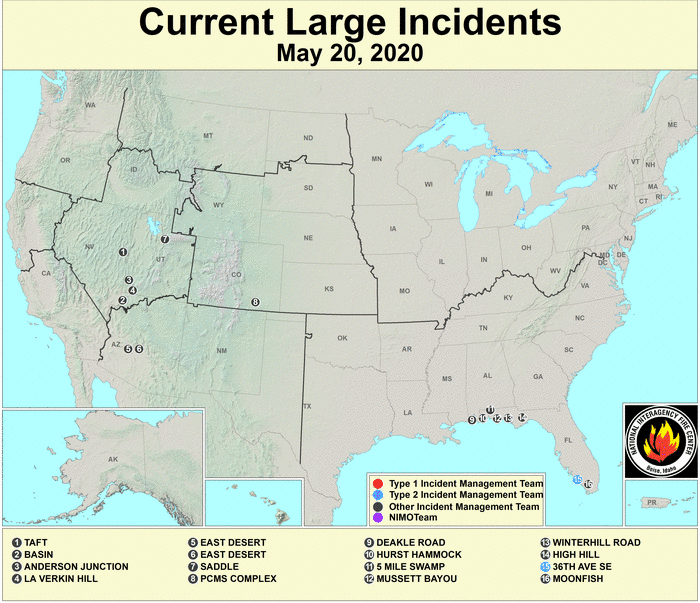
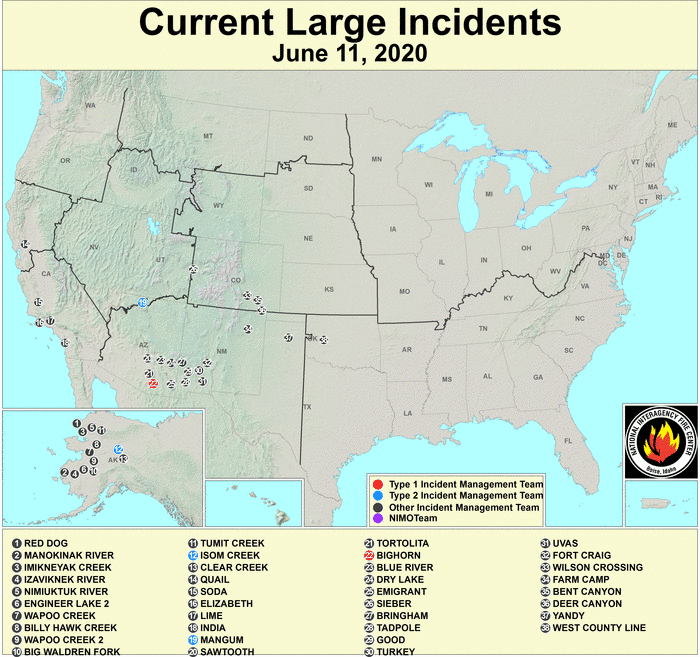
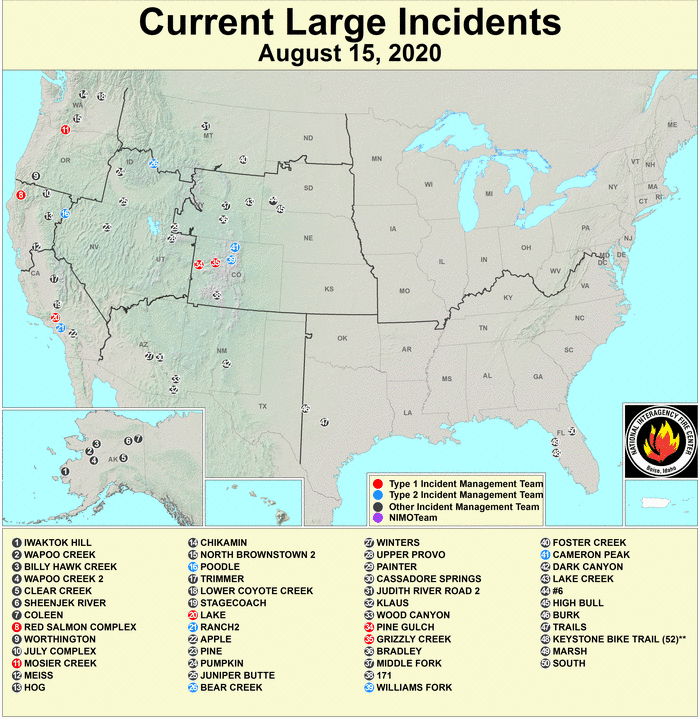
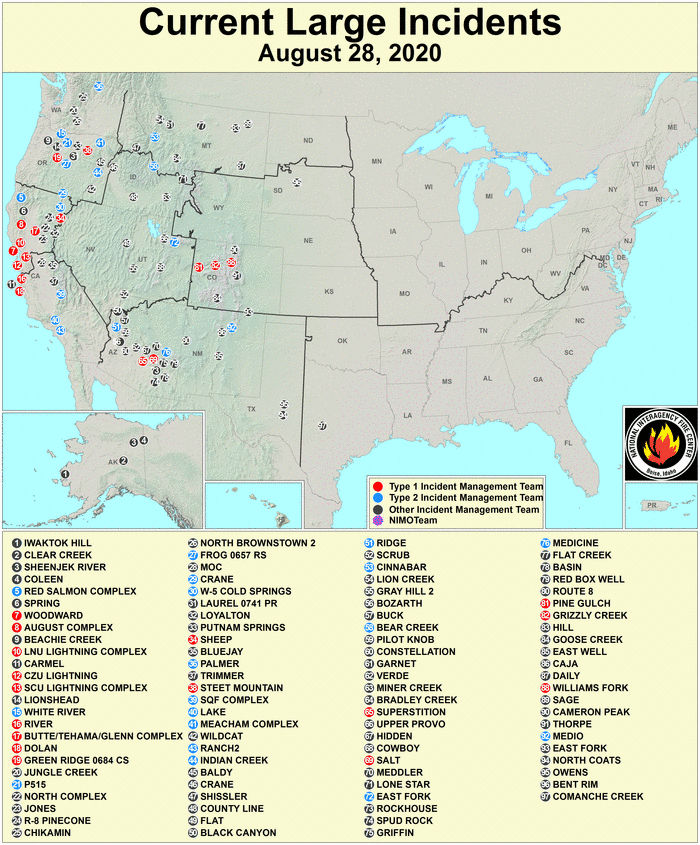
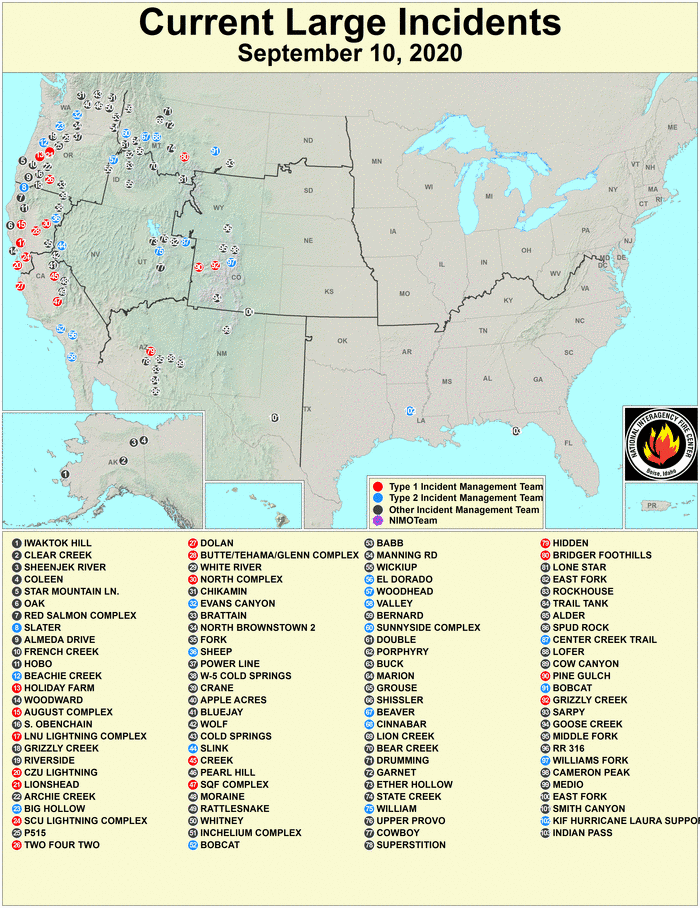
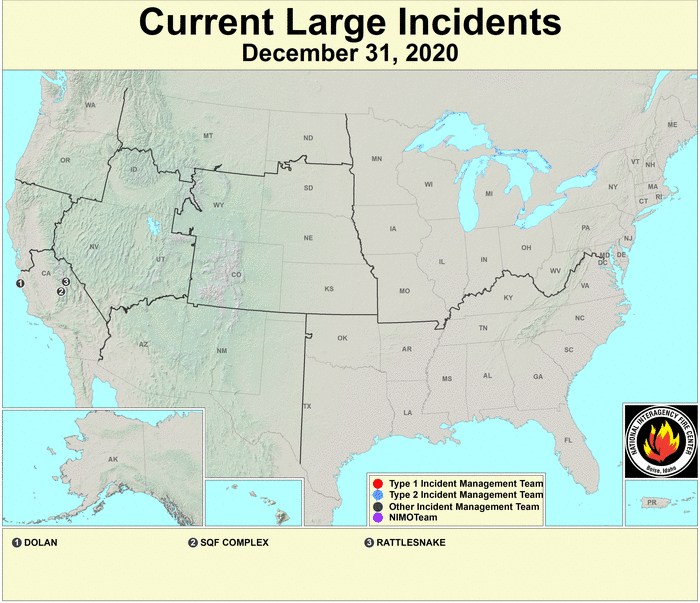
The excessive evapotranspiration and lack of rain dried soils across the West, with two-thirds or more of the topsoil moisture dry or very dry across most western states by the end of October. Several large wildfires sparked to life in parts of the West in the spring, with the wildfires spreading during June. They were burning across all of the western states during the summer and fall, and some had yet to be extinguished in California as the year ended. Nationwide, over 10 million acres burned in 2020, which is more than the 2010-2019 average of 6.79 million acres and the largest acreage consumed in the U.S. since at least 2000. The three largest wildfires in Colorado history, and five of the six largest wildfires in California history, occurred in 2020.
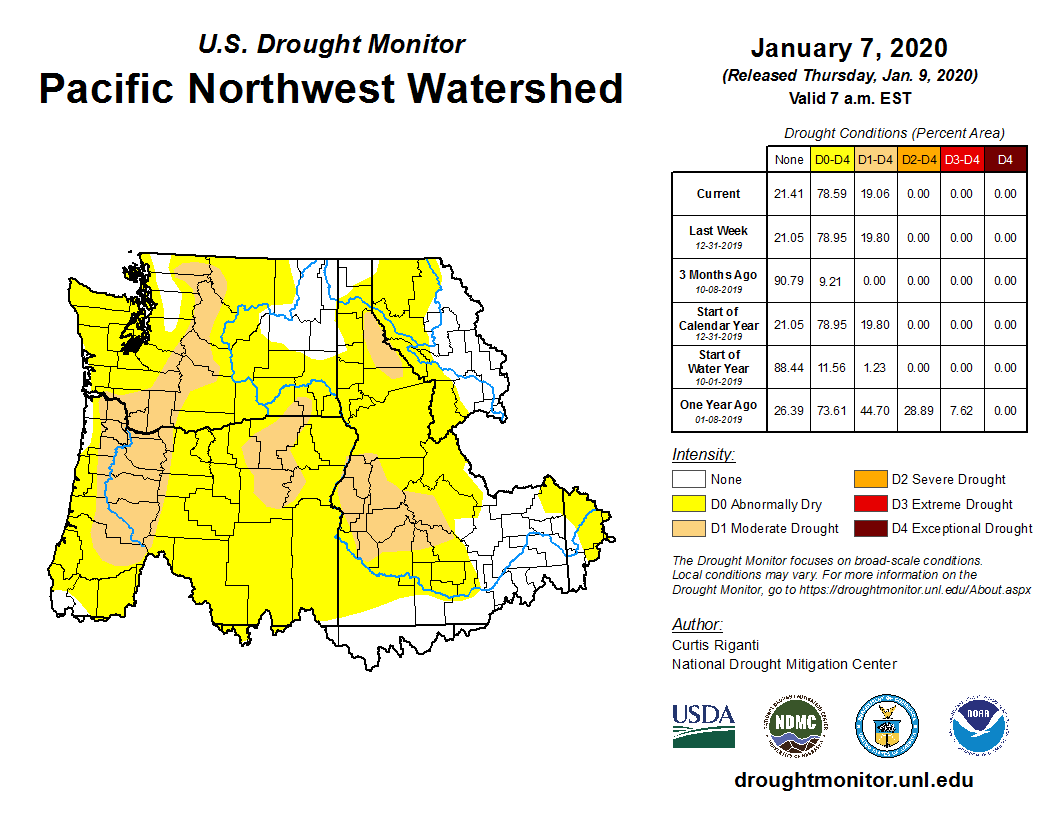
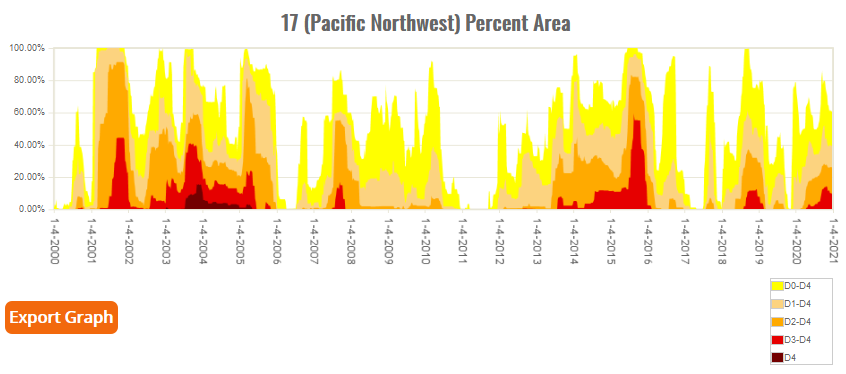
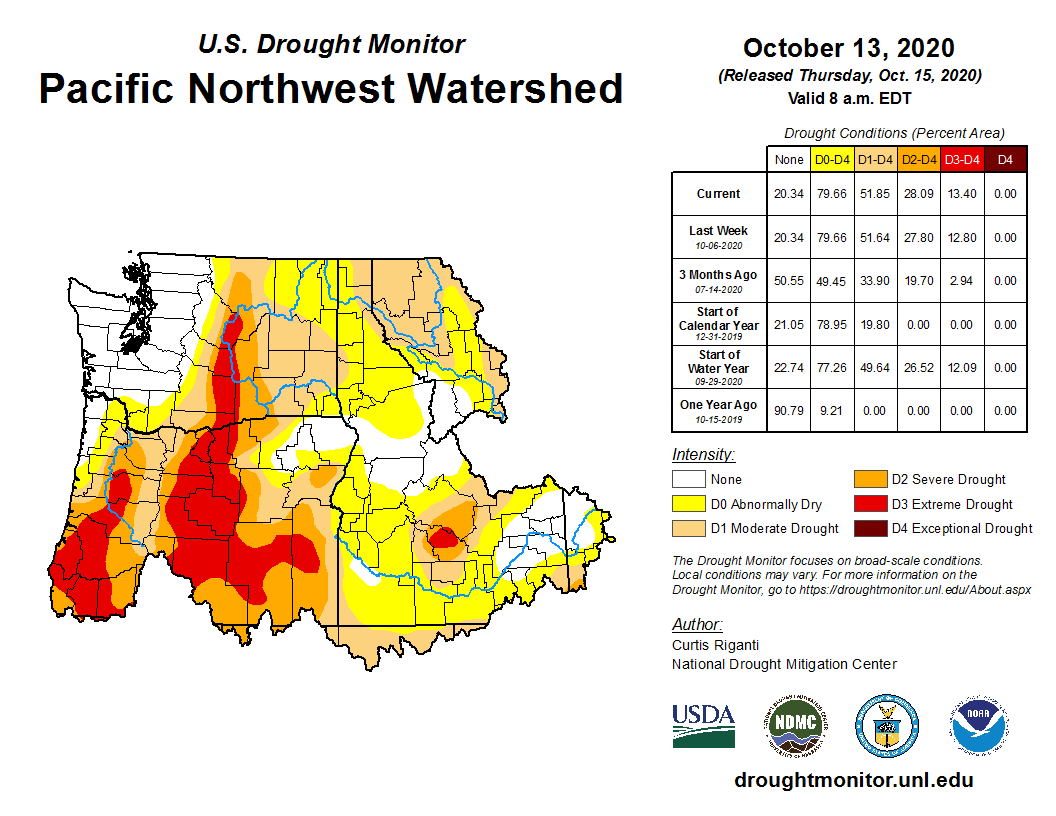
Pacific Northwest:
|
|
The Pacific Northwest began the year with about 20% of the region in moderate drought. Wet conditions in January decreased the drought area, but a dry spring prompted a steady increase beginning in March that reached a peak of about 42.7% moderate to extreme drought on May 19. Oregon had the eighth driest February-April. Above-normal summer precipitation contracted the drought area again, but it did not decrease the intensity as extreme drought hung on. Southern parts of the region were dry during the fall, with the drought area rising again to reach a second peak of about 51.9% on October 13. The region ended the year with about 39.3% of the area in moderate to extreme drought.
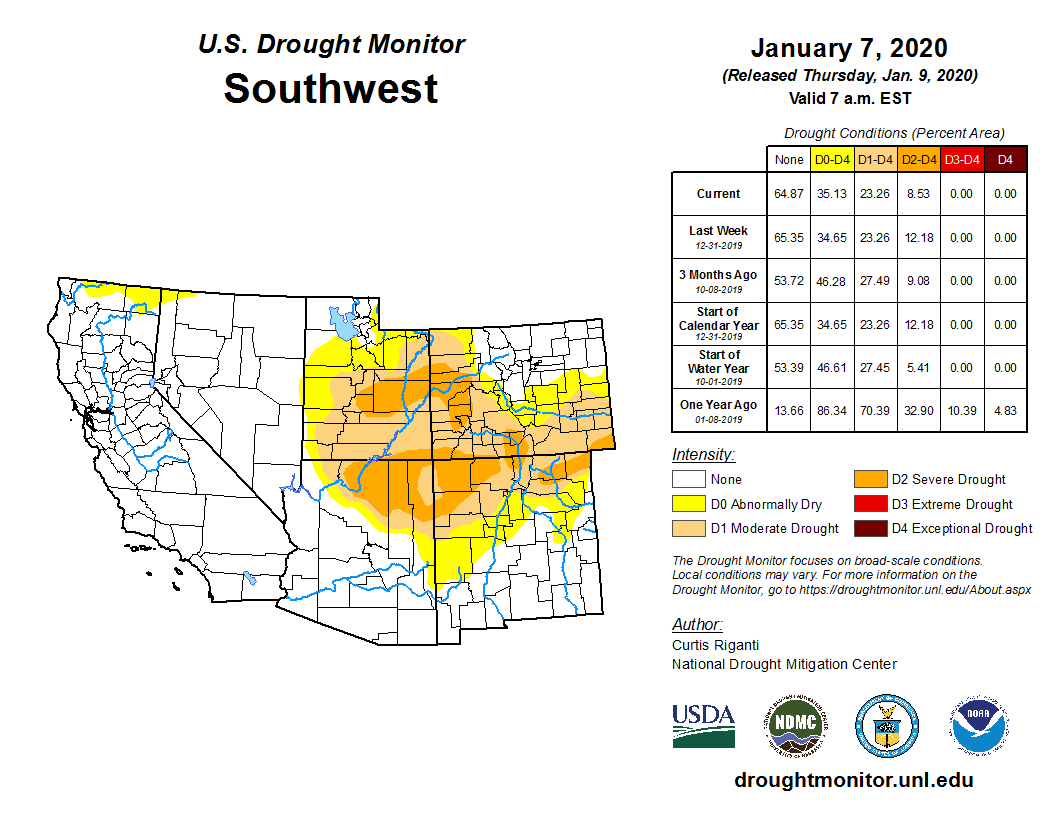
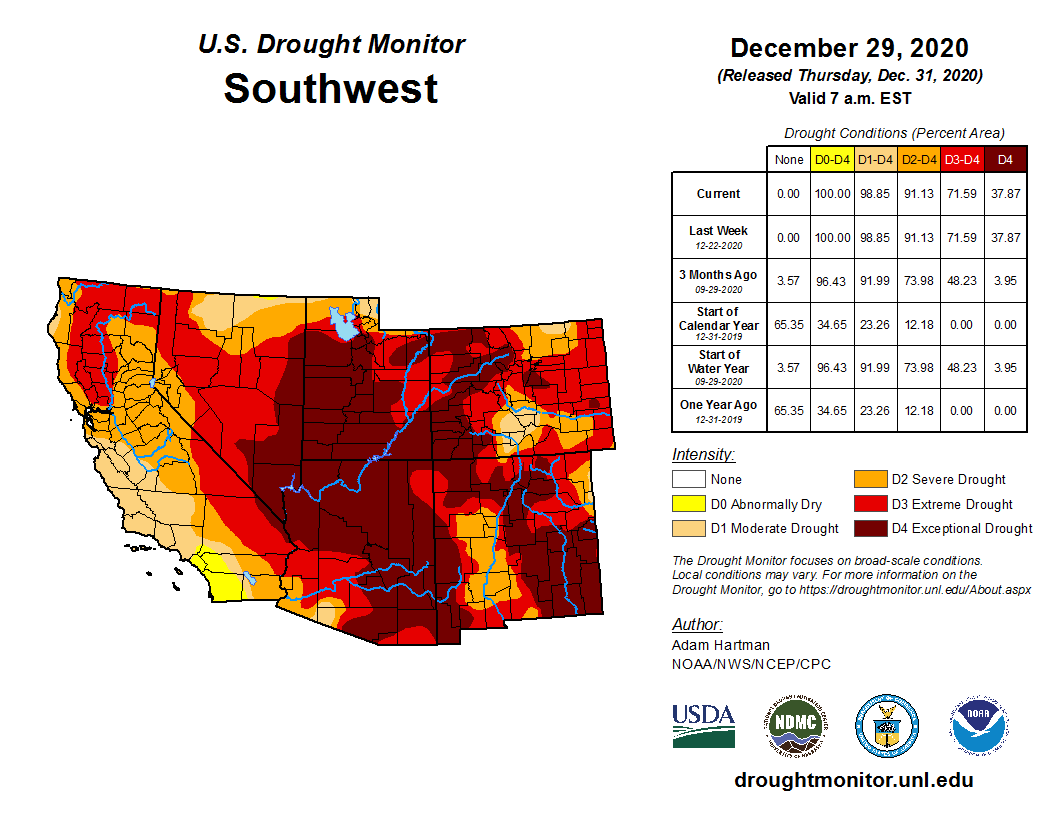
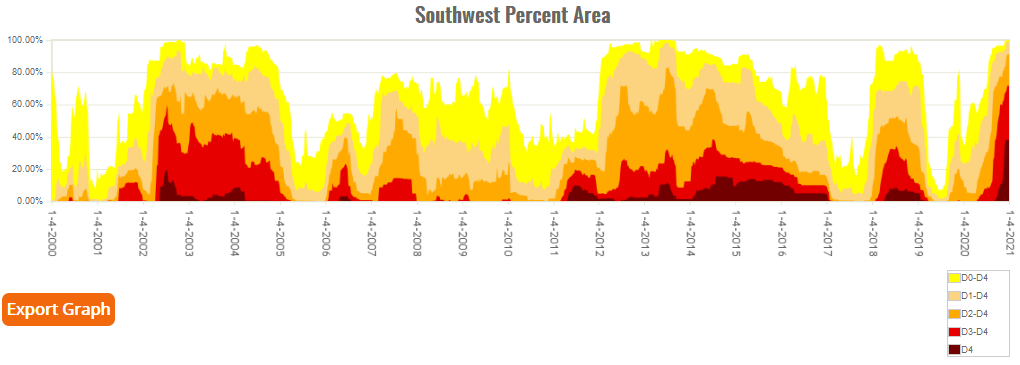
Southwest:
|
|
|
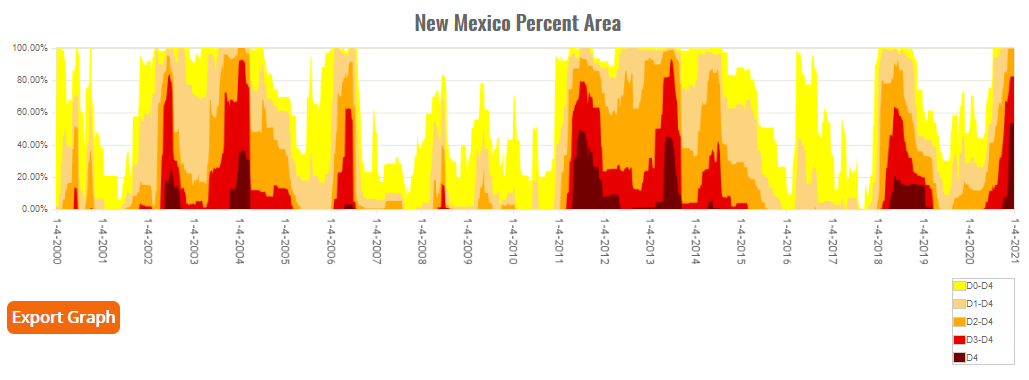
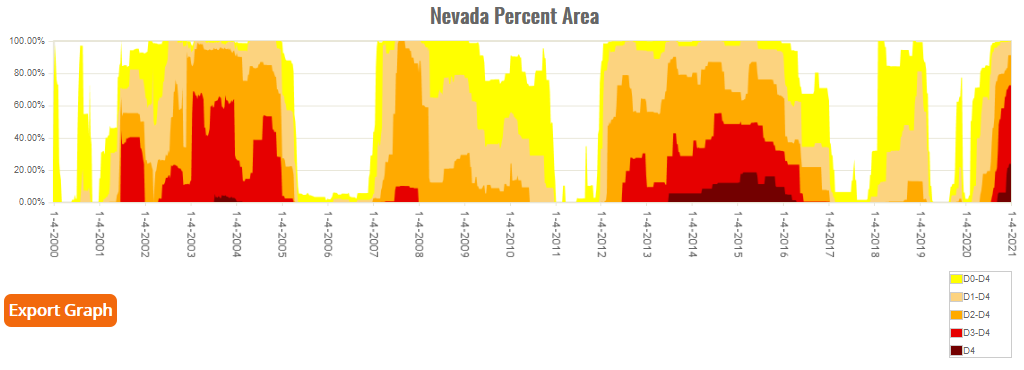
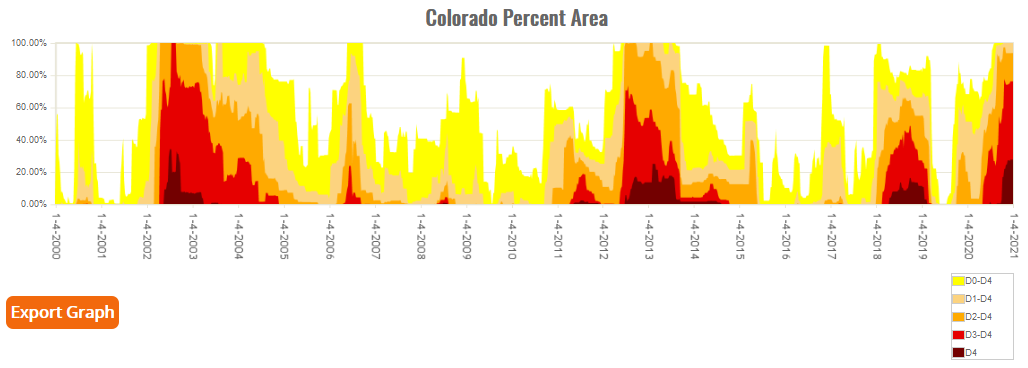
The Southwest began the year (January 7) with a fourth (23.3%) of the region experiencing moderate to severe drought, mainly in the Four Corners States. Parts of the Southwest experienced very dry conditions almost every month during 2020. Only March and June were mostly near to wetter than normal. July-October was the driest period with record dry conditions occurring across much of the region. Excessive heat occurred concurrent with the dryness, with May-November being a period of persistently warm and record anomalies. The combination of record dryness and record heat resulted in Standardized Precipitation Evapotranspiration Index (SPEI) values which far exceeded any previous records for several states. By the end of the year, moderate to extreme drought had spread across the Southwest with exceptional drought covering much of the Four Corners States.
Statewide records for dryness occurred across the Southwest and included:
- Nevada — driest April-October, May-October, June-October, July-October, August-October, and September-October;
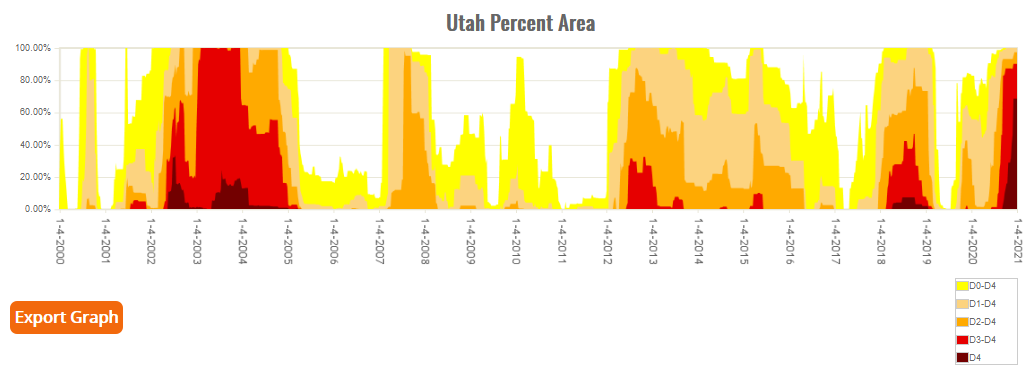
- Utah — driest January-October, February-October, April-October, May-October, June-October, July-October, August-October, and September-October;
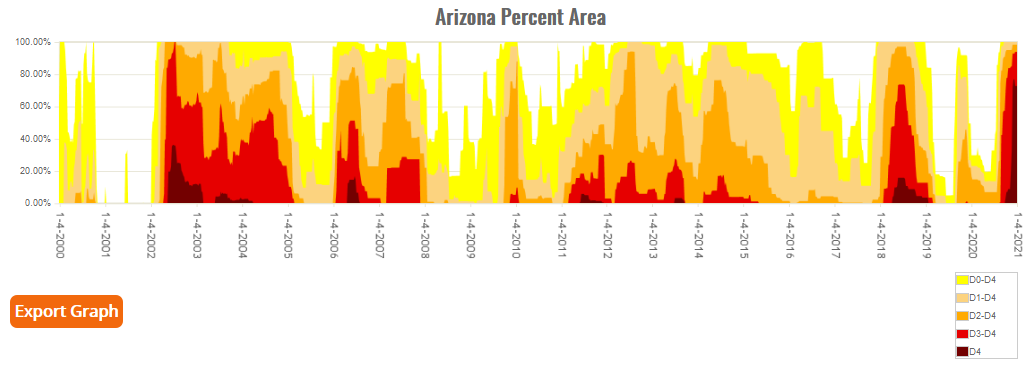
- Arizona — driest April-October, May-October, June-October, July-October, and August-October;
- New Mexico — driest April-May, April-September, and May-September;
- California — driest February, July-October, August-October, and September-October.

Statewide records for heat occurred across the Southwest and included:
- Nevada — warmest April-October, July-October, and August-October;
- Utah — warmest August-October;
- Arizona — warmest March-November, April-November, May-November, June-November, July-November, and August-November;
- New Mexico — warmest February-August, March-August, April-August May-August, July-August, and August;
- California — warmest April-October, May-October, June-October, July-October, August-October, September-October, and October.
As mentioned earlier, the combination of record dryness and record heat resulted in the rapid expansion of exceptional drought across the Southwest. Exceptional drought expanded to cover 76.8% of Arizona by December 1, 68.6% of Utah by December 1, 53.3% of New Mexico by December 1, and 23.7% of Nevada by December 15, which are records for those states, and 27.6% of Colorado by December 8.
Great Plains:
|
|
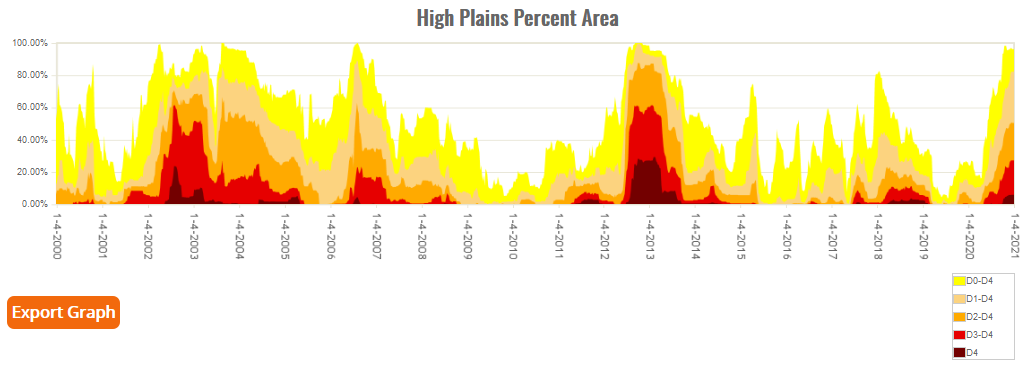
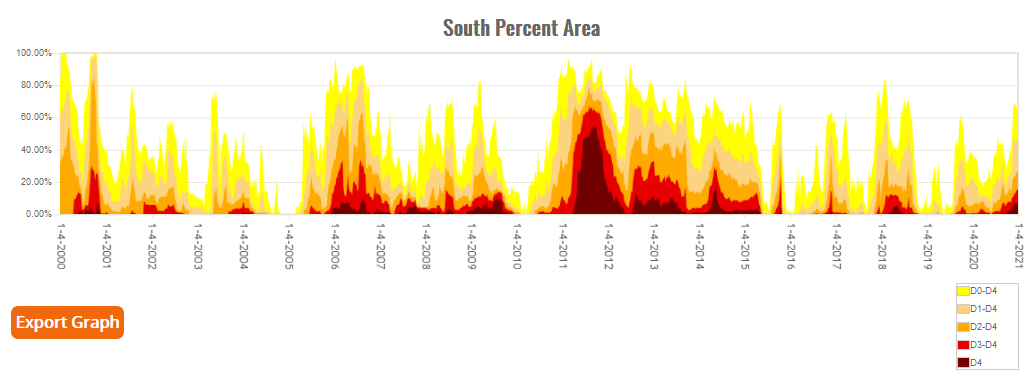
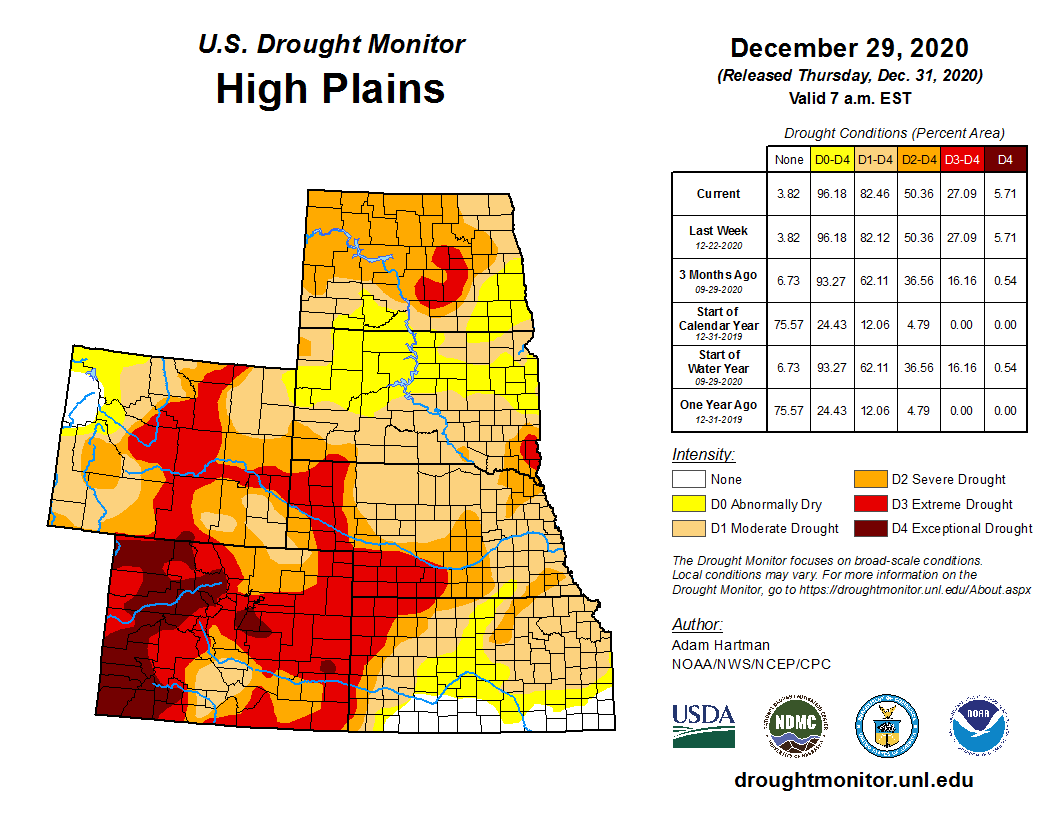
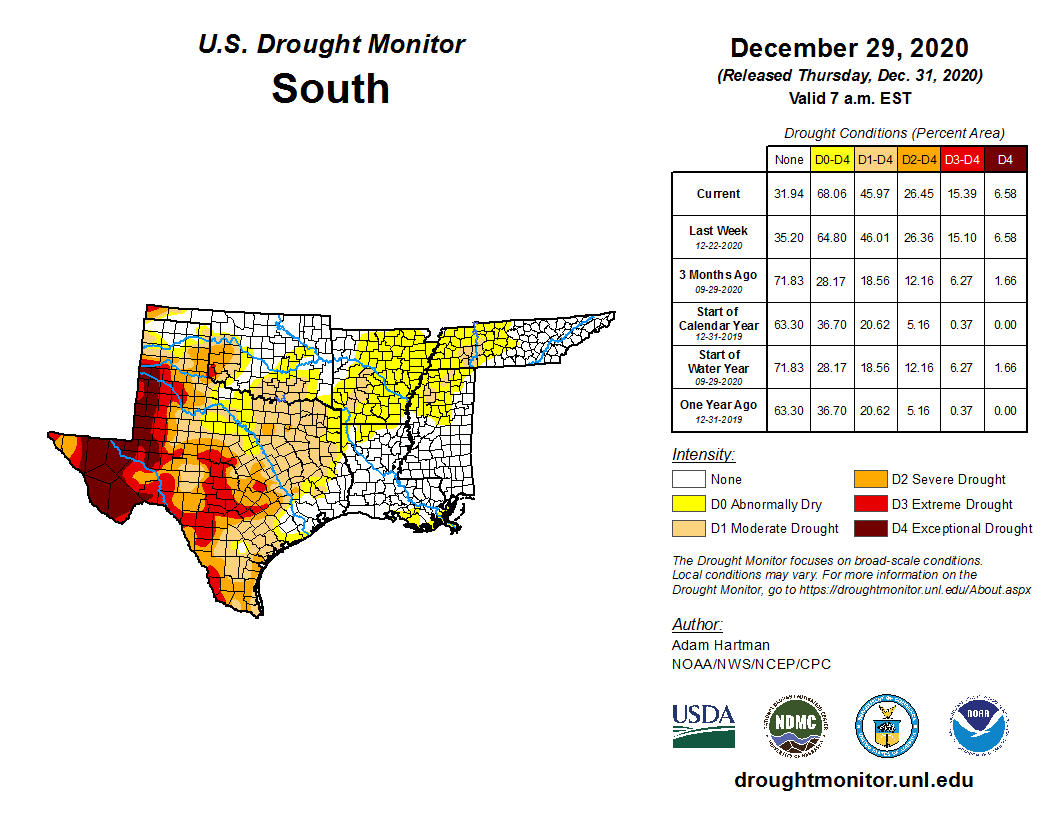
The western portions of the Great Plains (known as the "High Plains") experienced the driest weather and most severe drought (in the Plains region) during 2020, with drought extending into eastern portions at times. The year began (January 7) with 12.1% of the central to northern Plains in moderate to severe drought and 21.5% of the southern Plains in moderate to extreme drought (the southern Plains statistic includes parts of the Lower Mississippi Valley). In the south the drought was in southern and eastern Texas, while further north it extended into western Kansas. Near-normal to wet conditions contracted the drought area during the first half of the year in the southern portions and held the drought area steady for the first four months in the central to northern portions. Dry conditions in the High Plains in April and May expanded drought in Kansas to the Texas panhandle, with extreme drought developing in southwest Kansas and adjoining states. June began a period of very dry conditions in various parts of the Plains. Moderate to exceptional drought steadily expanded, reaching about 82.5% of the central to northern Plains by the end of the year. In the southern Plains, the drought area waxed and waned during the second half of the year, peaking at about 47.9% of the region on November 24. But while the total drought area in the south oscillated up and down, conditions steadily worsened in western Texas, where extreme drought developed in June and exceptional drought appeared by September.
|
|
Dryness occurred early in the year in the northern Plains where North Dakota had the driest February-March in the 126-year record, and again later in the year with North Dakota ranking third driest on record for September-December. In the central Plains, Nebraska had the second driest August-October on record.
|
|
In the southern High Plains, especially in western Texas where exceptional drought developed, dry conditions occurred frequently throughout the year, interspersed occasionally with wetter conditions, and supplemented during the summer with excessive heat. Texas climate division 5 (Trans Pecos) had the driest July-November and warmest July-August on record. In the panhandle, Texas climate division 1 (High Plains) experienced the second driest April-September, third driest April-May, and third warmest July-August.
Northeast:
|
|
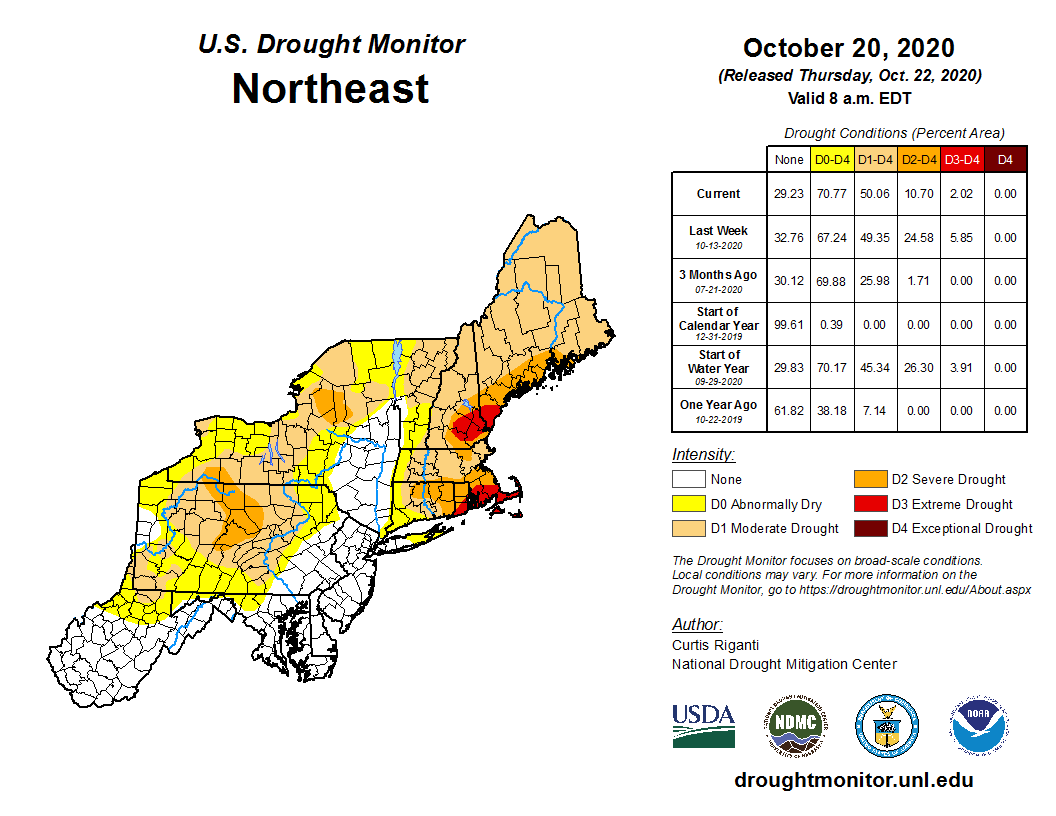
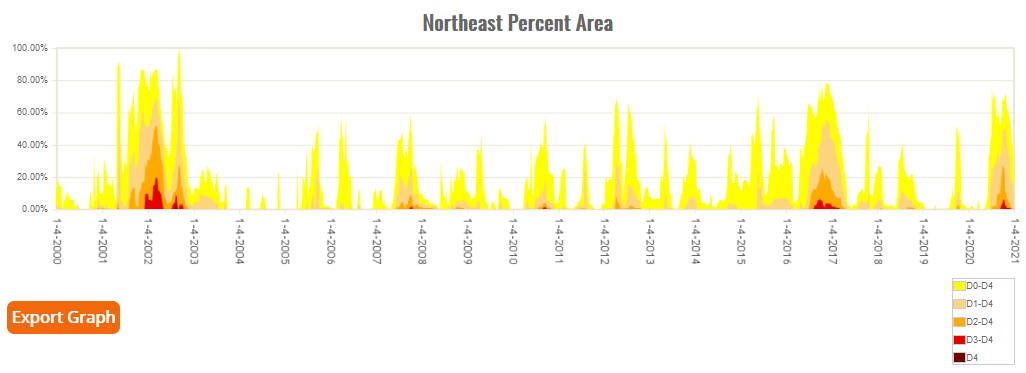
Parts of New England were dry in January and March, but widespread dryness occurred in May and June, and again in September, with localized areas of dryness in July and August. The region experienced above-normal temperatures most months, notably in January-March and November-December, and especially June-September when the heat increased evapotranspiration substantially. The year began with the region drought-free. Moderate drought appeared near the end of June, with the drought area steadily growing to 50.1% of the region by October 20. Late fall and early winter precipitation contracted the drought area, with only 3.6% of the Northeast experiencing drought at year's end.
|
|
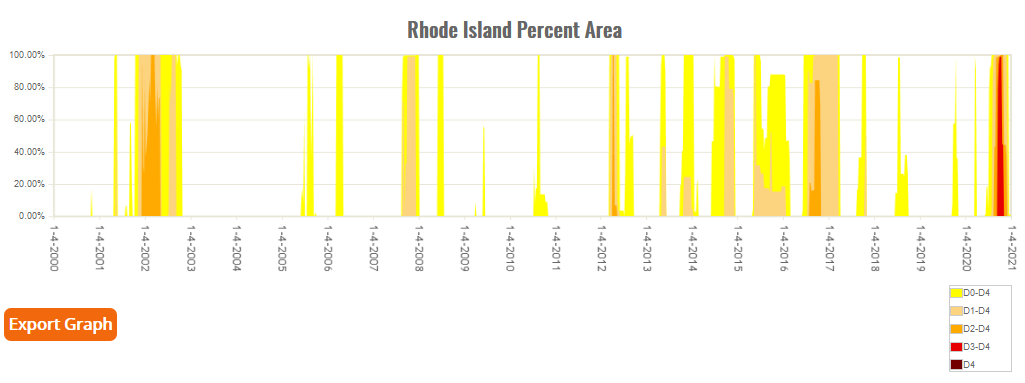
The dryness and heat were especially acute in southern New England. Rhode Island experienced the driest July-September and warmest June-September in the 1895-2020 climate record. This contributed to the first substantial development of extreme (D3) drought in the state in the 20-year USDM history. Rhode Island also had the second warmest January-March and second warmest year on record. Connecticut had the fifth driest May-September. Both Connecticut and Massachusetts had the second warmest January-March and second warmest June-September, which undoubtedly contributed to the second warmest year for both states. June-September temperatures in the region have shown a steady and remarkable increasing trend over the last 40 years.
Midwest:
|
|
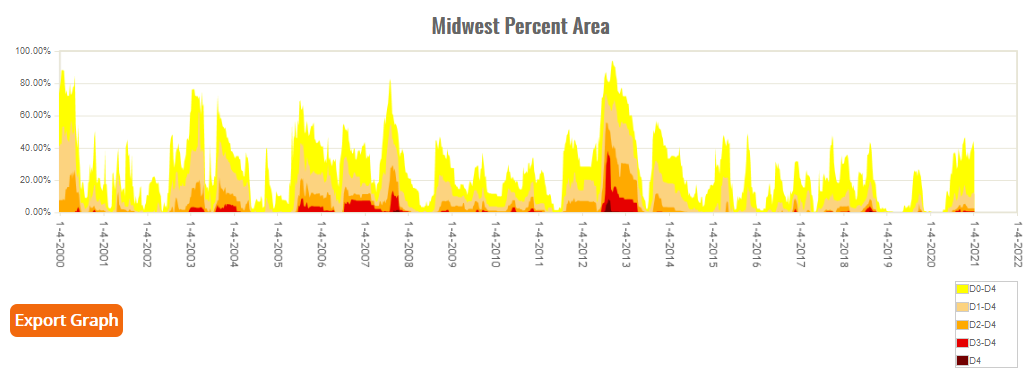
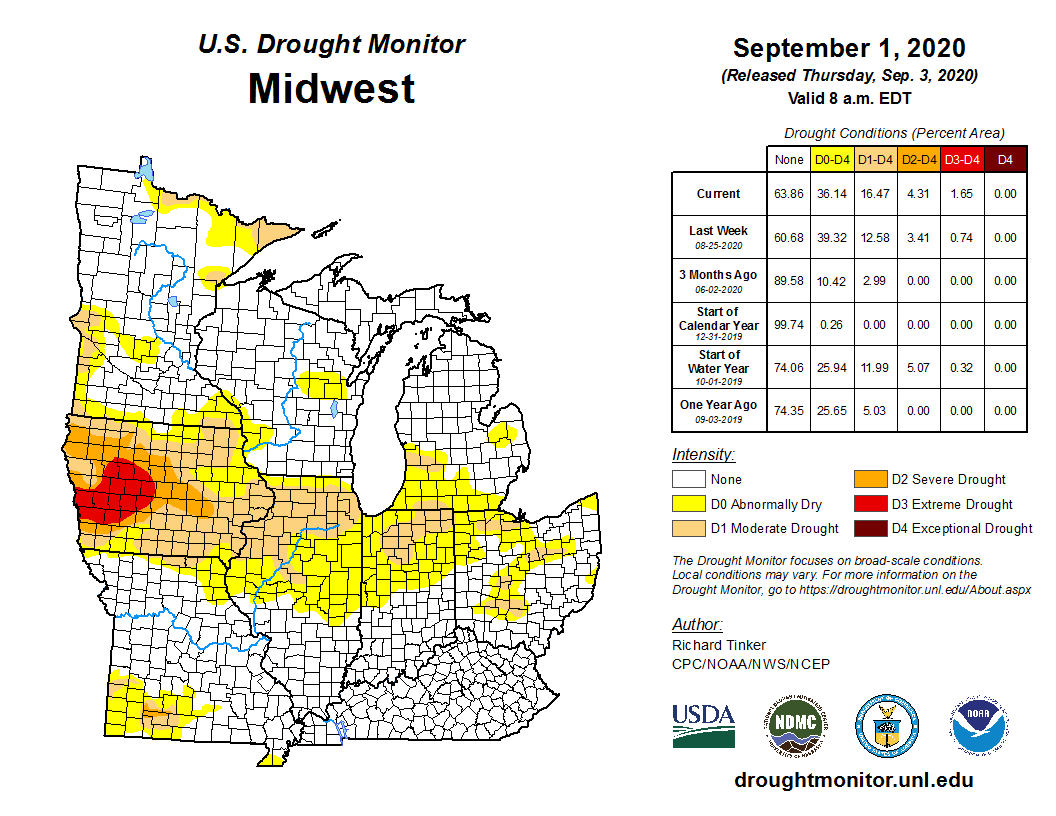
Drought did not appear in the Midwest states until June when moderate drought appeared in Minnesota. Drought developed in Iowa, Missouri, and the Great Lakes states as the summer progressed, with extreme drought appearing in western Iowa during August. Iowa climate division 7 (Southwest Iowa) had the driest August on record, climate division 4 (West Central Iowa) the third driest February-August, and climate division 1 (Northwest Iowa) the fifth driest July-August. The region's drought area peaked at 16.5% of the region on September 1 and again at 16.9% on October 13 before ending the year at 11.0%.
Alaska:
|
|
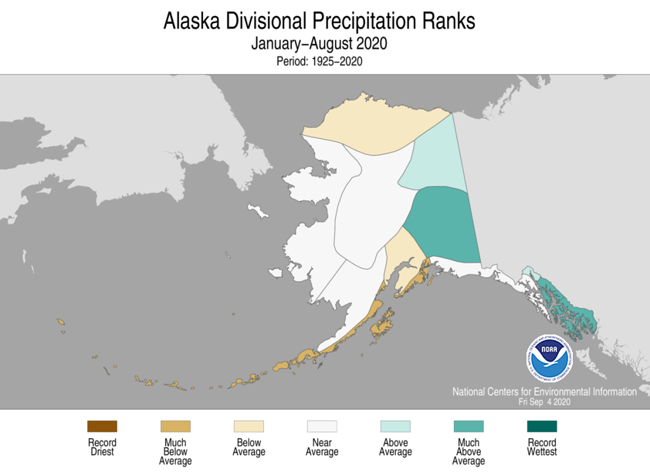
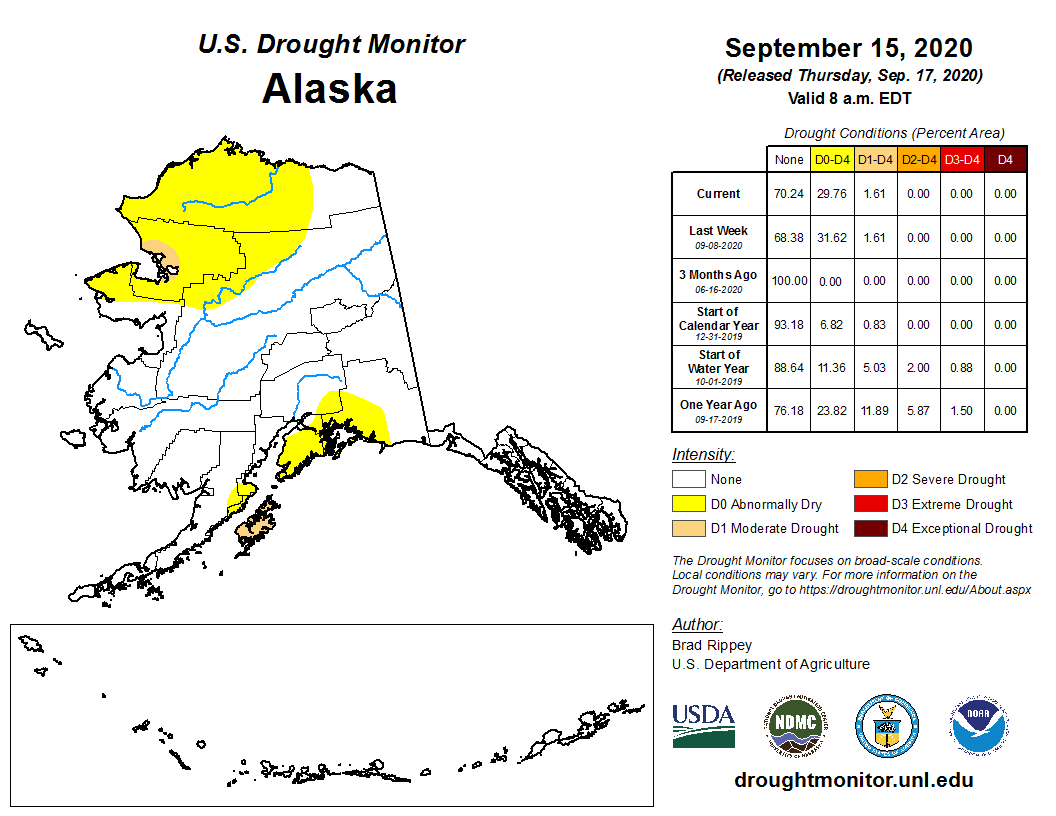
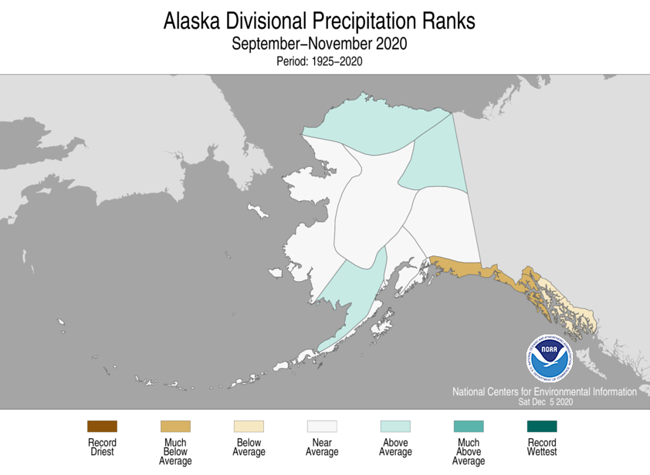
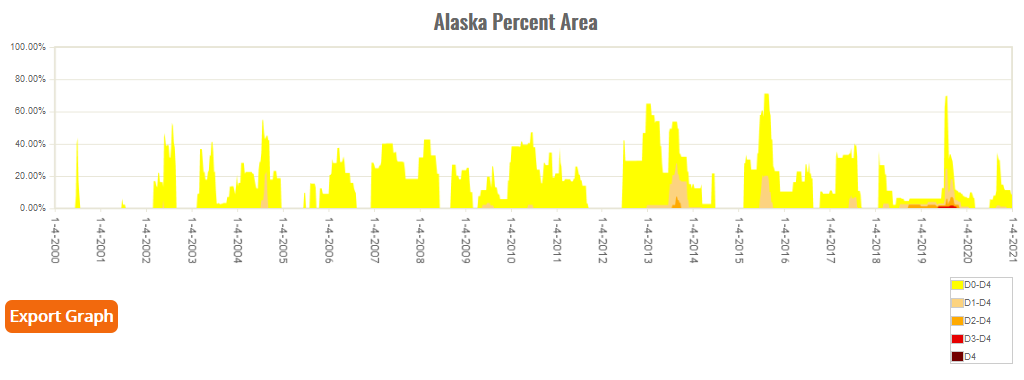
Unusual dryness occurred in parts of Alaska at various times throughout the year. The southern coastal areas were drier than normal for much of January-August and again (towards the panhandle) September-November. Dryness occurred in the northwest and north central areas later in the year. The year began with moderate drought lingering in the panhandle which quickly disappeared. Moderate drought returned in August, this time to the southern coastal areas. A spot of moderate drought developed in the northwest coastal area in September and lasted until November. The drought area peaked in September when the two moderate drought areas totaled to 1.6% of the state. Drought disappeared from Alaska in November, although abnormal dryness lingered.
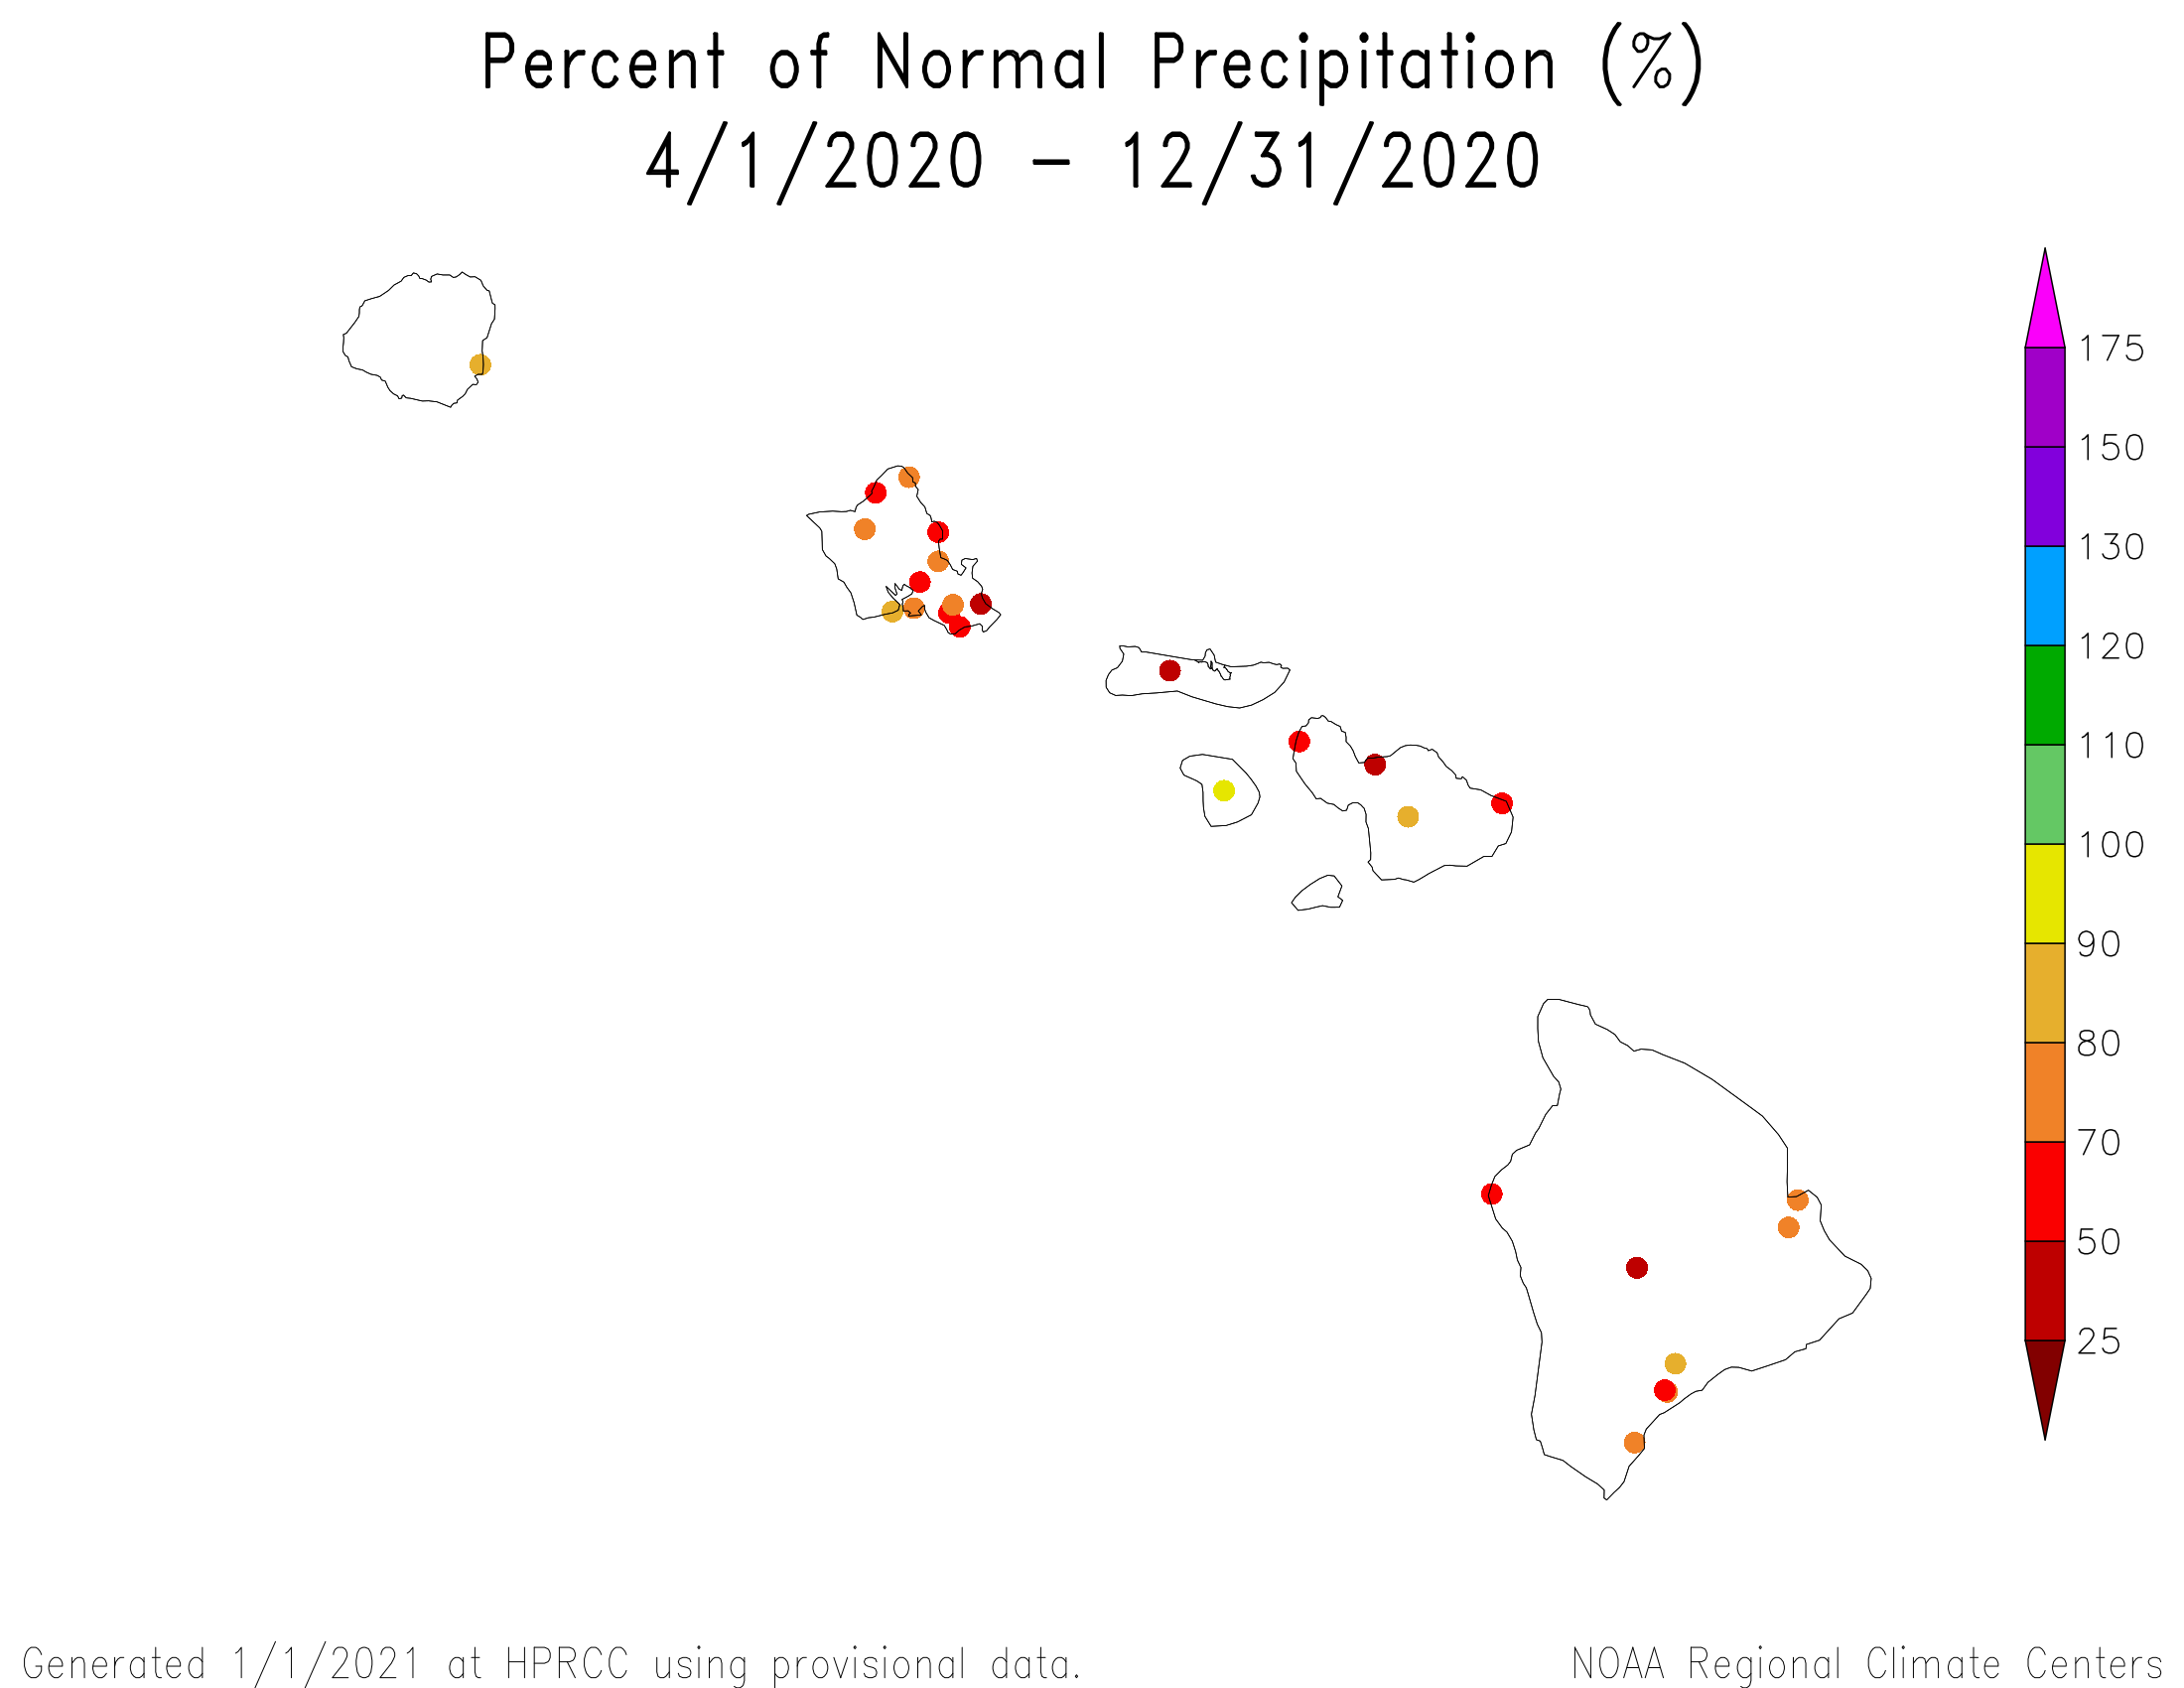
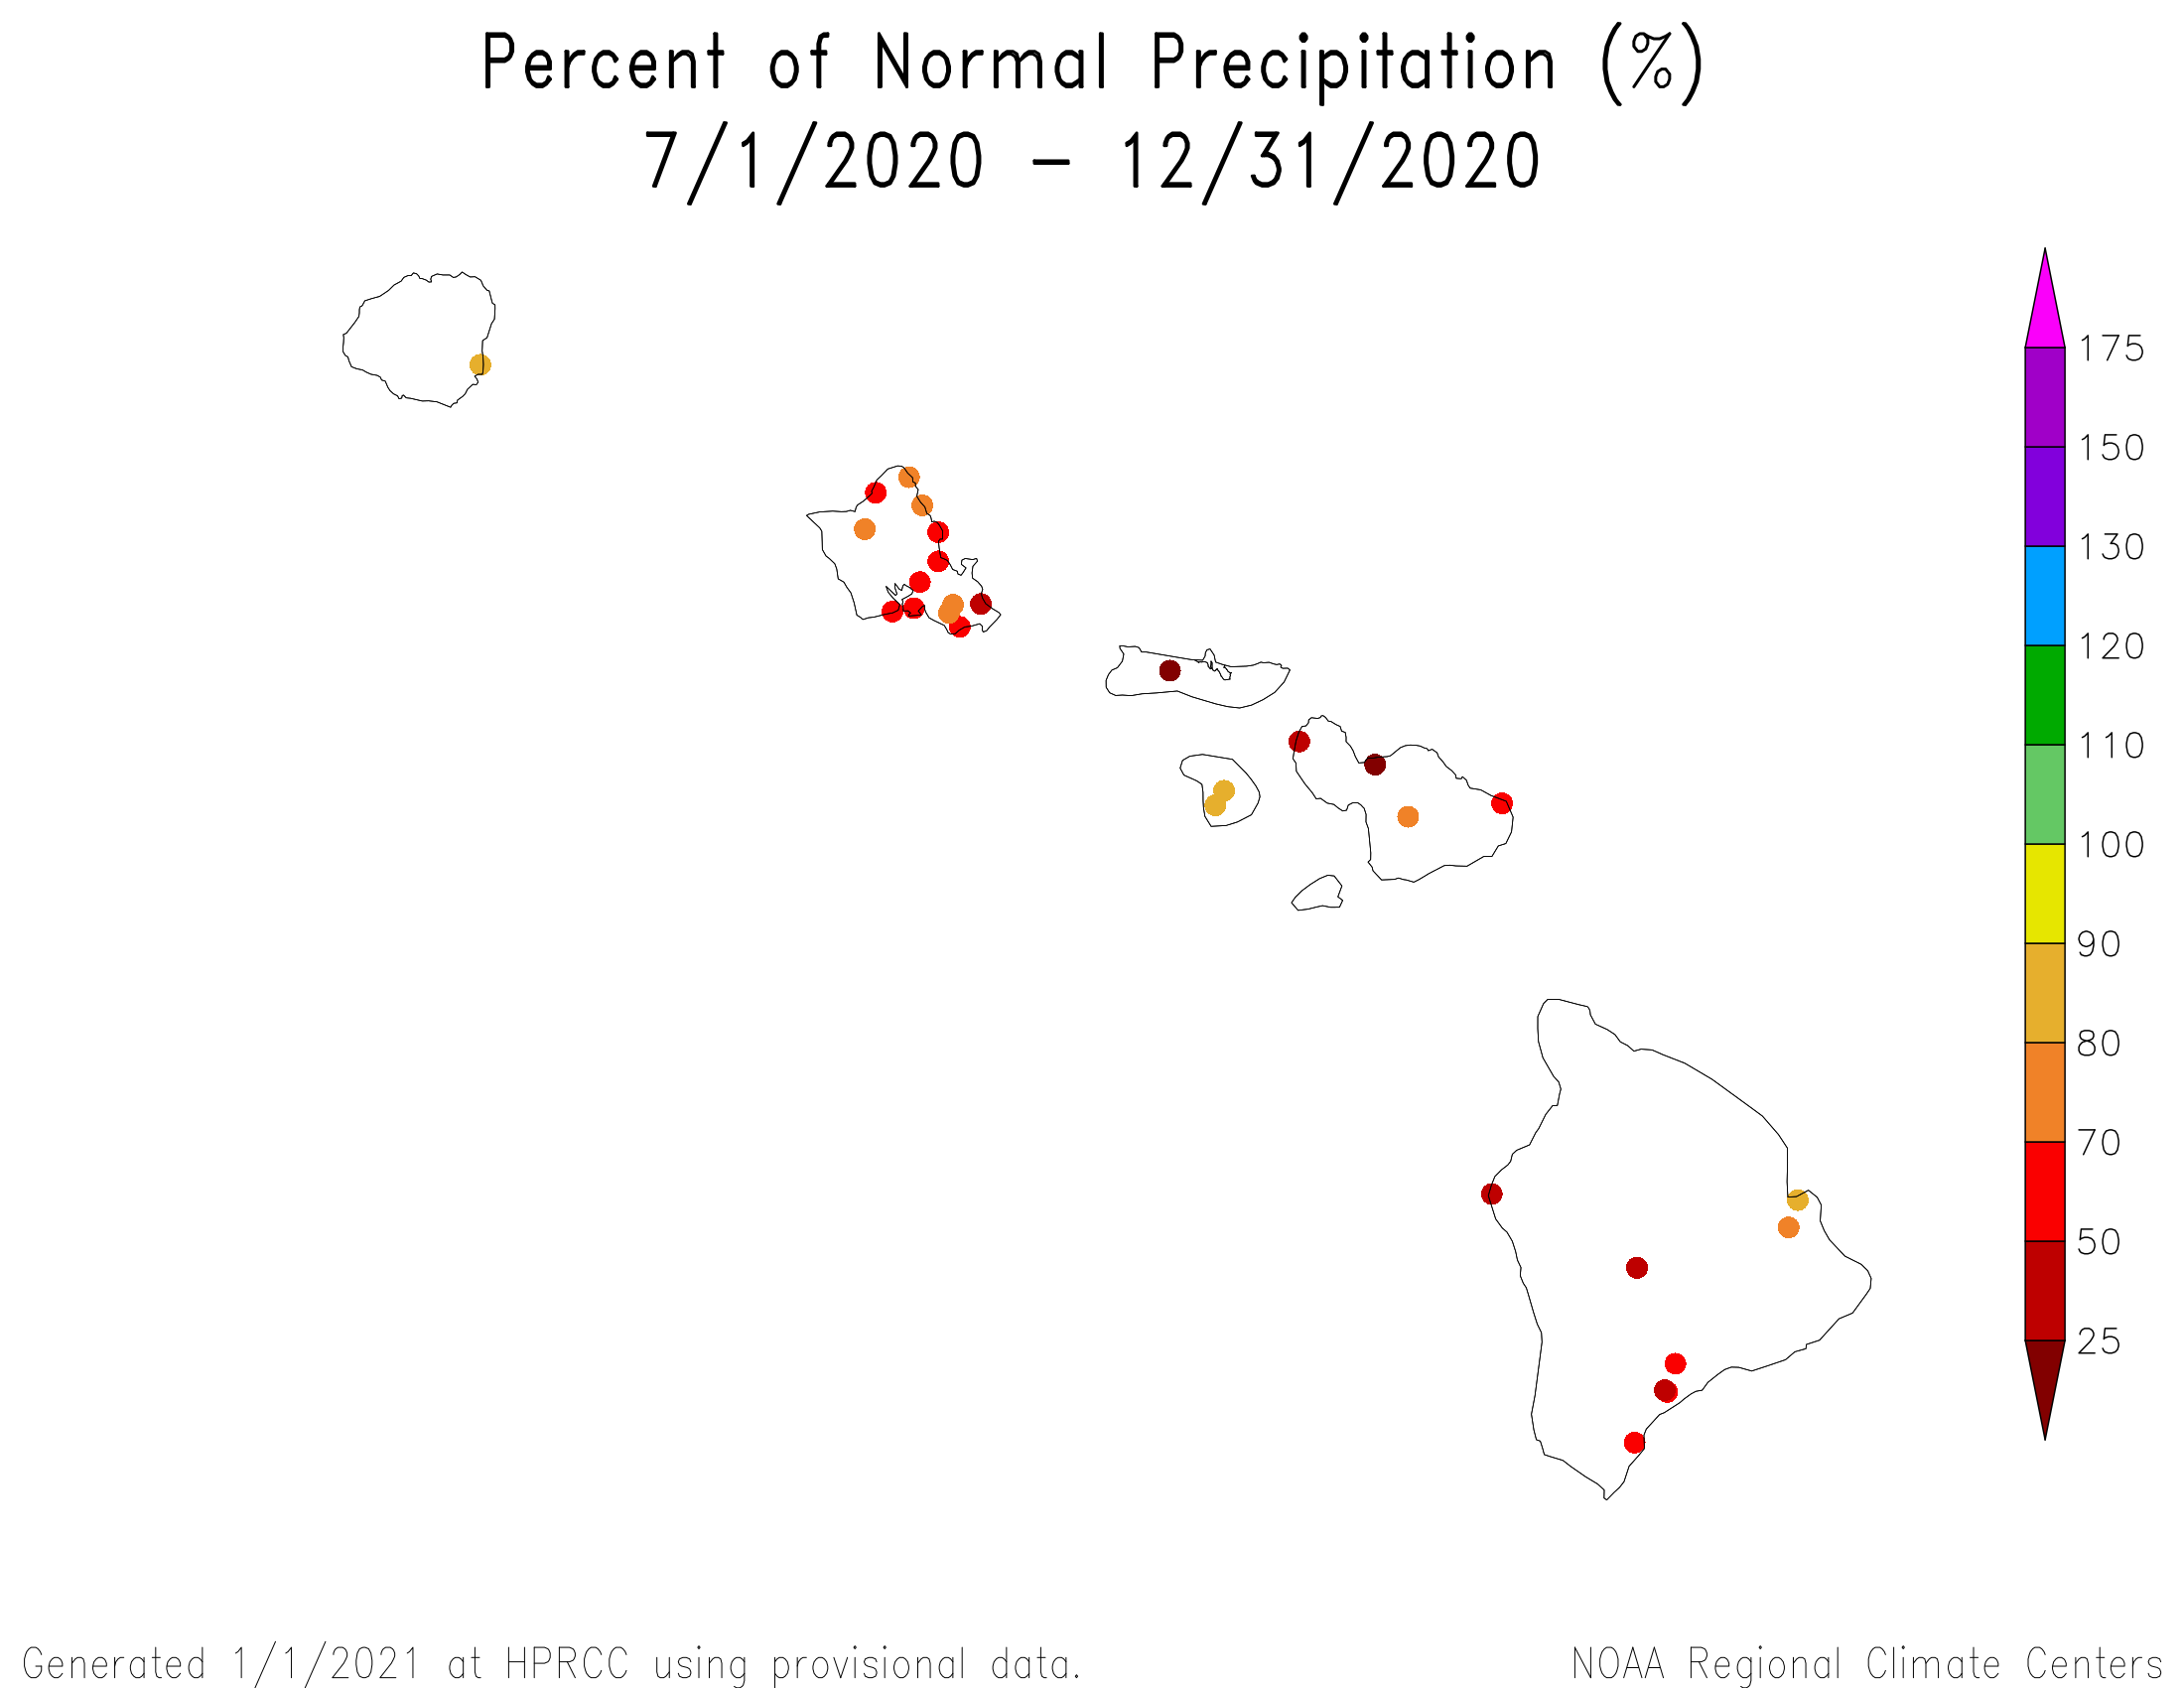
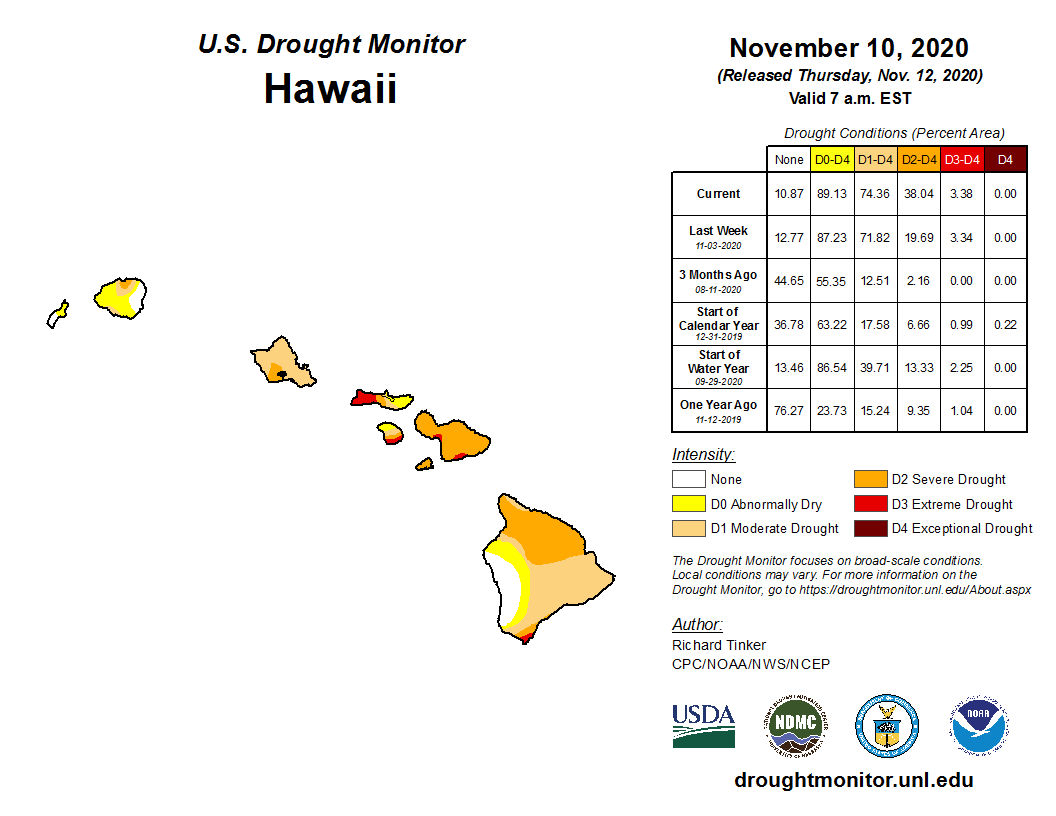
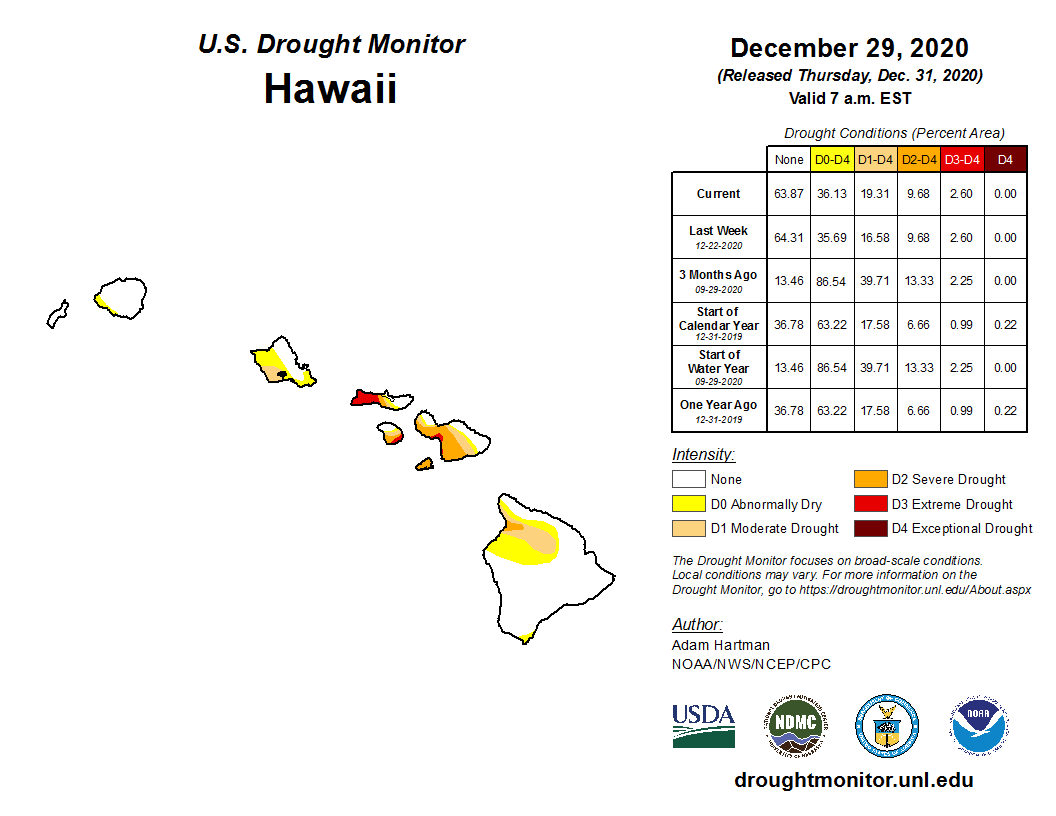
Hawaii:
|
|
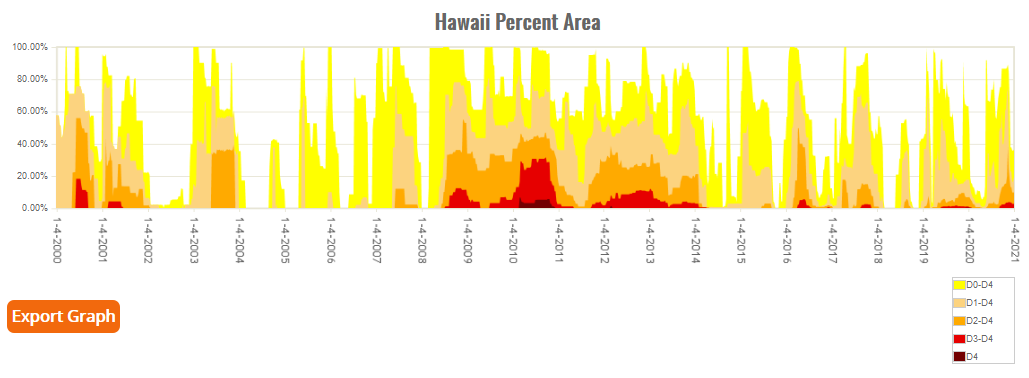
The year began with about 17.2% of Hawaii in moderate to exceptional drought. Wet conditions during the late winter and spring months reduced the drought area to under one percent by mid-April. The last half of the year had wet and dry periods, which caused the state drought area to oscillate up and down, but overall July-December and even April-December were drier than normal. Various peak drought area percentages included 33.9% in early June, 60.6% in mid-September, and 74.4% in mid-November. The year ended with 19.3% of Hawaii in moderate to extreme drought. Unusual warmth accompanied the drought, with Kahului and Hilo experiencing a record warm year in 2020.
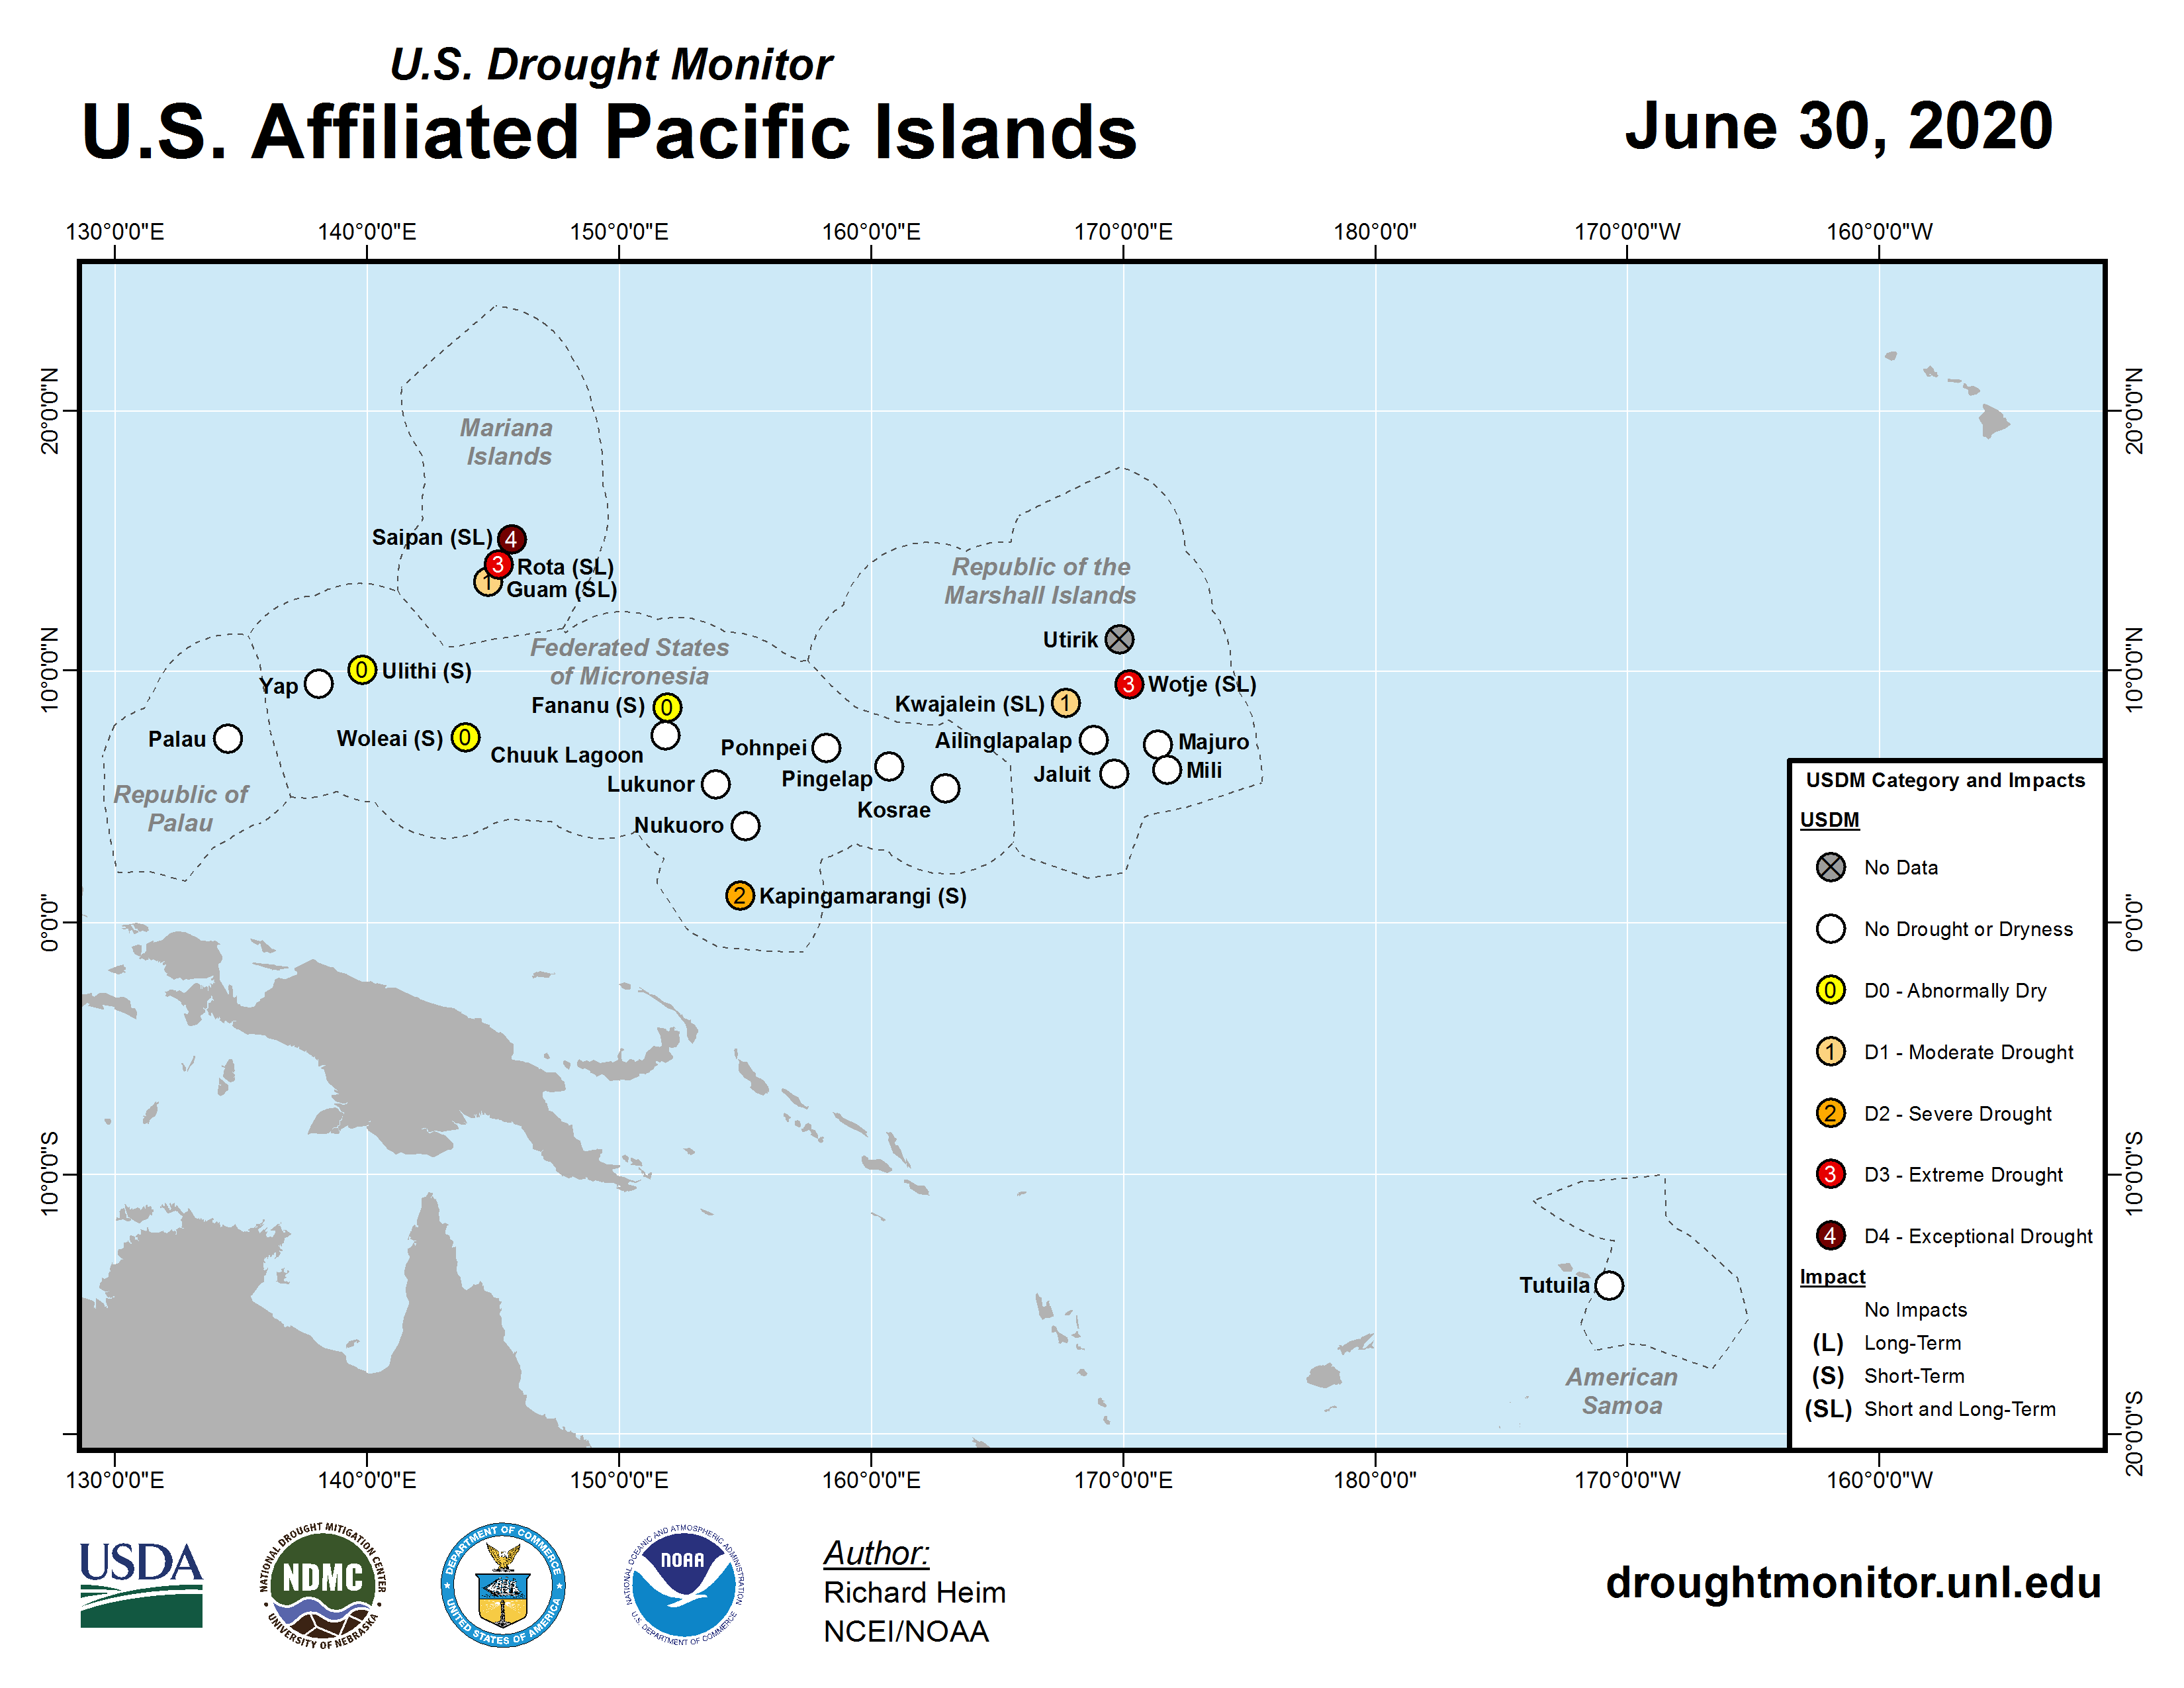
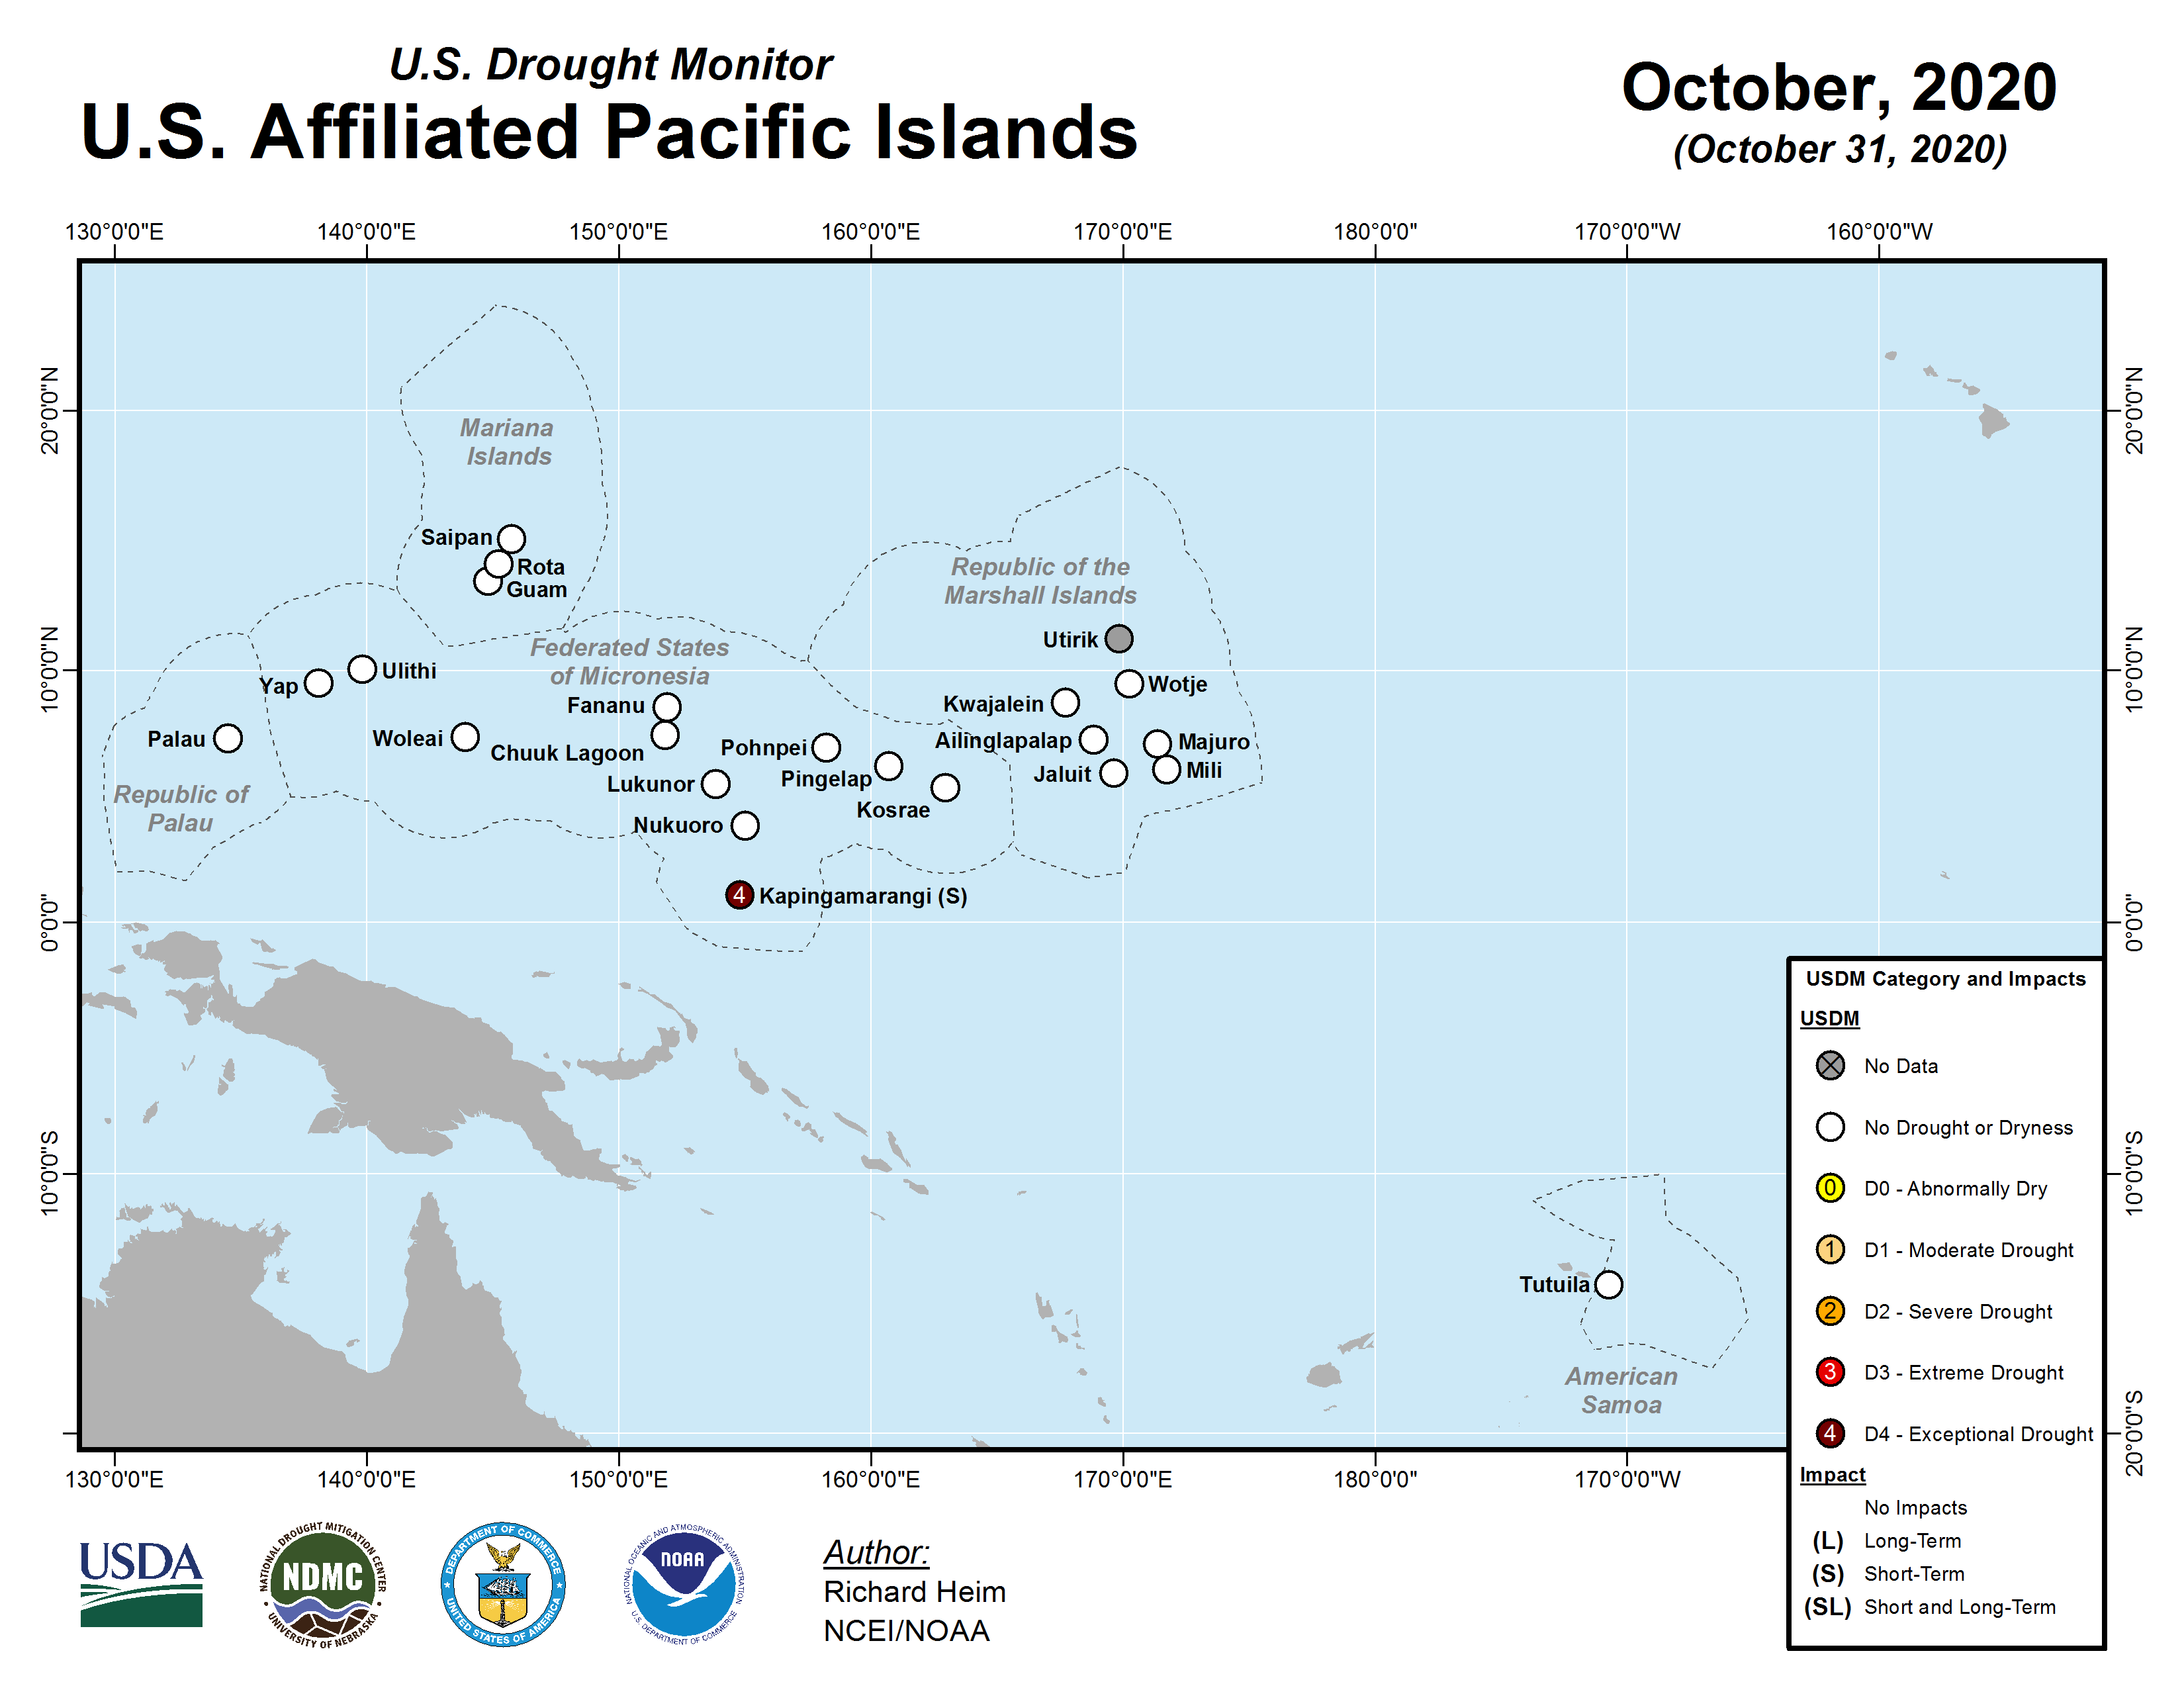
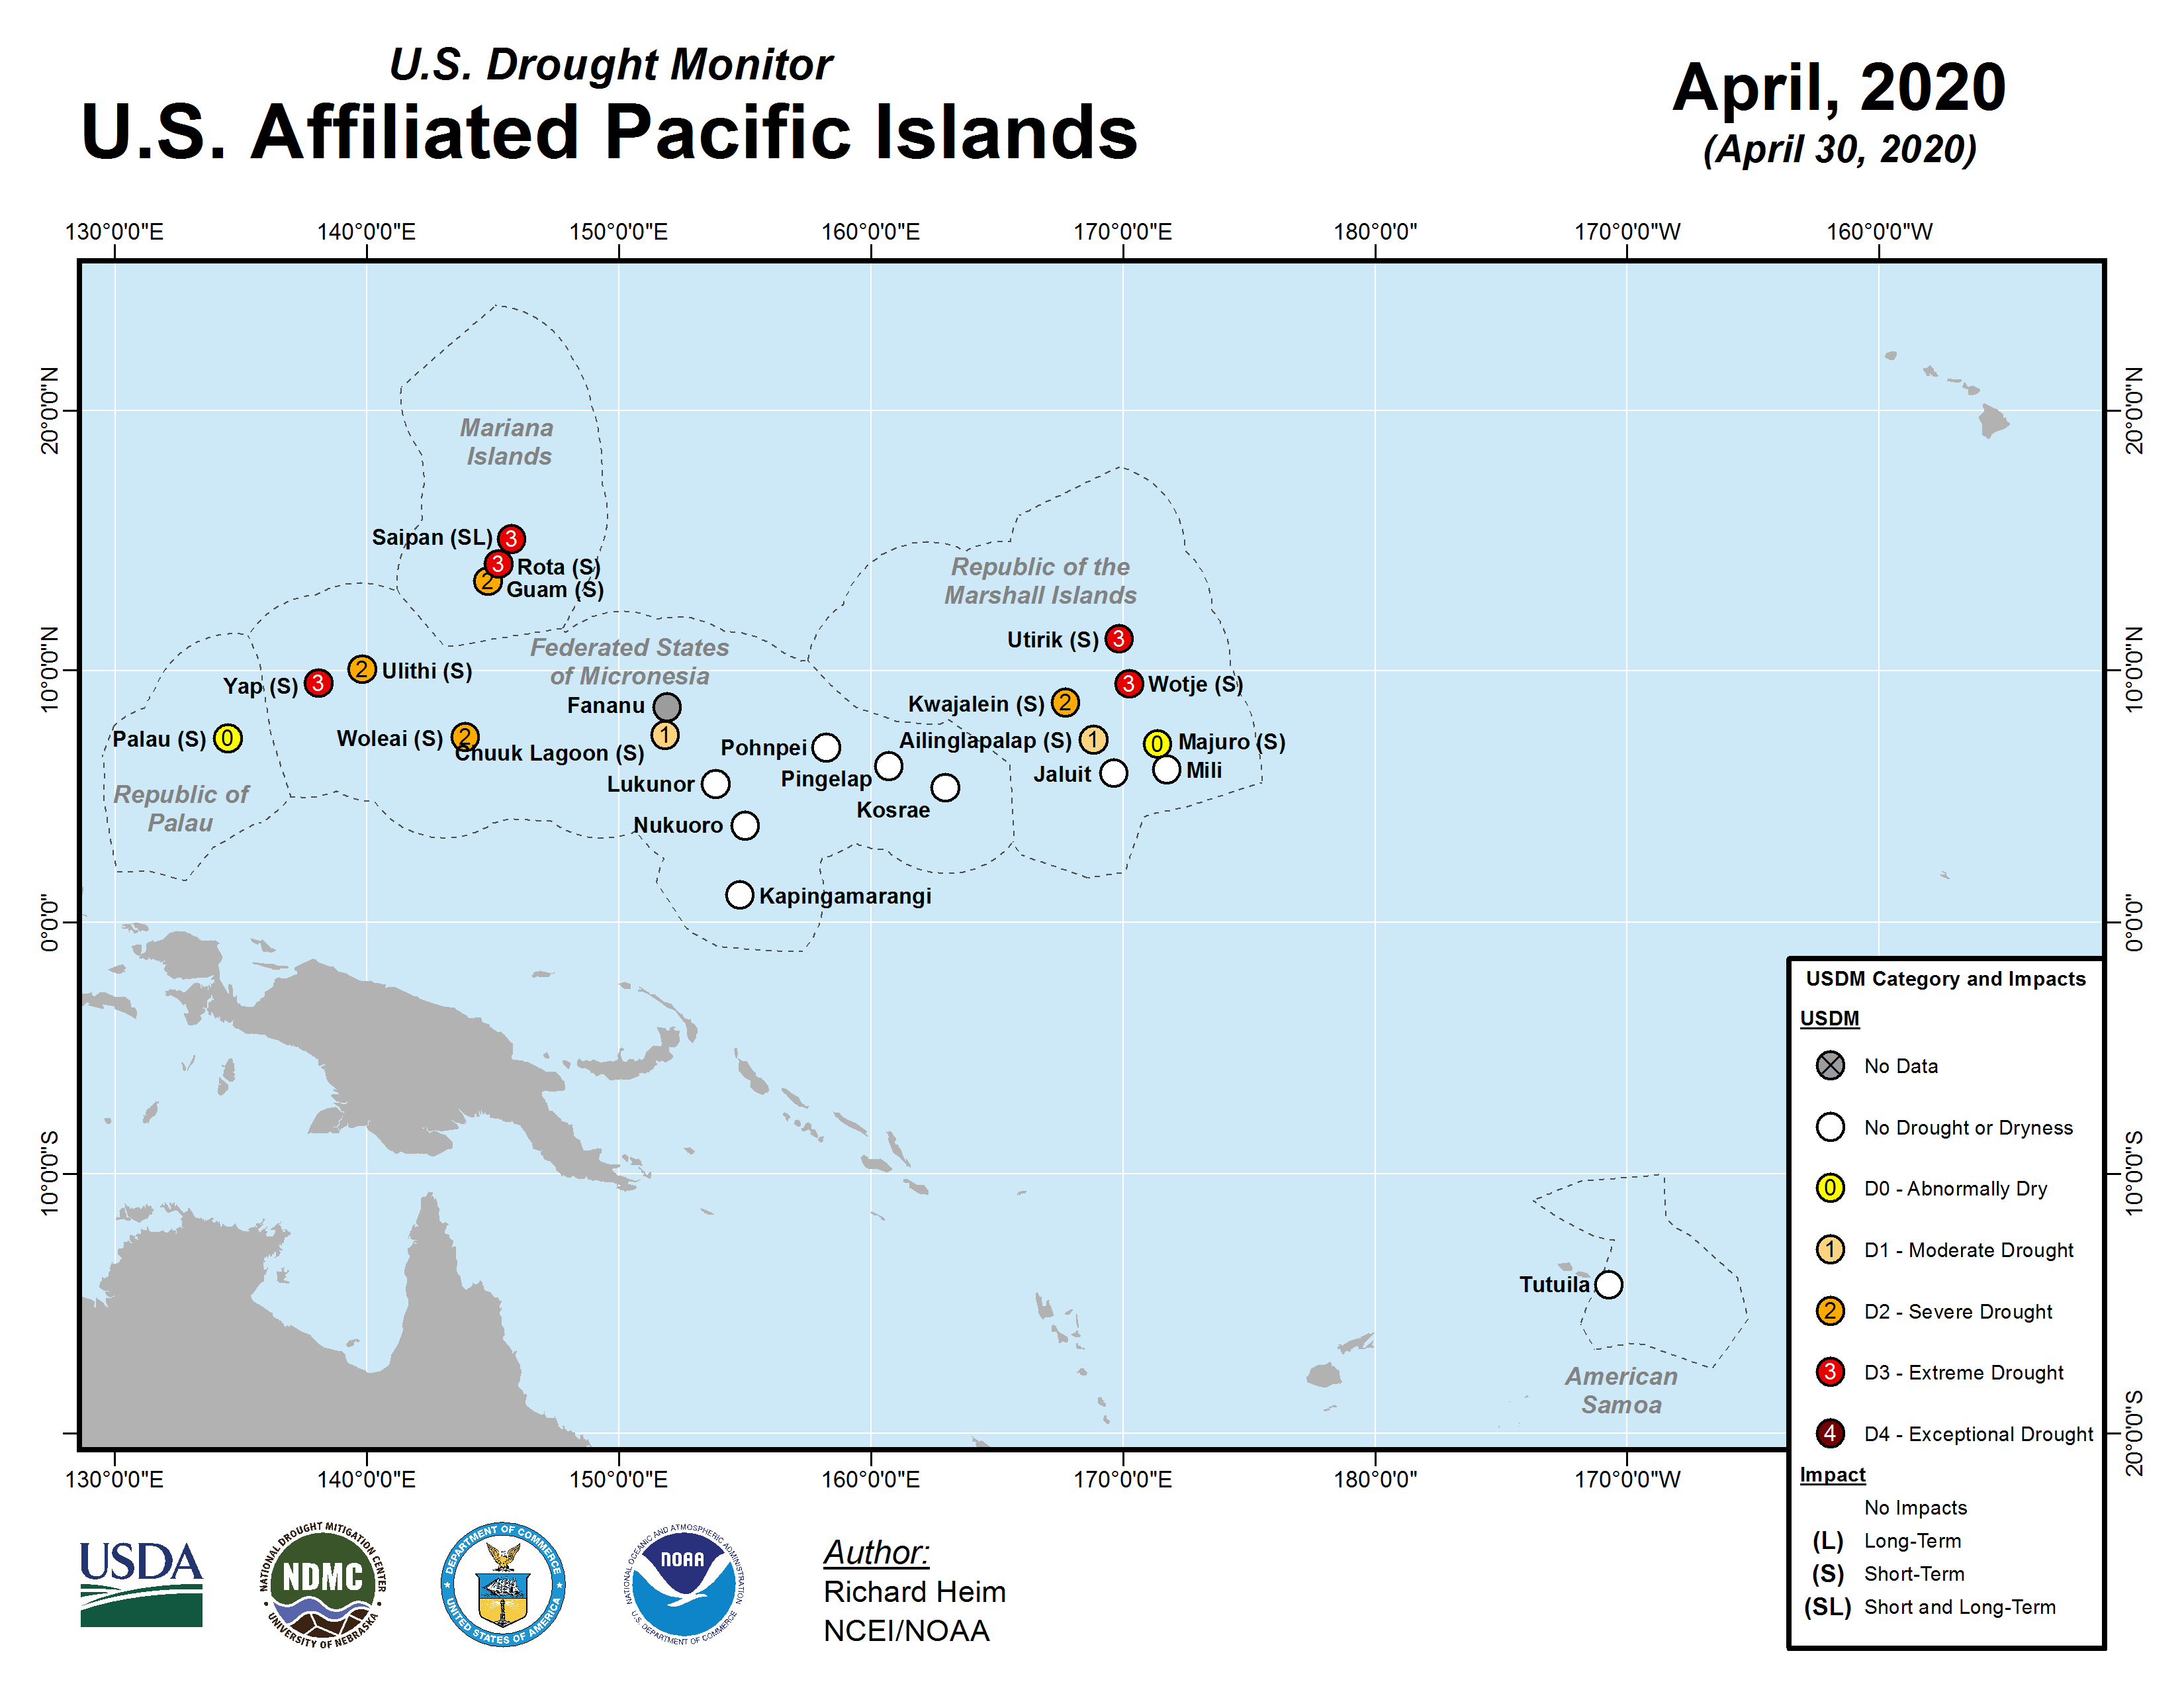
U.S.-Affiliated Pacific Islands:
|
|
In the U.S.-Affiliated Pacific Islands (USAPI), 2020 began with the waning months of an El Niño. Drier-than-normal conditions set in across the western and northern portions of Micronesia and moderate drought developed on some islands during January and February. By March, extreme drought appeared in the east at Wotje in northern portions of the Republic of the Marshall Islands (RMI), and by April extreme drought developed in the northern Marianas at Saipan and in western Yap State with moderate to severe drought across the rest of the northern parts of Micronesia. Conditions improved during May and June in central Micronesia, but worsened in the northern portions with Saipan reaching exceptional drought status in June. Conditions slowly improved in the north with the Marianas exiting drought status by September and the northern Marshalls in October.
Meanwhile, La Niña-like conditions developing across the western Pacific brought dry conditions to southern portions of Micronesia. As conditions were improving in the north, Kapingamarangi (in southern Pohnpei State) was drying out, entering moderate then severe drought status in June, extreme drought status in September, and exceptional drought status in October.
Kapingamarangi had the driest year on record in 2020, as well as the driest time periods from the last five months (August-December) back to the last 12 months. Even though Saipan was wet later in the year, 2020 still ranked as the second driest year on record. Earlier in the year, Lukonor had the fifth driest January-April but driest May 2019-April 2020. Saipan had the driest March-June, April-June, and May-June while Kapingamarangi ranked second driest for May-June. Pohnpei ranked driest in their 69-year record for June-July and Saipan second driest for January-July. Kwajalein had the driest August in their 69-year record while Jaluit ranked second driest in 37 years and Ailinglaplap third driest in 36 years. Nukuoro ranked driest in their 37-year record for July-September and Yap second driest in 70 years for July-September. Ulithi ranked second driest for June-October.
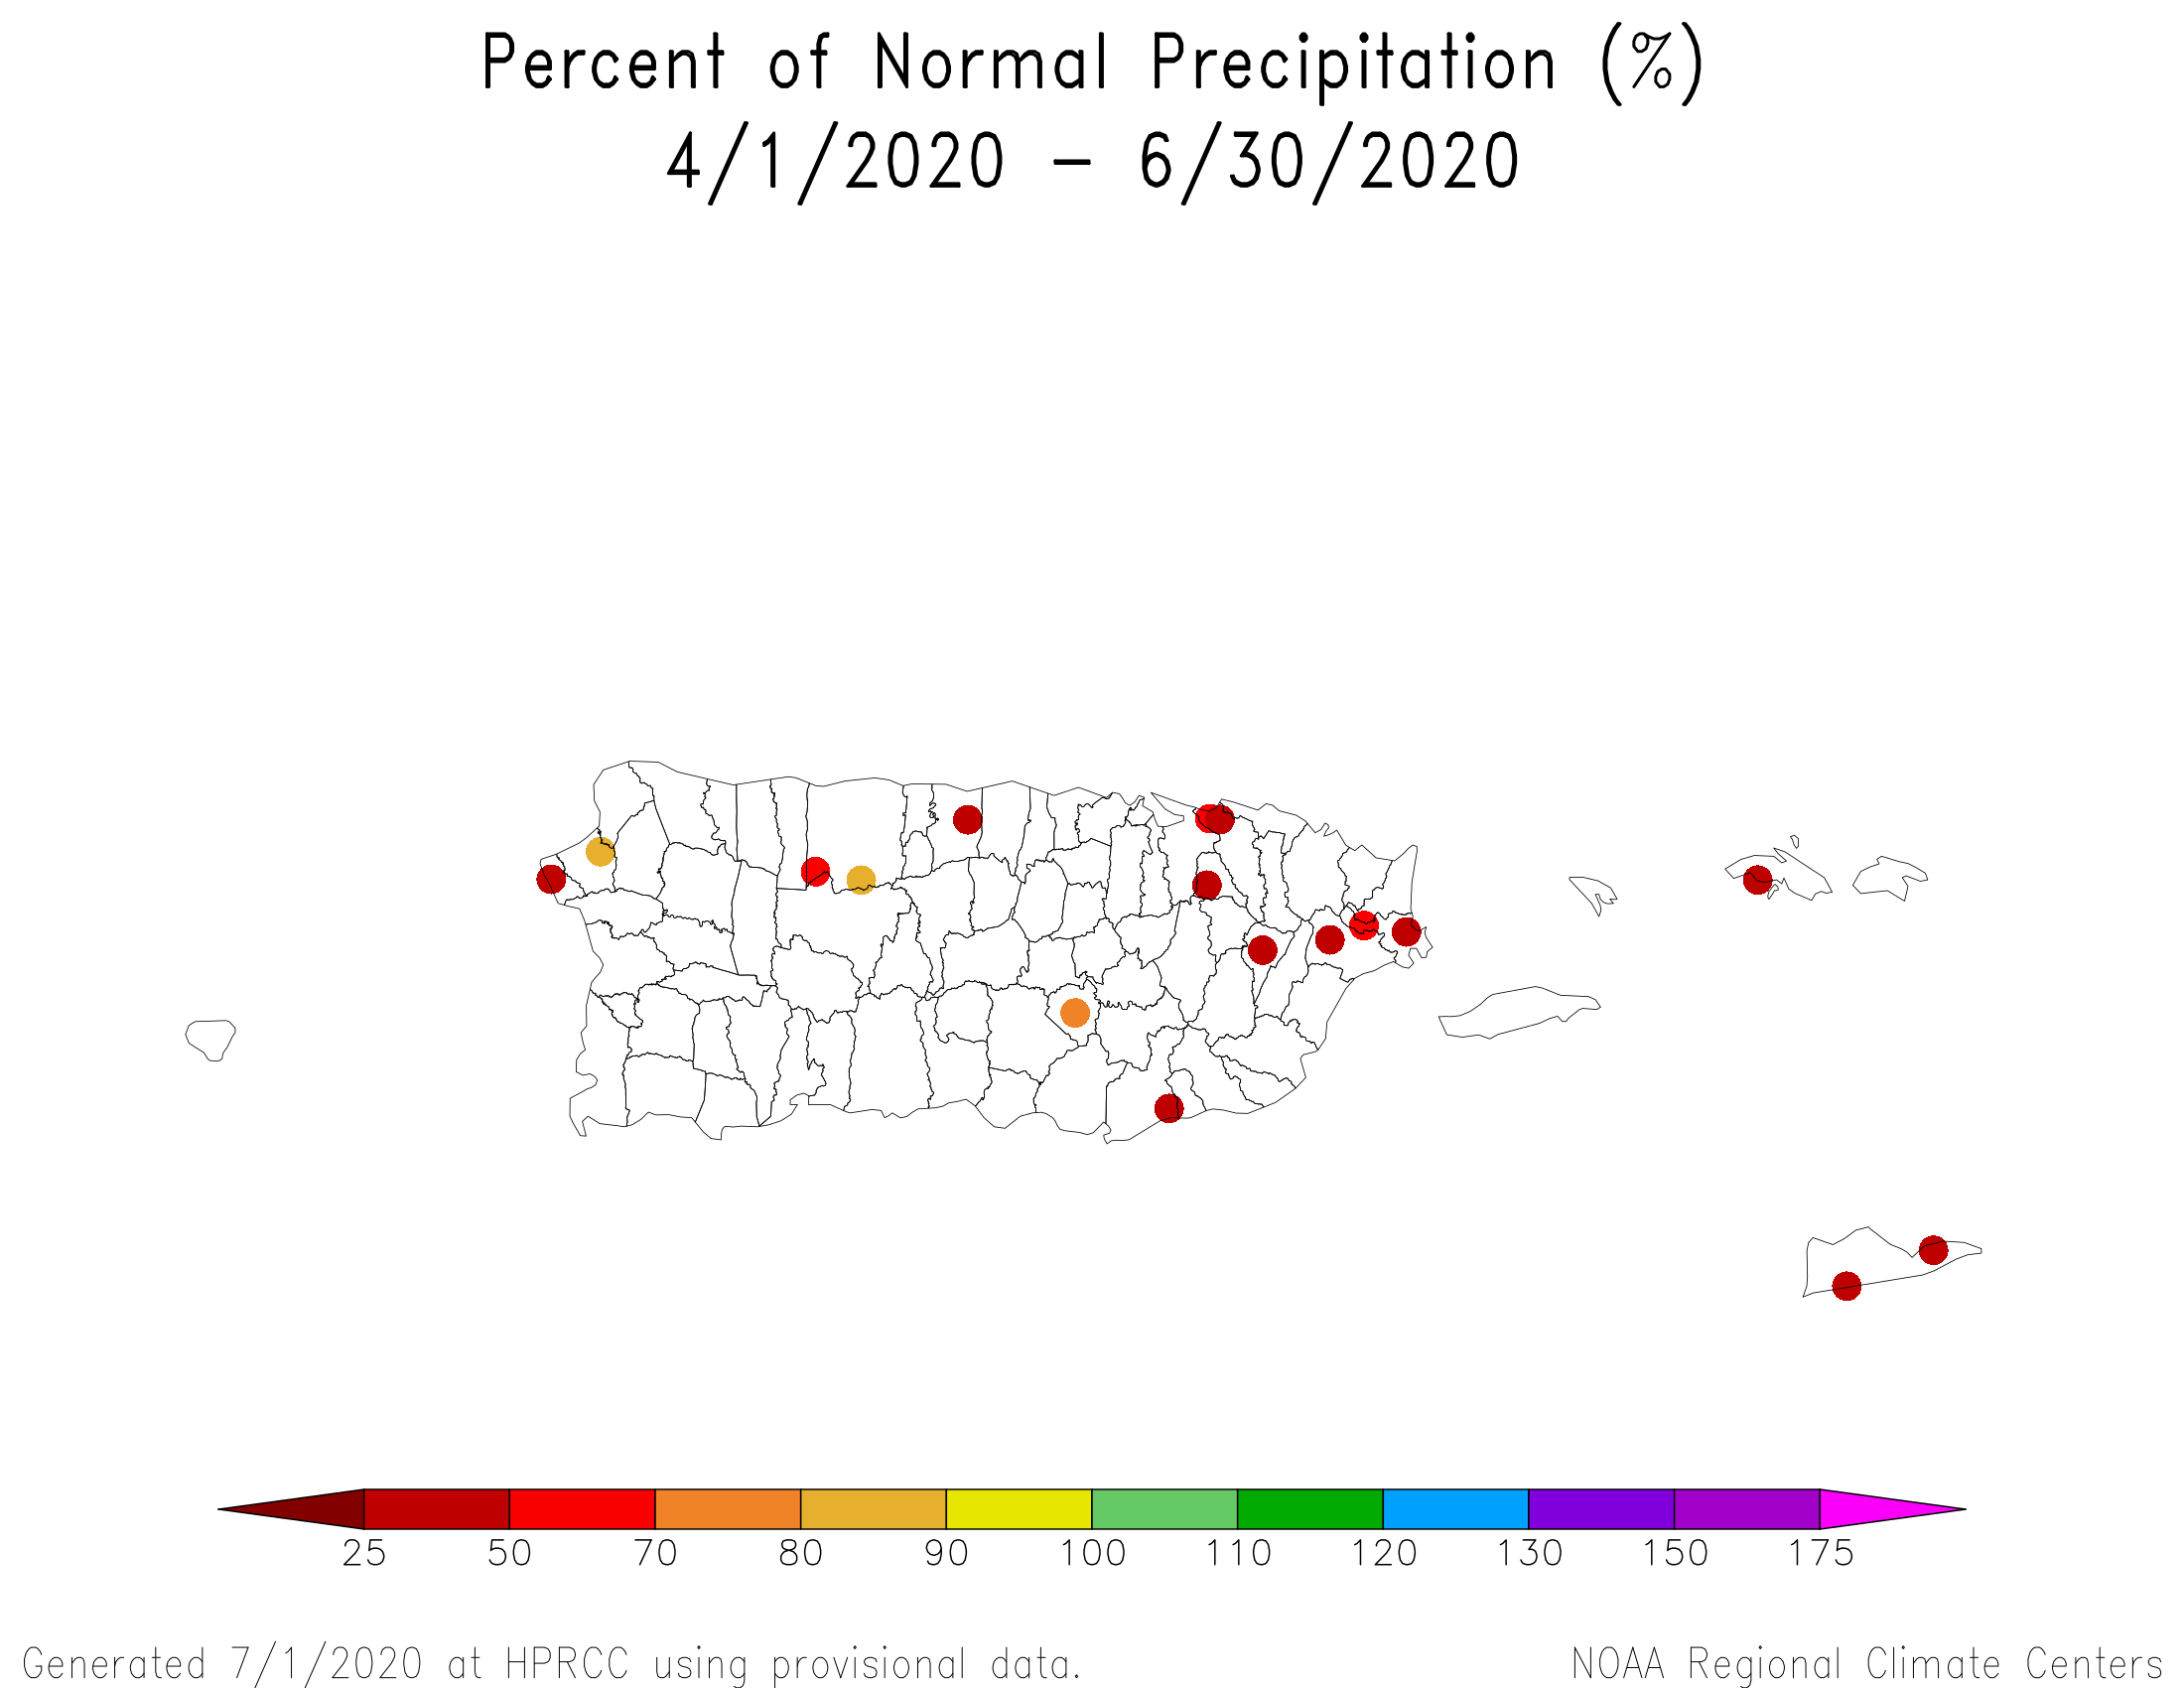
Puerto Rico and U.S. Virgin Islands:
|
|
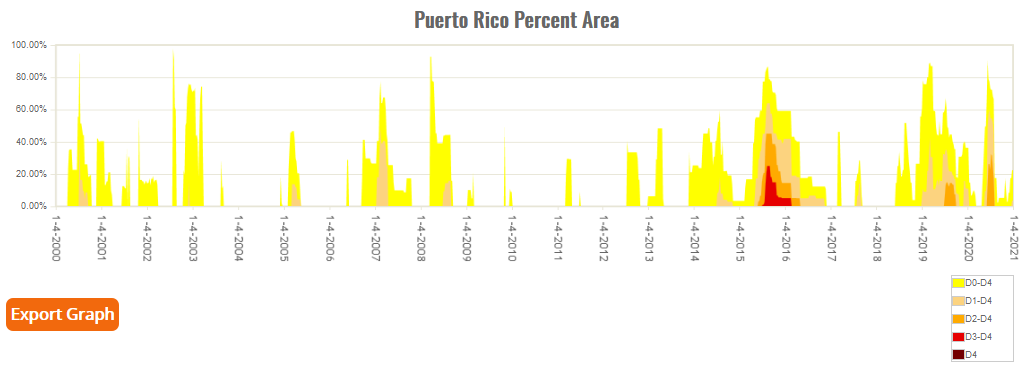
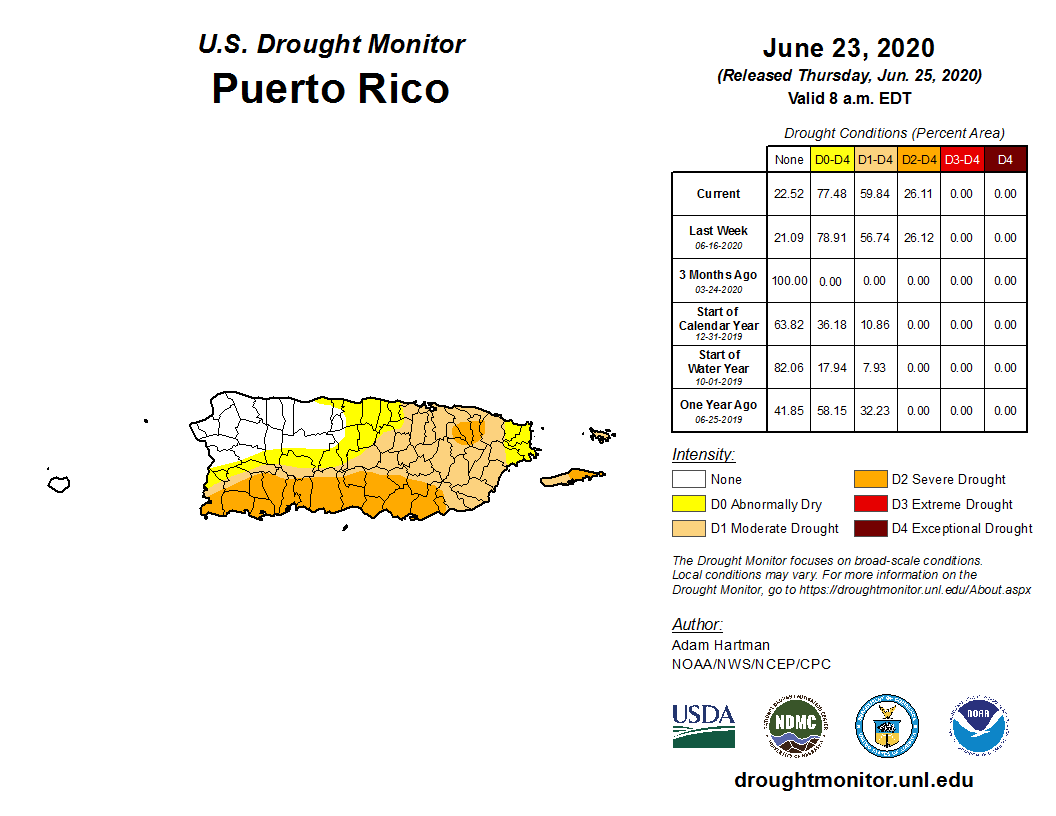
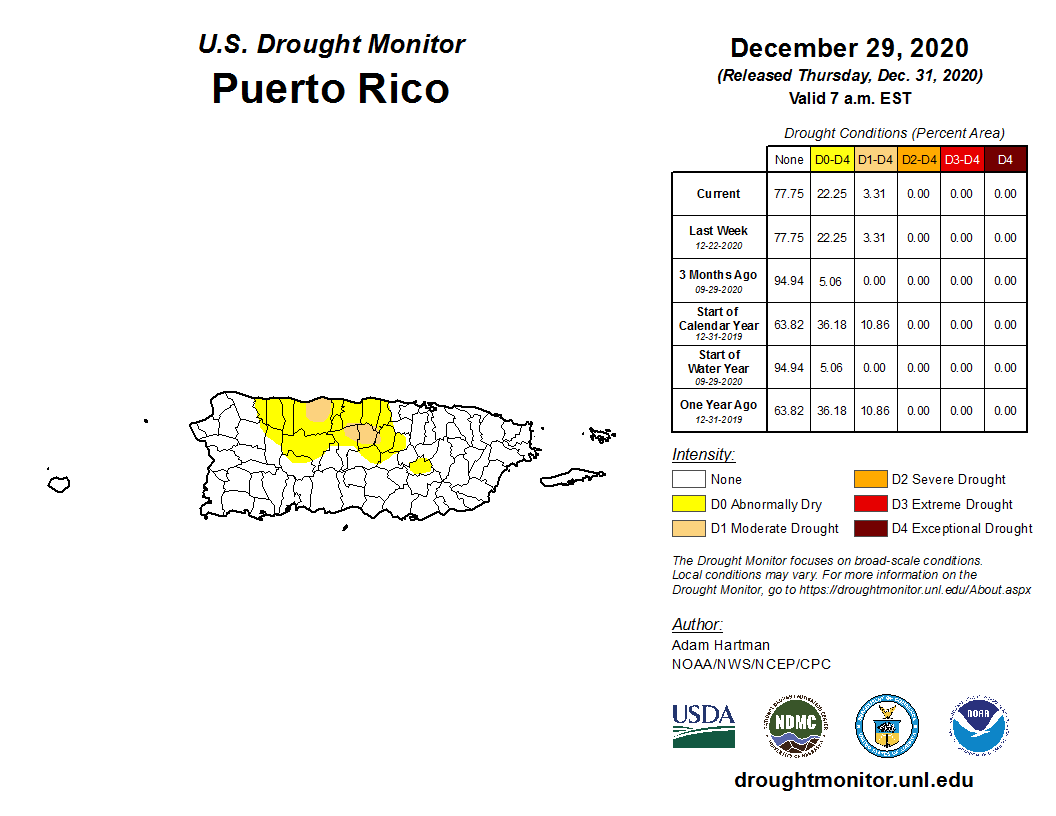
Puerto Rico was drought-free during the first half of 2020. A very dry April-June brought drought back in May, with the peak area rapidly reaching 59.8% of Puerto Rico on June 23. Heavy rains at the end of July from Tropical Storm (later Hurricane) Isaias ended drought on the island by August. A few spots of moderate drought returned at the end of the year, bringing Puerto Rico's drought area up to 3.3%.
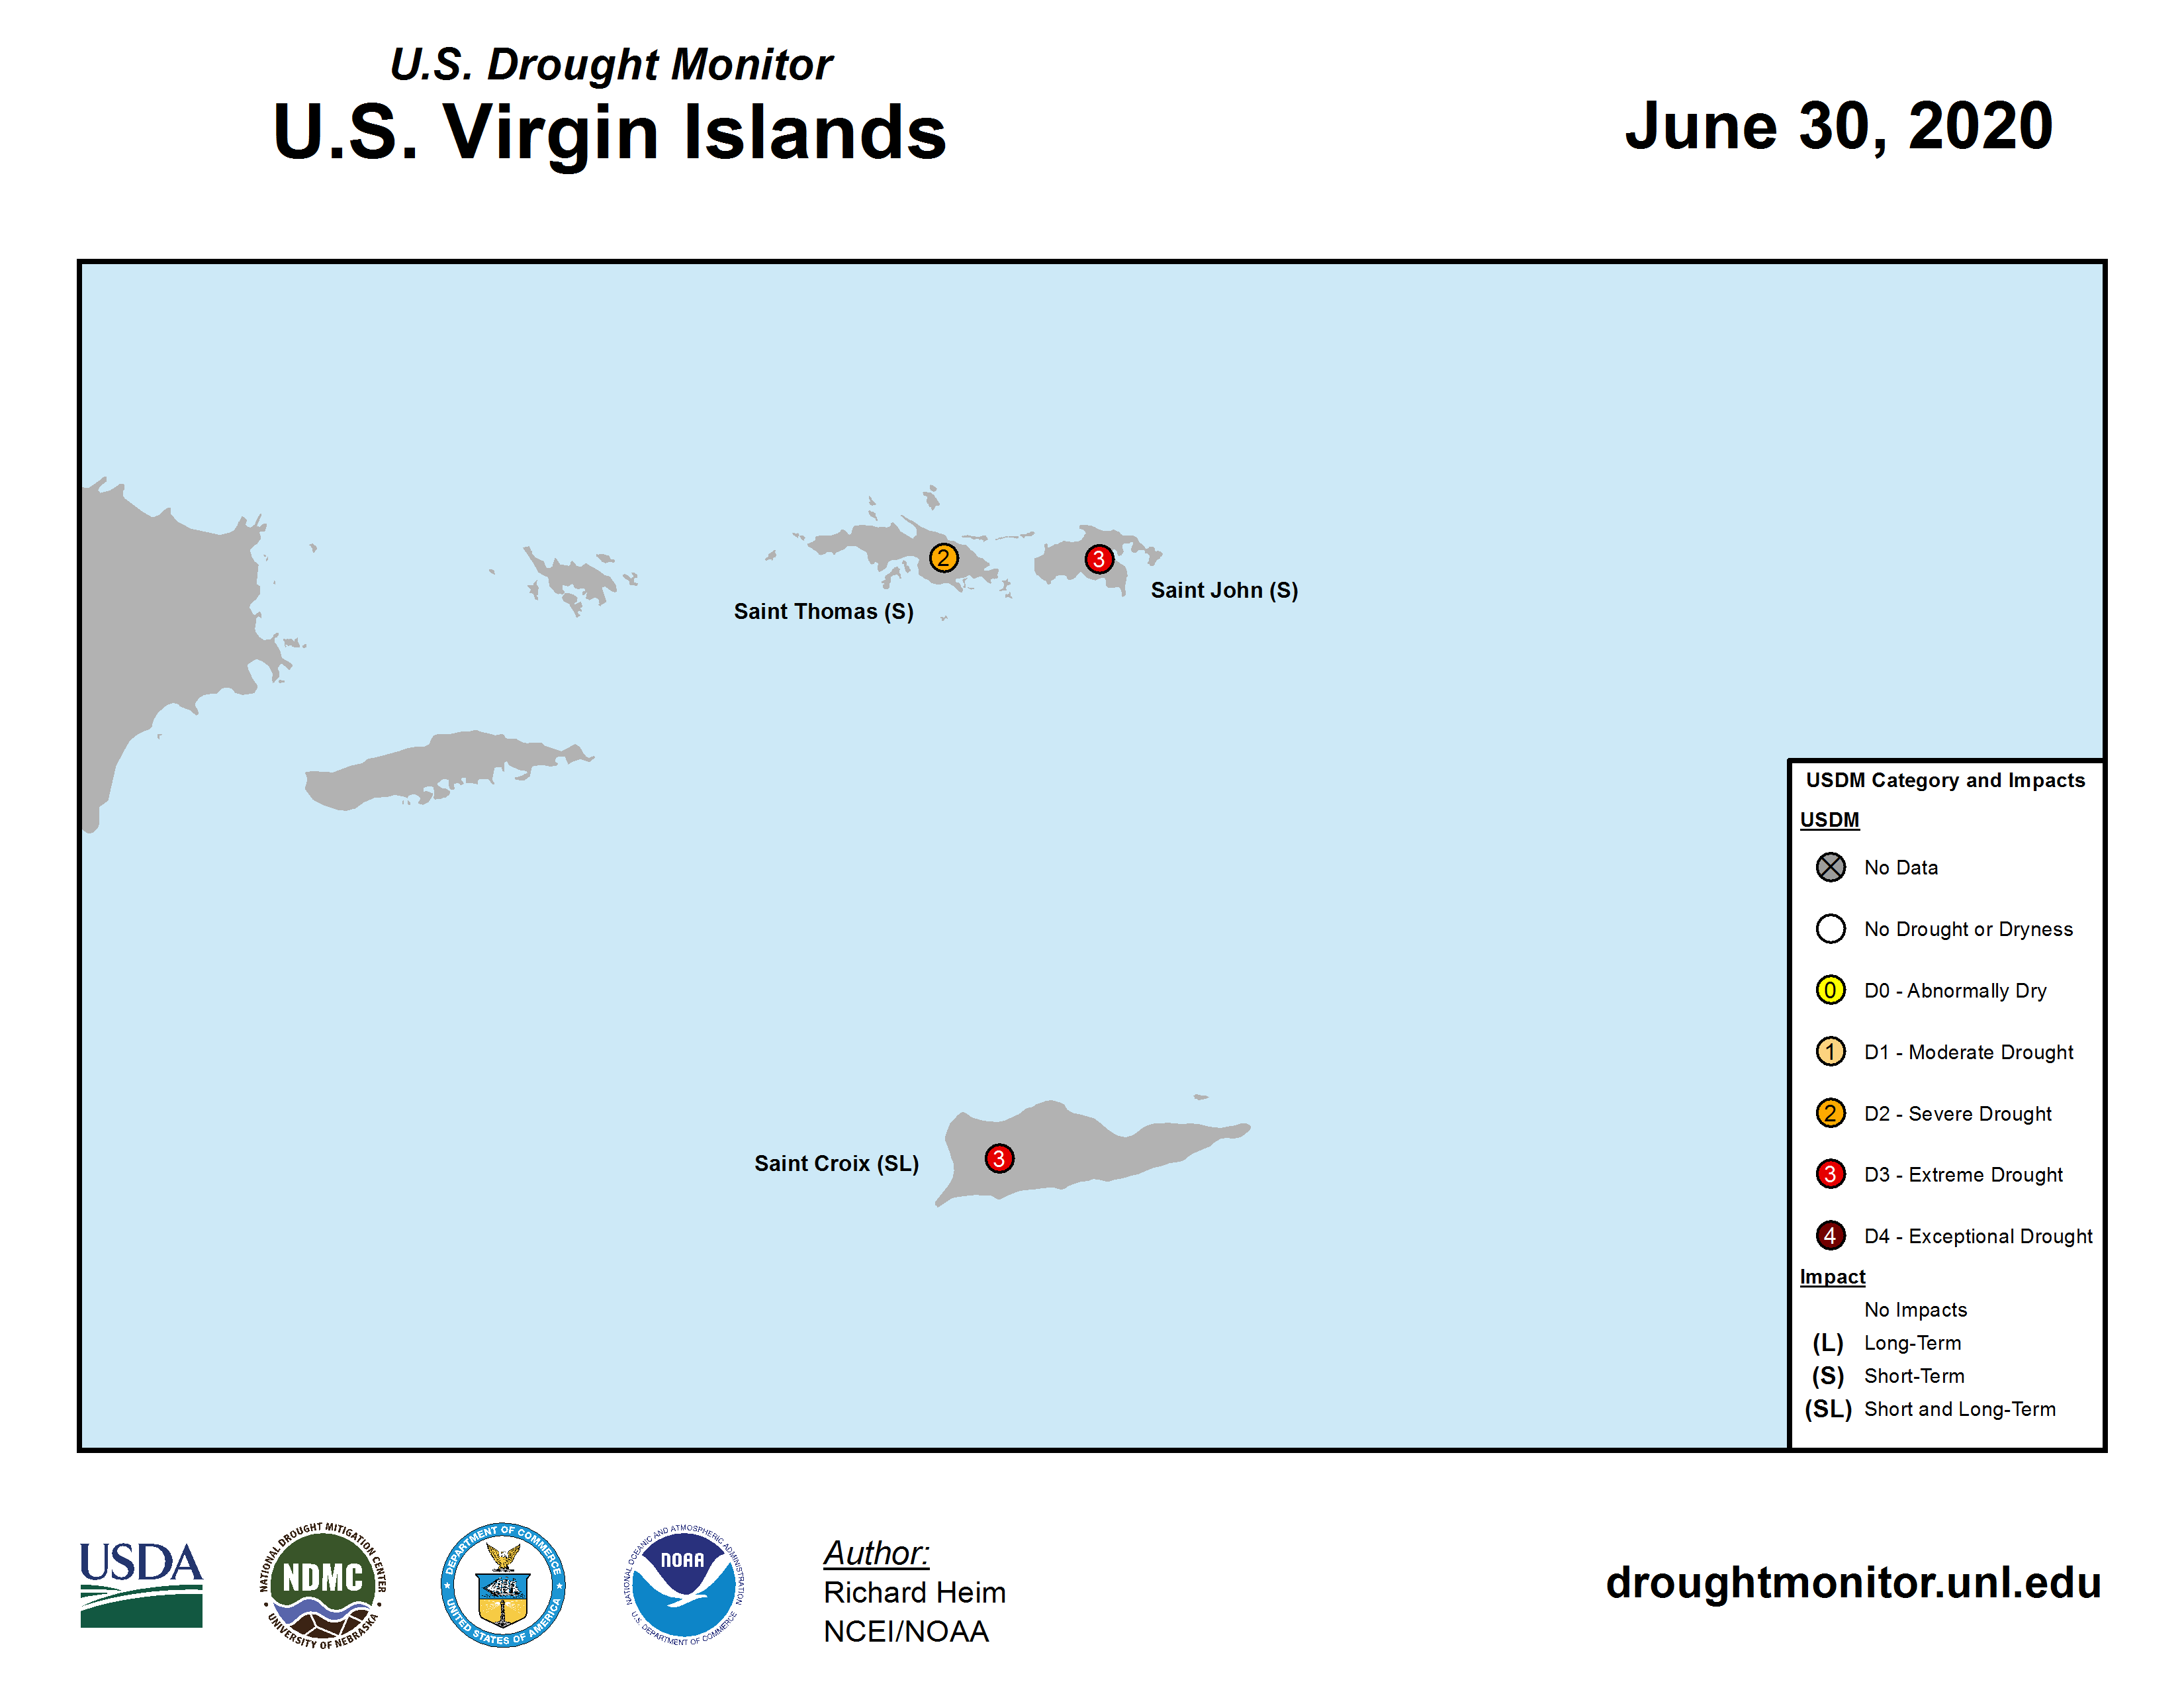
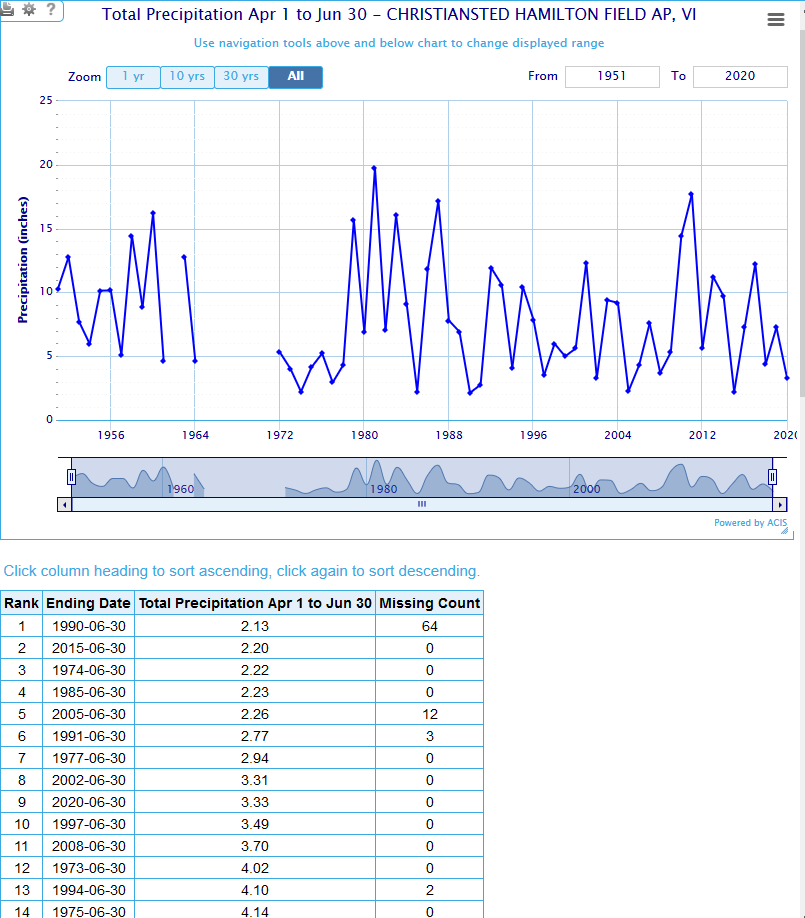
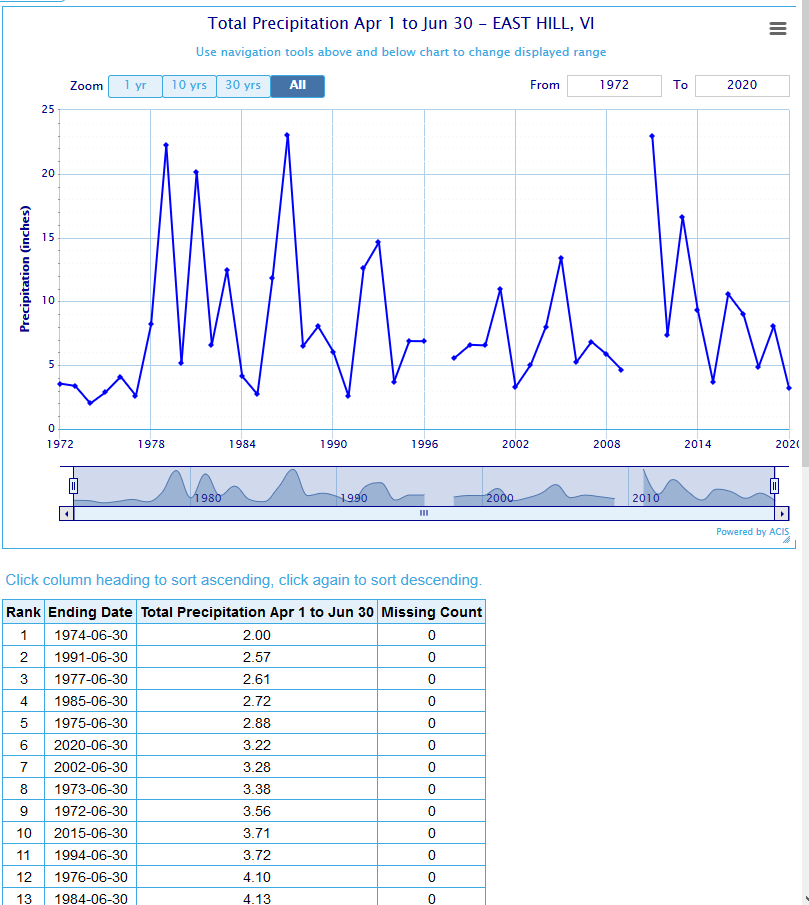
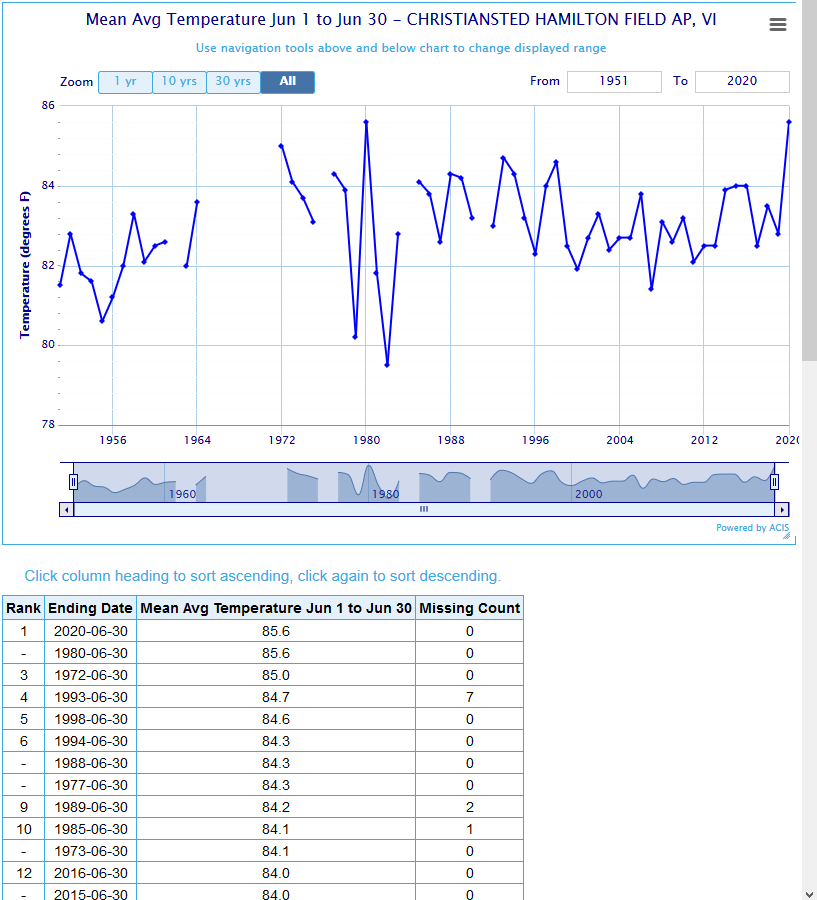
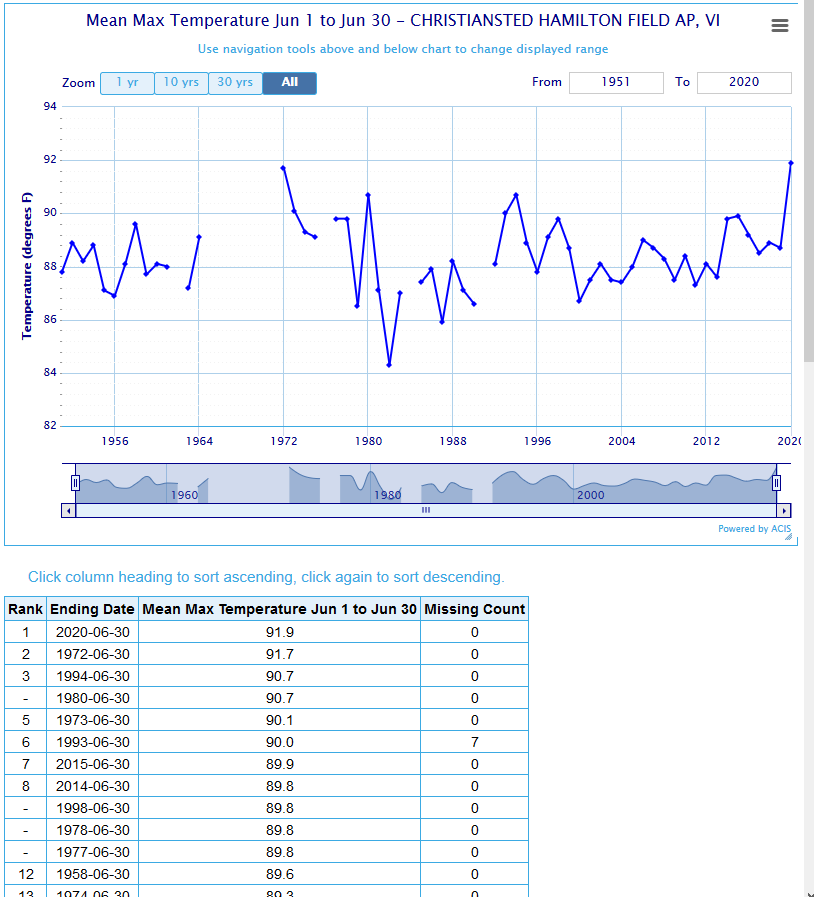
In the U.S. Virgin Islands (USVI), the year began with moderate drought on St. Croix. By the end of March, it was gone. But a very dry April-June, coupled with unusually warm temperatures, heralded the return of drought to the USVI. Hamilton Airport, St. Croix, had the ninth driest April-June and East Hill, St. Croix, ranked sixth driest. June 2020 temperatures at Hamilton Airport tied with June 1980 as the warmest June on record (based on mean temperature) and set a new record when just maximum temperatures are examined. By the end of May, severe drought had returned to all three islands, and by the end of June, extreme drought was on St. John and St. Croix with severe drought on St. Thomas. The rains from Isaias eased drought conditions, bringing the USDM status down to moderate drought on St. John and St. Croix and only abnormal dryness on St. Thomas by the end of July. Drought ended on all three islands by the end of August.
[top]
Contacts & Questions