Contents Of This Report:
|
|
Please note that the values presented in this report are based on preliminary data. They will change when the final data are processed, but will not be replaced on these pages.
National Drought Overview
|
|
[top]
Detailed Drought Discussion
Overview
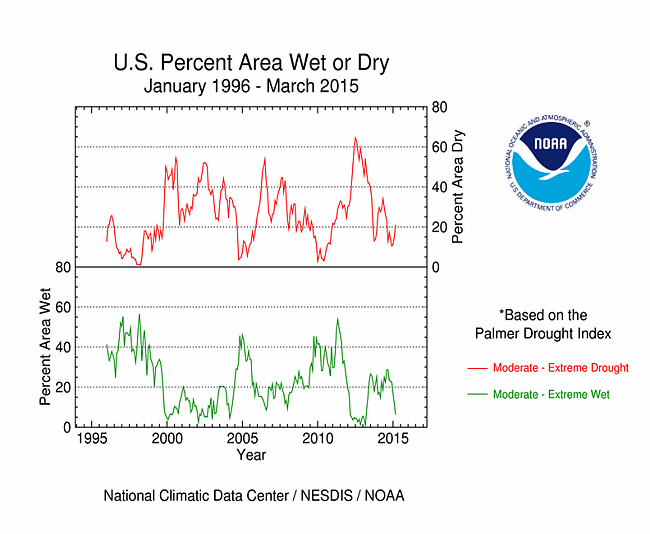
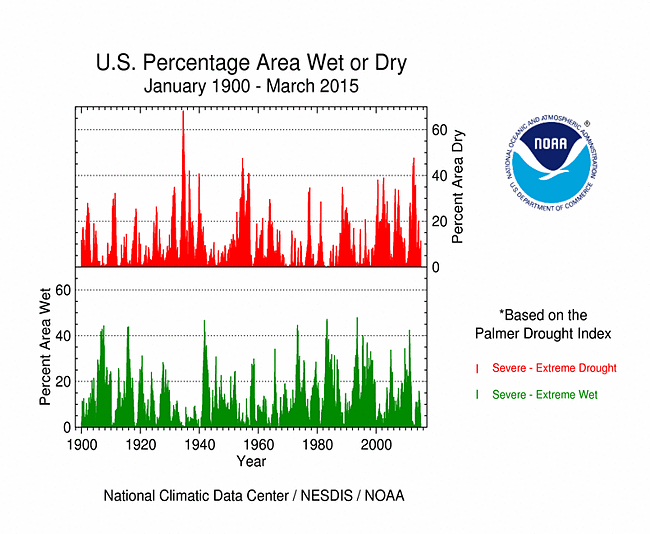
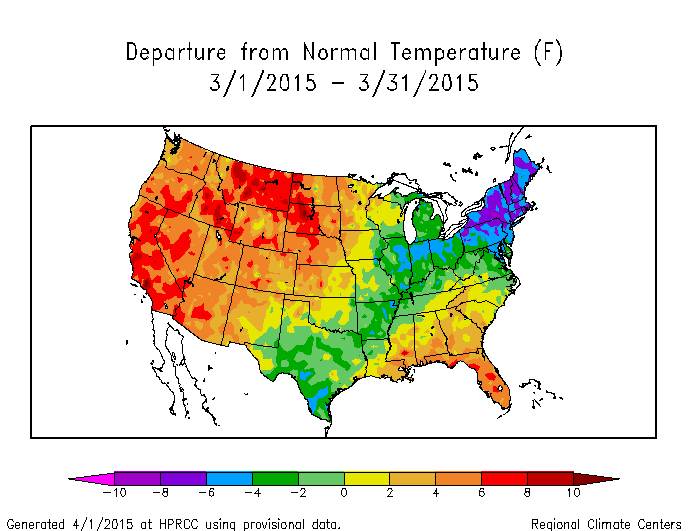
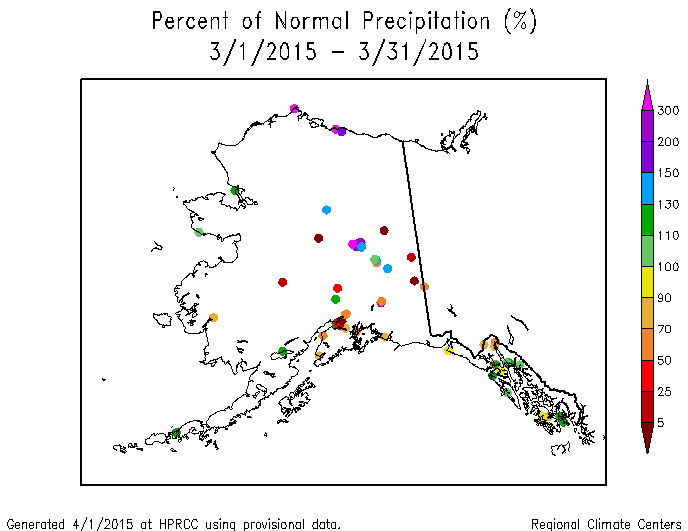
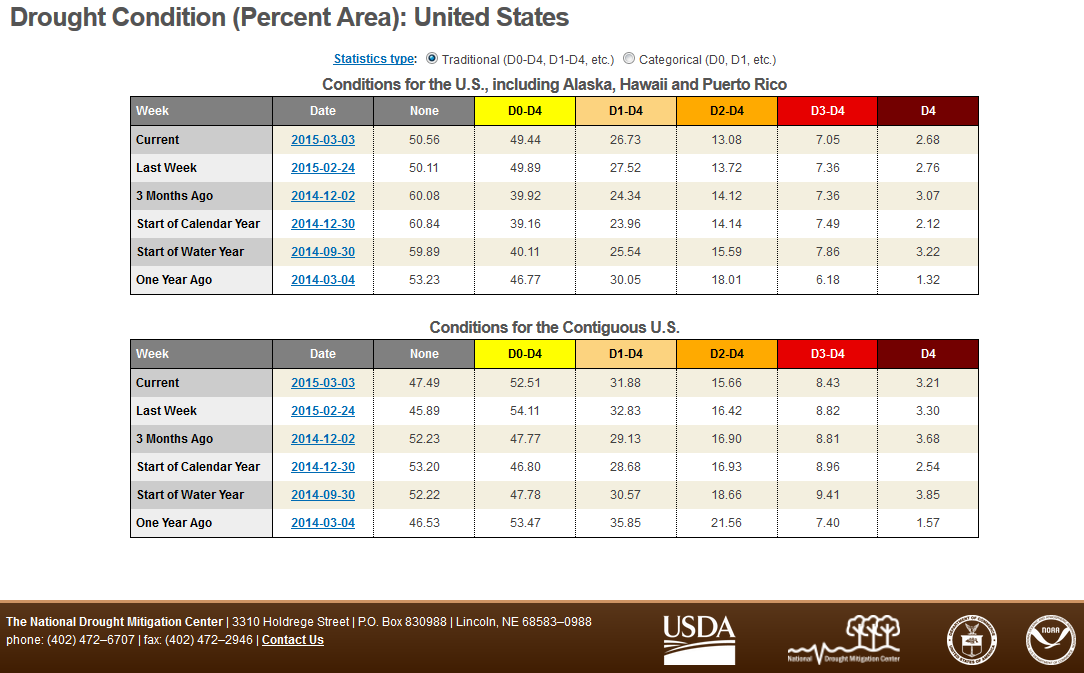
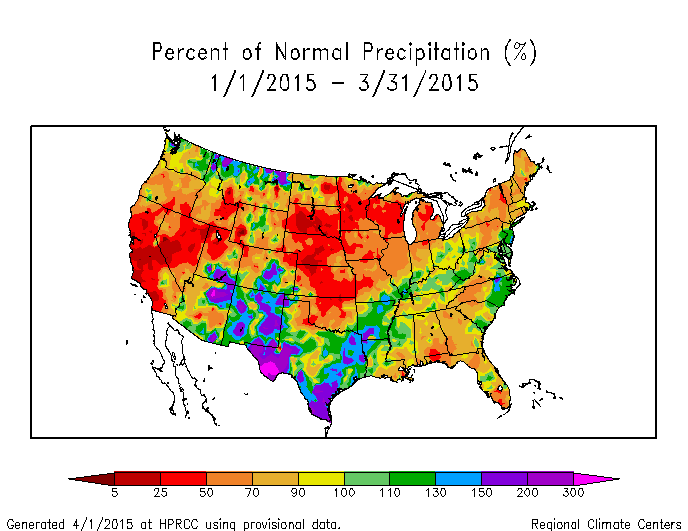
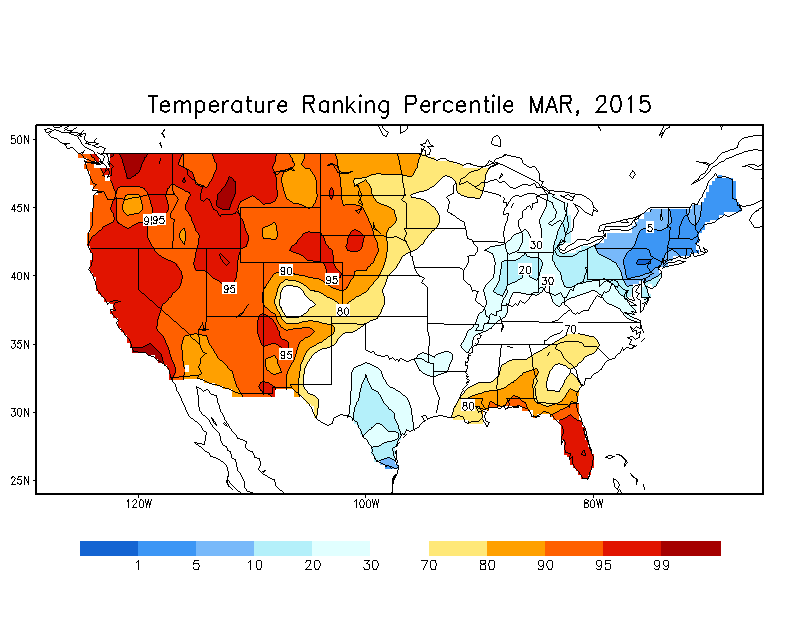
March 2015 was dominated by an upper-level circulation pattern that consisted of a long-wave ridge over the western CONUS and a long-wave trough over the East. This ridge/trough pattern was moderated as short-wave troughs and low pressure centers migrated through the flow and as the jet stream retreated to the north. The ridge deflected many Pacific weather systems and generally inhibited precipitation over the West, resulting in large areas with below-normal precipitation. A northerly flow aloft funneled cool and dry Canadian air masses into the central CONUS. Later in the month, the western ridge intruded into the Plains States. This combination inhibited precipitation from the Central and Northern Plains into the Upper Midwest. As a result, drought and abnormally dry conditions intensified and expanded in the West, Central to Northern Plains, and Upper Midwest. Cold fronts and low pressure systems generated above-normal precipitation along a storm track from Texas to the Central Appalachians, improving drought conditions. The Bermuda High contributed to warmer- and drier-than-normal weather over the Southeast, where drought and abnormal dryness expanded. March was drier than normal across much of Alaska and the Hawaiian Islands, but drought contracted in Hawaii where above-normal precipitation fell. When integrated across the CONUS, March 2015 ranked as the 19th driest March in the 1895-2015 record. On balance, the national drought footprint expanded when compared to last month, increasing from 26.7 percent of the U.S. as a whole to about 30.8 percent of the U.S. in moderate to exceptional drought, according to USDM statistics. According to the Palmer Drought Index, which goes back to the beginning of the 20th century, about 21.0 percent of the CONUS was in moderate to extreme drought at the end of March, an increase of about 6.1 percent compared to last month.

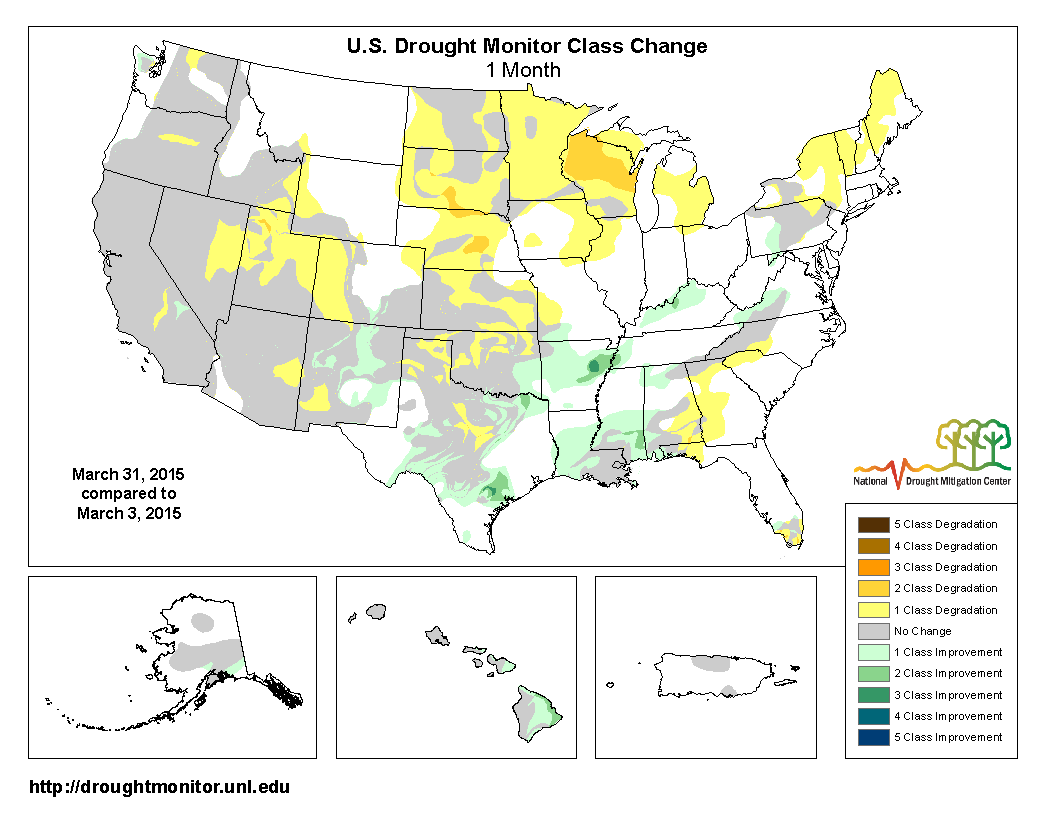
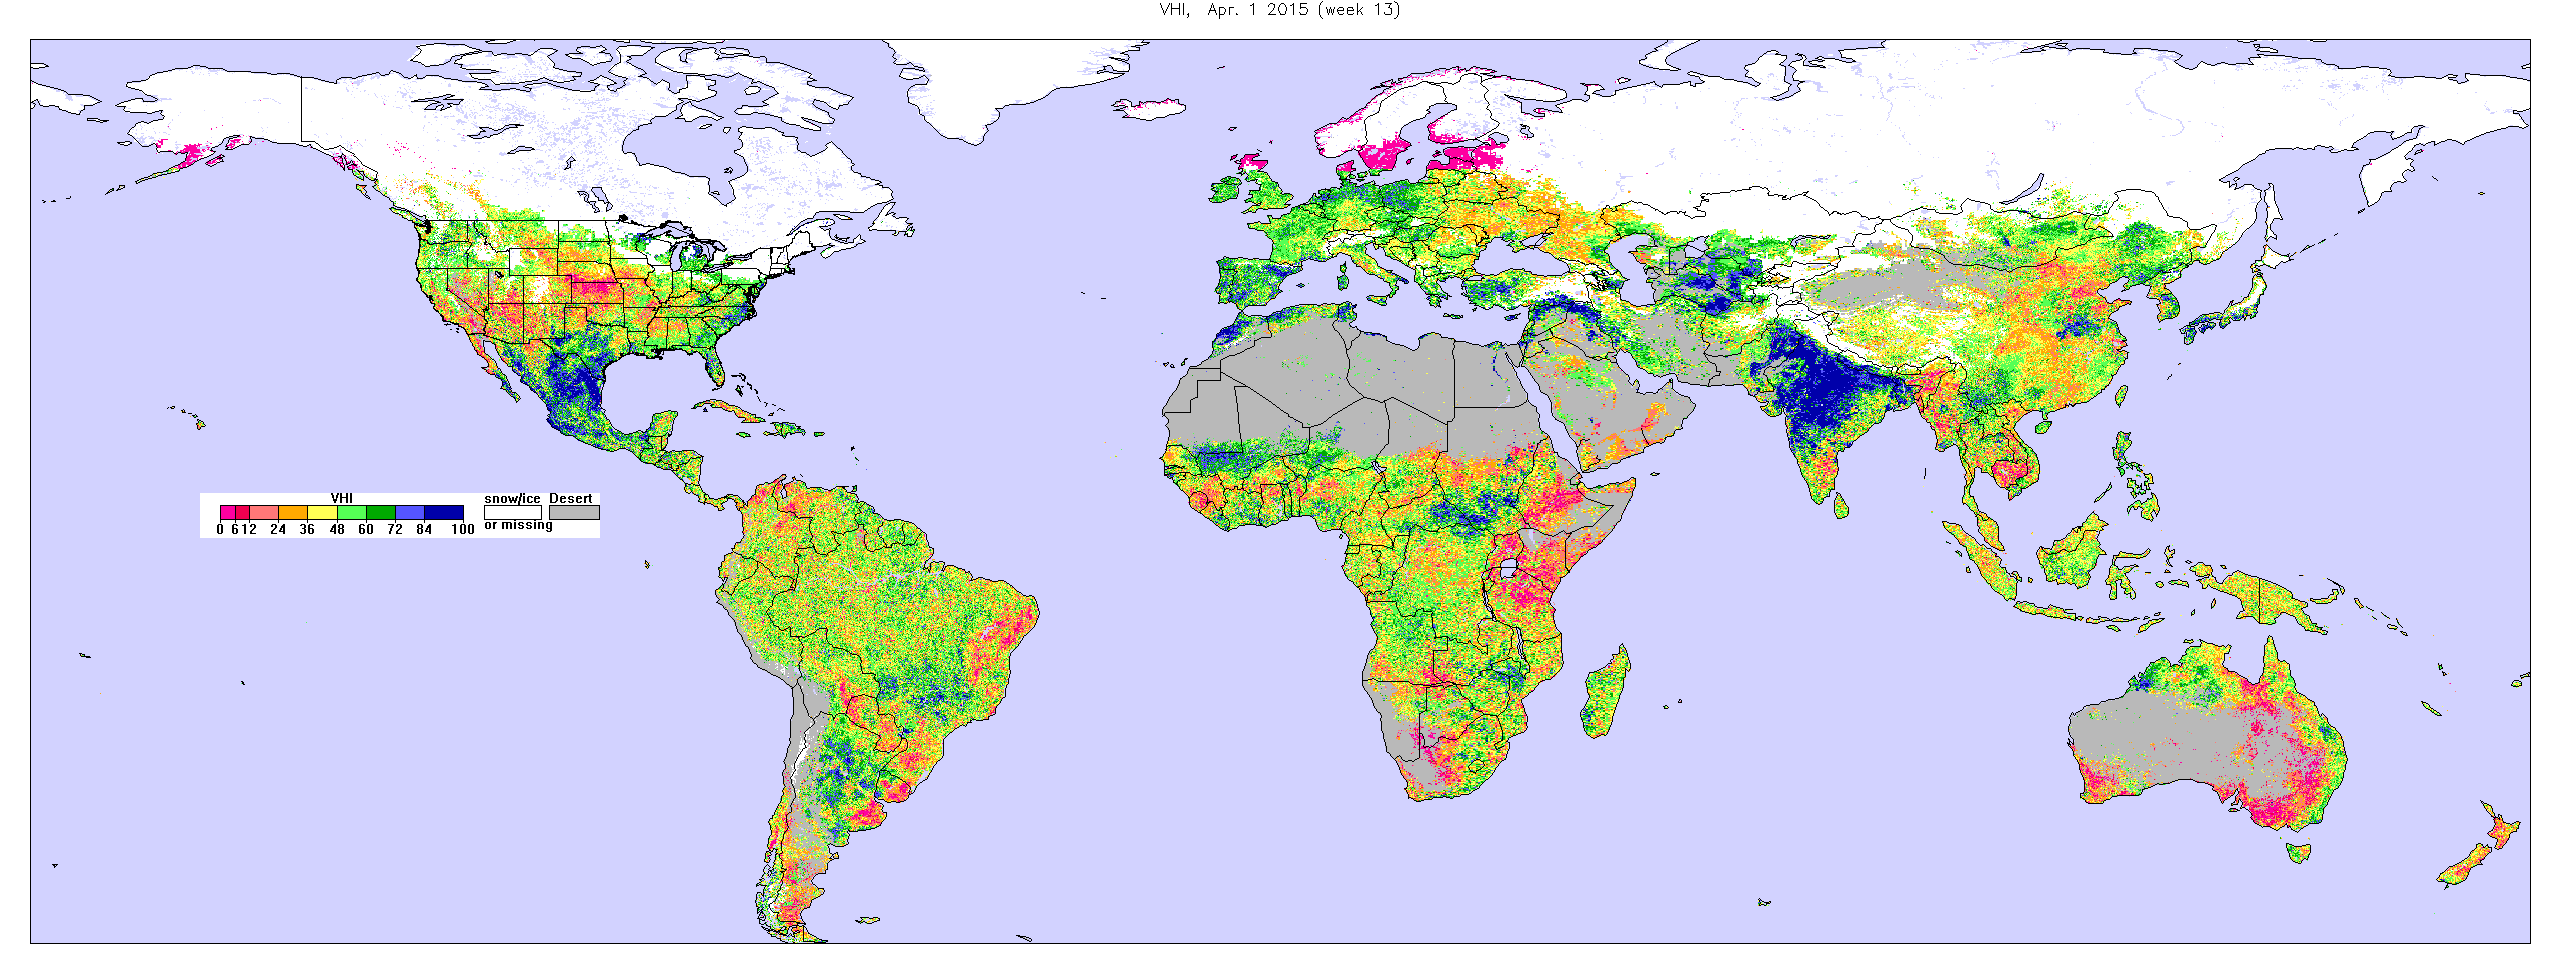
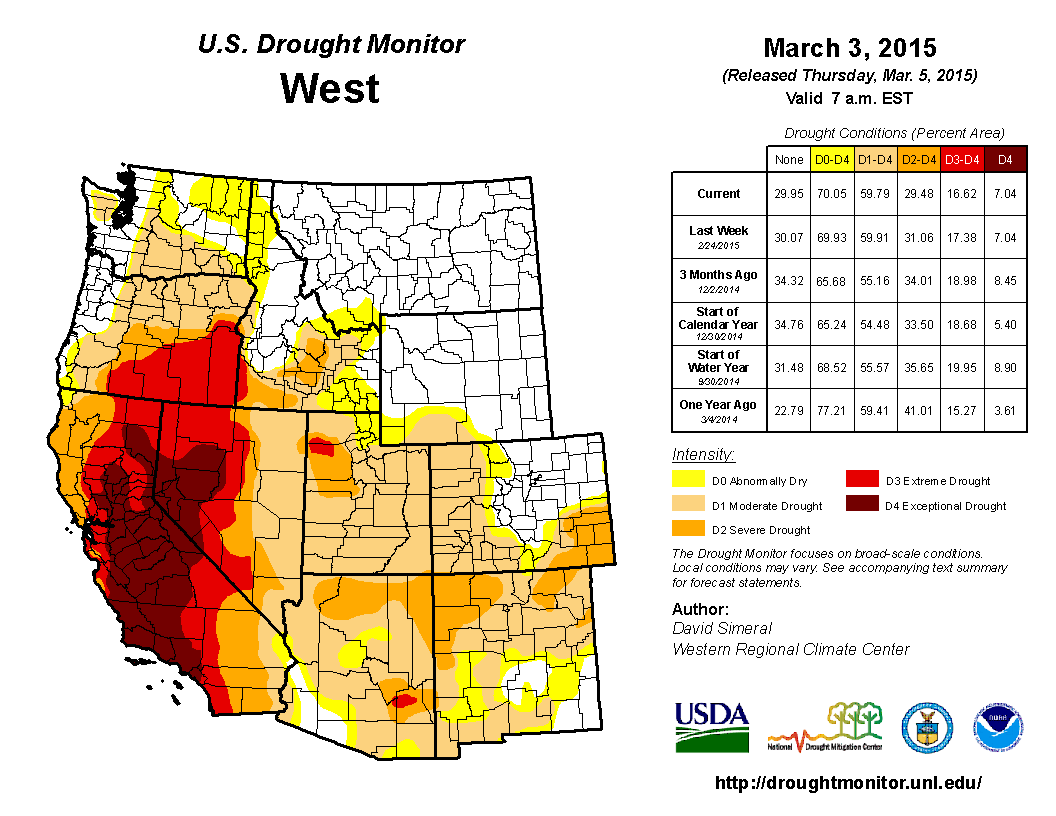
The U.S. Drought Monitor drought map valid March 31, 2015.
By the end of the month:
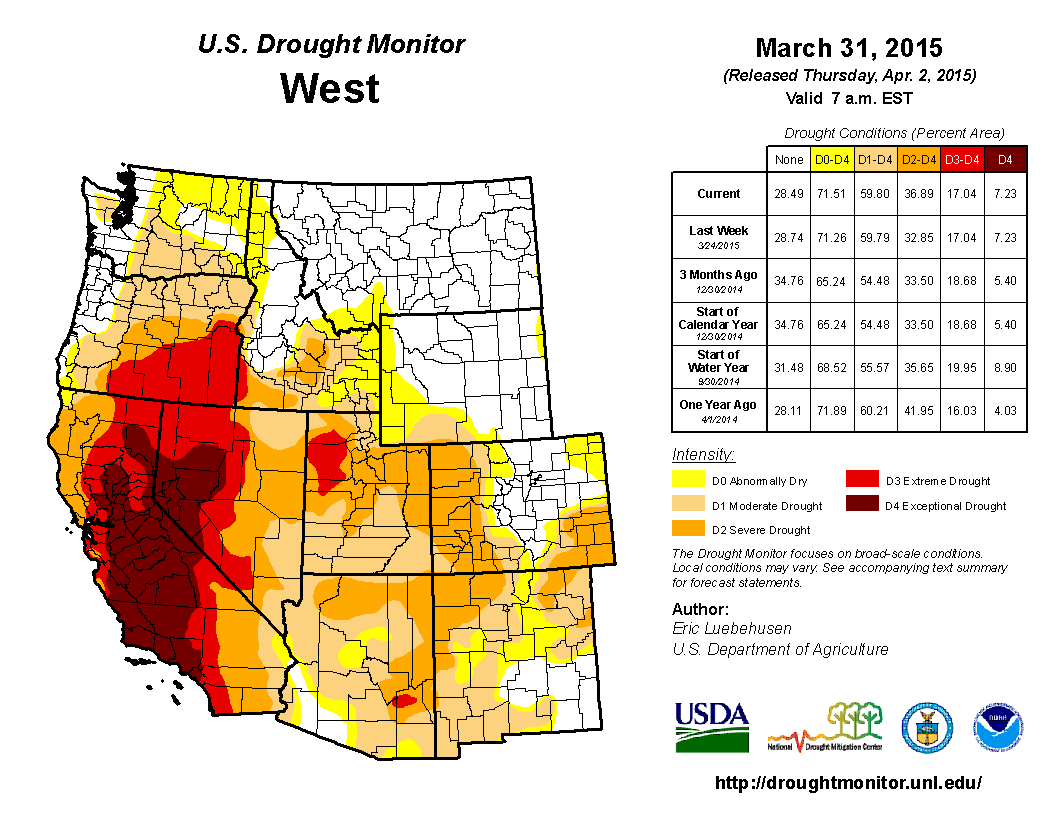
- moderate (D1) drought covered a large area of the U.S. from the West Coast to the Central and Southern Great Plains, connected across parts of New Mexico and Colorado, with large areas of more intense drought within the moderate drought area;
- there were two epicenters of extreme (D3) to exceptional (D4) drought within this large moderate to severe (D2) drought area — one located in the California-Nevada-Oregon region and the other in the Southern Plains centered in northern Texas and adjacent Oklahoma;
- areas of moderate drought persisted along parts of the Gulf of Mexico coast from Louisiana to Florida, and in Hawaii; and
- moderate drought was expanding in the Northern Plains to western Great Lakes.
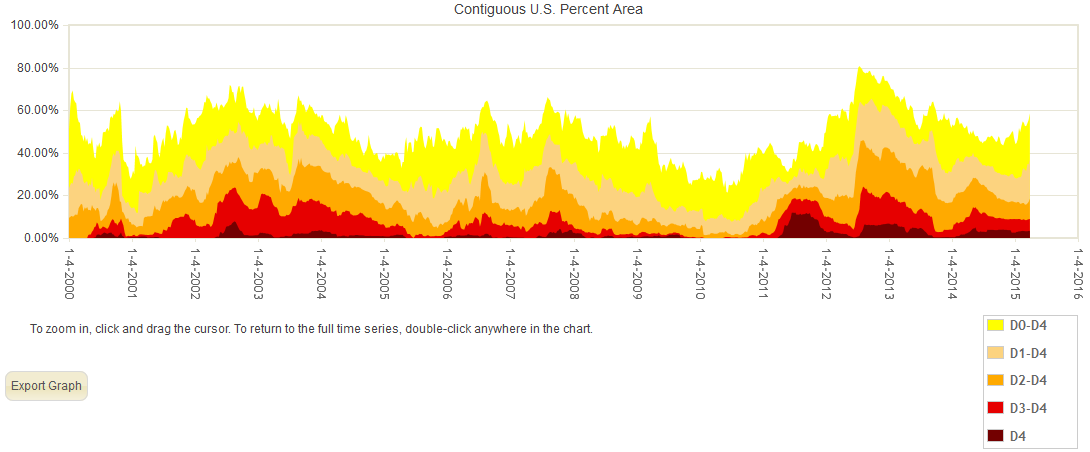
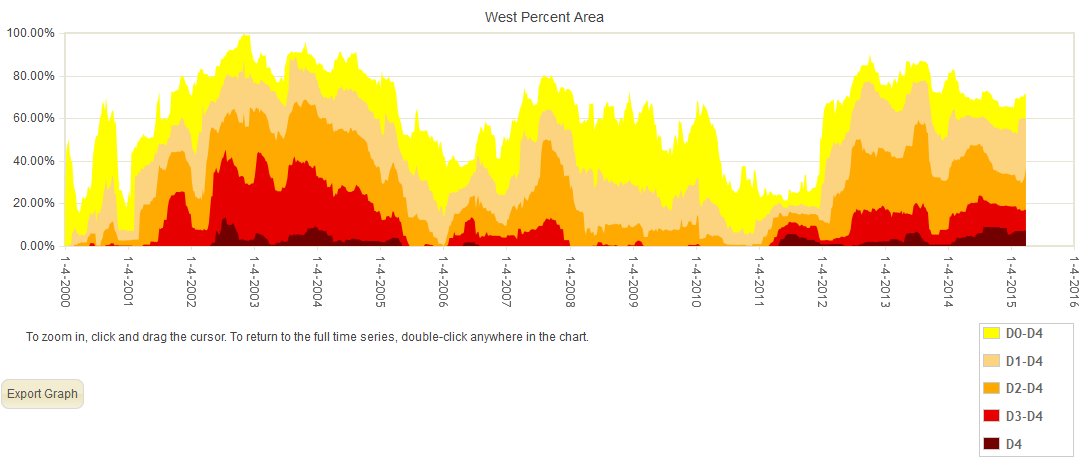
Percent area of the CONUS in moderate to exceptional drought, January 4, 2000 to present, based on the U.S. Drought Monitor.
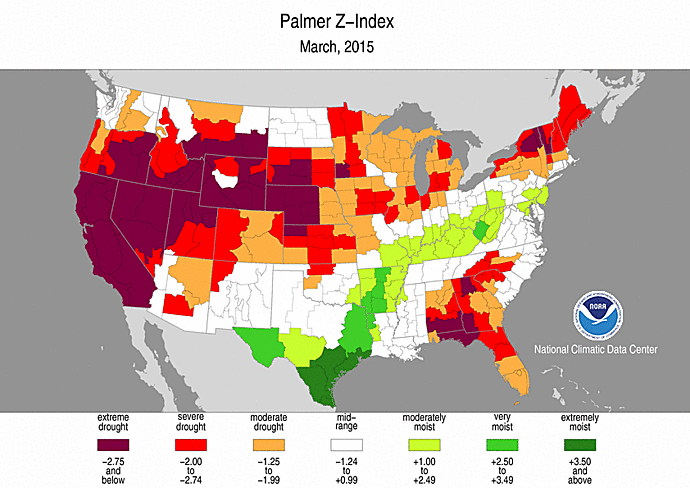
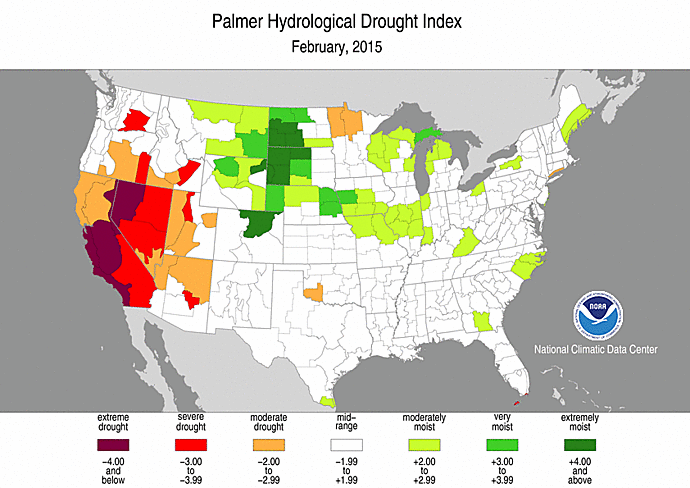
Palmer Drought Index
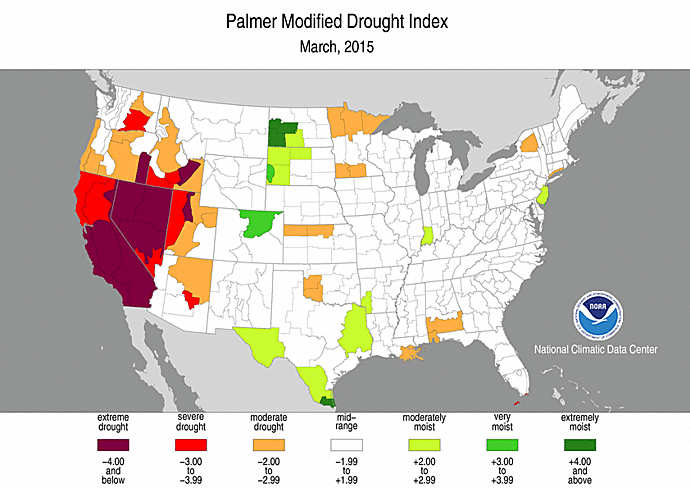
The Palmer drought indices measure the balance between moisture demand (evapotranspiration driven by temperature) and moisture supply (precipitation). The Palmer Z Index depicts moisture conditions for the current month, while the Palmer Hydrological Drought Index (PHDI) and Palmer Drought Severity Index (PDSI) depict the current month's cumulative moisture conditions integrated over the last several months. While both the PDSI and PHDI indices show long-term moisture conditions, the PDSI depicts meteorological drought while the PHDI depicts hydrological drought. The PDSI map shows less severe and extensive drought in the West and parts of the Plains than the PHDI map because the meteorological conditions that produce drought are not as long-lasting as the hydrological impacts.
|
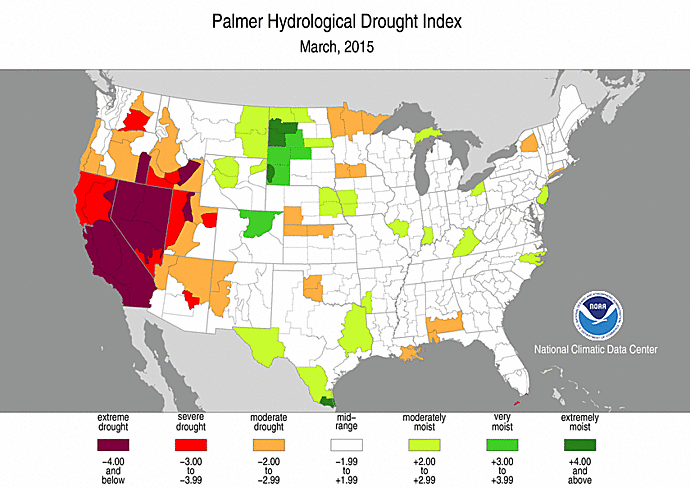 |
Used together, the Palmer Z Index and PDSI maps show that short-term dry conditions occurred over much of the country, stretching from the West Coast to New England, and over the Southeast. Long-term drought intensified in parts of the West, which had areas in long-term drought during February. In the Central to Northern Plains, the continued short-term dryness caused areas of long-term drought to develop and shrank the area of long-term wet conditions that were evident in February. The persistent short-term dryness also caused areas of long-term dryness to appear in the Central Gulf of Mexico Coast. Short-term wet conditions were persistent enough to cause long-term wet conditions to develop in parts of southern and eastern Texas.
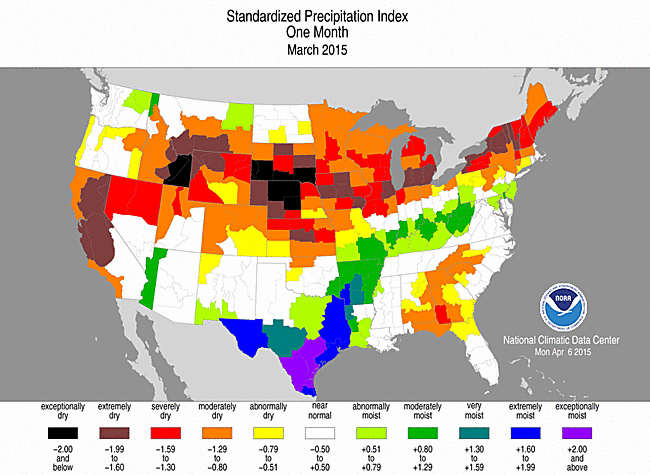
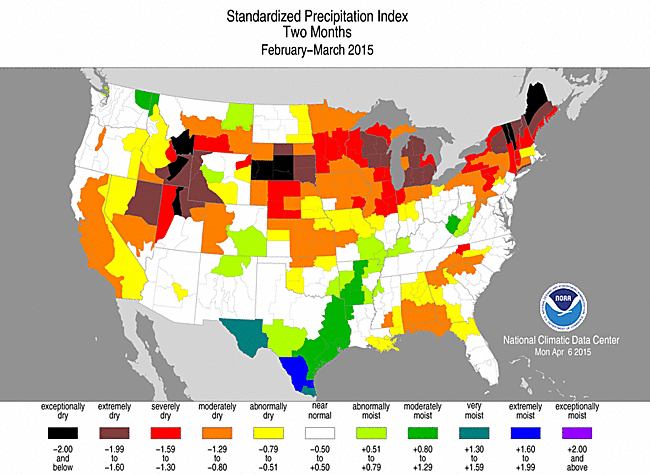
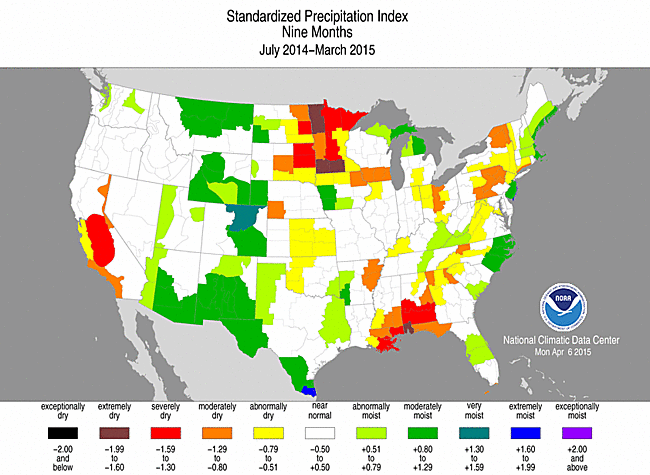
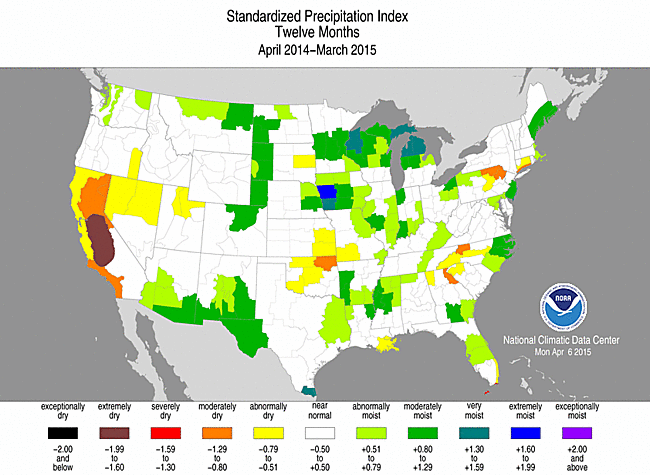
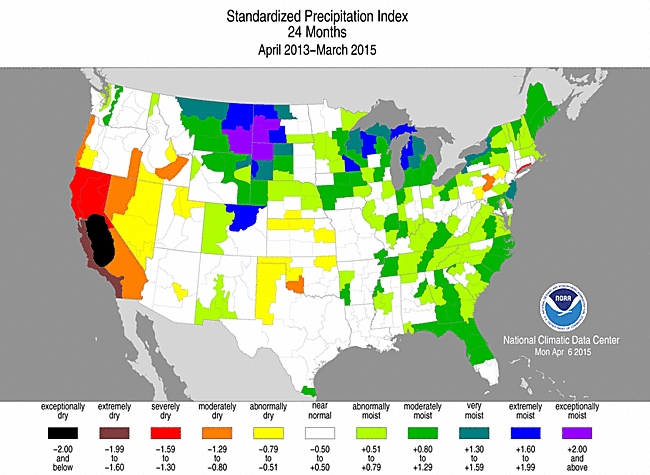
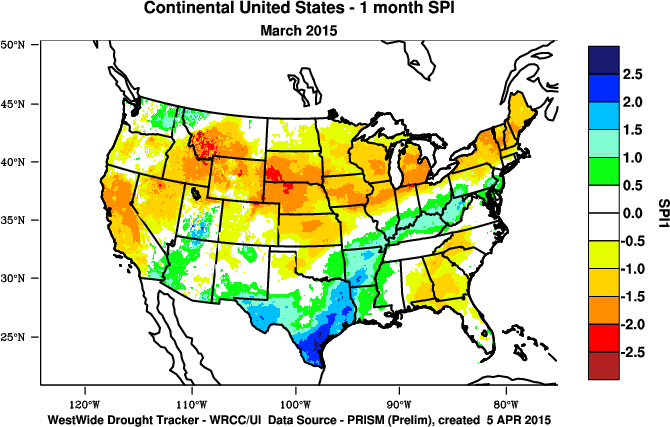
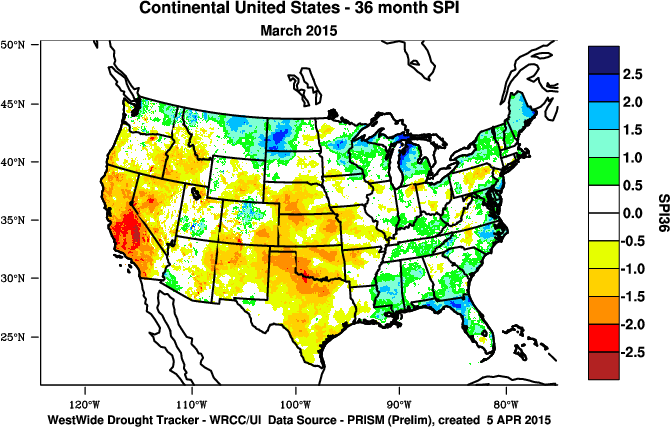
Standardized Precipitation Index
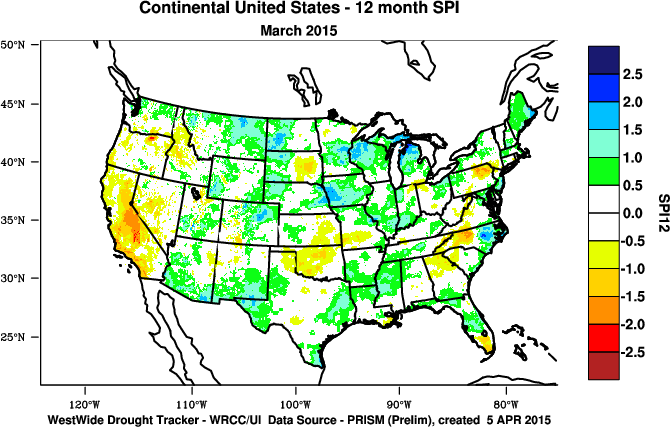
The Standardized Precipitation Index (SPI) measures moisture supply. The SPI maps here show the spatial extent of anomalously wet and dry areas at time scales ranging from 1 month to 24 months.
 |
 |
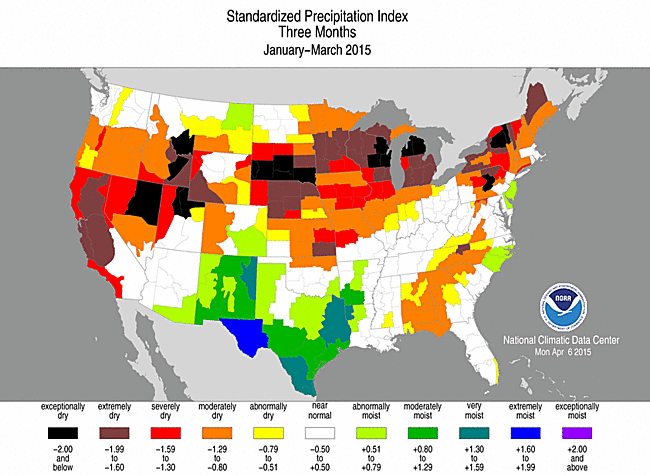 |
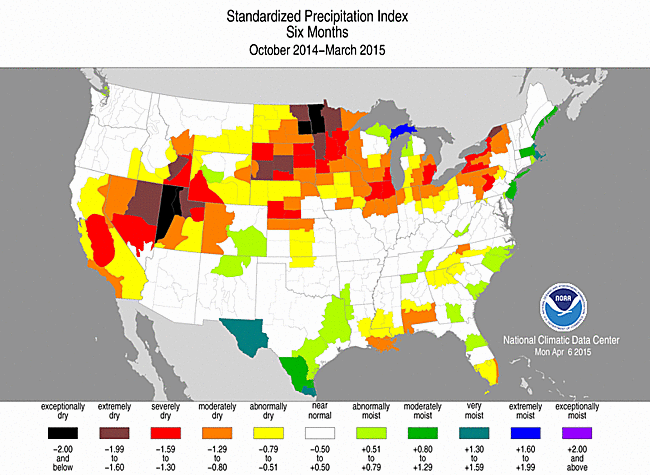
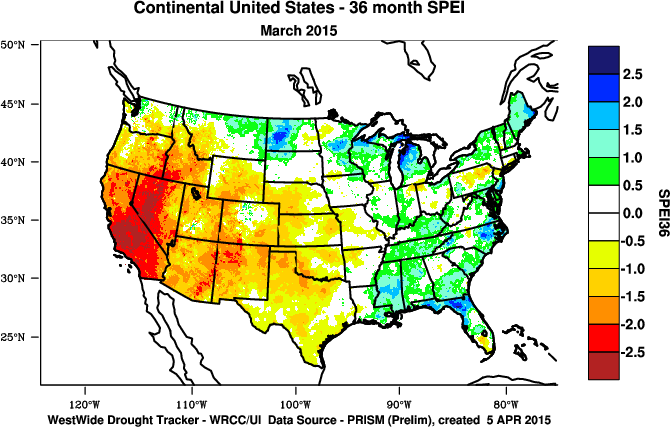
The SPI maps illustrate how moisture conditions have varied considerably through time and space over the last two years. Dryness across parts of the West to Northern and Central Rockies, Central to Northern Plains, and Midwest to Northeast is evident in March and the last 2 to 3 months and even extends as far back as 6 months. Parts of the West, especially California, Central to Southern Plains, and Northeast have dry conditions from 9 to 24 months. Dryness in the Northern Plains extends to the 9 month time scale. The Southeast to Central Gulf of Mexico Coast have areas of dryness for the last 1 to 12 months. Wet conditions are evident along the Ohio Valley in March, in parts of the Southern Plains at the 1 to 2 month time scales, in parts of the Southwest to Southern Plains from 3 to 12 months, across parts of the Rockies from 9 to 24 moths, and across much of the eastern U.S. at 24 months.
 |
 |
 |
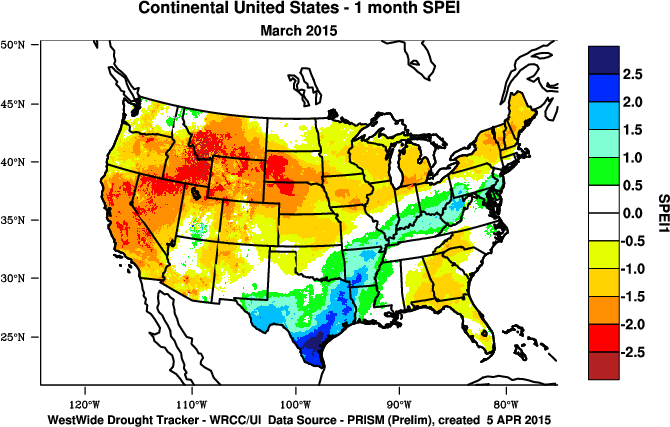
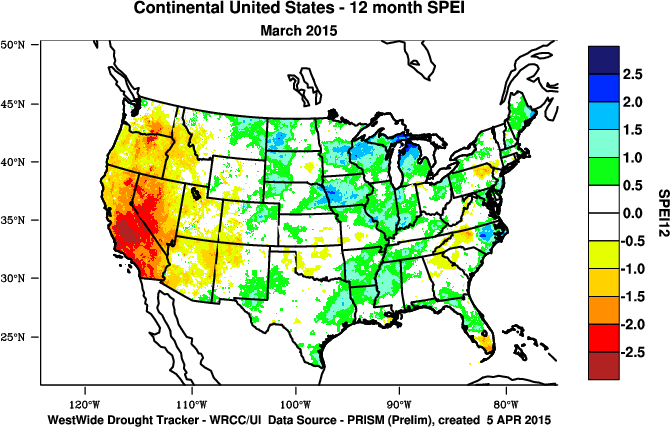
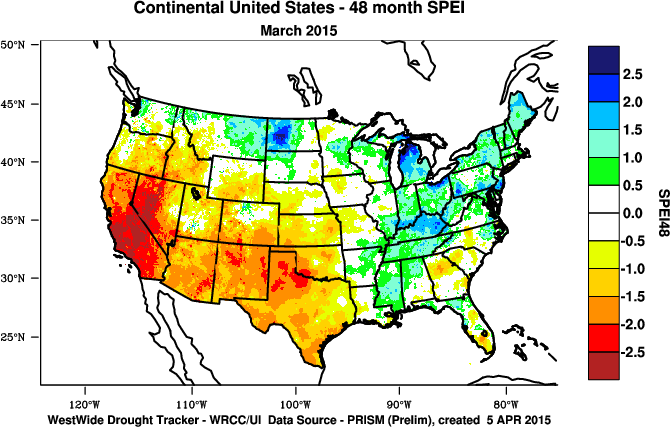
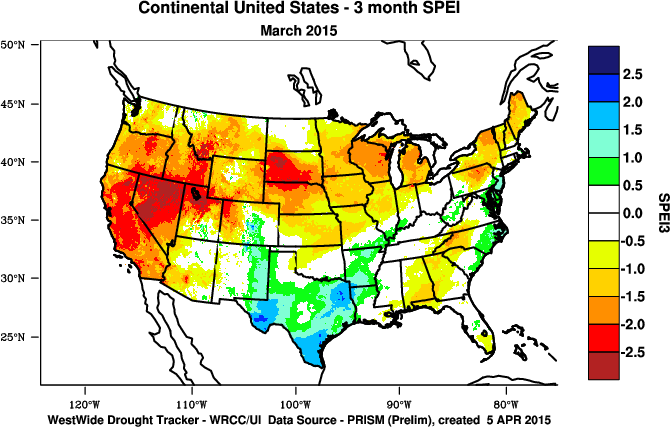
Standardized Precipitation Evapotranspiration Index
The SPI measures water supply (precipitation), while the SPEI (Standardized Precipitation Evapotranspiration Index) measures the combination of water supply (precipitation) and water demand (evapotranspiration as computed from temperature). Warmer temperatures tend to increase evapotranspiration, which generally makes droughts more intense.
 |
 |
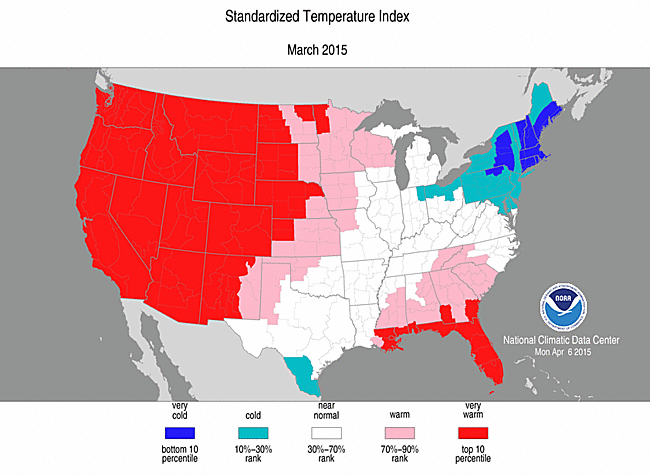
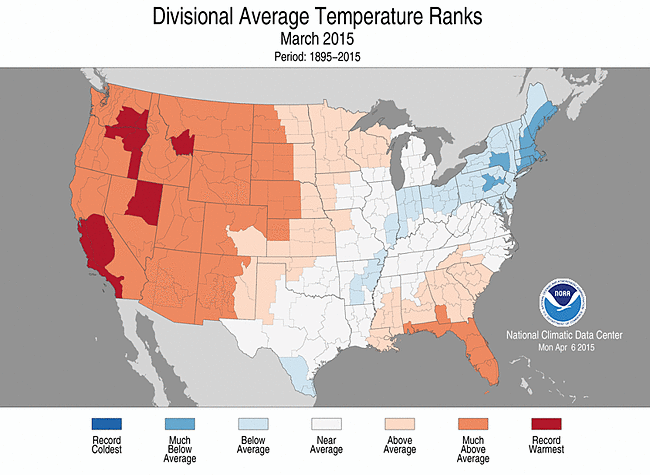
Temperatures were unusually warm in the West to Northern Plains during March. During spring, the effects of evapotranspiration due to abnormally warm temperatures begin to be felt more strongly. The magnitude of the record to near-record warm March temperatures made a noticeable difference in the SPEI compared to the SPI. When the entire year is considered, the record warm temperatures in the West significantly intensified drought conditions when the 12-month SPEI is compared to the SPI. The unusual western warmth of the last several years contributed to more intense drought on the SPEI maps compared to the SPI maps at longer time scales as well.
 |
 |
Agricultural, Hydrological, and Meteorological Indices and Impacts
 |
 |
Drought conditions were reflected in numerous agricultural, hydrological, and other meteorological indicators, both observed and modeled.
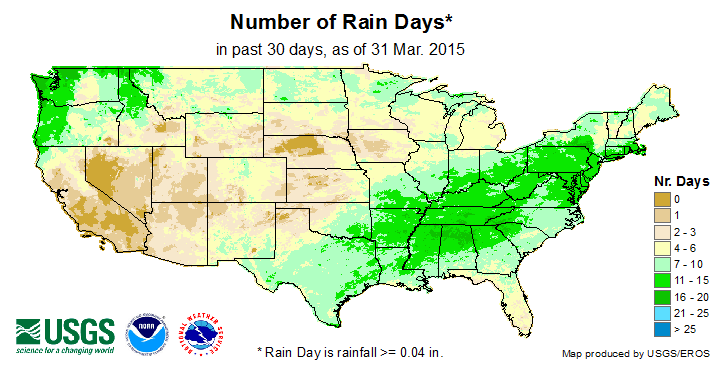
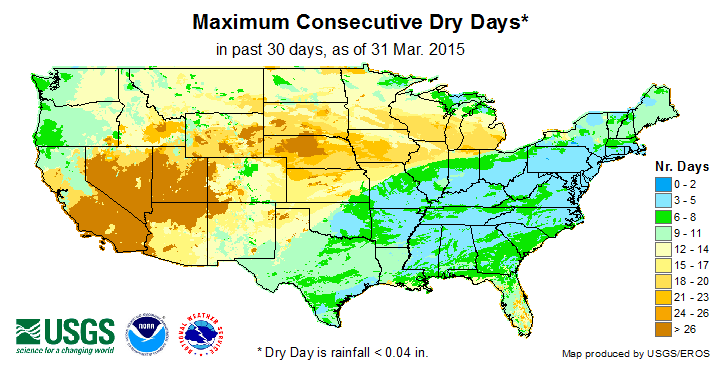
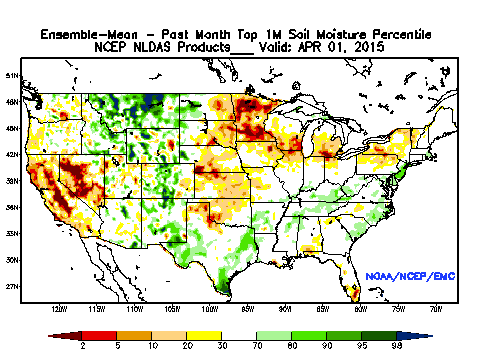
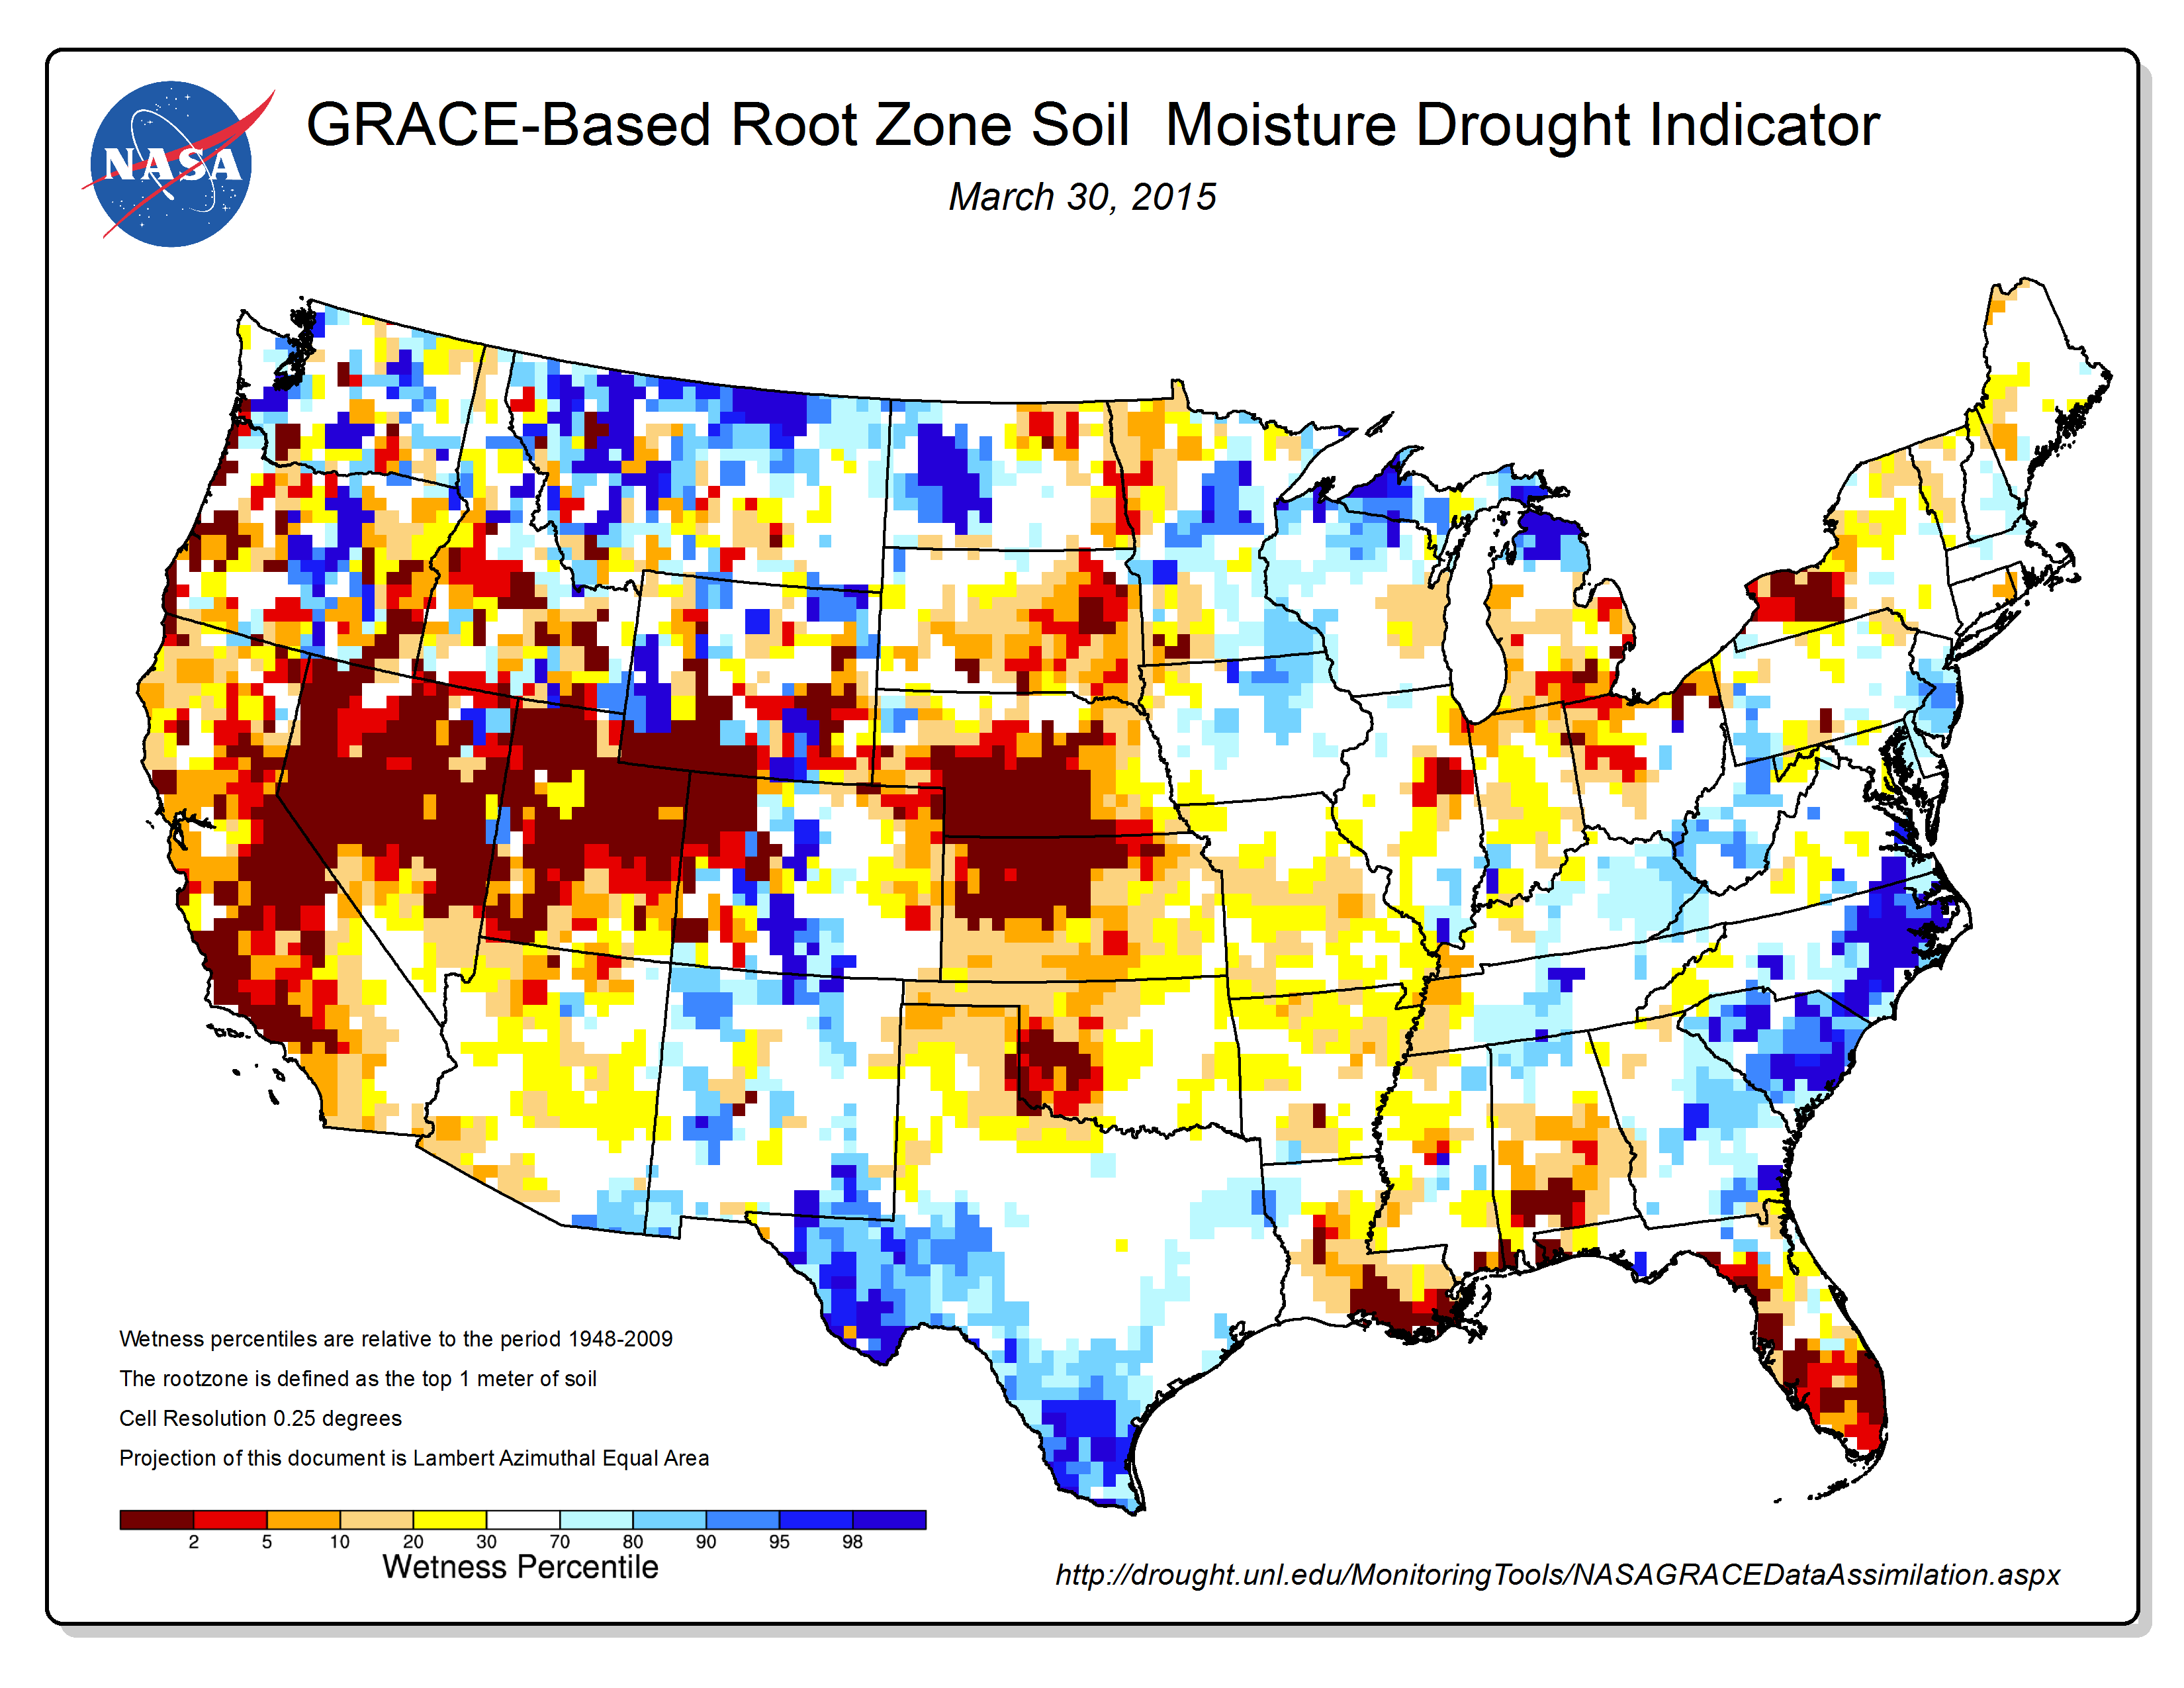
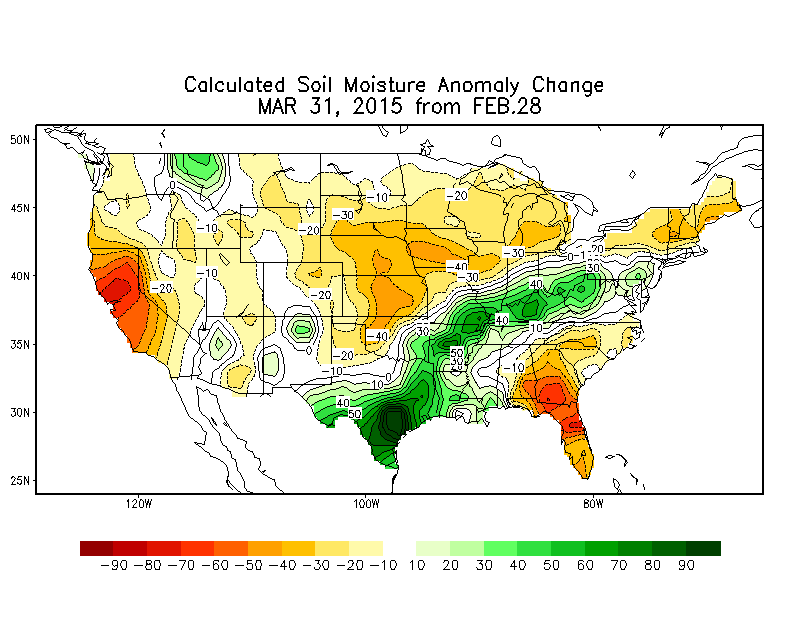
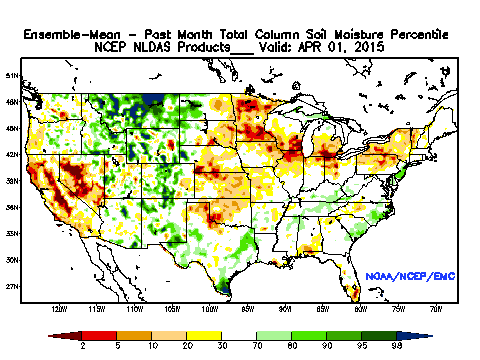
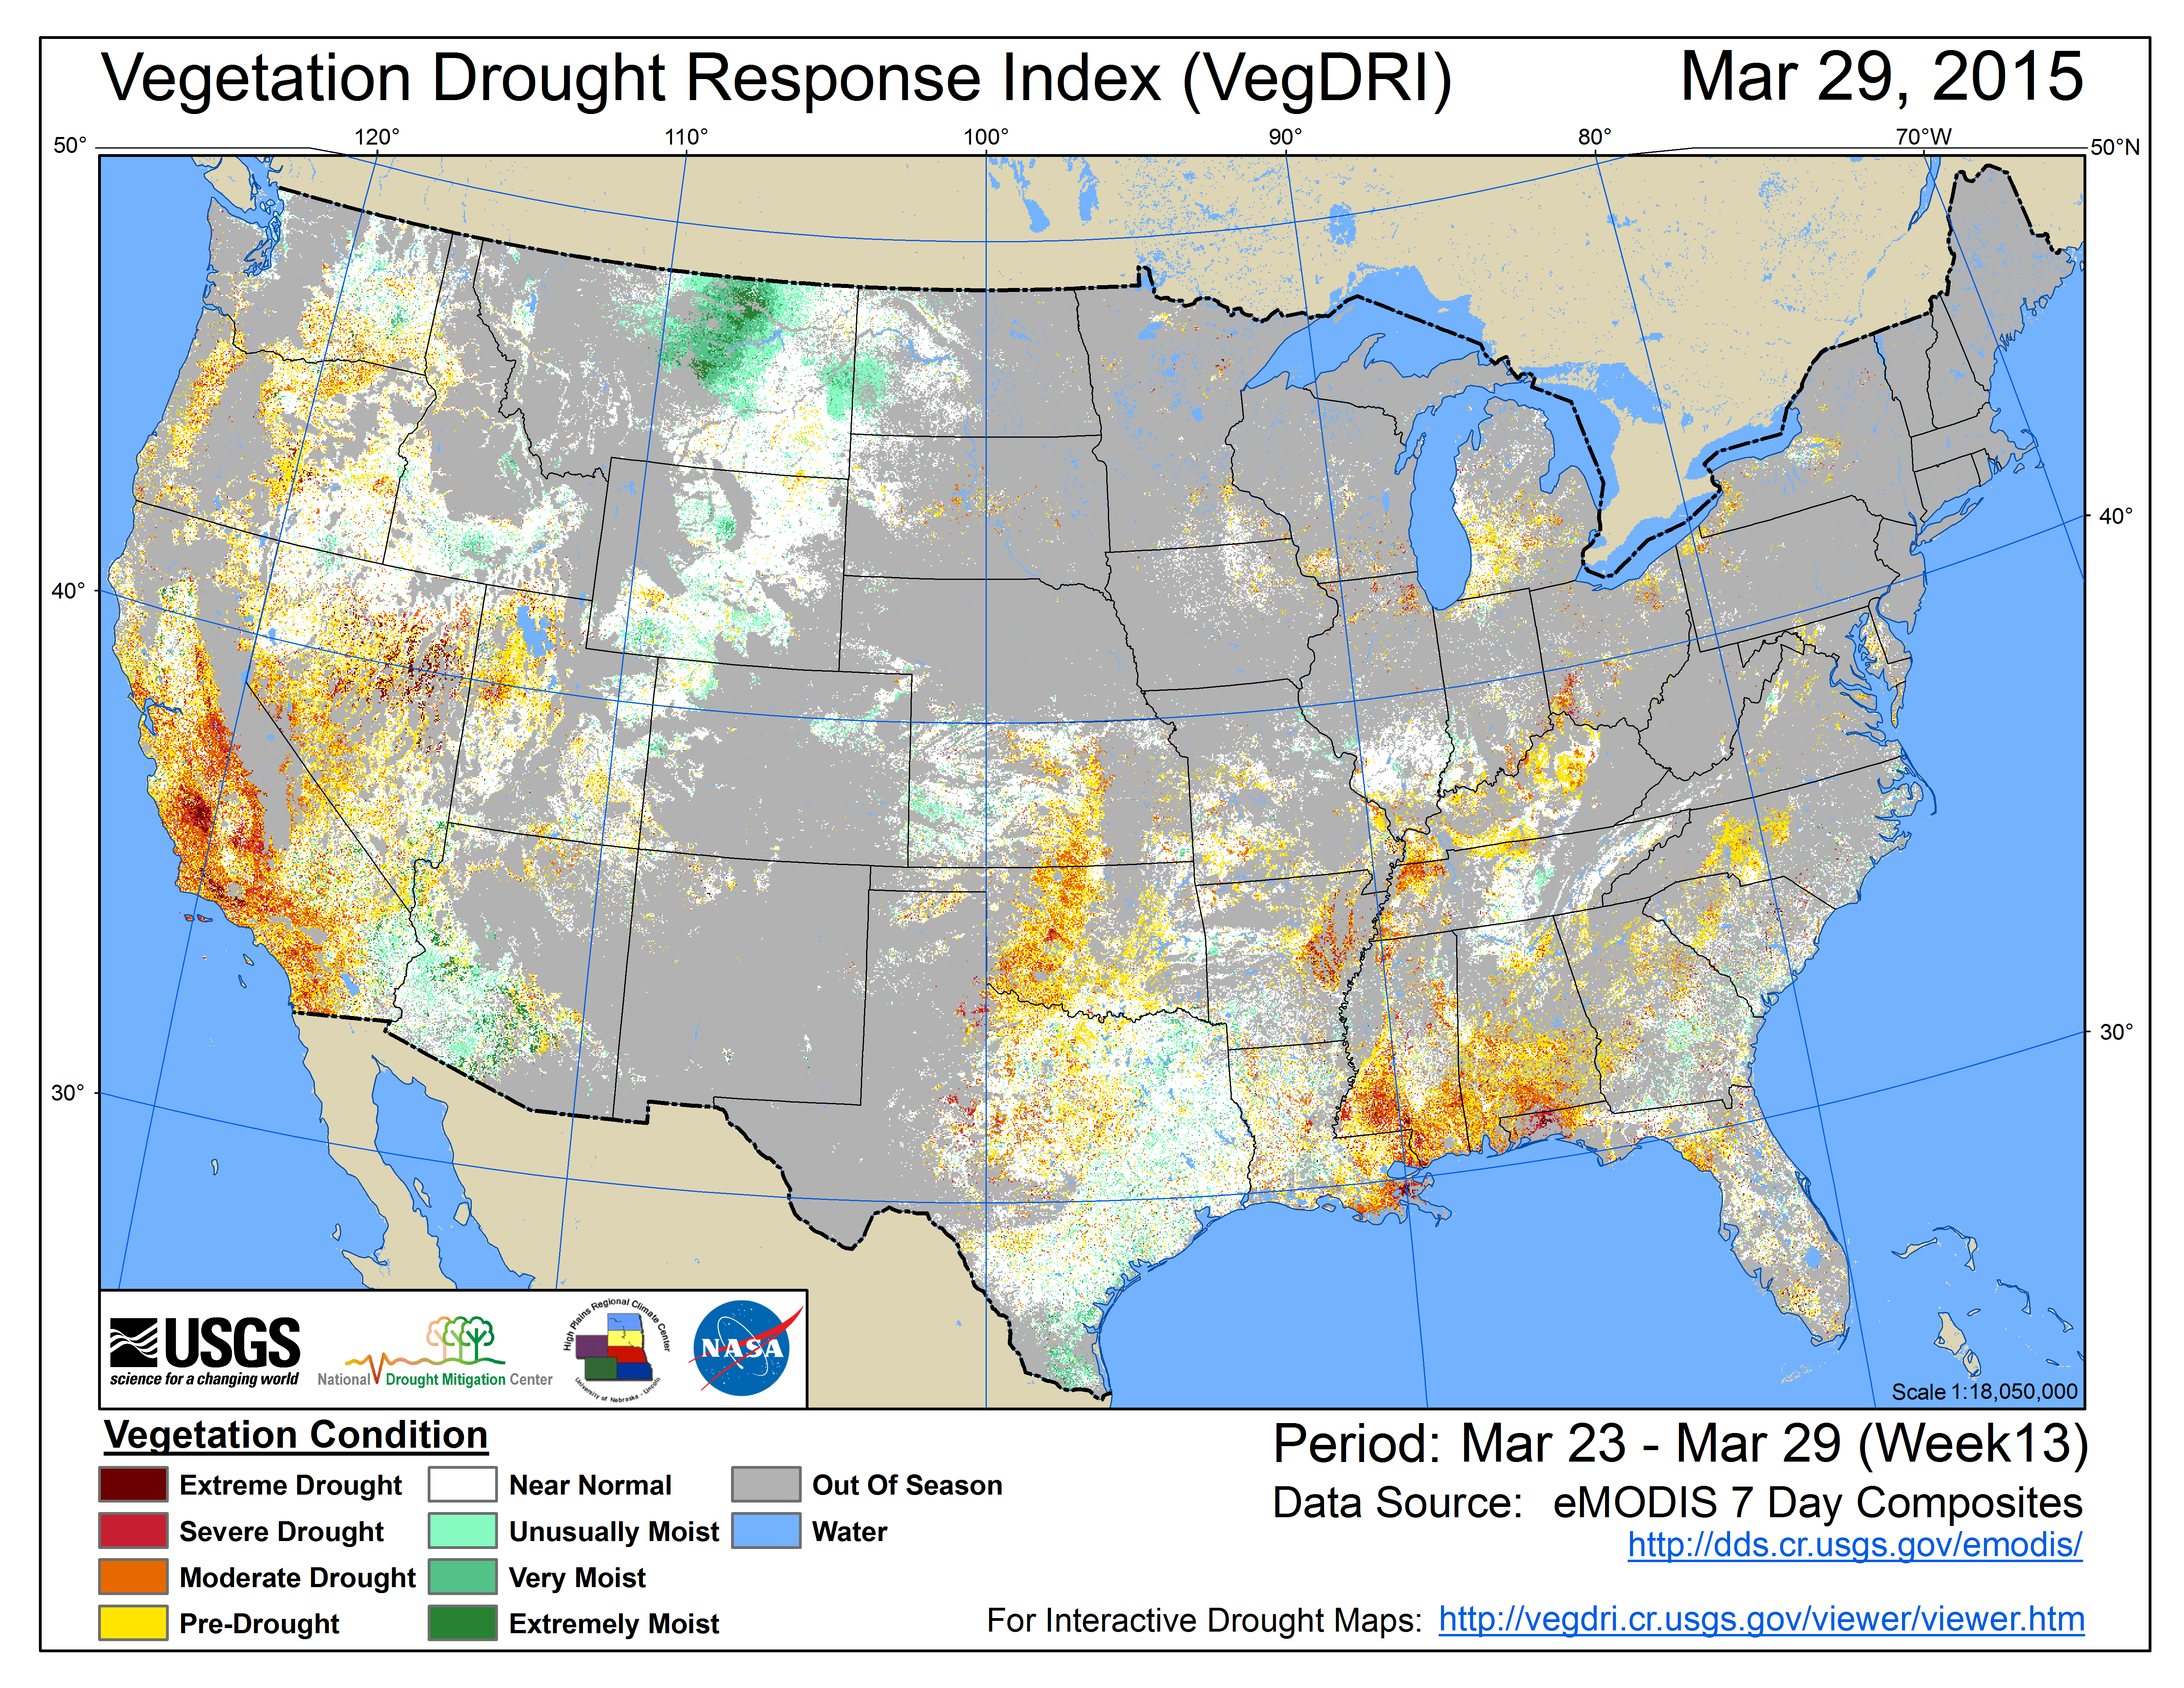
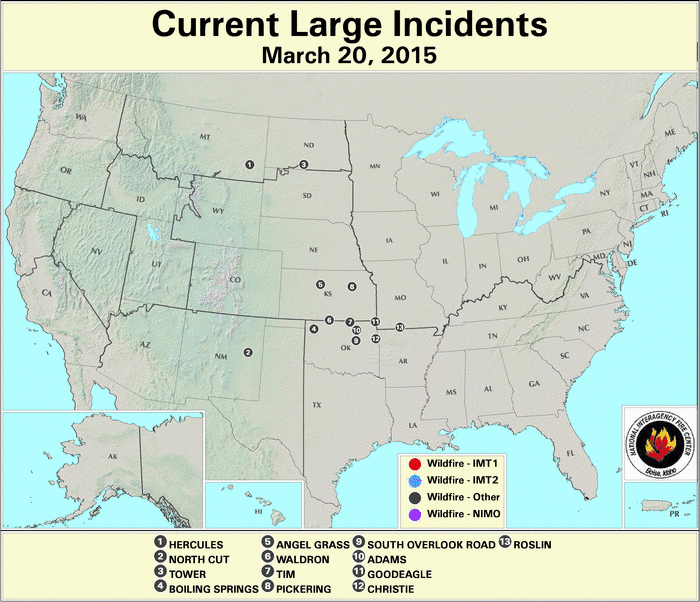
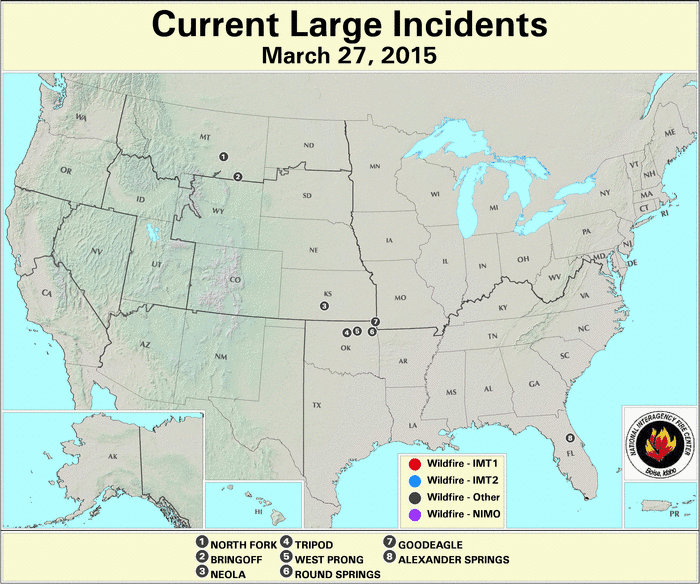
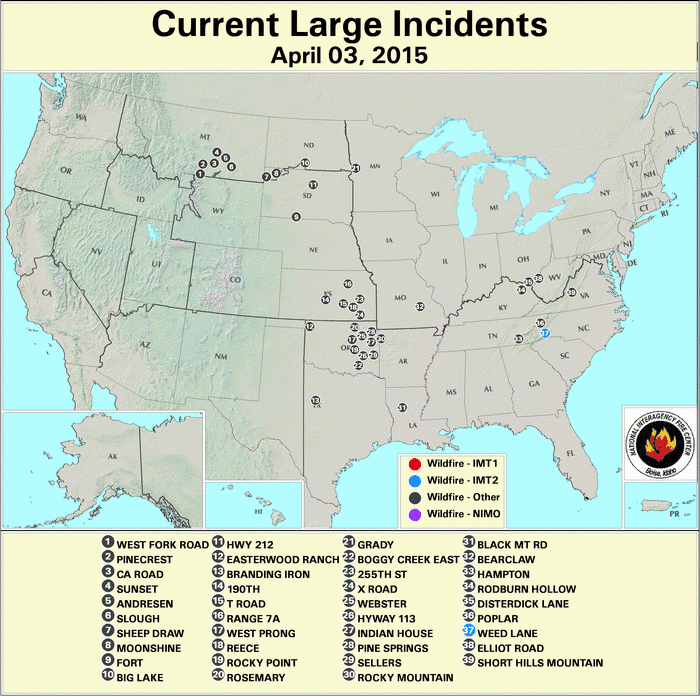
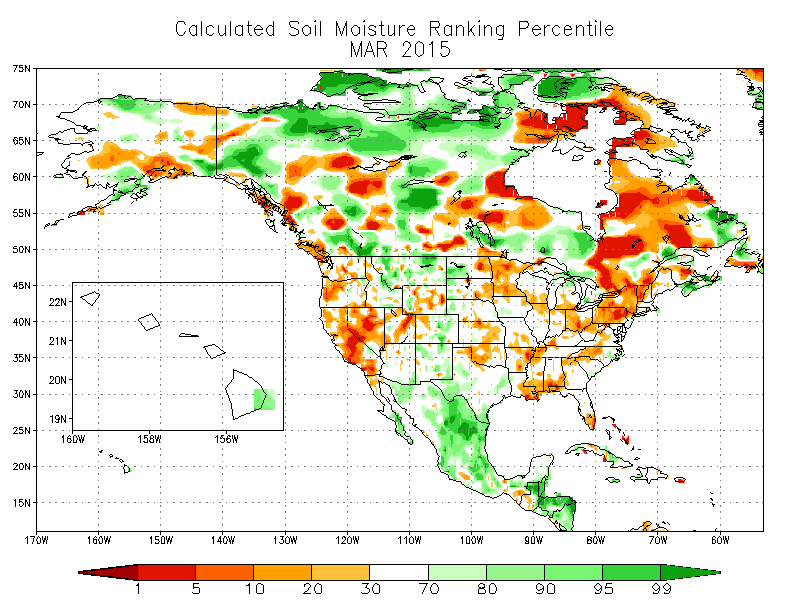
The dryness of March 2015 was reflected in below-normal precipitation totals, few days with precipitation, and long runs of dry days, especially from California to the western Great Lakes. The continued (last 2 to 3 months) lack of precipitation during March, coupled with unusually warm temperatures which increased evaporation, further dried soils in parts of the West, Plains, and Southeast. Even though temperatures continued below normal in the Northeast and the region has had a persistent snow cover, total precipitation has been below normal and soil moisture models indicate drying soils. According to April 5th reports from the U.S. Department of Agriculture (USDA), more than half of the topsoil moisture was rated in short or very short (dry or very dry) condition in California (80%), Nevada (80%), South Dakota (67%), Utah (66%), Wyoming (63%), New Mexico (60%), Kansas (57%), Oklahoma (56%), and Nebraska (53%). Subsoil conditions were just as dire, with more than 50 percent rated short or very short in California (85%), Nevada (80%), Oklahoma (70%), Utah (63%), South Dakota (62%), Kansas (54%), Wyoming (53%), and Oregon (51%). In total, 23 percent of the topsoil and 23 percent of the subsoil across the CONUS was rated short or very short. Satellite observations of vegetative condition revealed some stress in the West and Central Plains. According to March 31st USDM statistics, the percent acreage of several crops in drought rose during March. Corn producing areas in drought rose from 6 percent at the end of February to 22 percent at the end of March, soybean acreage in drought rose from 5 to 18 percent, hay acreage from 20 to 28 percent, cattle production from 27 to 36 percent, and winter wheat acreage from 33 to 42 percent. According to April 5th USDA reports, 16 percent of the winter wheat crop was in poor to very poor condition, with the epicenter of the worst conditions located in Nebraska, Kansas, and South Dakota. Several large wildfires developed in the Central to Southern Plains by mid-month. They decreased in number by the end of the month but became more widespread across the Plains and Appalachians by early April.
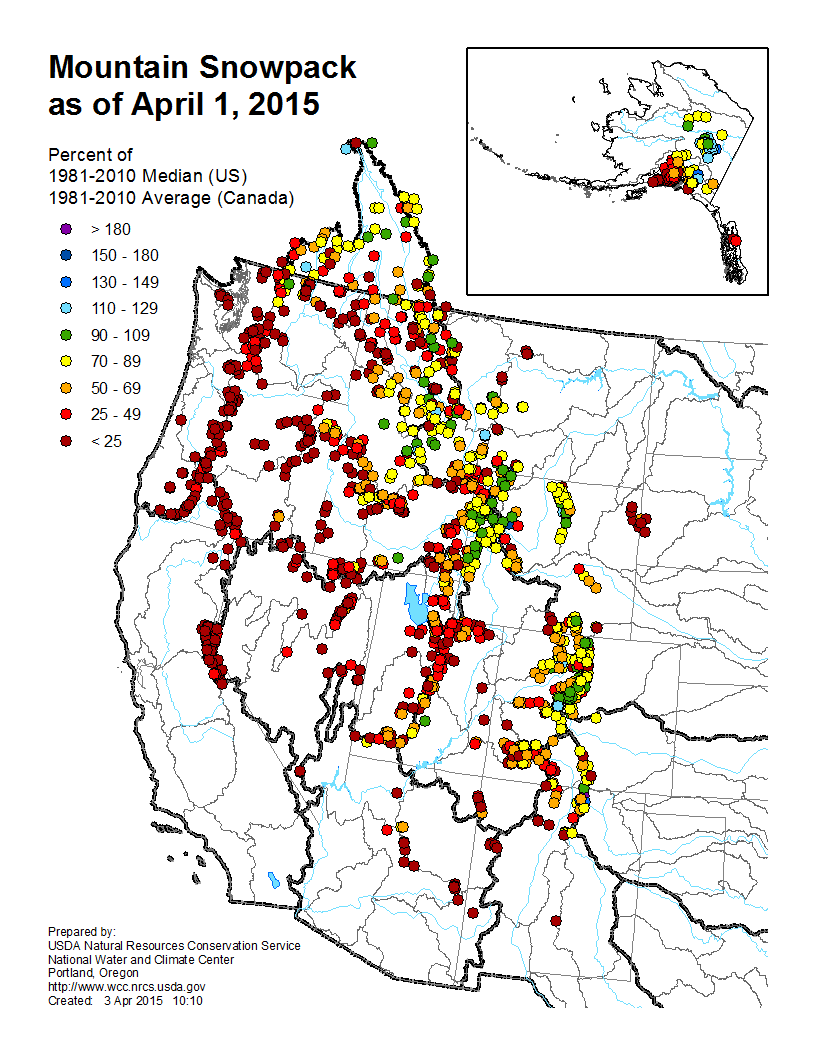
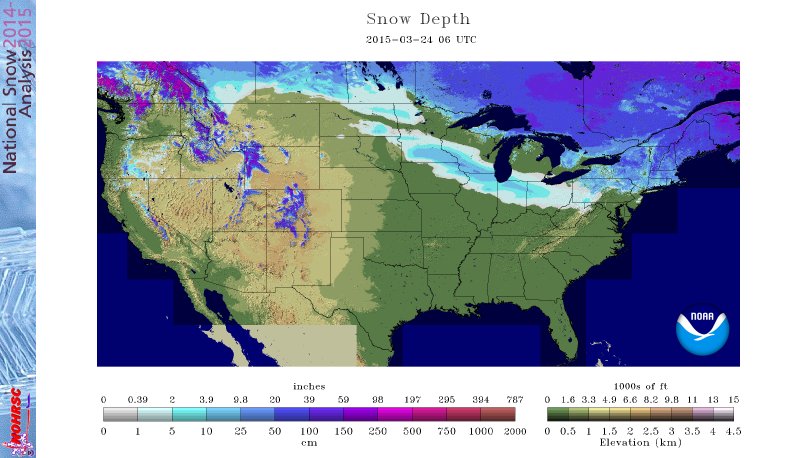
The winter snowpack in the West, which is crucial for spring and summer water supplies, continued to deteriorate. Several mountain locations had snowpack in the one to five percentile range, while many others were snow-free at a time of seasonal peak snow cover. Estimates of April 1 snowpack provided by California State Climatologist Michael Anderson ranked 2015 as having the lowest snowpack statewide at 12 percent of average. This is much lower than second-ranked 2014 and 1977, each of which had about 25 percent of average snowpack. Five of the last 15 years ranked in the top 11, with the last four years ranking lowest (2015), second lowest (2014), seventh lowest (2013), and eleventh lowest (2012). As a result, Governor Edmund G. Brown Jr. announced mandatory water reductions across the state.
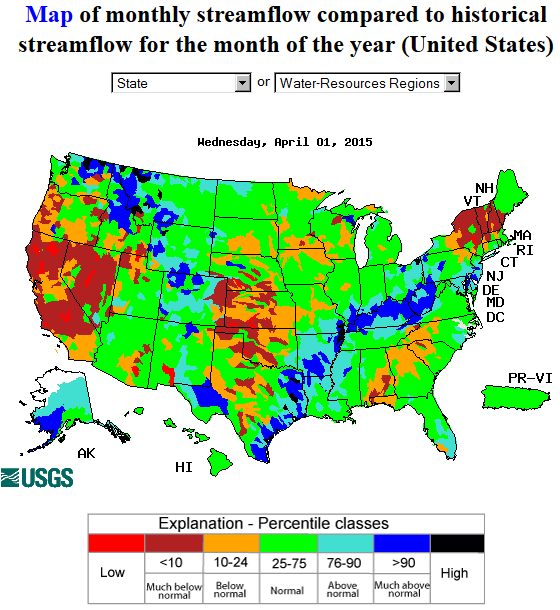
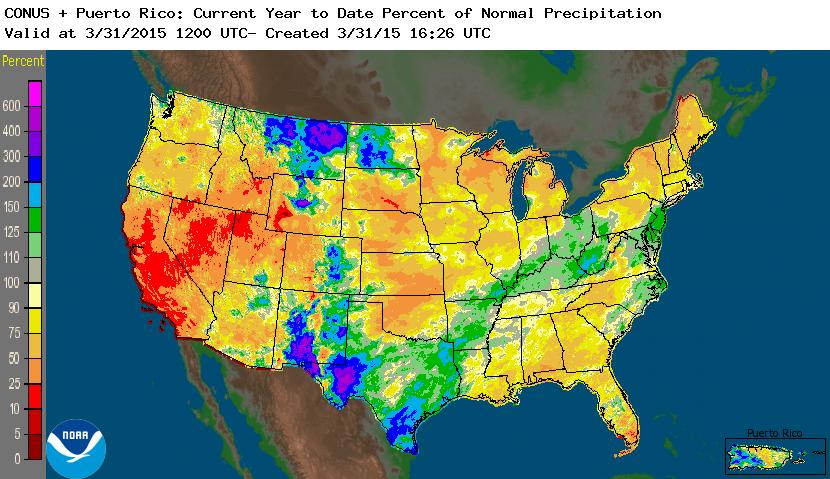
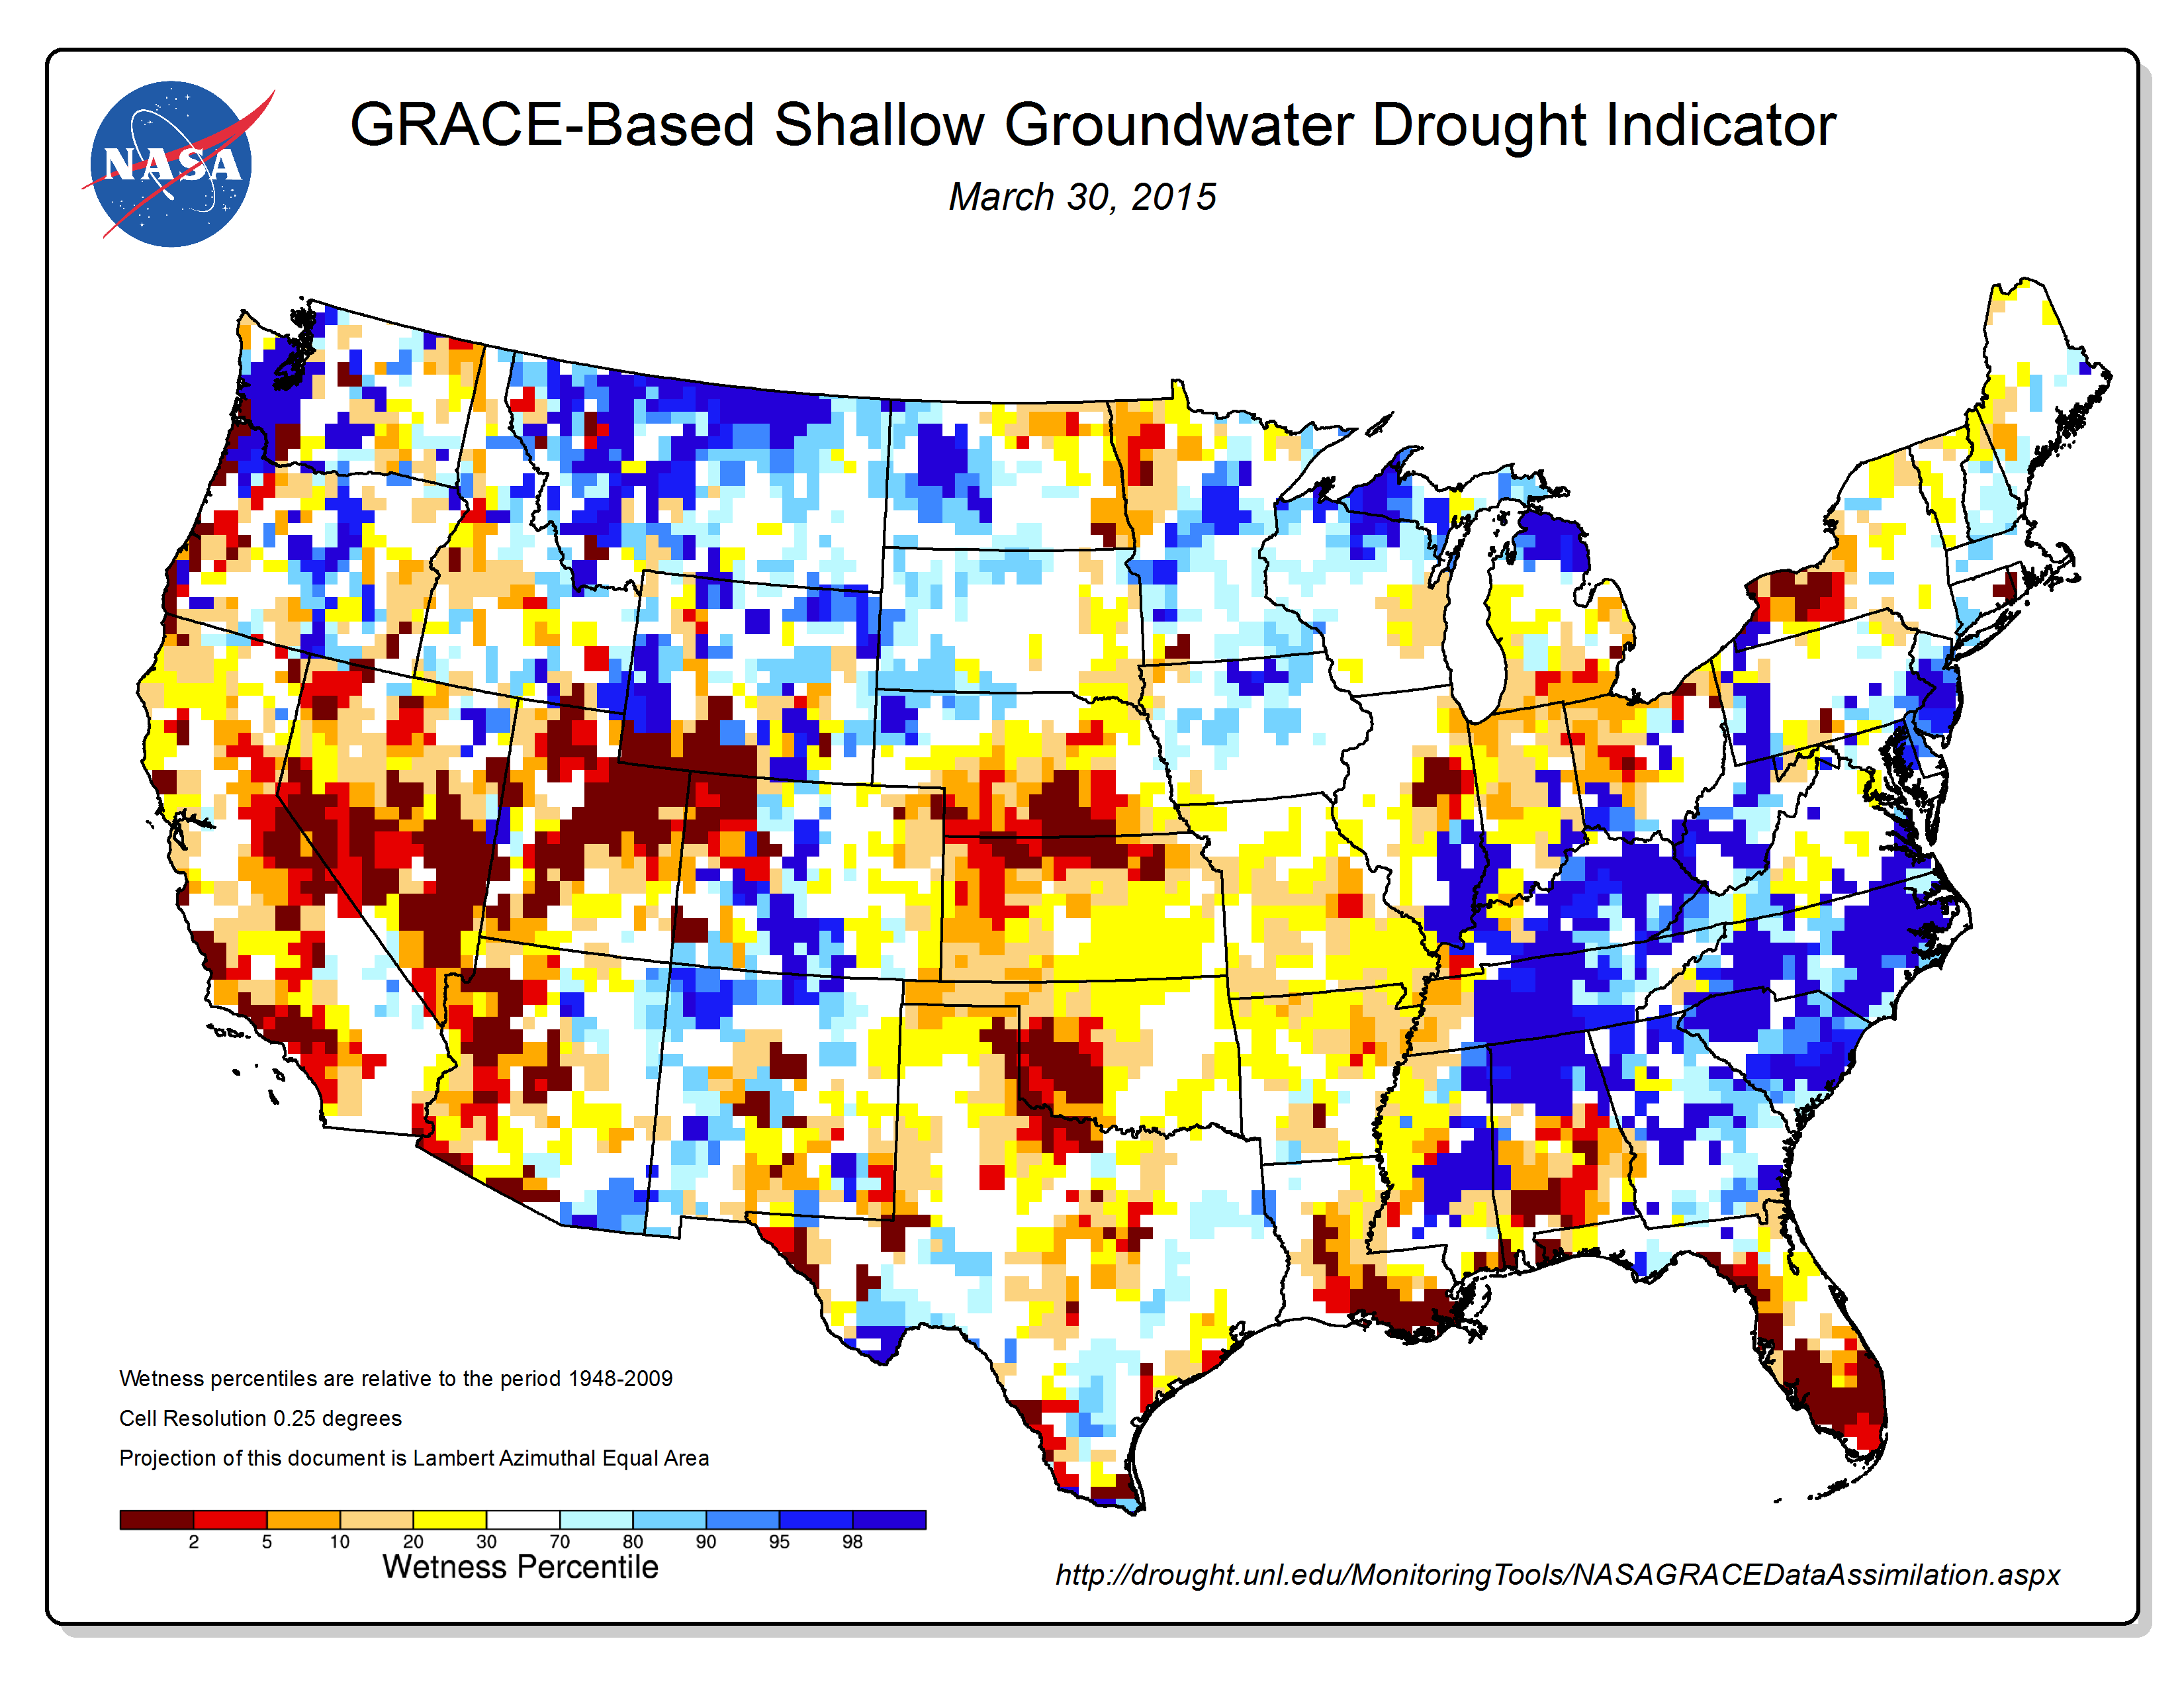
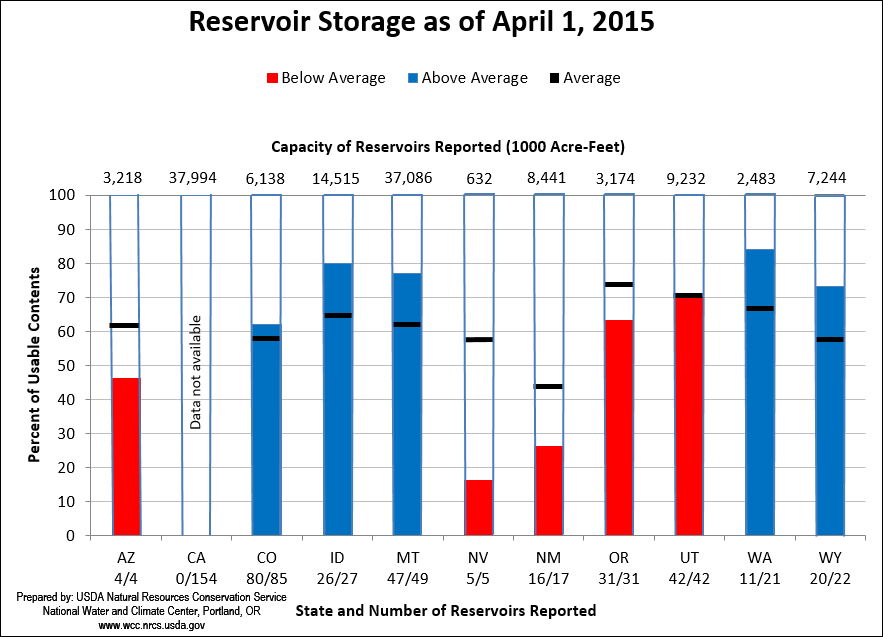
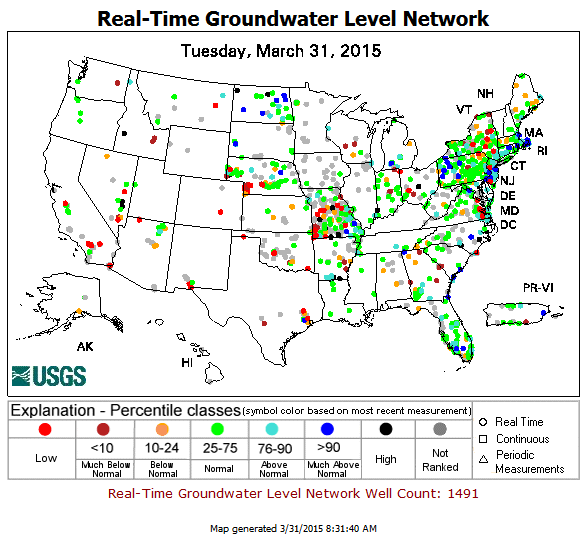
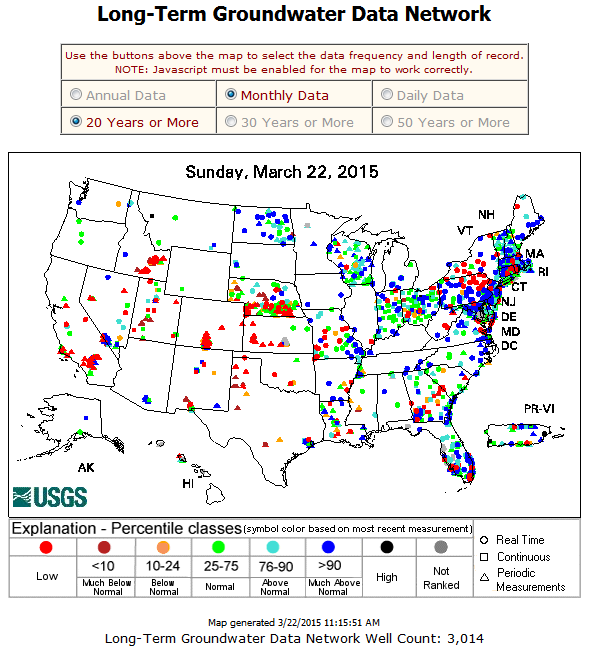
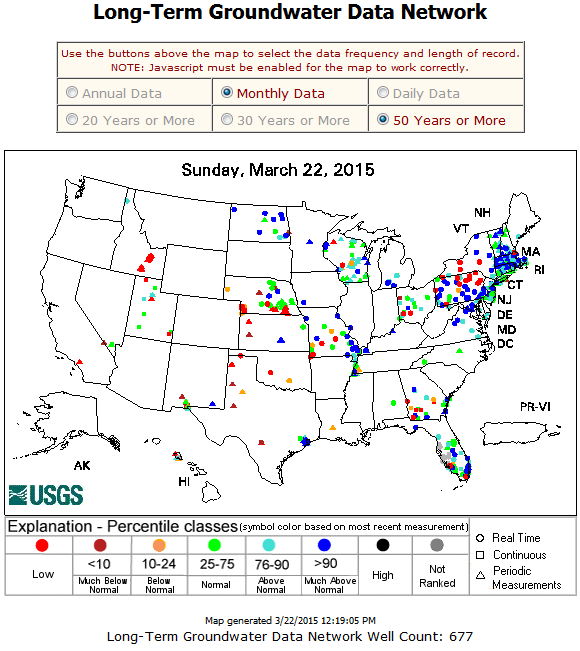
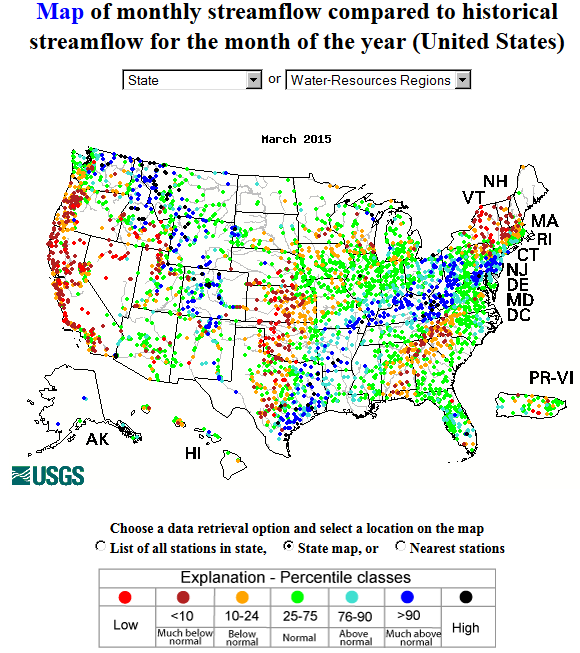
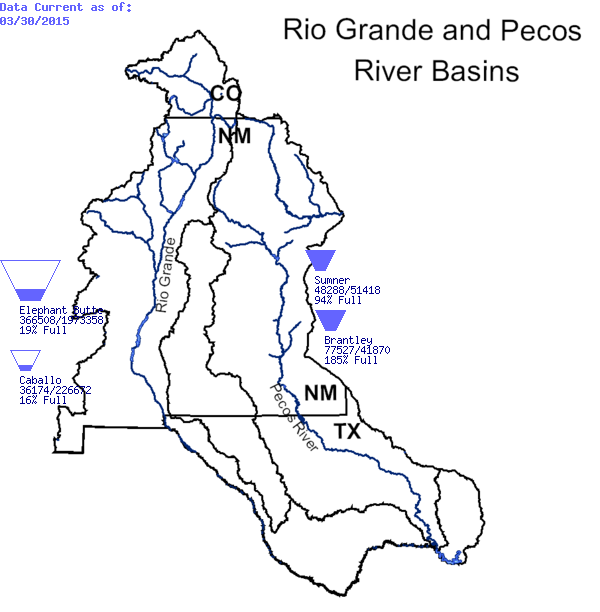
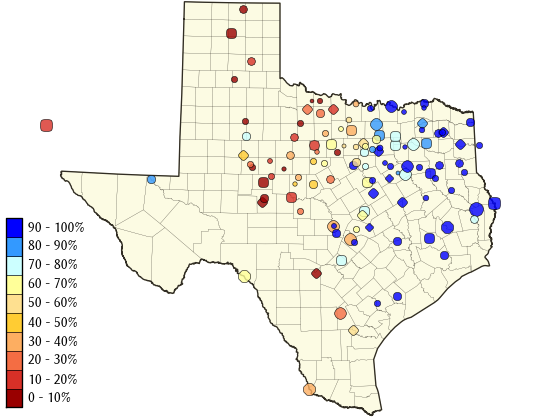
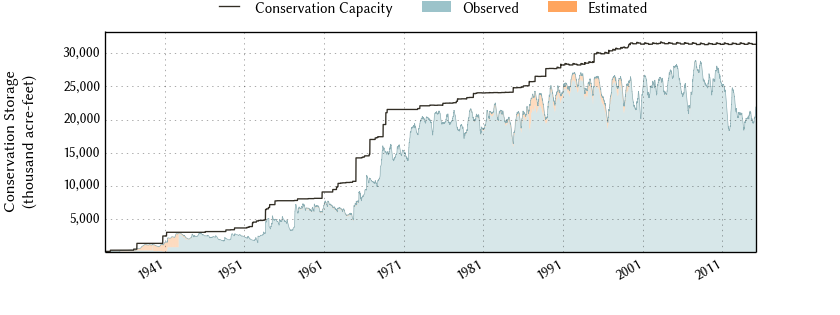
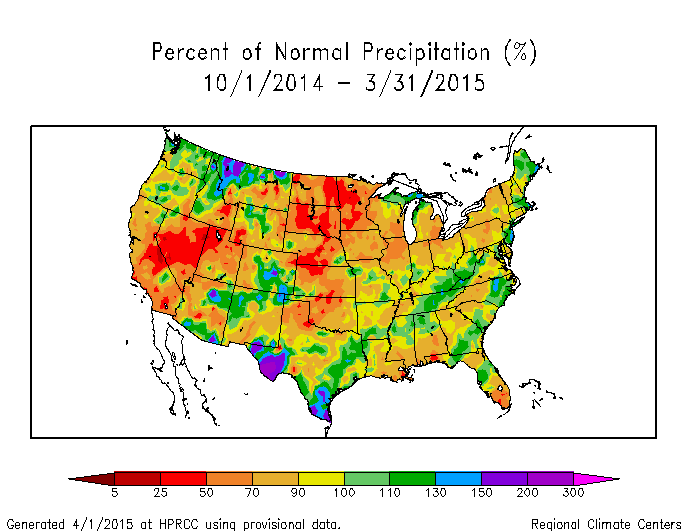
Precipitation for the water year-to-date (October 1, 2014-March 31, 2015) was below normal across much of the West, with many locations near record low. Three to four years of drought in the West to Southern Plains have significantly depleted groundwater and reservoir levels. Some groundwater well stations have reached the lowest levels observed in the last 20 to 50 years. Groundwater feeds many streams, and the low groundwater levels are reflected in below-normal streamflow levels, with some streams in the West, Plains, and Northeast reaching record low levels. Reservoirs were below average statewide in Arizona, Nevada, New Mexico, and Oregon. Reservoirs in California, parts of New Mexico, and western to central Texas were seriously depleted, with those in Texas, averaged across the state, stuck at the lowest levels in 30 years.
Regional Discussion
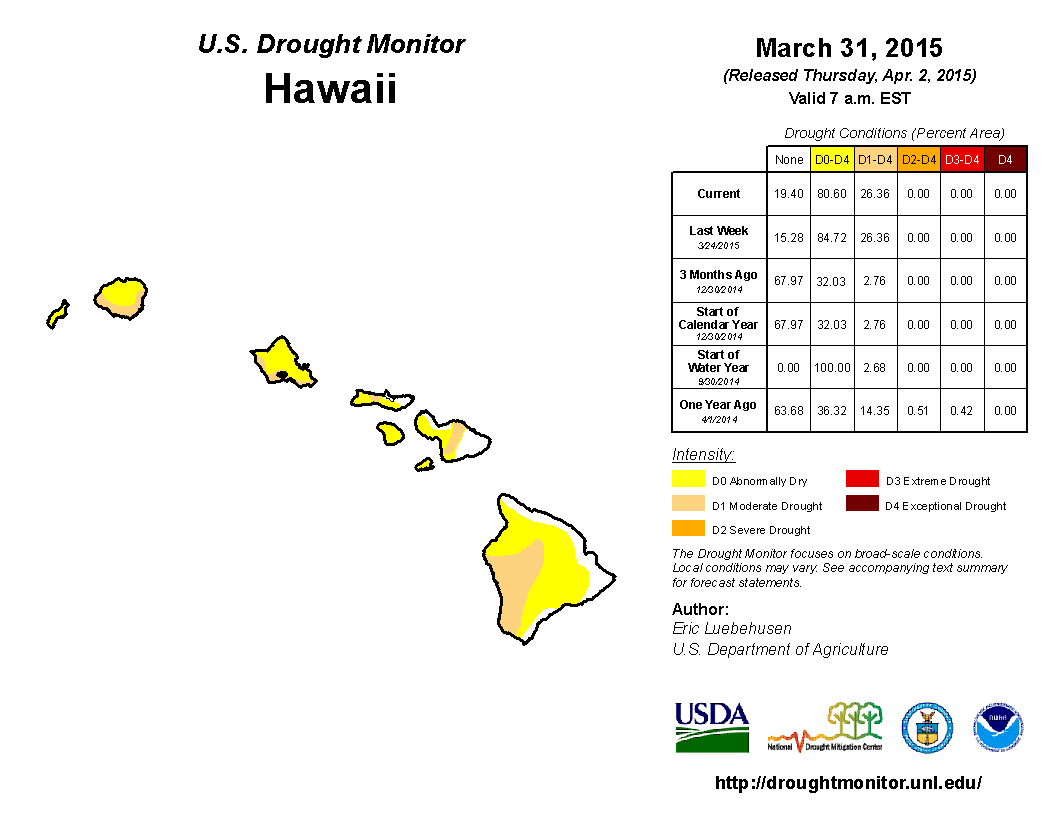
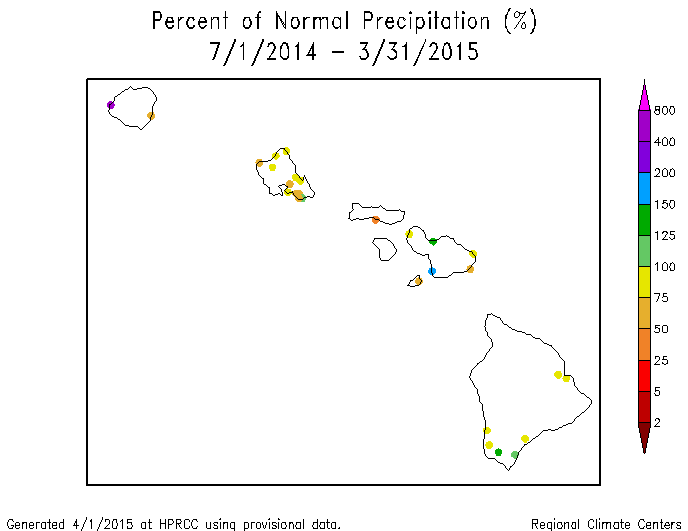
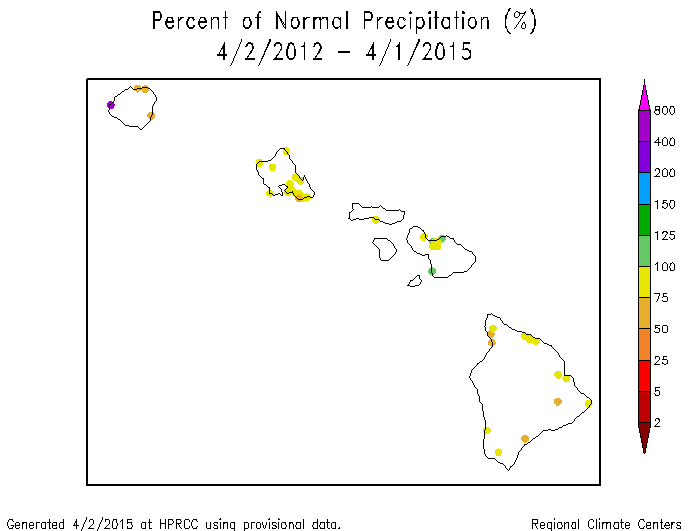
Hawaii: March 2015 and the last 2 months were drier than normal across Oahu, Molokai, and The Big Island, wetter than normal across much of Maui, and had a mixed precipitation anomaly pattern across Kauai. The precipitation pattern for the last 3 to 6 months was predominantly drier than normal across the Hawaiian Islands. A mixed precipitation anomaly pattern dominated at longer time scales (last 9, 12, and 24 months). The pattern for the last 36 months was dominated by drier-than-normal conditions. The dryness was reflected in below-normal streamflow on some of the islands. On the USDM map, moderate drought contracted to cover about a fourth (26.4 percent) of the state, reflecting the short-term wet conditions in some areas and the continued low reservoir situation in central Molokai and the Upcountry Maui area.
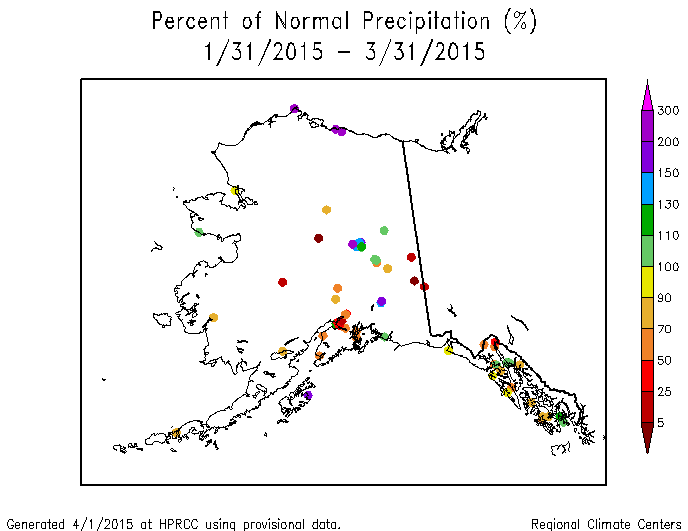
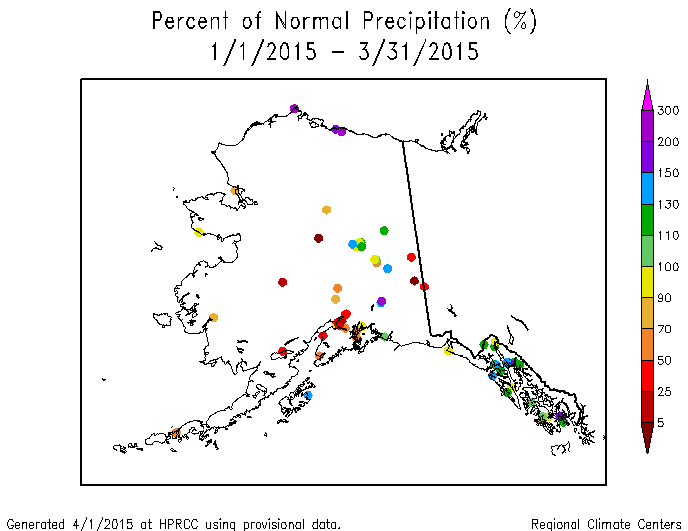
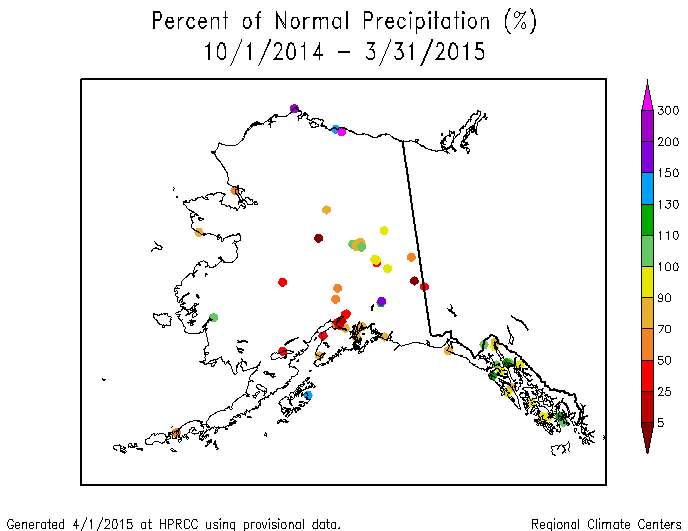
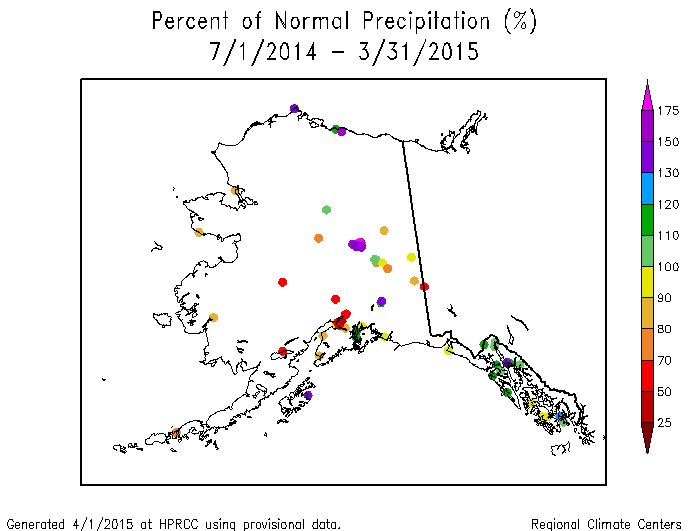
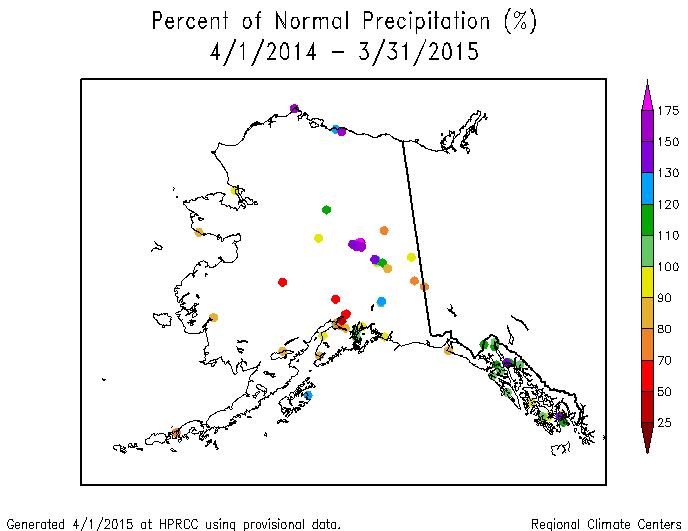
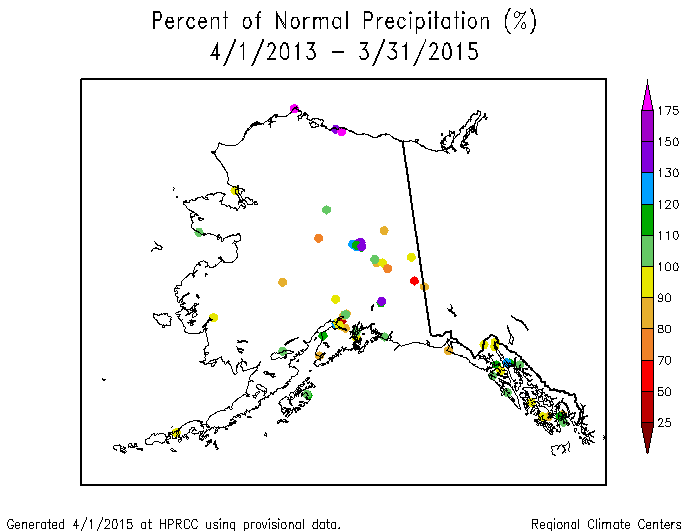
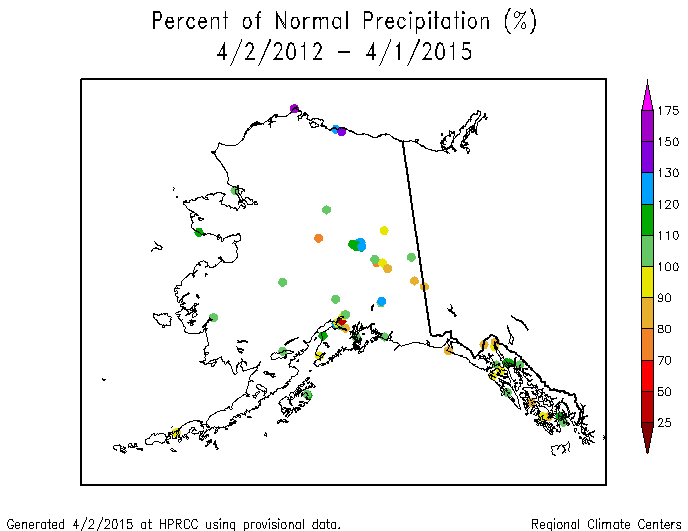
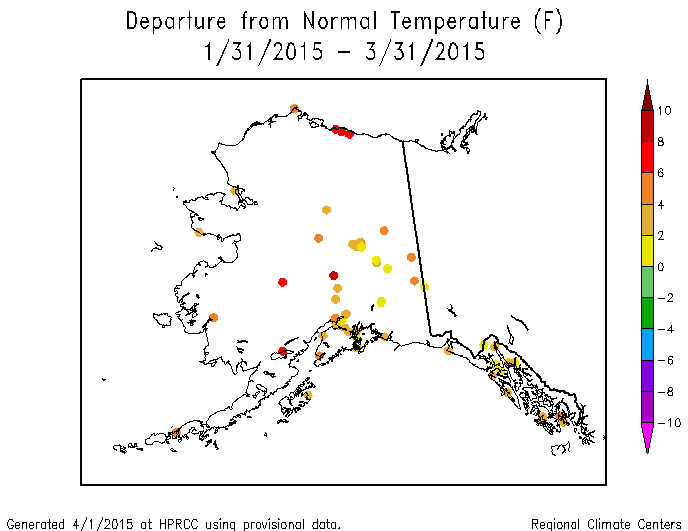
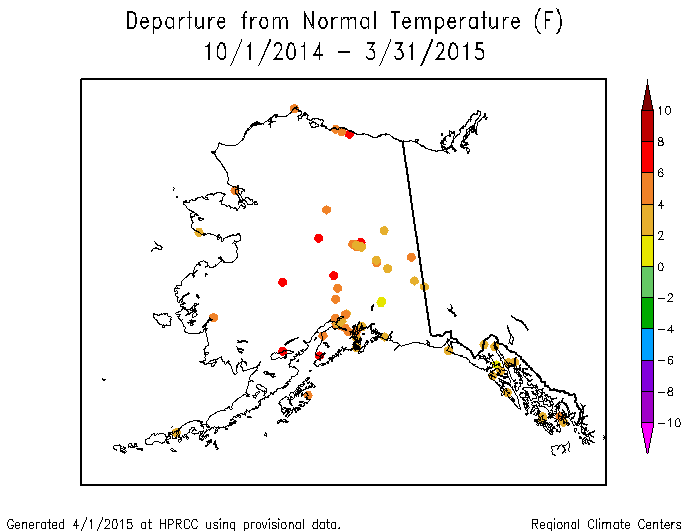
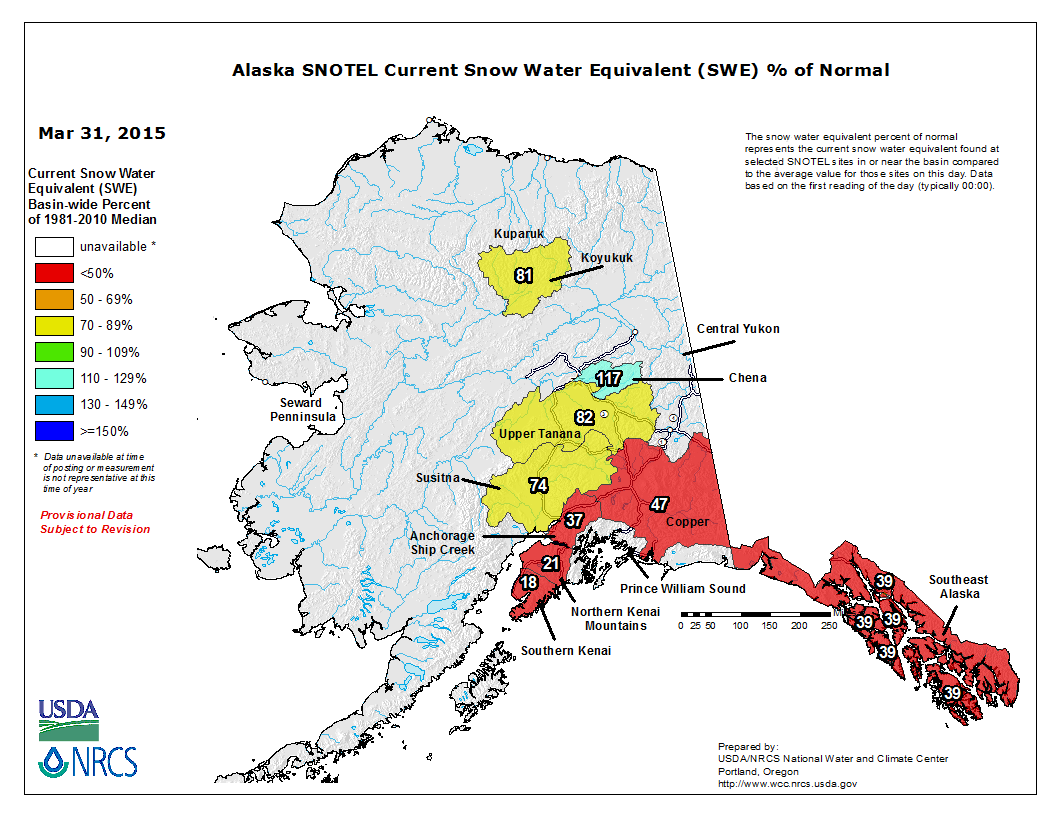
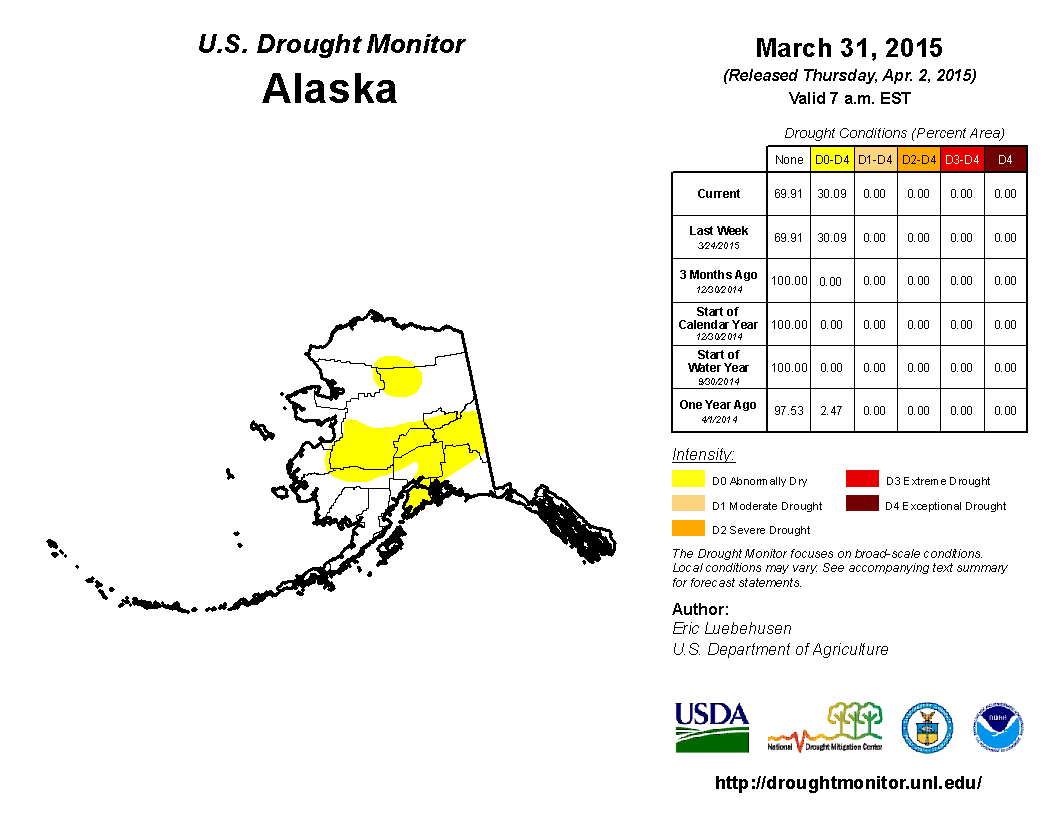
Alaska: March had a mixed precipitation pattern across Alaska. Stations in the southern half of the state were generally drier than normal, while the panhandle and northern stations were generally wetter than normal, both at the lower elevation stations and at the higher elevation (SNOTEL) stations, although the pattern was more mixed at the SNOTEL stations. This pattern was generally consistent for most of the last year (last 2, 3, 6, 9, and 12 months). The pattern was mixed for the last 24 months and predominantly wetter than normal at the 36-month time scale. The persistent upper-level circulation pattern (ridge), which reduced the precipitation, also brought widespread above-normal temperatures for much of the last year (last 1, 2, 3, 6, and 12 months). Concurrent with the below-normal precipitation and above-normal temperatures was a reduction in snowpack and increase in streamflow. Soil moisture models indicated drying soils in the south central and southwest portions of the state. Record low snowpack has occurred in southeastern Alaska, but this is due to above-normal temperatures, not below-normal precipitation. Abnormal dryness covered about a third (30.1 percent) of the state on the March 31st USDM map.
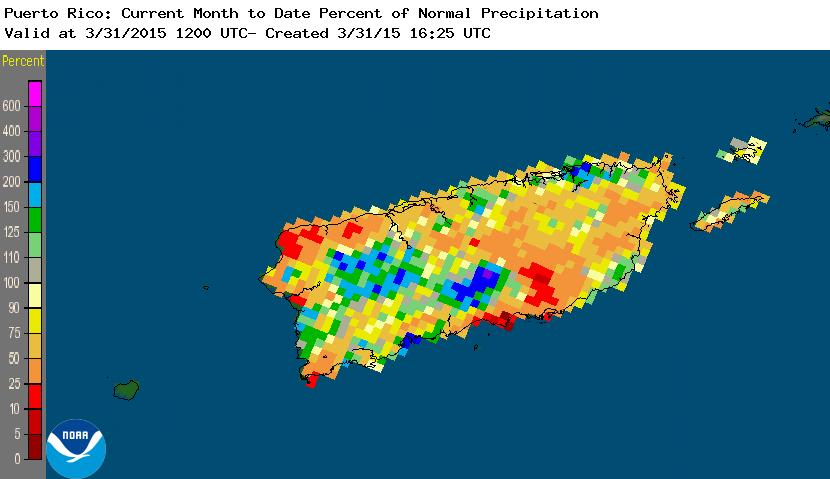
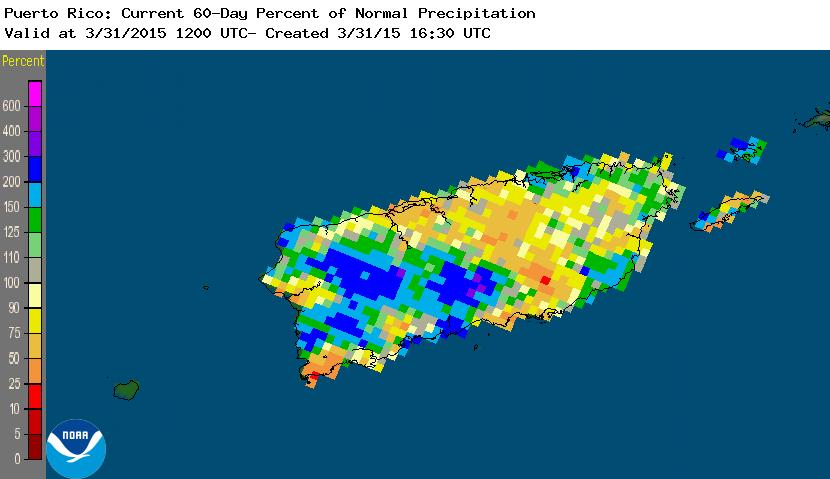
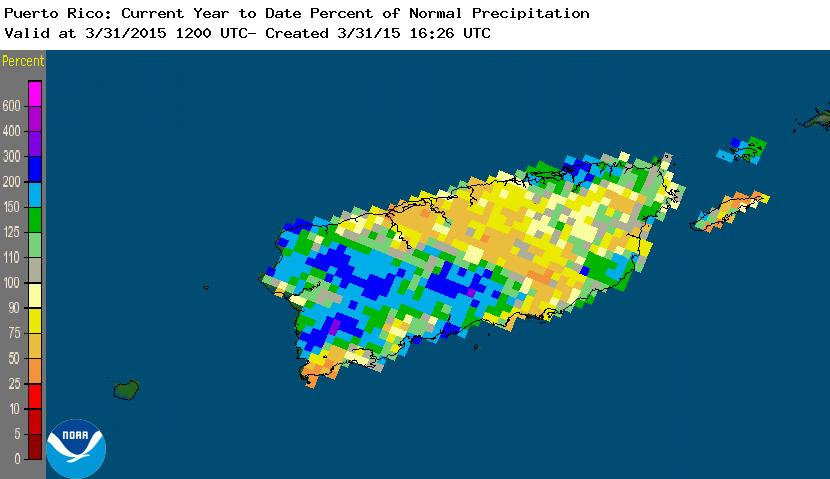
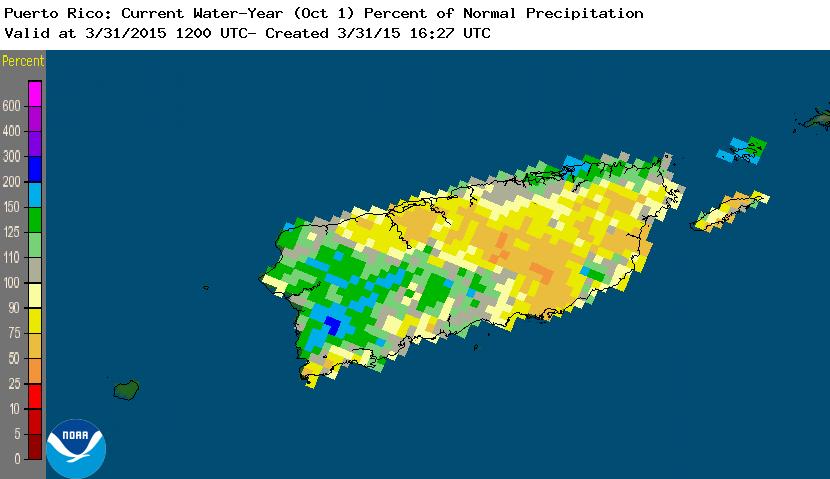
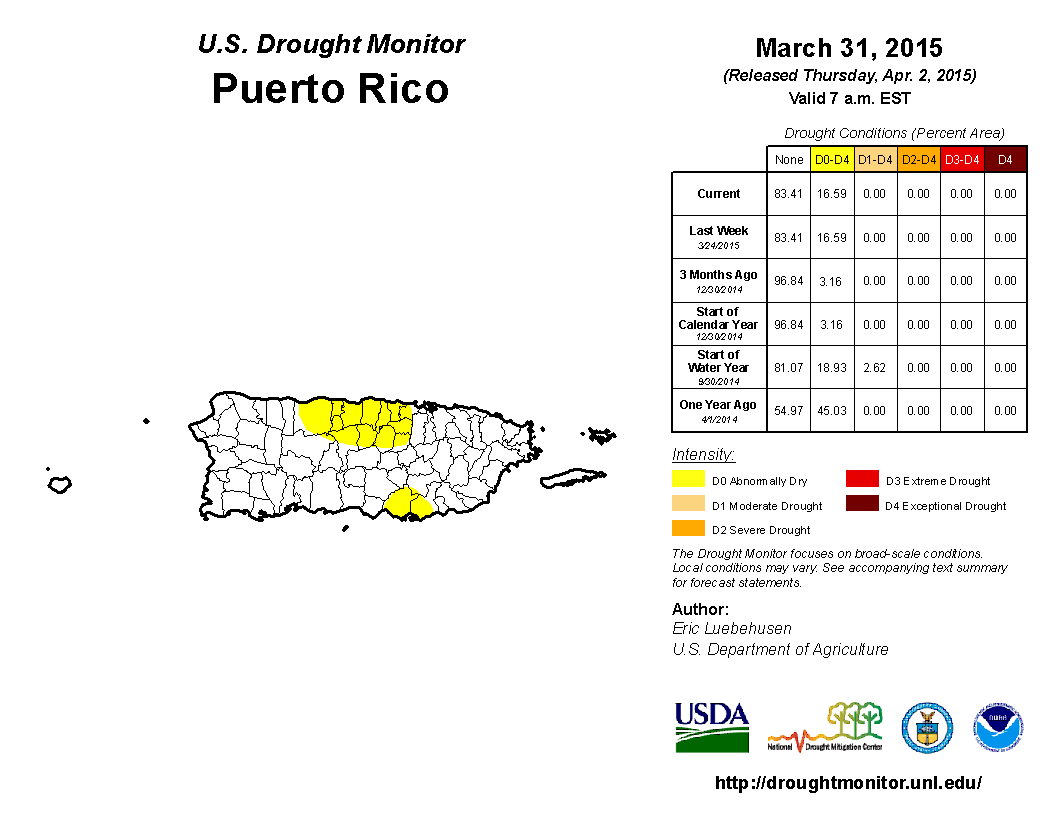
Puerto Rico: March was drier than normal for the northwest coastal, south central, and eastern sections of Puerto Rico. At the two-month time scale, drier-than-normal conditions dominate the north central to south central regions. The drier-than-normal area becomes bigger and extends further south and east at the longer time scales (last 3 to 6 months). The dryness was reflected in low streamflow on some streams. On the March 31st USDM map, abnormal dryness continued for a sixth (16.6 percent) of Puerto Rico.
 |
|
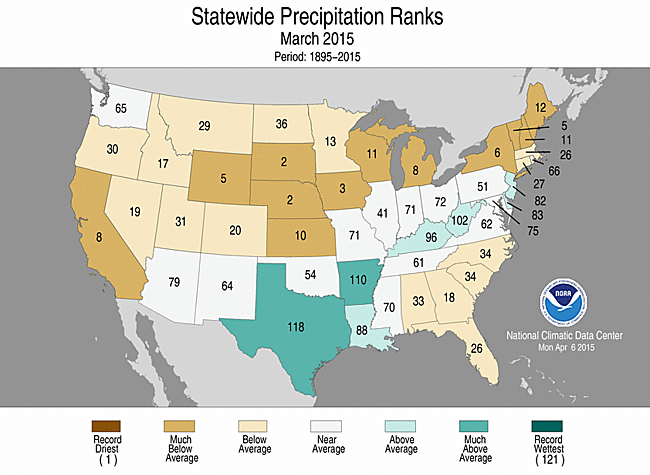
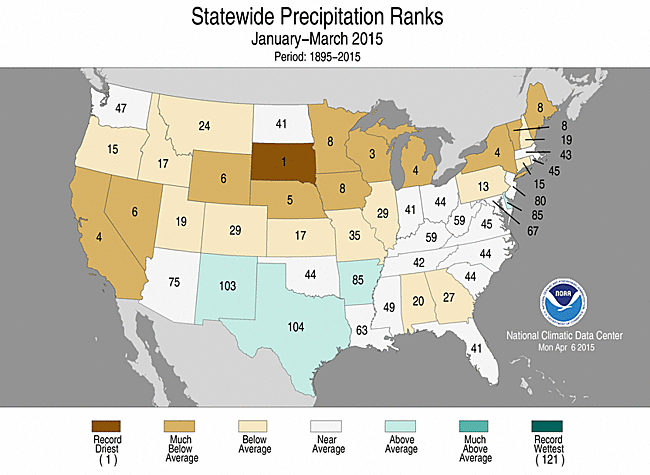
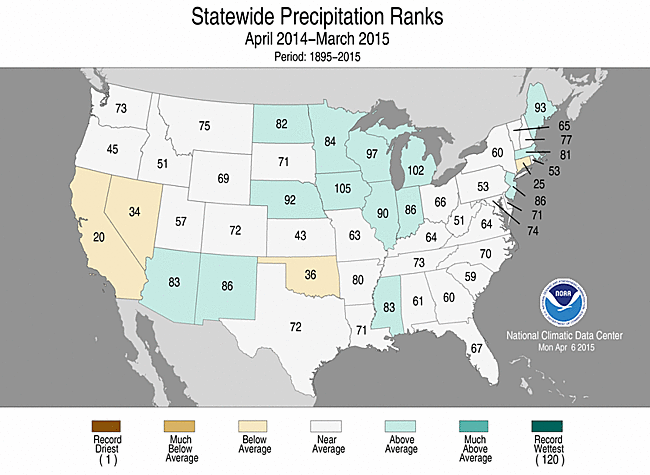
The March precipitation anomaly pattern of dryness in the West, Plains to Midwest, Northeast, and Southeast was reflected in the state ranks, with 27 states ranking in the driest third of the historical record. Nine of those states, including five in the Plains, two in the Northeast, Michigan in the Midwest, and California in the West, had the tenth driest, or drier, March in the 1895-2015 record. Nebraska and South Dakota ranked second driest. The Texas panhandle was very dry, but well-above-normal precipitation to the south and east gave the state a rank of fourth wettest for March 2015.
 |
|
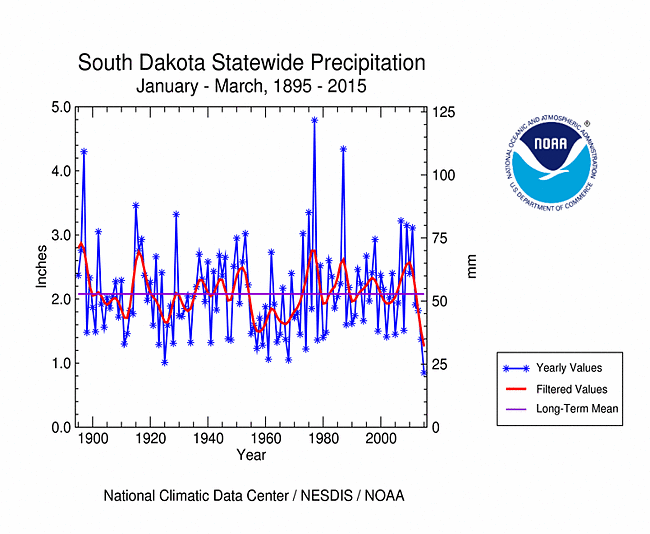
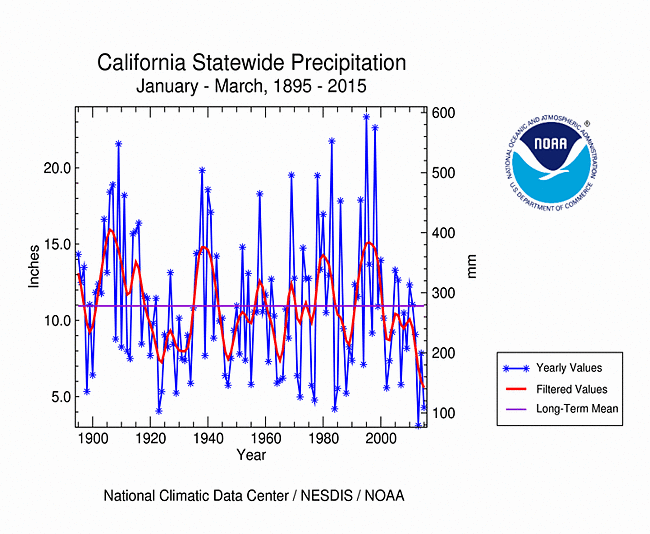
The March pattern of dryness reflected a pattern that has persisted for much of the last three months. For January-March 2015, 25 states ranked in the driest third of the historical record, 12 of which had the tenth driest, or drier, January-March. These included two in the West, three in the Northeast, and seven in the Great Plains to Great Lakes. South Dakota had the driest January-March in the 1895-2015 record, with this year marking the fourth consecutive drier-than-average such three-month period. California ranked fourth driest, with 2015 marking the fourth consecutive much drier-than-average January-March. Seven of the last nine, and 11 of the last 15, years have had a drier-than-average January-March for the state.
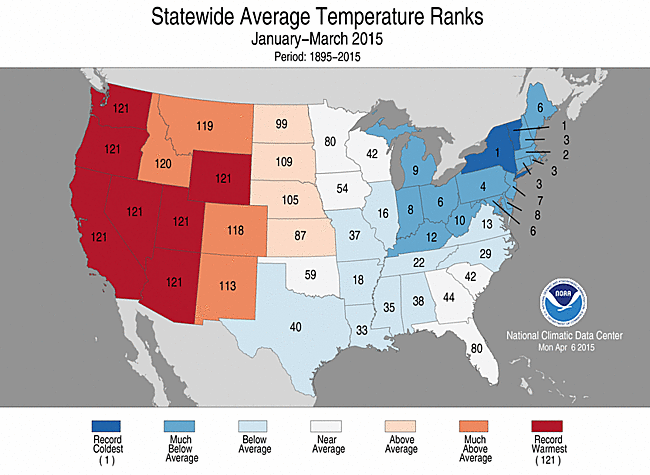
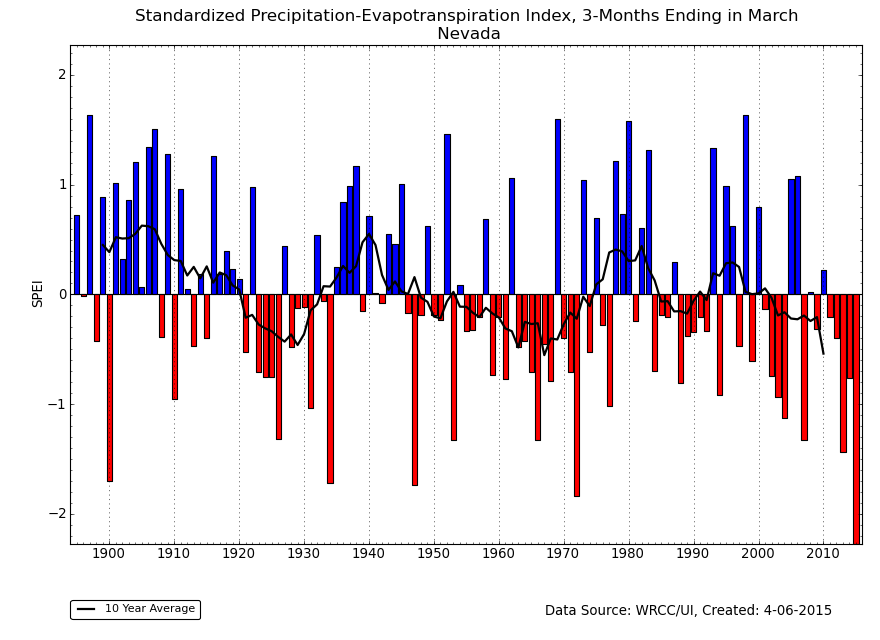
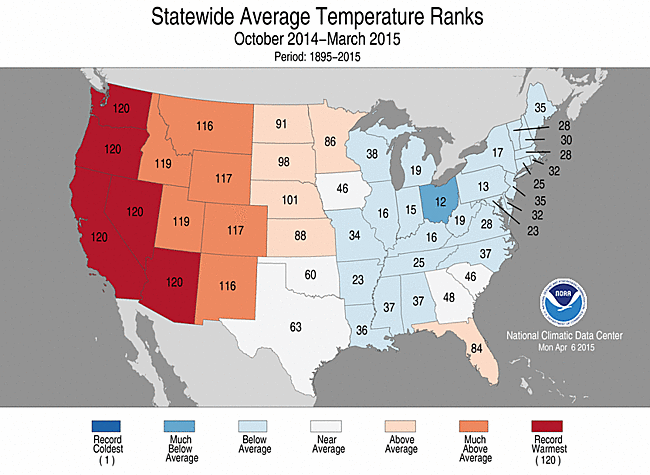
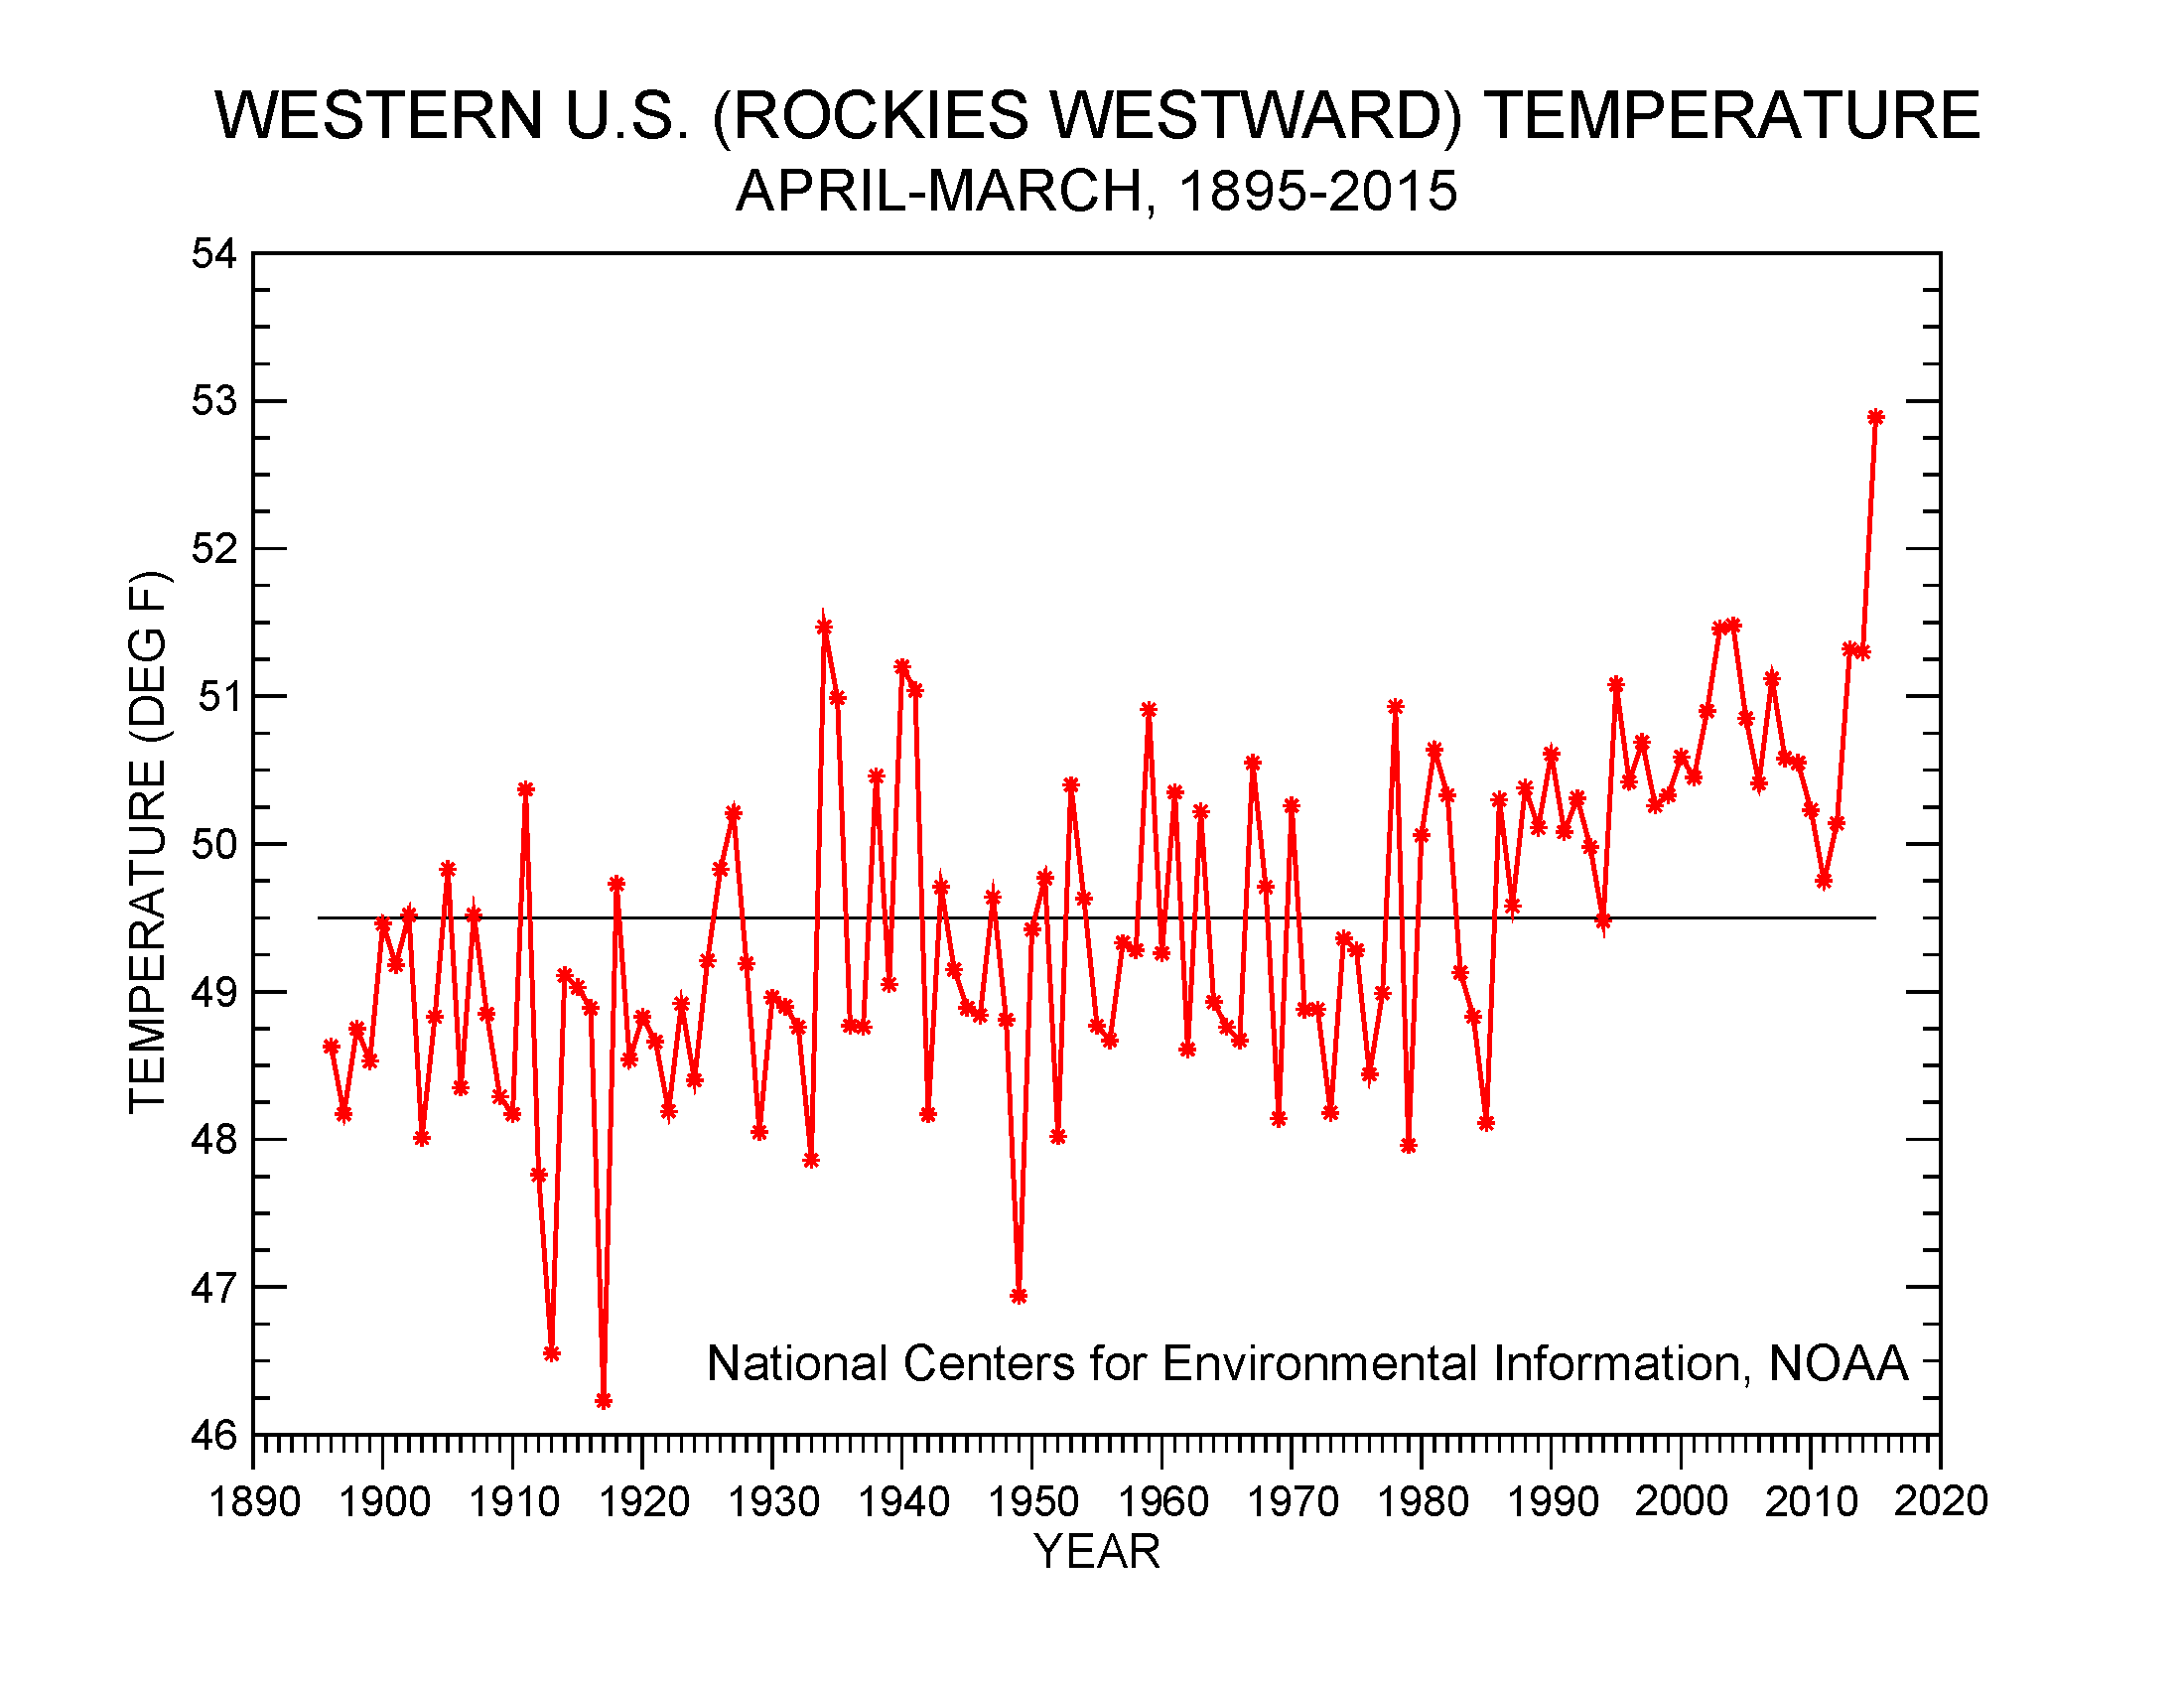
The drier-than-average conditions have been accompanied by much warmer-than-average temperatures. All of the states from the Rockies westward had a top ten warmest January-March, with seven of them ranking warmest on record. When the dryness and heat are integrated together in the SPEI, January-March 2015 ranks as the worst drought on record for Nevada for this time of year.
 |
|
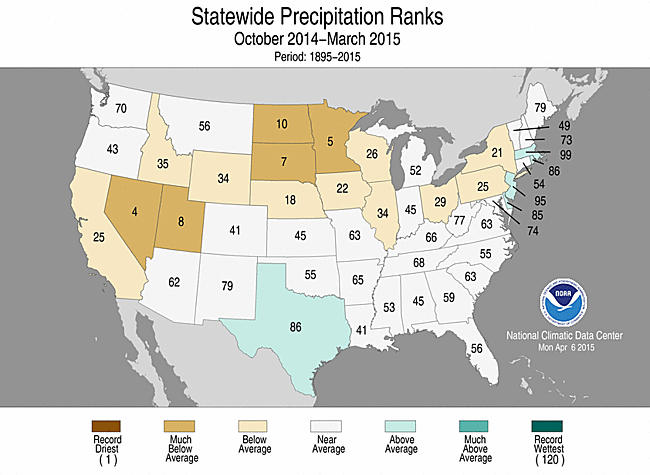
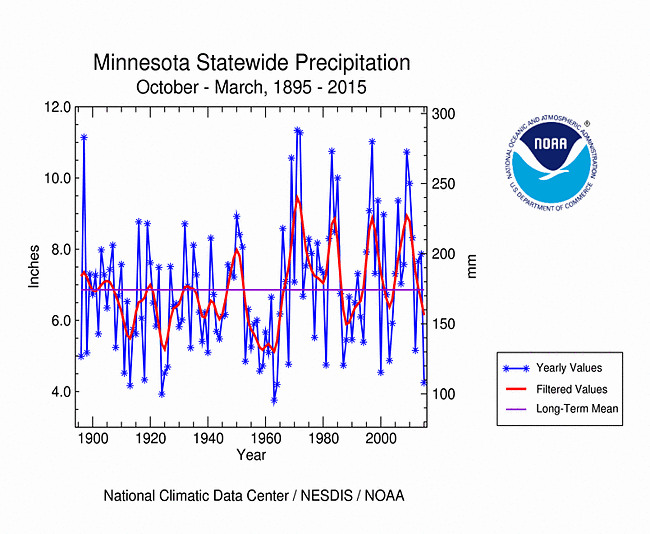
The precipitation pattern for October 2014-March 2015 is similar to those of March and the last three months, except for areas of wetness which tempered the precipitation ranks. Fifteen states ranked in the driest third of the historical record, five of which had the tenth driest, or drier, October-March. These included two in the West and three in the Northern Plains. Nevada had the fourth driest October-March, Minnesota the fifth driest, South Dakota seventh driest, Utah eight driest, and North Dakota tenth driest.
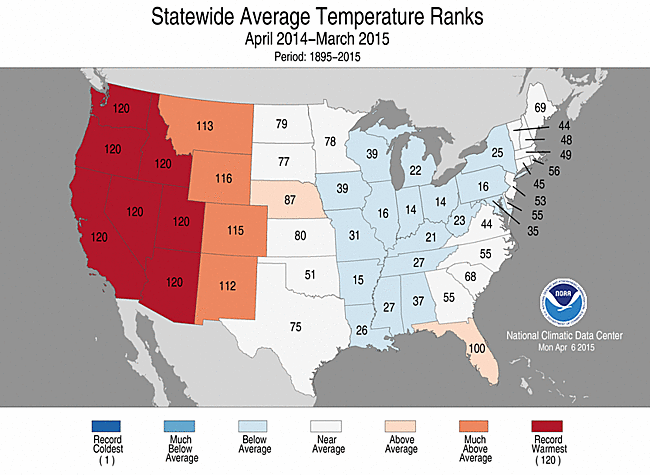
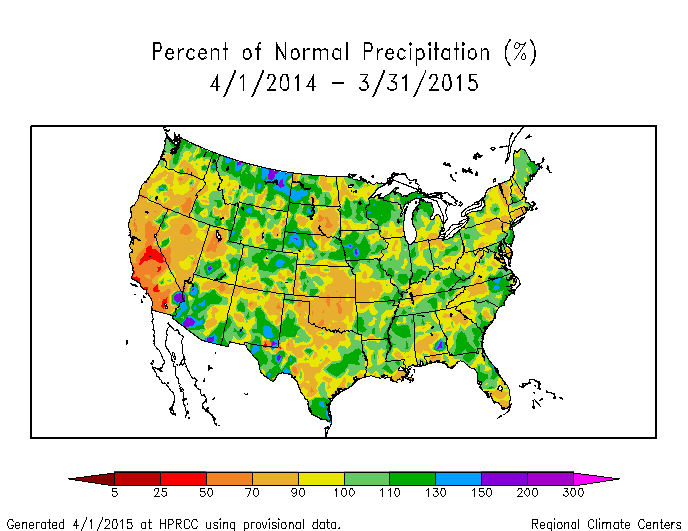
Precipitation was more widespread over the last 12 months, with only four states ranking in the driest third of the historical record for April 2014-March 2015. These included California, Nevada, Oklahoma, and Connecticut. Temperatures were record warm across much of the West for the last six to 12 months. The combination of dryness and record heat gave California the second worst SPEI for April 2014-March 2015, with last year (April 2013-March 2014) being the worst.
|
|
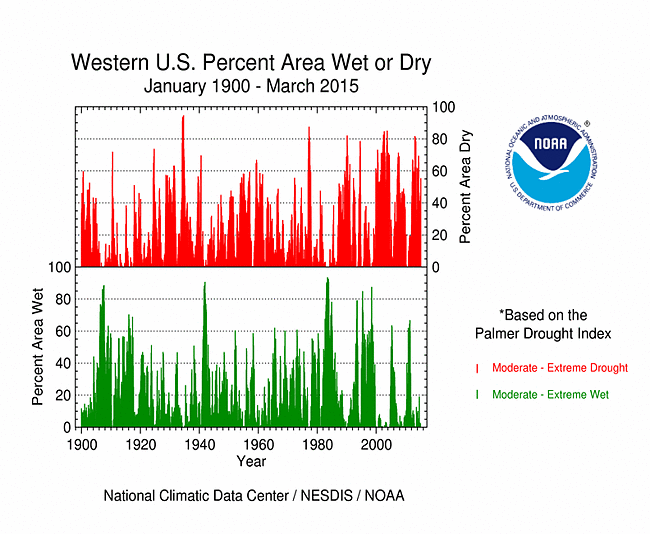
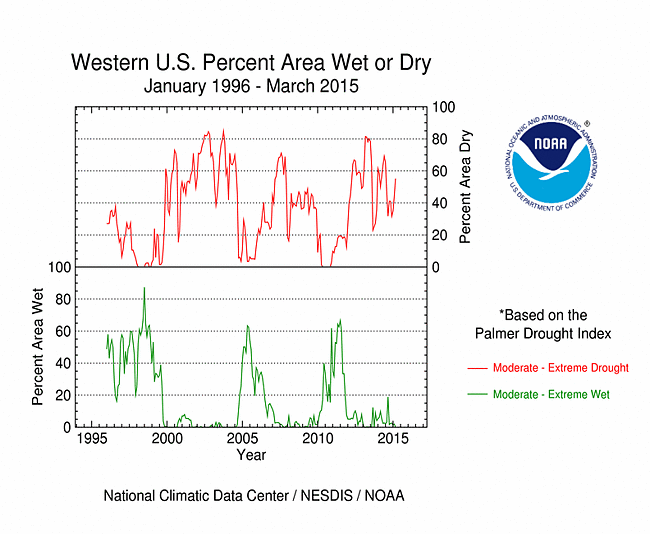
Percent area of the Western U.S. in moderate to extreme drought, January 1900 to present, based on the Palmer Drought Index.
As noted above, dry weather has dominated the West for much of the last three years, resulting in significant hydrological (low lake, reservoir, and stream levels) and agricultural impacts. According to the USDM, 59.8 percent of the West was experiencing moderate to exceptional drought at the end of March, which is about the same as the previous month. The Palmer Drought Index percent area statistic for the West was 55.2 percent, an increase of about 11 percent compared to the previous month.
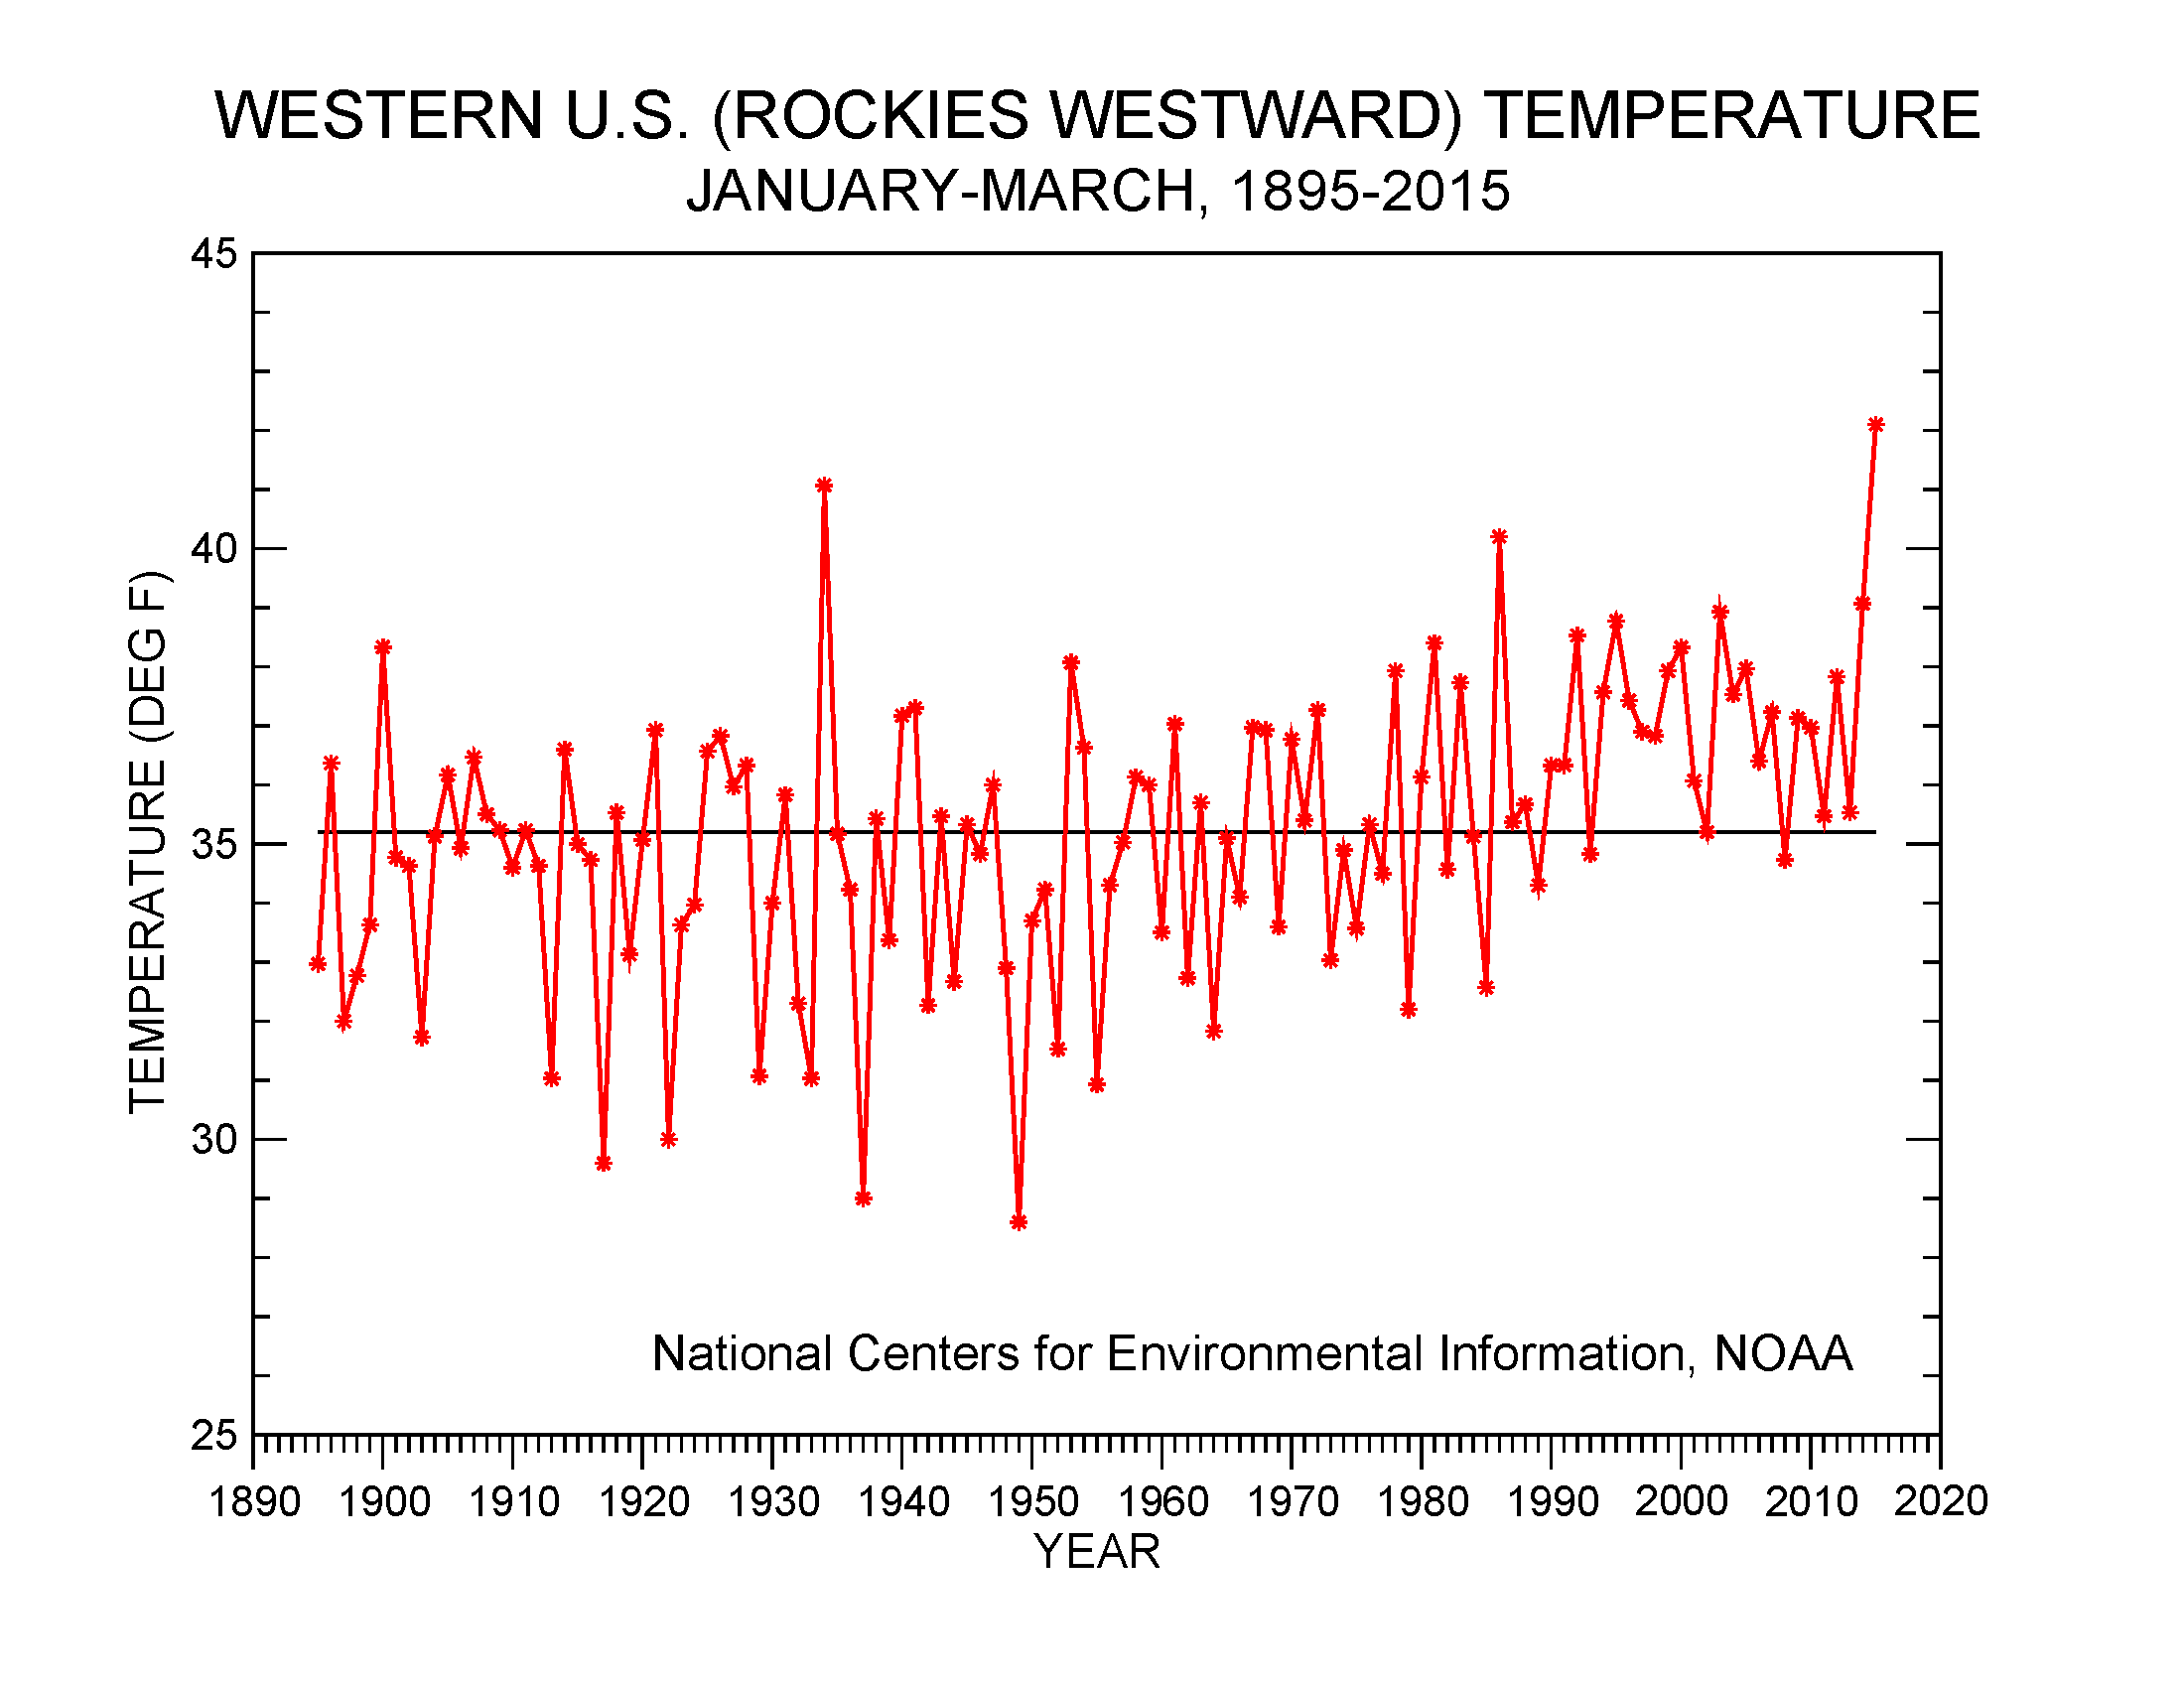
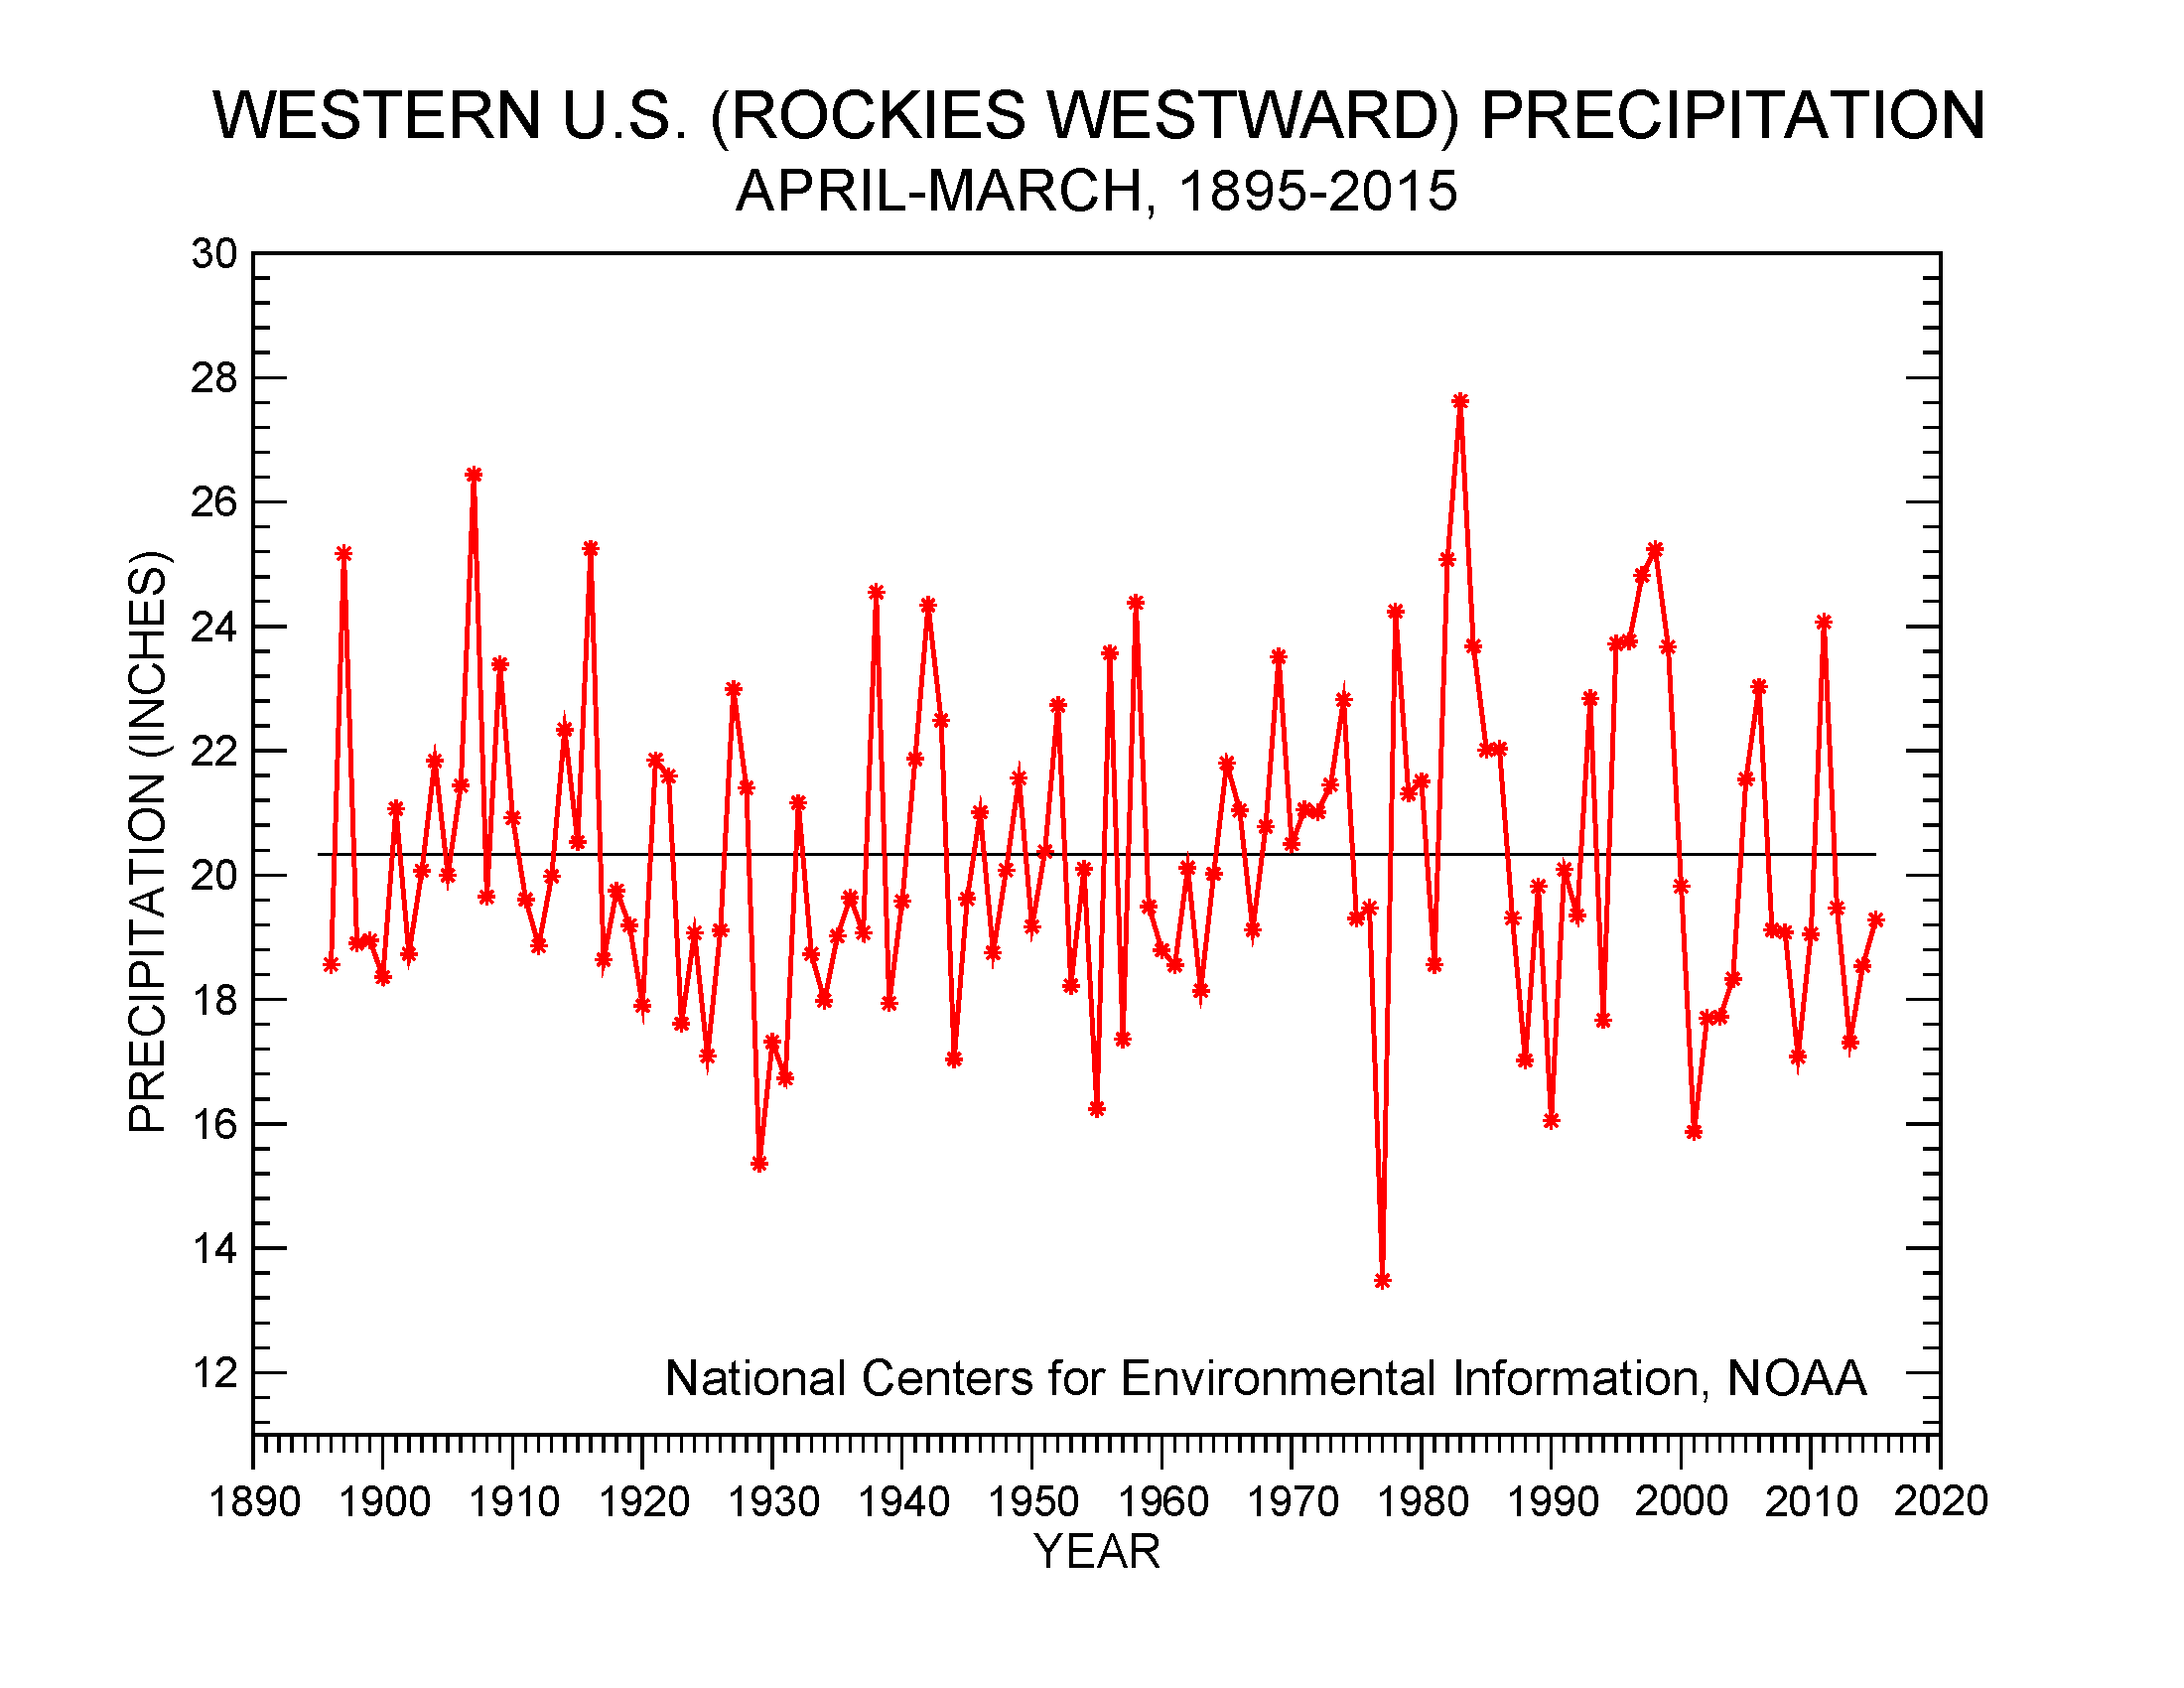
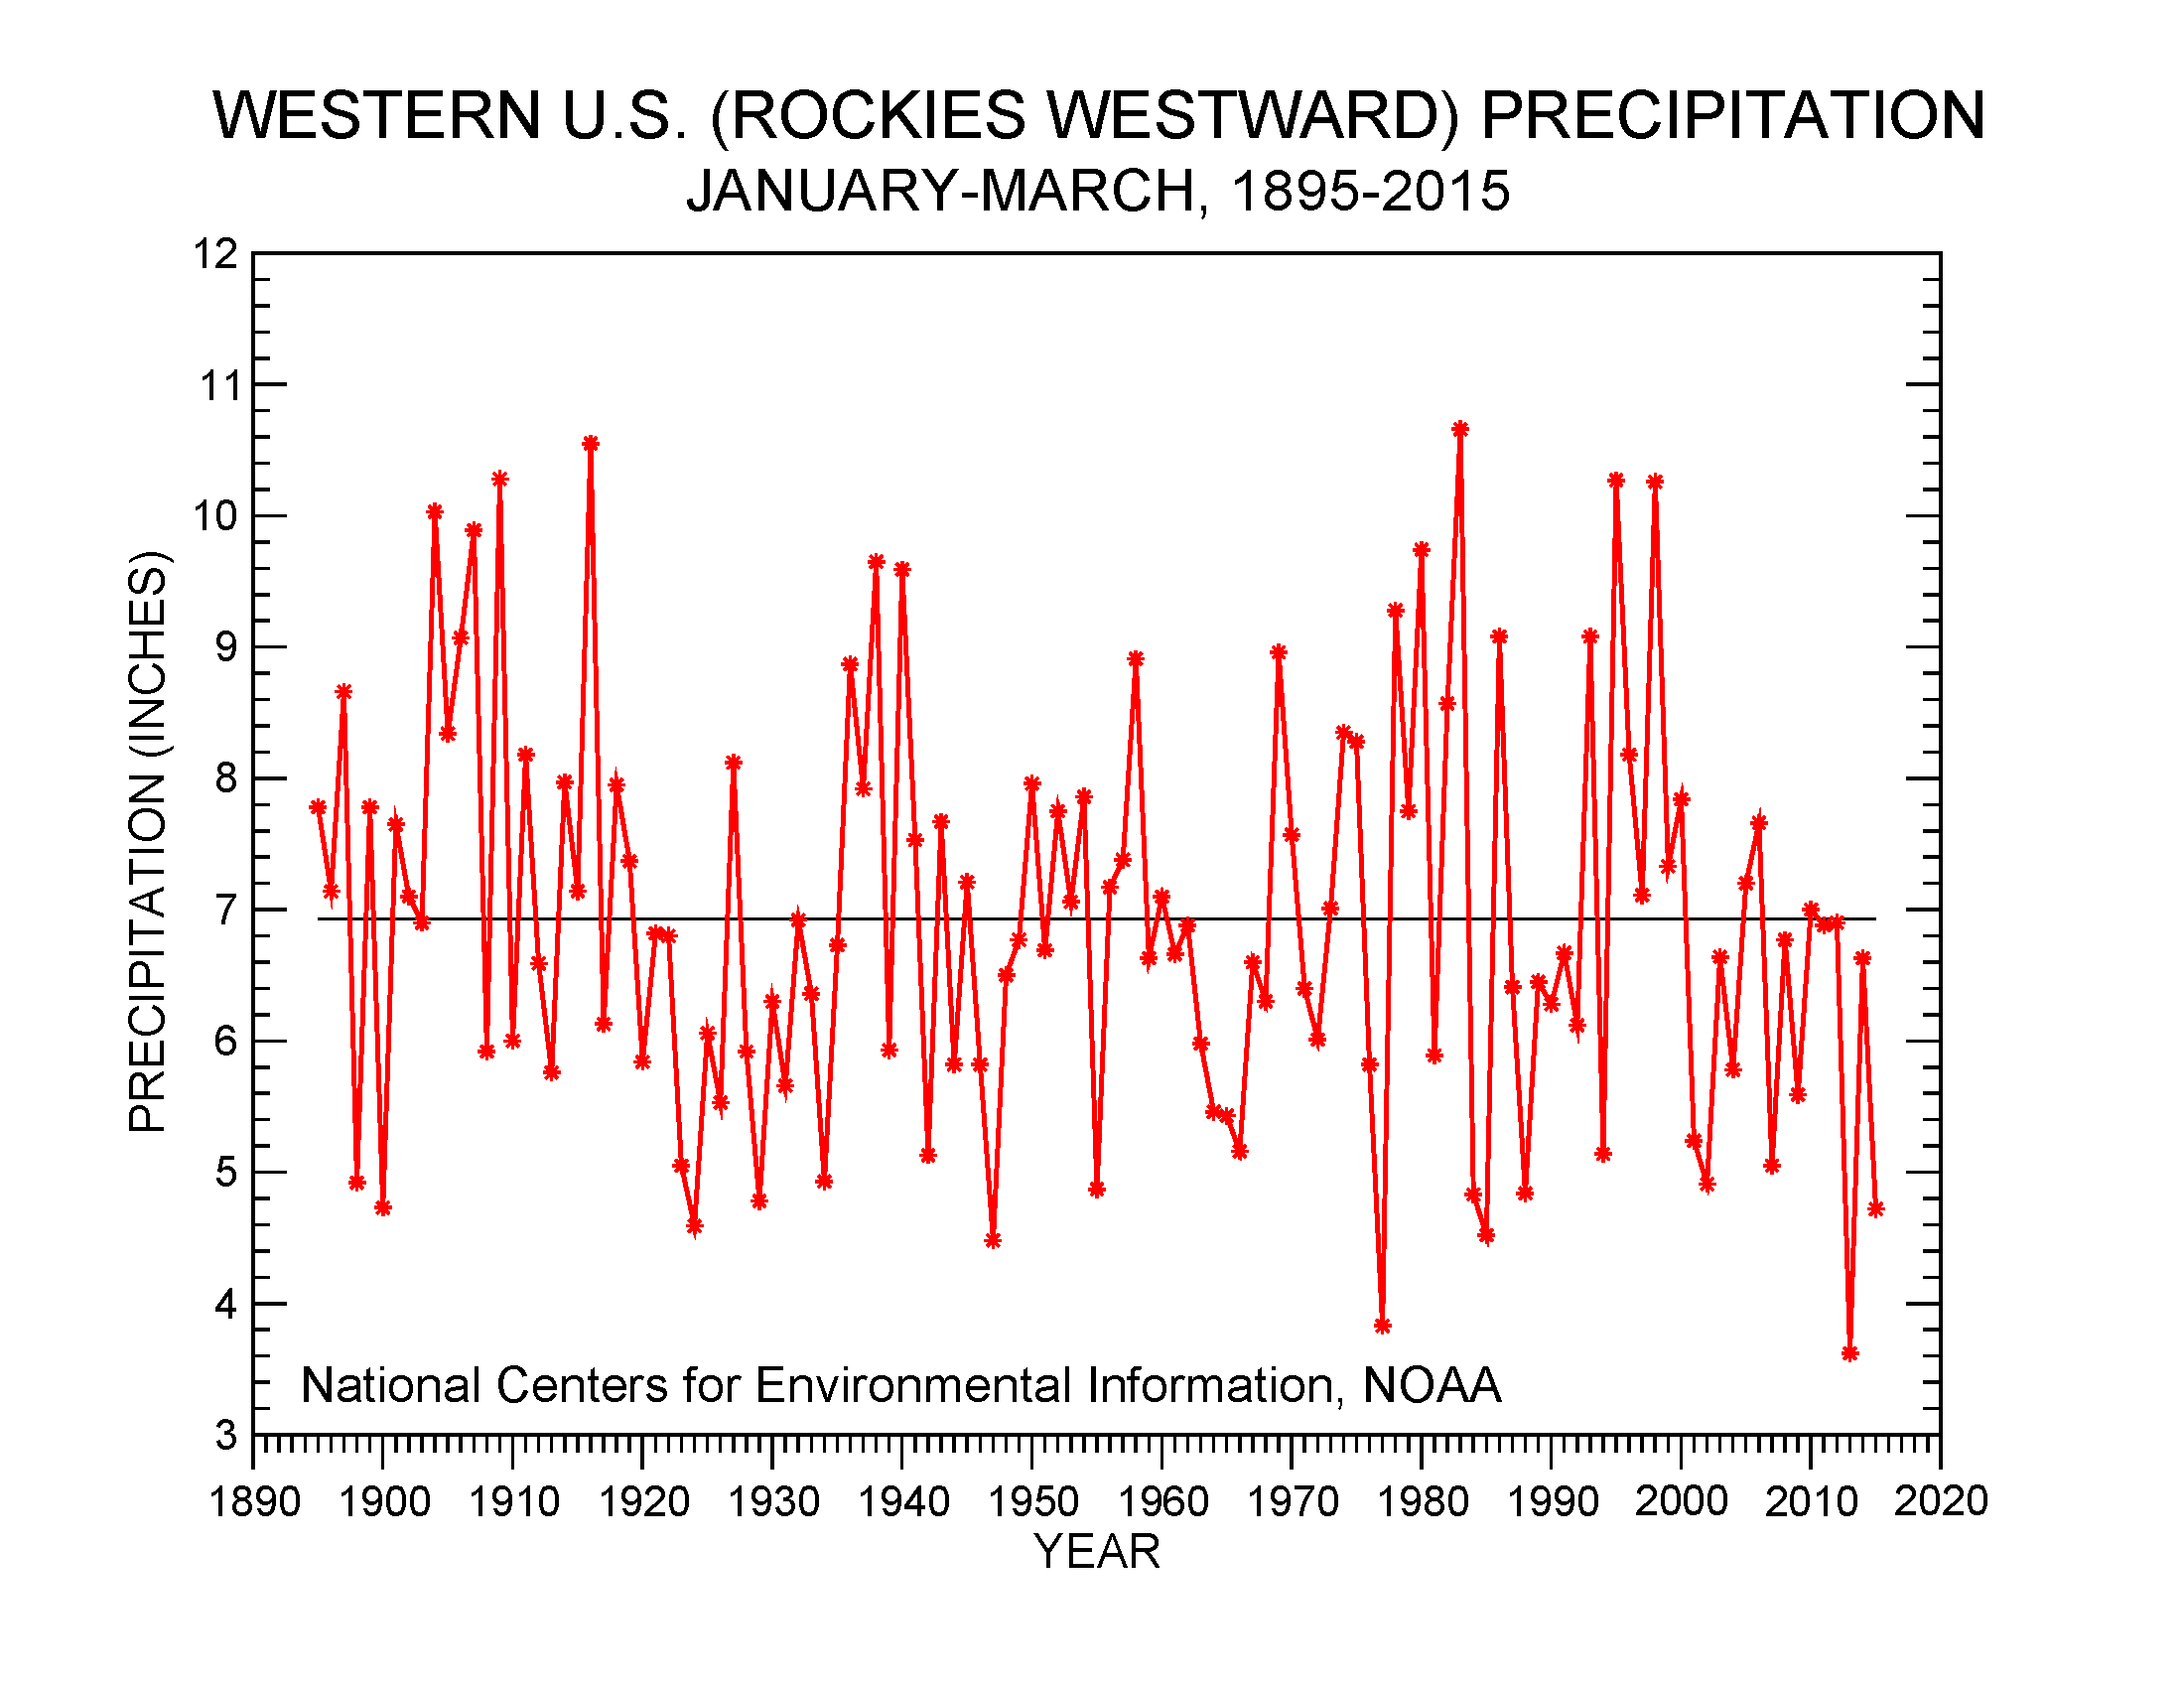
As noted earlier, record warm temperatures have been widespread and persistent across the West. When temperatures are aggregated across the region (from the Rockies westward) and across time, 2015 and 2014-2015 rank as record warm regionwide for the year to date (January-March) and the last 12 months (April-March). January-March and April-March have not been the driest such periods in the 1895-2015 record, although they have been persistently dry. January-March has been near to much drier than average for 13 of the last 15 years, while April-March has been drier than average for 13 of the last 16 years.
|
|
|
|
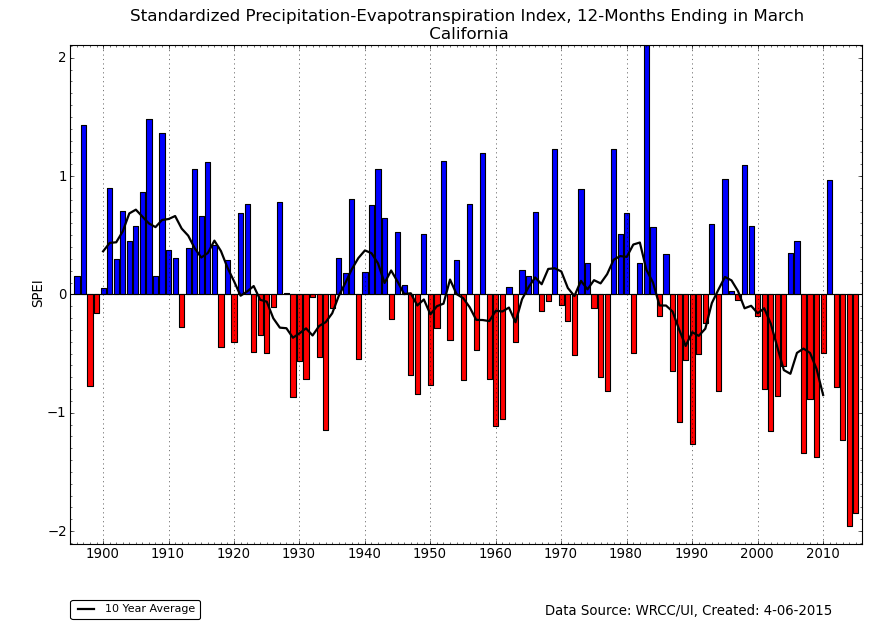
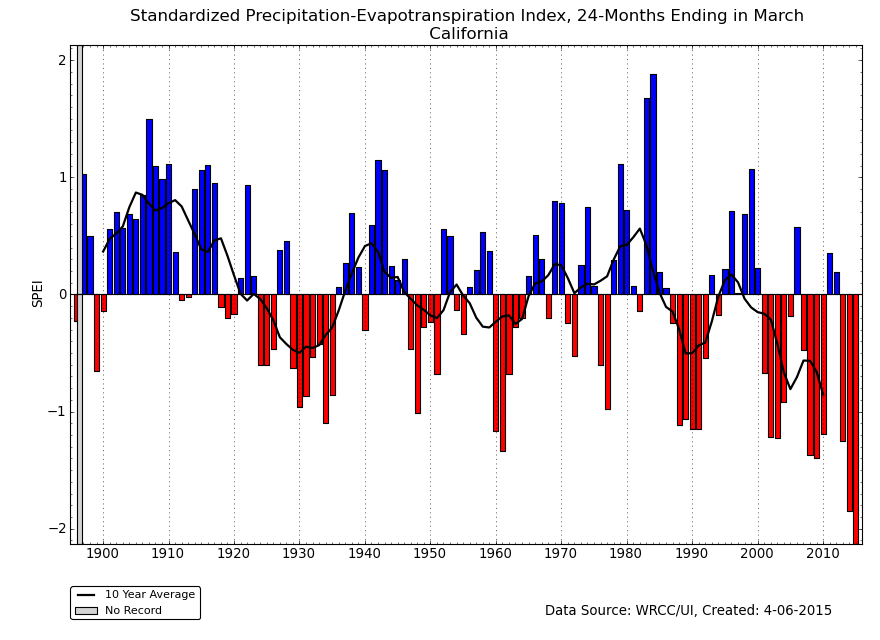
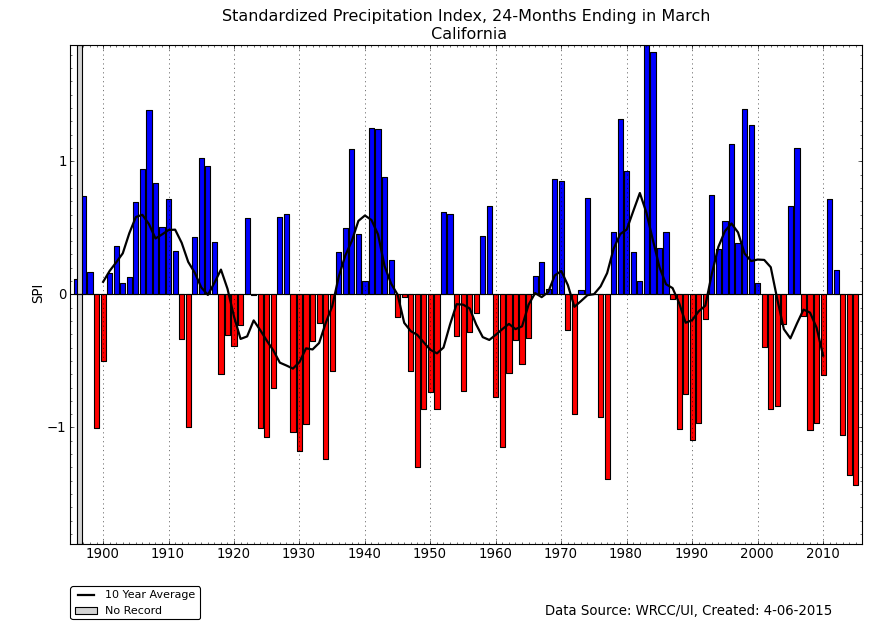
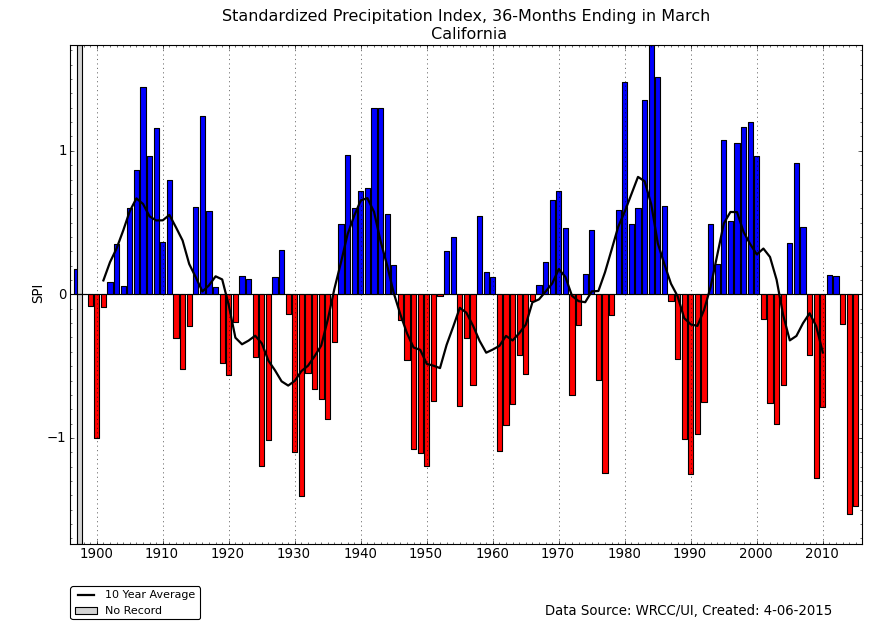
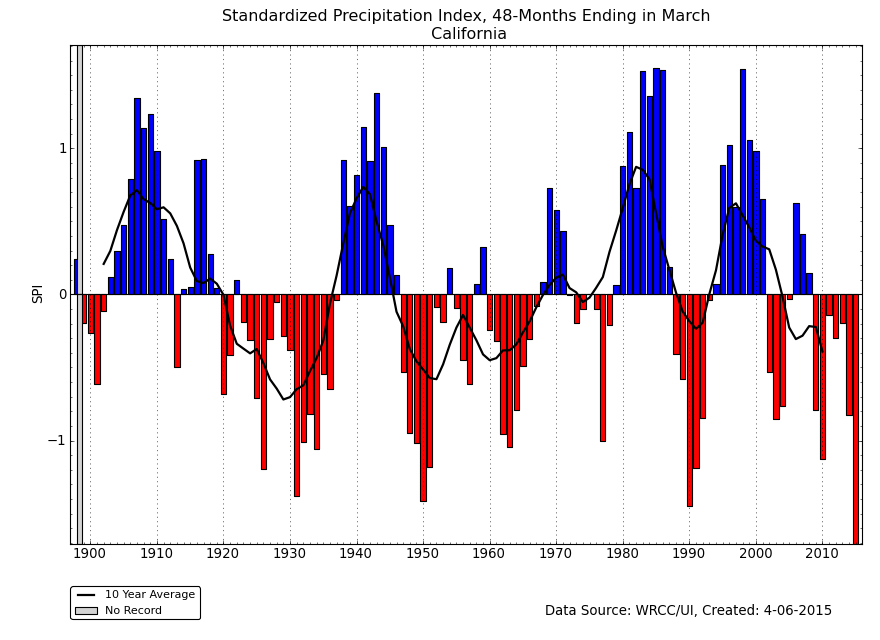
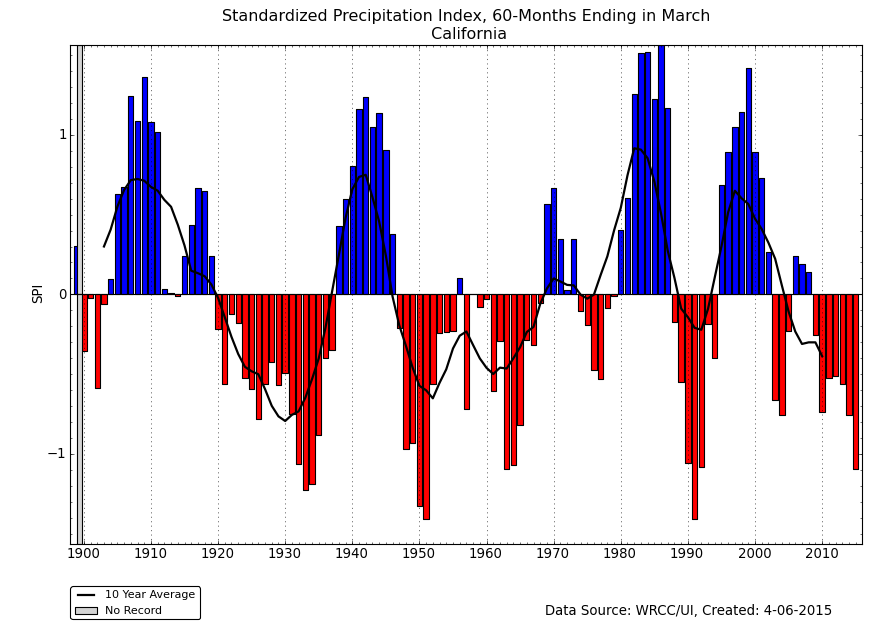
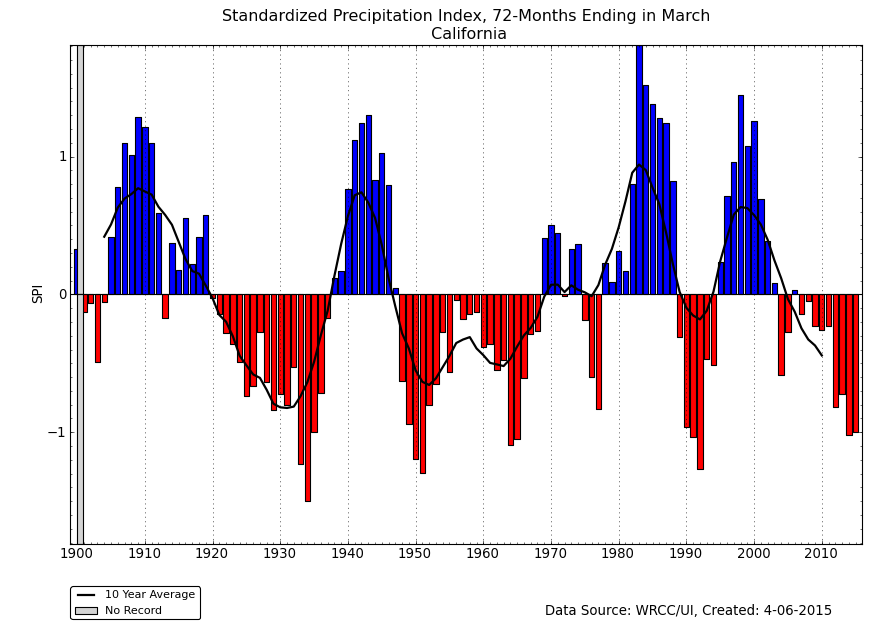
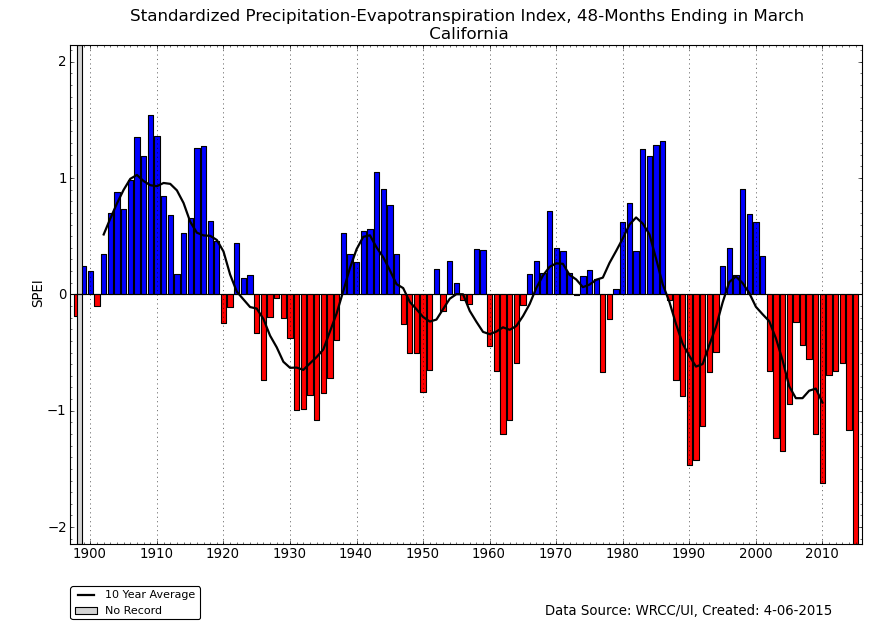
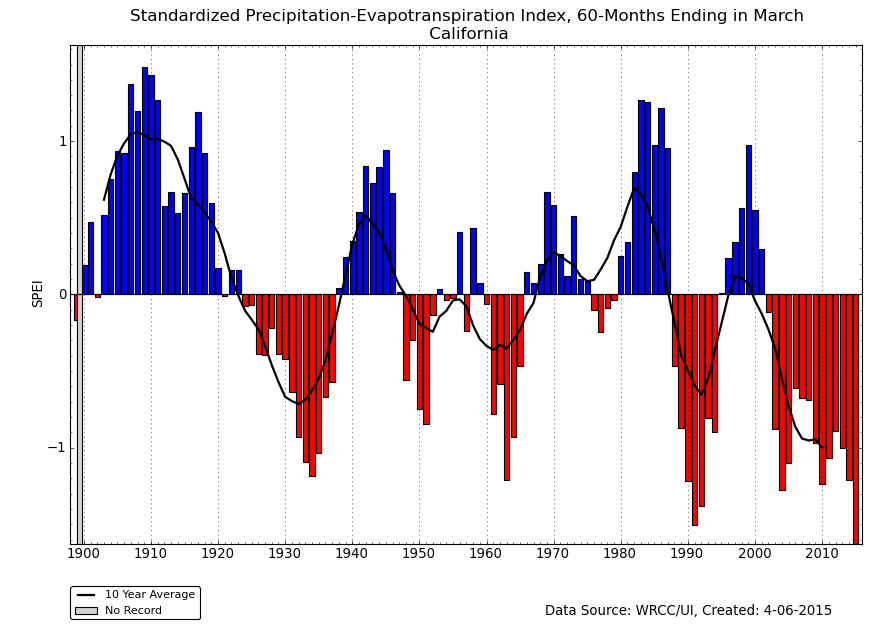
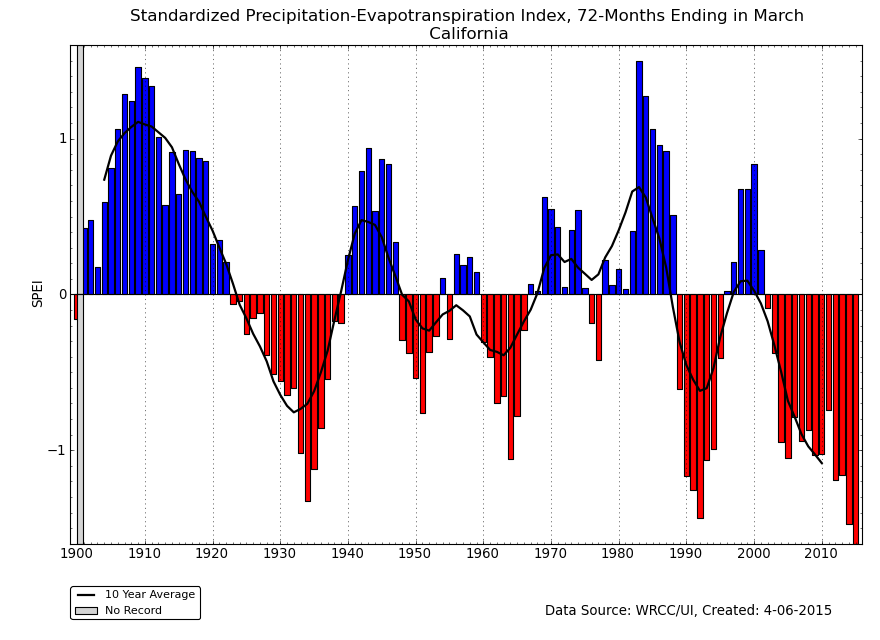
As mentioned earlier, the record warm temperatures in the West during the last several years have increased evaporation and exacerbated the drought conditions, as well as desiccated the mountain snowpack. In California, April 2013-March 2015 has been the driest such 24-month period on record, as seen by the 24-month SPI, but April 1975-March 1977 was a close second. The 24-month SPEI, which incorporates both temperature and precipitation, for April 2013-March 2015 also ranked as the most extreme on record, but it far surpassed the 1975-77 value and all other values in the historical record. The lack of precipitation for the last several years has given the state an SPI rank of second driest for the last 36 months, driest for the last 48 months, top ten driest for the last 60 months, and top 20 for the last 72 months. When temperature-defined moisture demand is included via the SPEI, the state has a rank of driest for the last 36, 48, 60, and 72 months.
 |
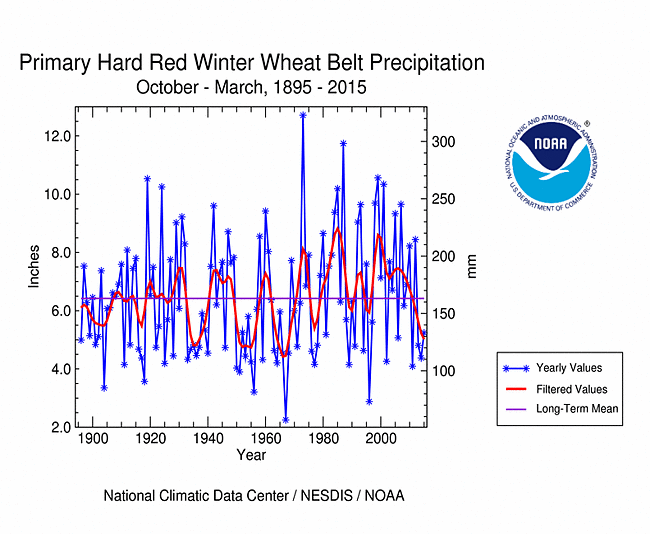 |
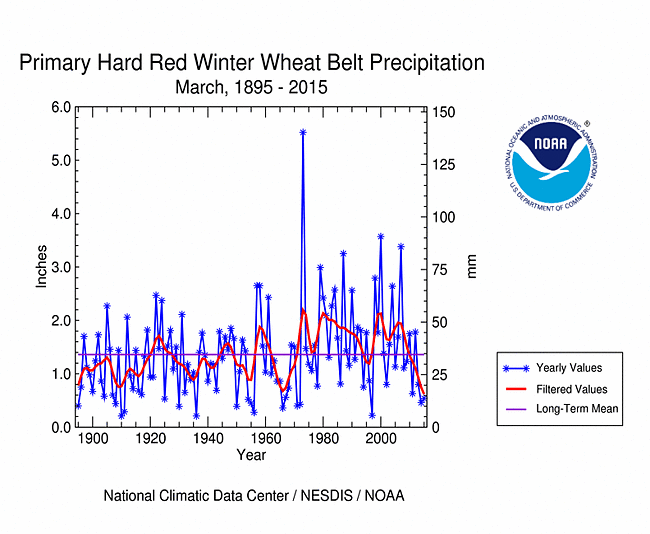
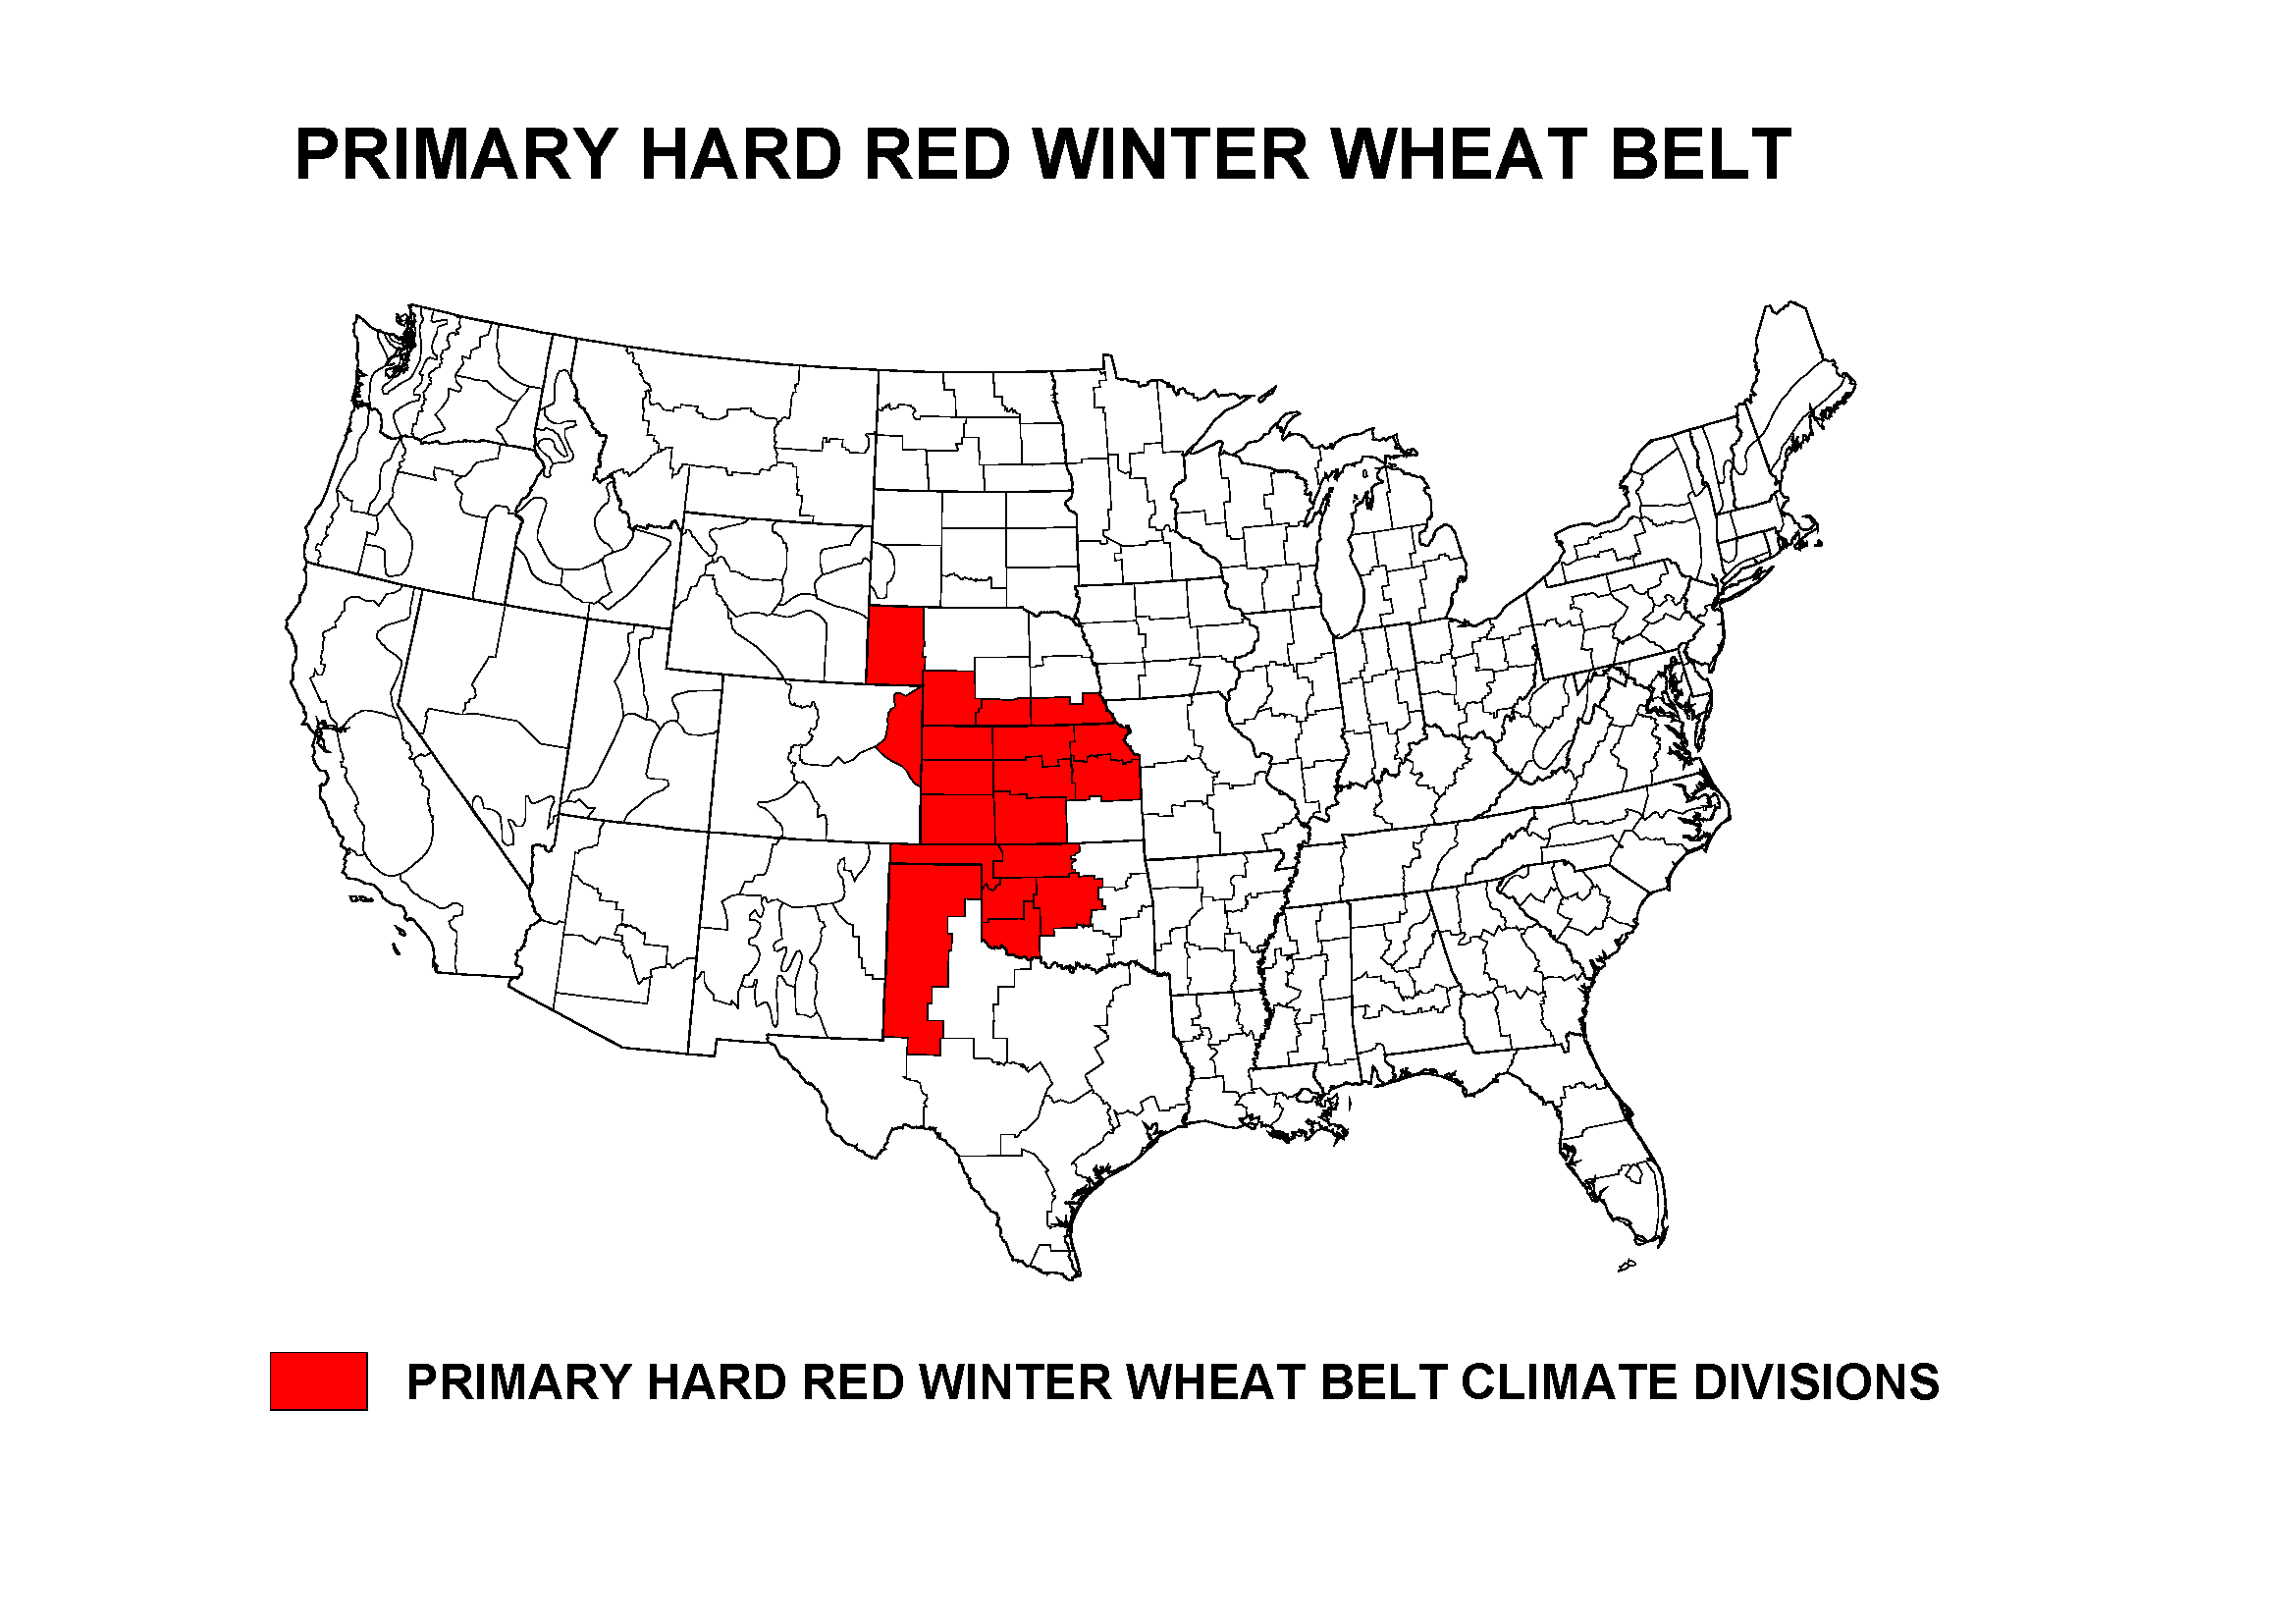
October marks the start of the growing season for the Primary Hard Red Winter Wheat agricultural belt. Most of the region was drier than normal this month, with March 2015 ranking as the 17th driest and 20th warmest March in the 1895-2015 record, regionwide. The growing season to date ranked as the 46th driest and 24th warmest October-March in the 120-year record. The last three growing season-to-date periods have averaged drier than normal, regionwide.
 |
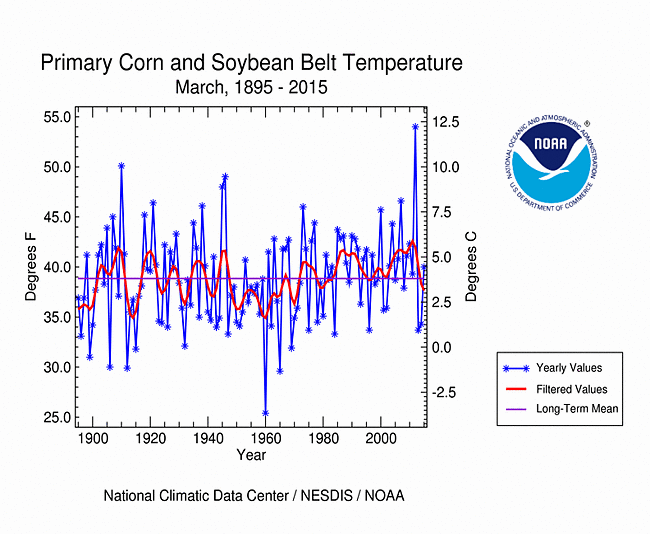 |
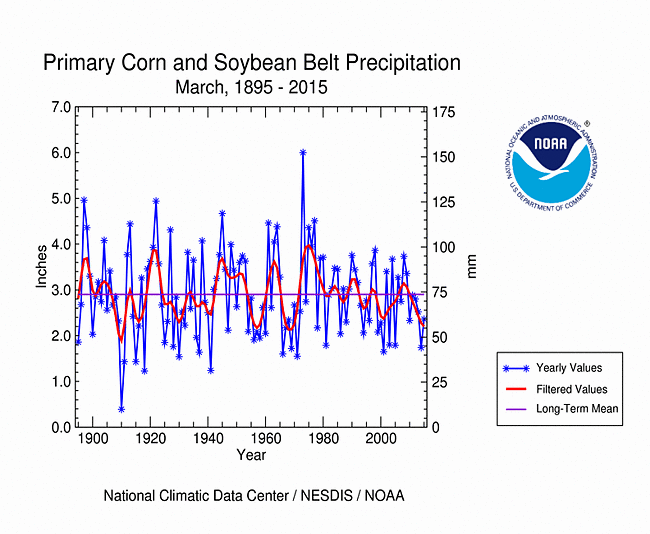
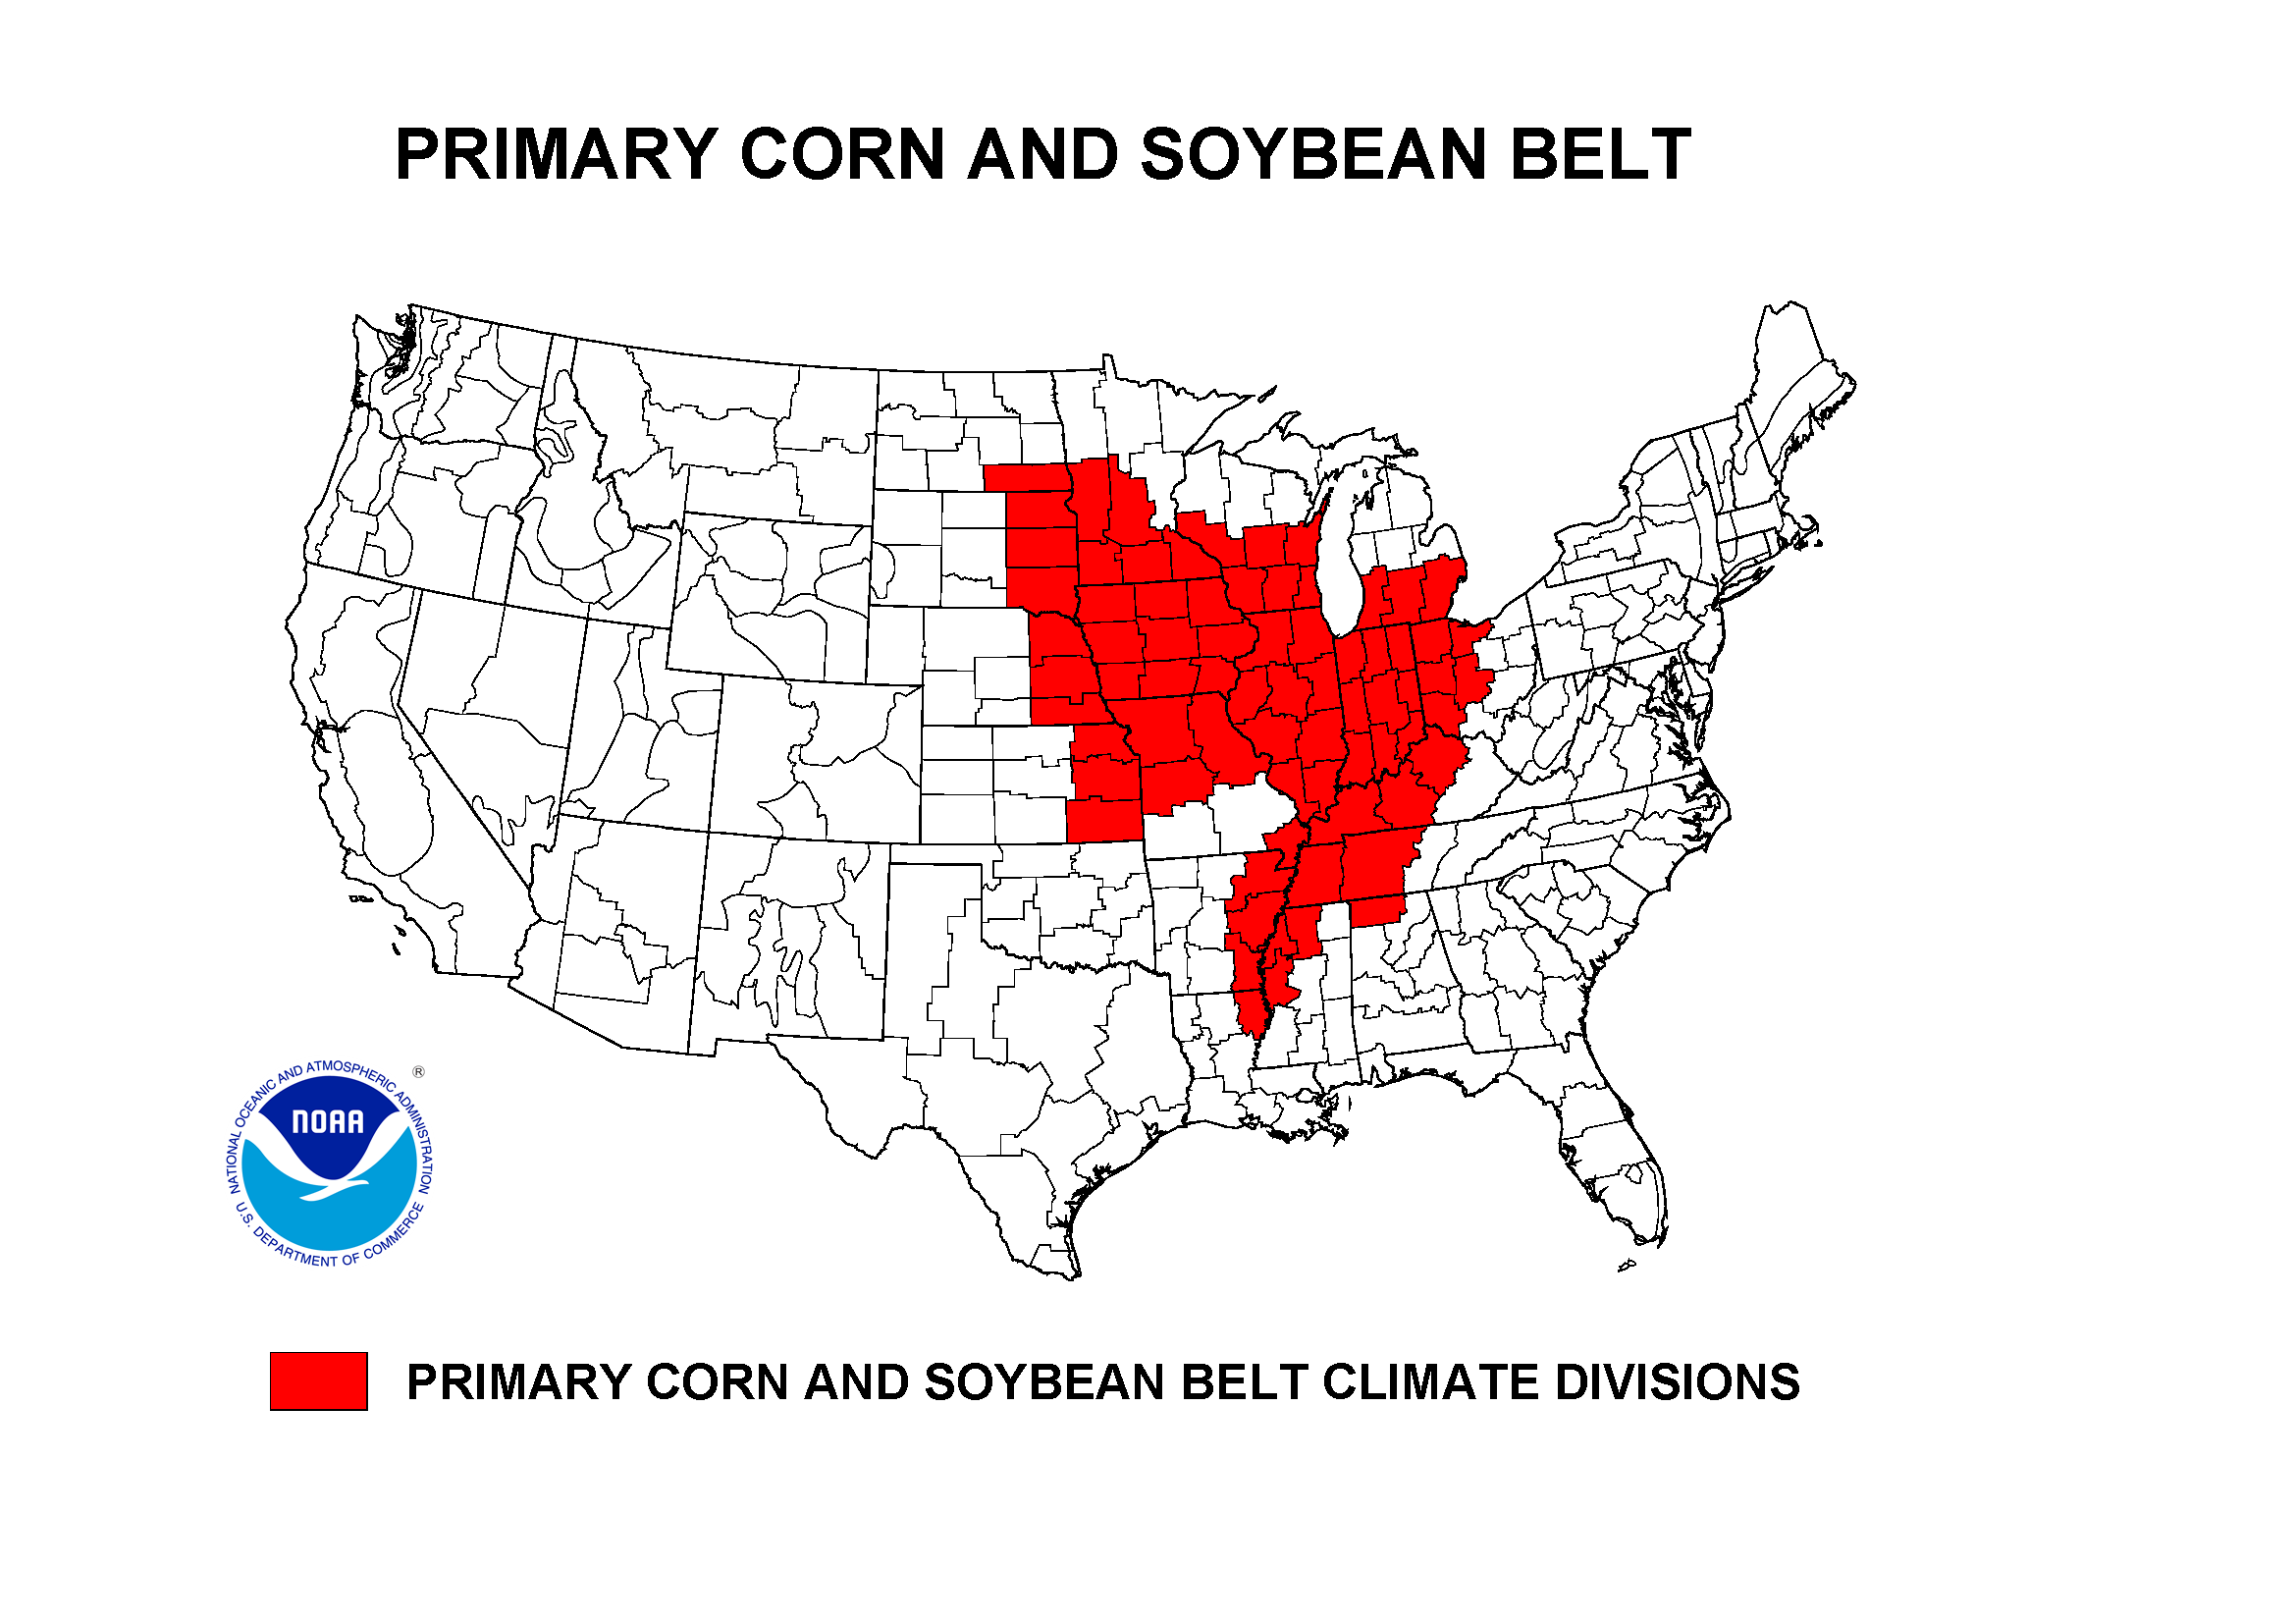
March serves as the beginning of the growing season for the Primary Corn and Soybean agricultural belt. Most of the region was drier than normal this month, with March 2015 ranking as the 41st driest and 51st warmest March on record, regionwide. The last three Marches were drier than average, and the last six have been near to drier than average.
NOAA Regional Climate Centers:
A more detailed drought discussion, provided by the NOAA Regional Climate Centers and others, can be found below.
West
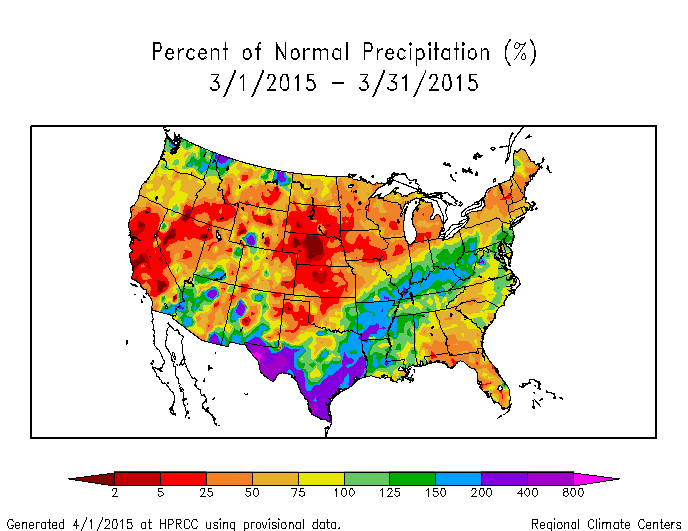
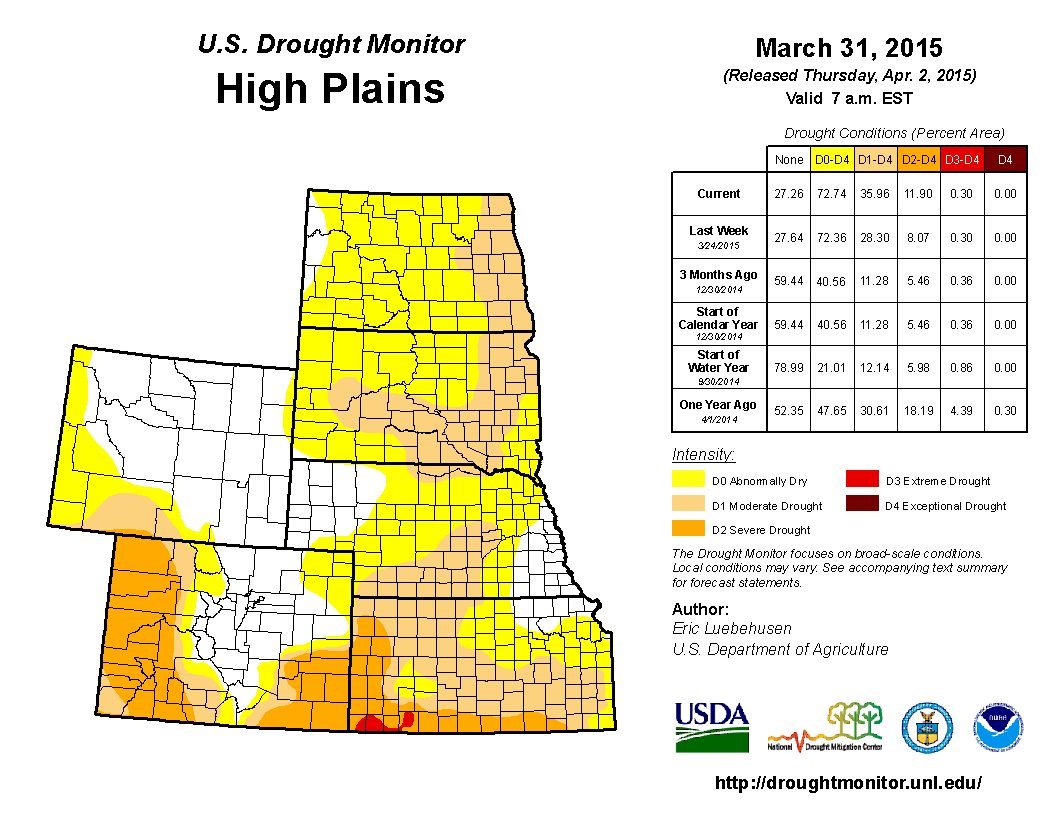
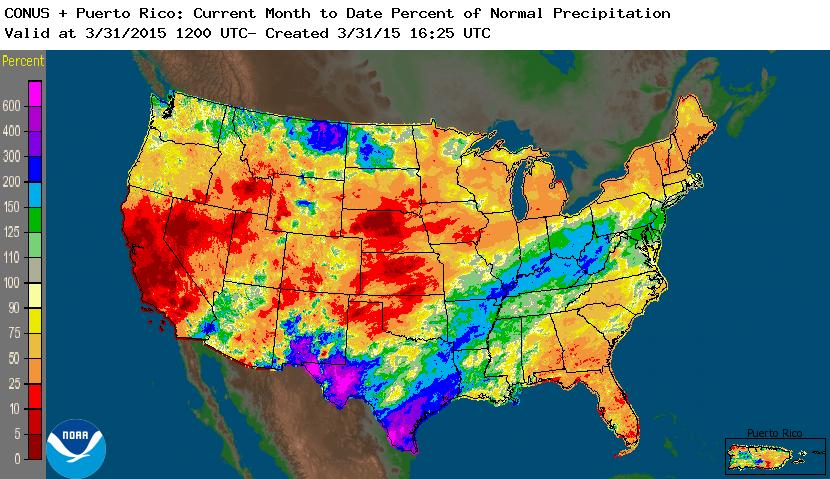
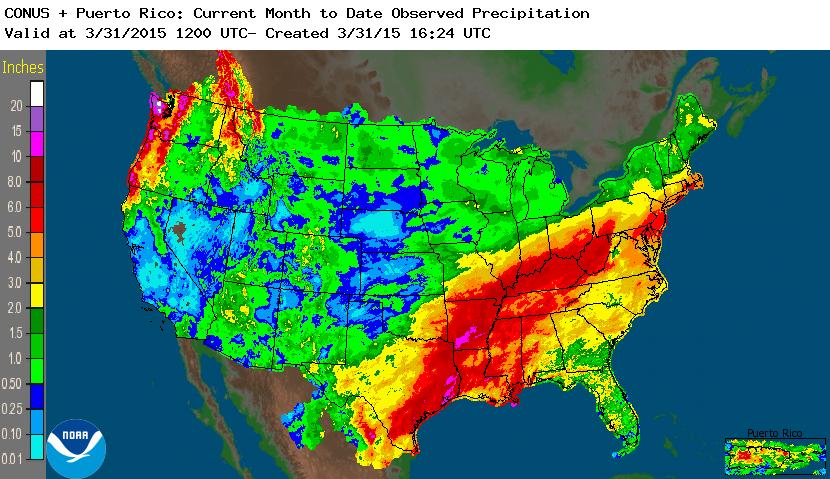
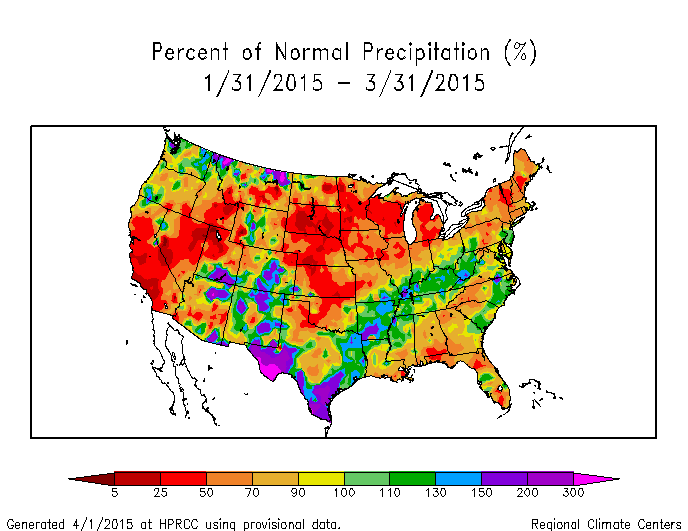
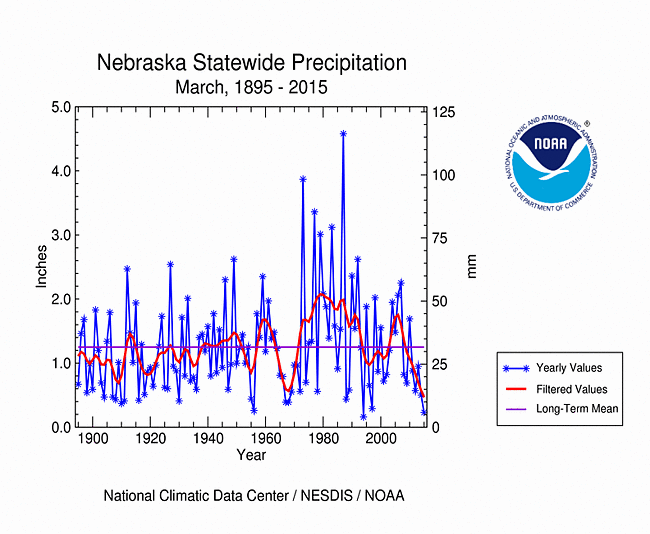
As described by the High Plains Regional Climate Center, most of the region had precipitation totals which were less than 50 percent of normal. While low precipitation totals are not as worrisome during the winter months, March marks the beginning of spring, when precipitation totals (normals) start to increase. Much of Kansas, Nebraska, and South Dakota picked up a paltry 5-25 percent of normal precipitation, while both central Nebraska and central Kansas received less than 5 percent of normal precipitation. The lack of precipitation caused an expansion of drought conditions and many locations had their top 10 driest March on record. A few isolated locations even had their driest March on record. The spring season is critical for precipitation and any continued dryness should be monitored as the season progresses. The combination of warm and dry conditions had both positive and negative impacts for the region. For instance, grass fires were an issue in many areas as dry vegetation provided quick burning fuel. Some fires threatened homes and caused road closures. On the other end of the spectrum, the warm and dry conditions were good for the calving season and also allowed producers to easily get equipment into fields. Although beneficial in the short-term, a continuation of dry conditions would not be favorable as spring rains will be needed to replenish soil moisture.
The extreme dryness this month was reflected in the U.S. Drought Monitor as drought conditions expanded across the High Plains region. The total area in drought (D1-D4) increased from about 20 percent to just over 35 percent. To the south, moderate drought conditions (D1) expanded in central and eastern Kansas and into south-central Nebraska. Meanwhile, to the north, D1 expanded in eastern North Dakota and westward across South Dakota. Additionally, continued warmth along with dry conditions have led to the development of severe drought conditions (D2) in western Colorado. D2 now covers about 40 percent of the state. Of all six states in the region, Kansas still had the largest area in drought with approximately 69 percent of the state experiencing drought (D1-D4) at the end of the month. Abnormally dry conditions have expanded through every state in the region and only 27 percent of the region was free of drought or abnormal dryness. The first few days of April brought some precipitation to the region; however the heaviest amounts were confined to eastern Nebraska where drought is not a concern at this time. According to the University of Nebraska-Lincoln's CropWatch, last fall's weather may have contributed to the worst winter wheat winterkill in the past 50 years in southwestern Nebraska. Winterkill can be the result of many reasons, with extreme temperatures and a lack of rainfall and snow cover as contributing factors. Dryness is still a concern due to a lack of precipitation and low soil moisture profiles in the area.
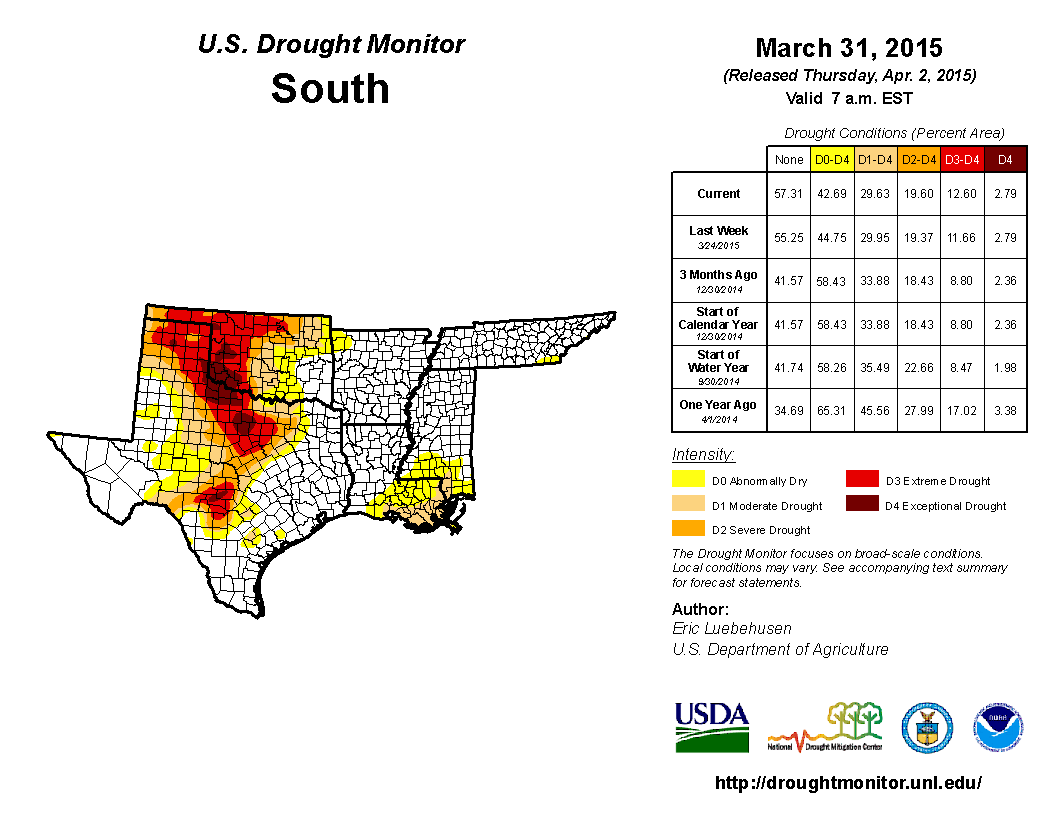
As explained by the Southern Regional Climate Center, March precipitation in the Southern region varied from extremely dry in some areas to extremely wet in other areas. The highest departures from normal occurred in the Trans Pecos, South Texas and Lower Valley climate divisions of Texas, and in southern Arkansas. In contrast, many stations in the northern Texas panhandle reported only 25 percent of normal precipitation for the month. This was also the case over north central Oklahoma.
Drought conditions in the Southern region improved significantly over the past month. Above normal precipitation over Arkansas and western Tennessee has led to the removal of all moderate drought and abnormally dry conditions and the two states are now drought-free. Similarly, much of the moderate drought that was located in southeastern Louisiana and southern Mississippi has been reduced to just a small number of counties/parishes along the northern gulf coast. In southeastern Texas, heavy rainfalls throughout the month has led to the removal of some moderate and severe drought. Conversely, dry conditions in northern Texas and Oklahoma have led to some expansion of extreme drought.
As summarized by the Midwest Regional Climate Center, precipitation for the month of March was primarily concentrated along the Ohio River Valley. All other locations saw accumulated precipitation values 1.0 to 2.0 inches (25.4 to 50.8 mm) below normal. As a percentage of normal, the Ohio River Valley regions were 75 to 200 percent above normal while those locations with values 1.0 to 2.0 inches (25.4 to 50.8 mm) below normal only recorded 10 to 75 percent of normal accumulated precipitation. Iowa ended the month with the largest land area having experienced below normal precipitation, with this land area recording only 10-25 percent of normal accumulated precipitation. As of March 31st, 2015, the continued deficit of snowfall and precipitation across the upper Midwest region has resulted in the expansion of the drought status to include all of Minnesota and Wisconsin, along with central Michigan, eastern Iowa, and western Illinois between the Illinois and Wisconsin border south to the intersection of the Iowa, Missouri, and Illinois borders. Minnesota is now classified as moderate drought, long term, with the other areas classified as abnormally dry, short-term drought status. This has heightened danger for fire risk, especially across the southern half of Minnesota.
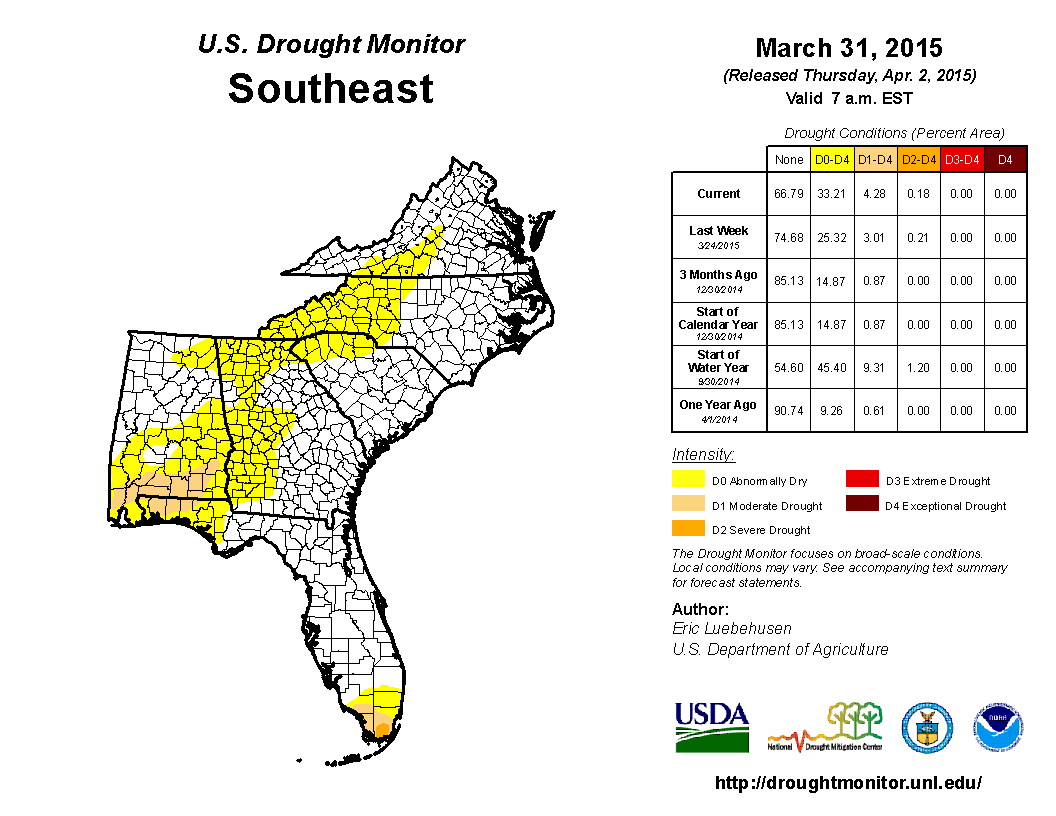
As noted by the Southeast Regional Climate Center, precipitation was below normal across much of the Southeast during March. The driest locations were found across portions of southeastern Alabama, southern Georgia, and Florida, where monthly precipitation totals were 2 to 5 inches (50.8 to 127 mm) below normal, or 75 to as little as 10 percent of normal. Precipitation was slightly below normal for much of Puerto Rico and the U.S. Virgin Islands. Only modest changes were observed in drought conditions across the region during March. The percentage of the region under drought-free conditions (less than D1) remained approximately 96 percent during the month. The coverage of moderate (D1) drought conditions declined slightly across the Mobile Bay area but spread eastward into south-central Alabama and the Florida Panhandle by the end of the month. In addition, drought continued to intensify over southern Florida, as a localized area of severe (D2) drought conditions was declared in Miami-Dade County on the 24th. Persistent dryness across western North Carolina contributed to the development of a large wildfire near Black Mountain on the 31st, which destroyed one mobile home and injured a firefighter. The most significant agricultural impacts of the dryness and warmth occurred in Florida. Winter forage was reduced substantially by the lack of precipitation, and frequent irrigation was required to maintain proper growth in the citrus crop. Dry conditions, however, contributed to large spring potato yields across the state. A cold snap in late March produced frost damage in peach orchards across portions of central Georgia, where as much as one third of the crop in Peach and Taylor Counties could be lost.
As explained by the Northeast Regional Climate Center, March was another colder-than-normal month in the Northeast, and the region wrapped up March with below-normal precipitation. The USDM released on March 5 showed abnormally dry conditions were present across parts of West Virginia, Maryland, Pennsylvania, New Jersey, and New York (totaling 17 percent of the Northeast). Dryness eased in West Virginia and most of Maryland mid-month, but expanded in New York. By month's end, abnormal dryness had expanded even more in New York and Pennsylvania and was introduced in Vermont and a portion of Massachusetts. Overall, 25 percent of the region was abnormally dry as of March 26.
As summarized by the Western Regional Climate Center, March was the 4th consecutive month of widespread above normal temperatures in the West. Precipitation was below normal for a majority of the West, though scattered areas of the Desert Southwest and along the northern tier of the region received above normal precipitation. Record low snowpack in Sierra Nevada: Snow water equivalent on April 1 was only 5% of normal for the date. This was the lowest measurement since official records began in 1950. The previous lowest April 1 snow packs of 25% of normal were observed in 1977 and 2014. This prompts major concerns over water resources for the coming months.
A few locations in the Southwest recorded above normal precipitation due to a closed low-pressure system that moving across the region during the first week of the month. Scattered areas along the northern tier of the West also saw above normal precipitation due to a series of storms in the latter half of the month. Drier than normal conditions prevailed elsewhere in the West, especially in California and the Great Basin. San Francisco observed 0.12 in (3 mm) for the month, 4% of normal and tied with 1956 for 4th driest March in a 167-year record. On the other side of the Sierra Nevada, Reno recorded only 0.01 in (0.4 mm) of precipitation, to tie 1997 for the 2nd driest March on record. The anemic snowpack in the Sierra Nevada, Cascades, and Great Basin continued to dwindle this month. A majority of basins reported less than 20% of normal snow water equivalent at month's end. Snowpack in the Rockies had been near to slightly above normal throughout the winter, but above normal temperatures and below normal precipitation this month reduced snow water equivalents to 50-80% of normal in most basins. Drought conditions worsened in large areas of eastern and western Nevada, northern Utah, western Colorado, and along the Wyoming-Idaho border. Drought conditions improved in central and northern New Mexico.
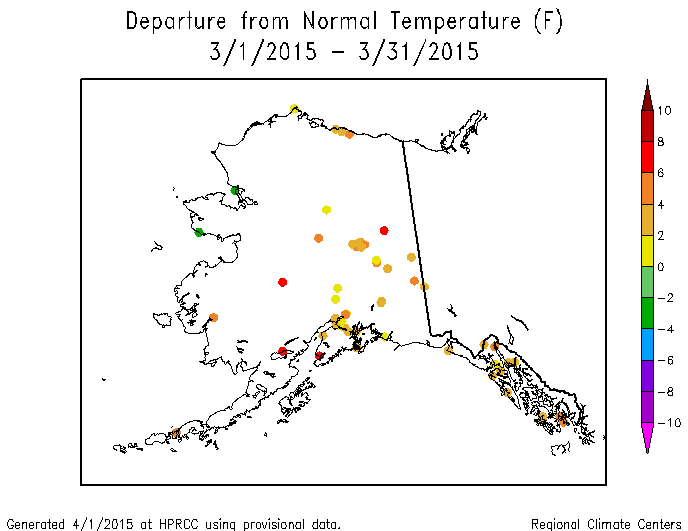
Average temperatures were near to above normal throughout Alaska this month. Some locations in the Southwest, Interior, and Southcentral regions were significantly above normal despite a cold snap that affected the Interior between the 9th-16th. McGrath reported an average 17.6 F (-8 C), 6 F (3.3 C) above normal and the 9th warmest March since records began in 1941. Precipitation was highly variable across the state, though the North Slope saw above average precipitation. Barrow reported 0.28 in (7 mm), 311% of normal. Drier than normal conditions continued for much of Hawaii this month, most notably on the Big Island, Oahu, and Kauai. Honolulu received 0.62, in (16 mm), 31% of normal. In contrast, Kahului, Maui received 9.79 in (249 mm) of rainfall, 400% of normal and the 2nd wettest March since records began in 1905. Drought conditions eased this month in parts of the Big Island, Maui, and Moloka'i.
Pacific Islands: According to reports from National Weather Service offices, the Pacific ENSO Applications Climate Center (PEAC), and partners, conditions varied across the Pacific Islands.
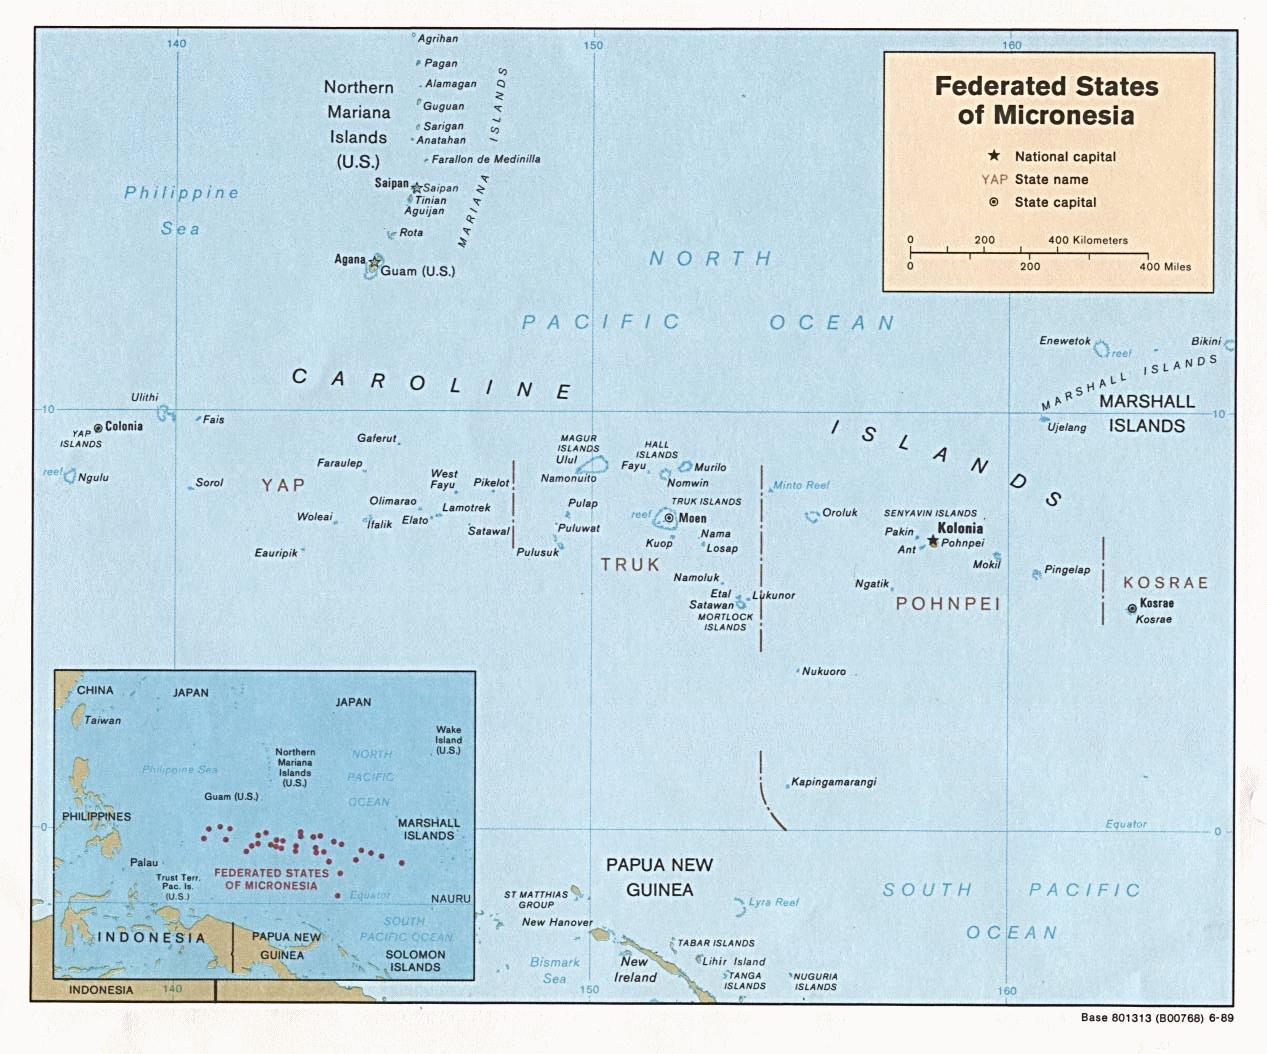
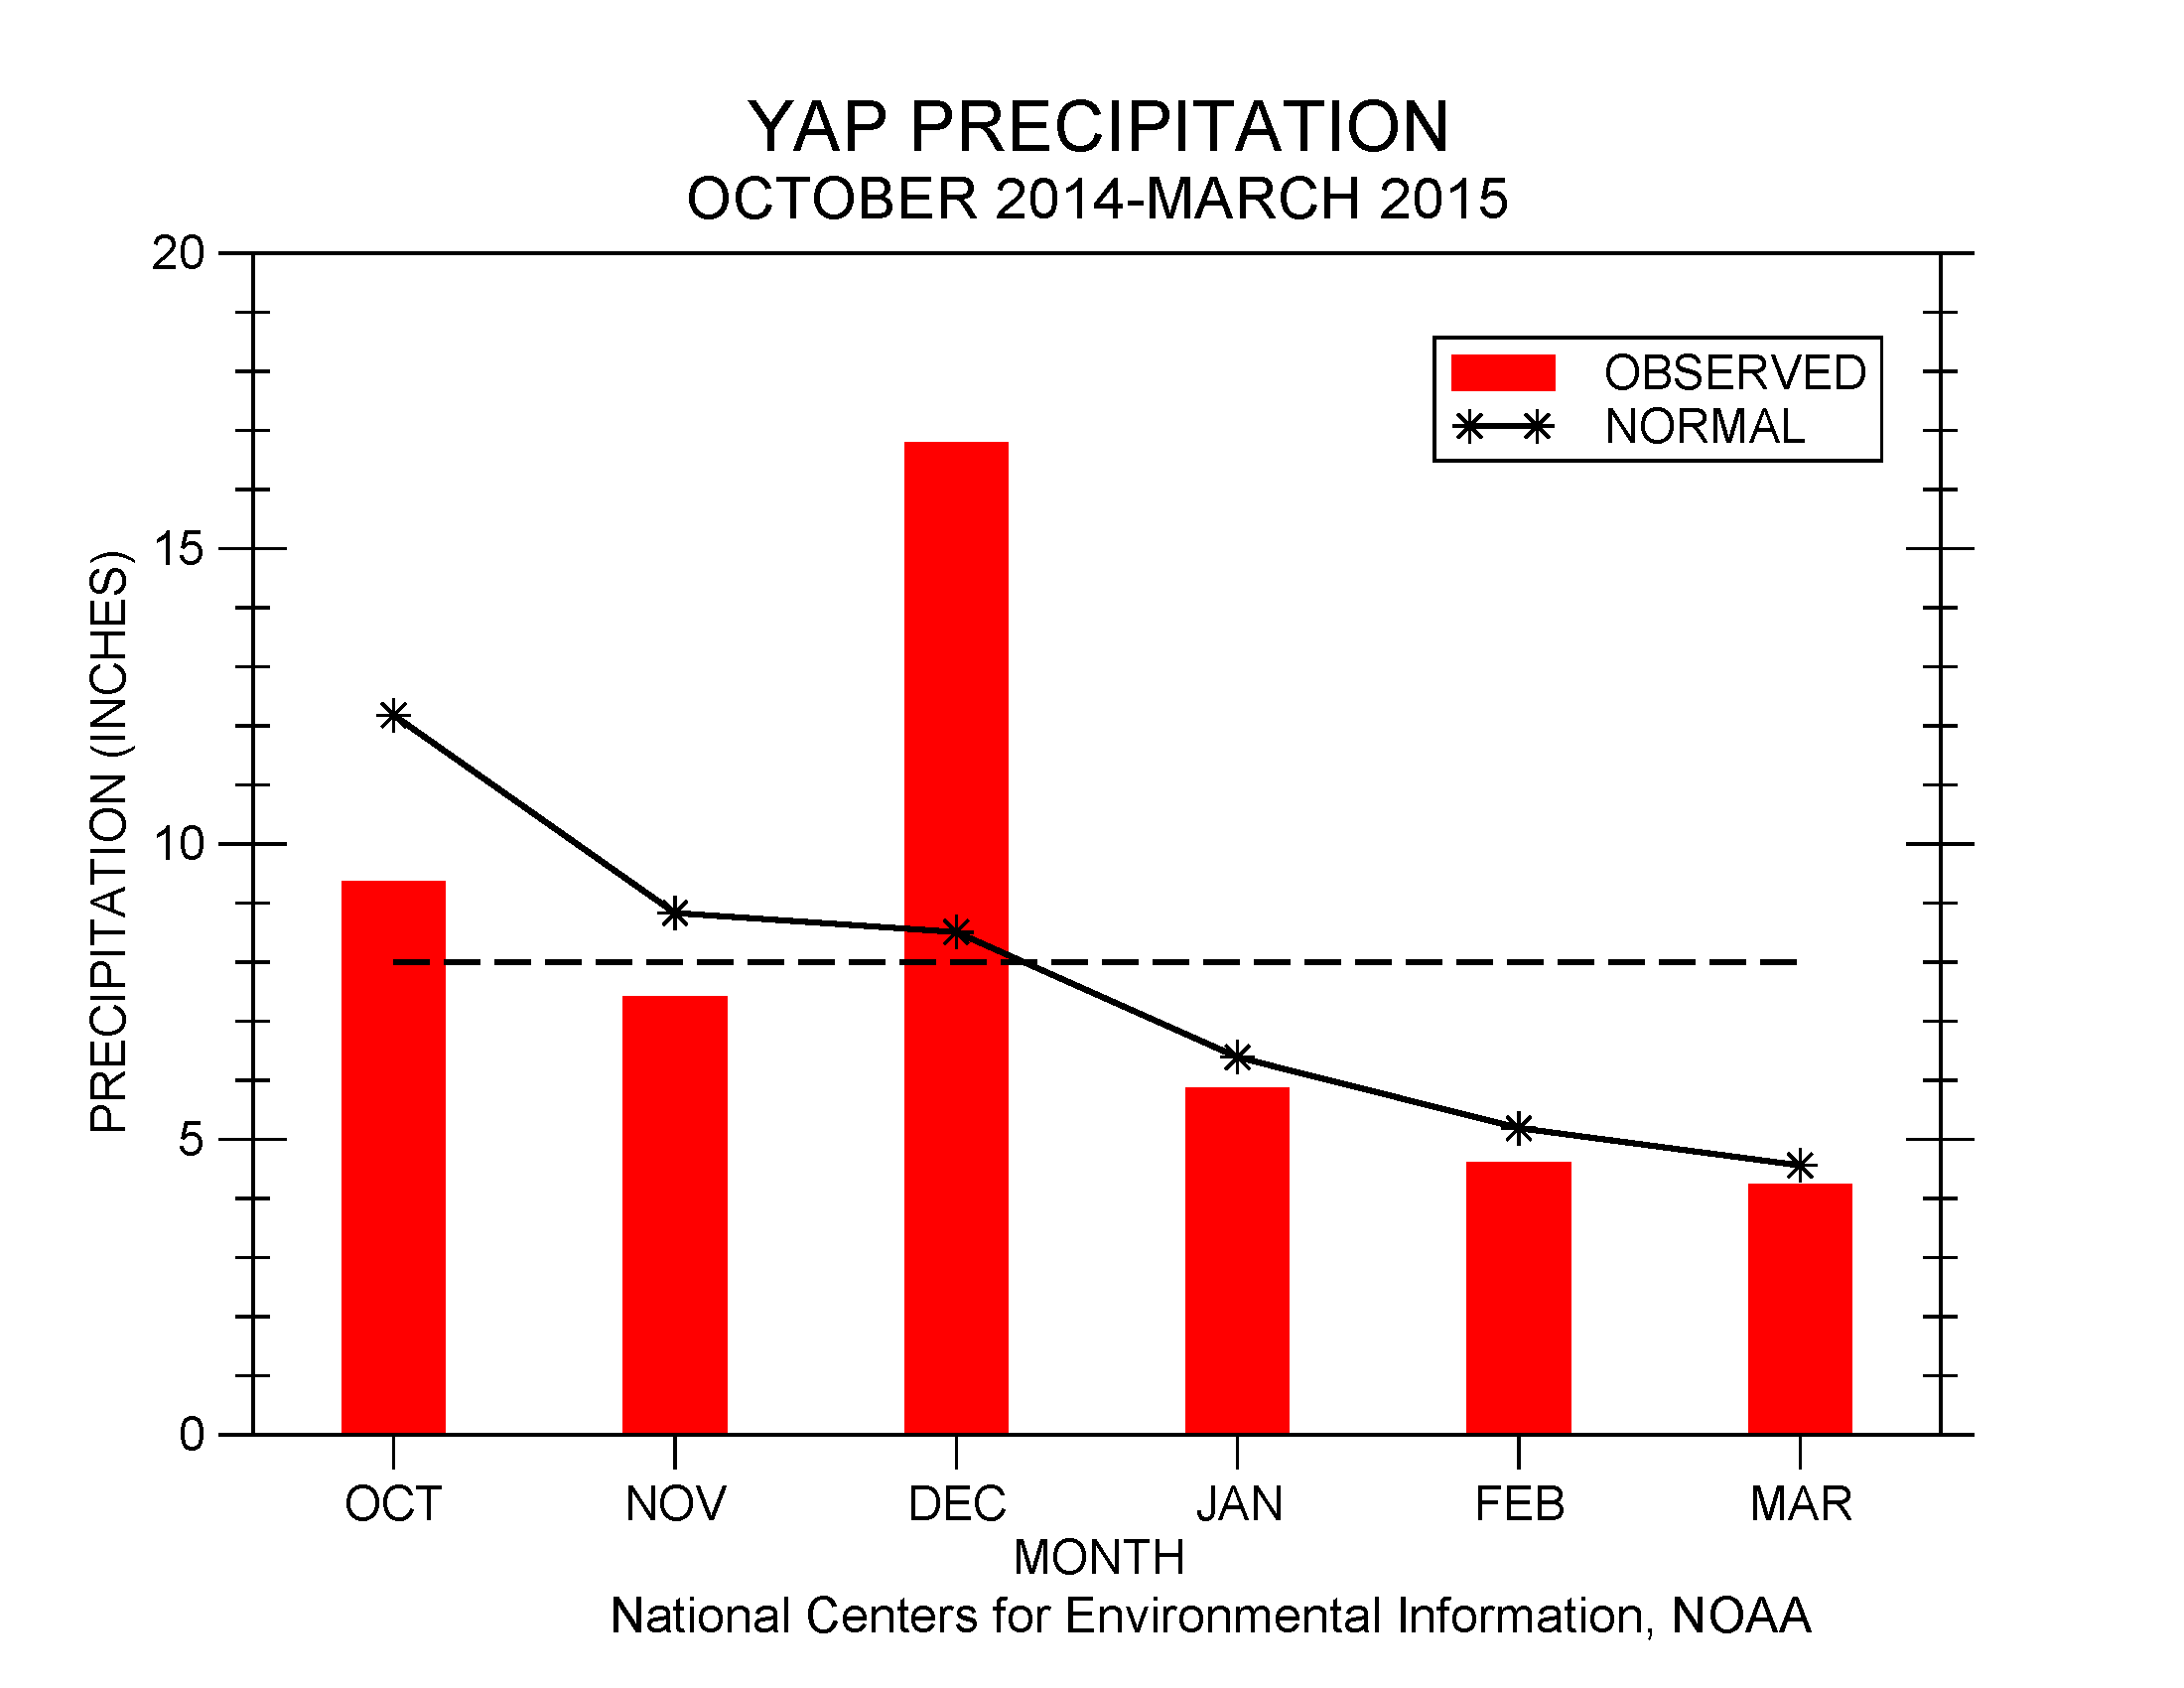
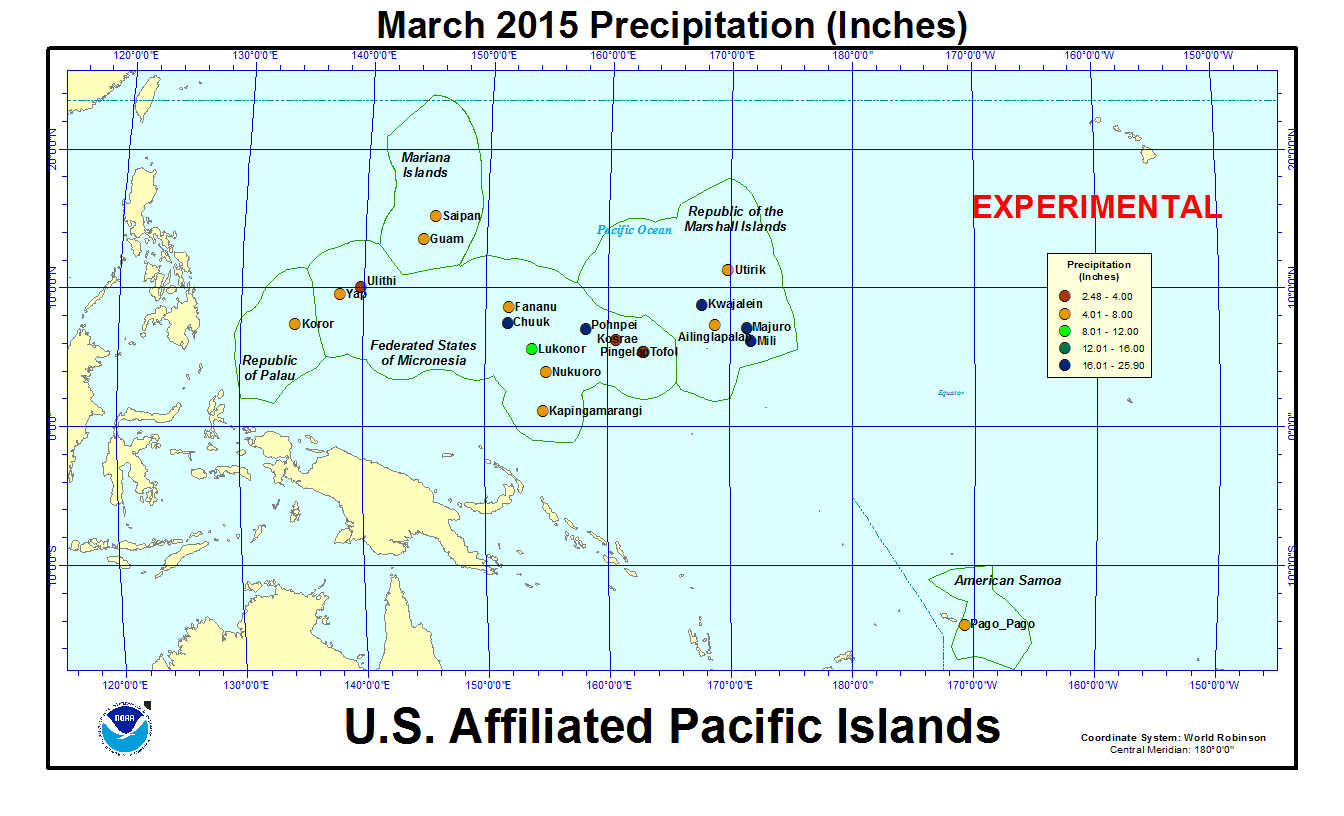
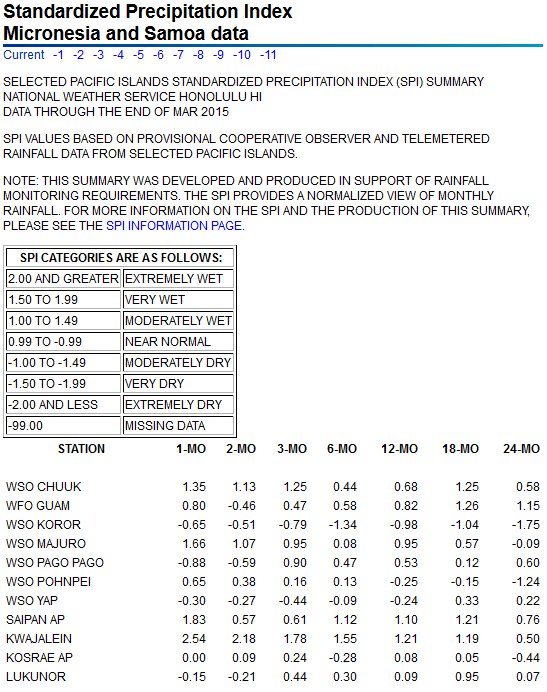
In the U.S. Affiliated Pacific Islands (maps — Micronesia, Marshall Islands, basinwide), March 2015 was drier than normal at the southern and western primary stations and wetter than normal at the northern and eastern stations. March is in the dry season for the northern and western stations (Koror, Yap, Lukonor, Chuuk, Guam, Kwajalein, Majuro, and Saipan).
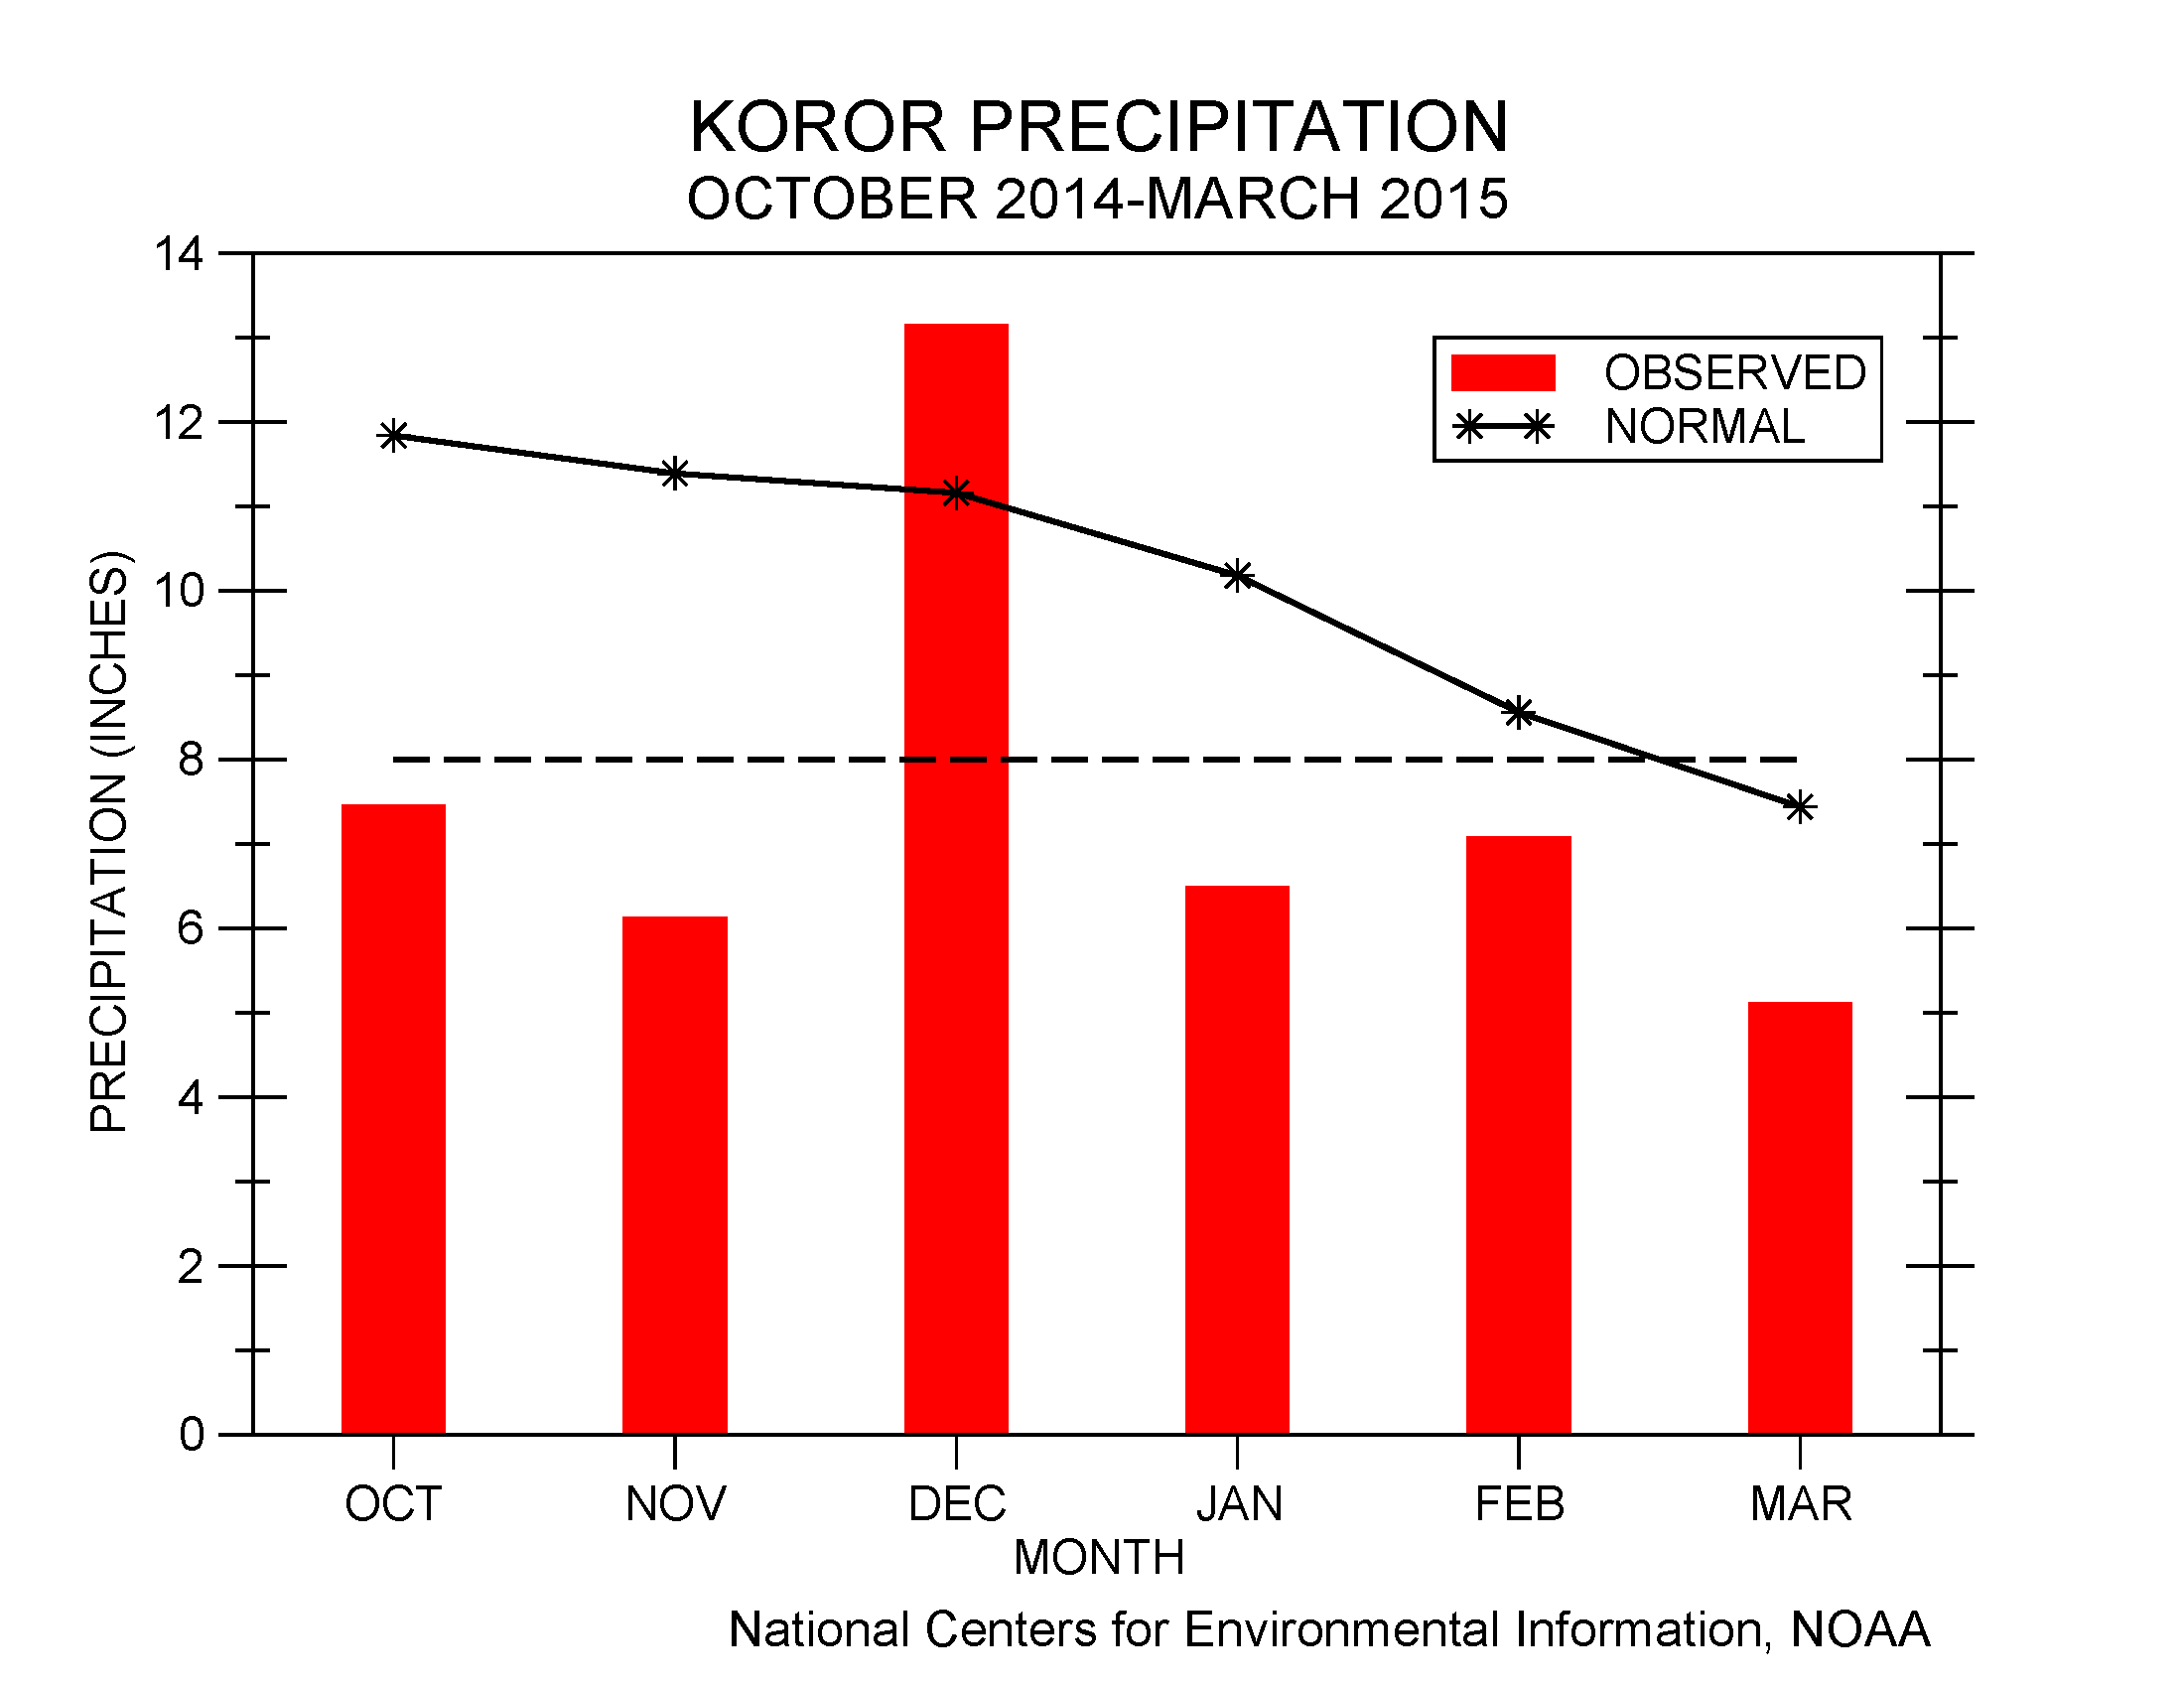
Tropical systems that moved through the USAPI region during the month brought above-normal rainfall to stations in the Republic of the Marshall Islands, Mariana Islands, and Federated States of Micronesia, including Guam, Saipan, Chuuk, Pohnpei, Kwajalein, and Majuro. The storm tracks missed other stations, resulting in below-normal rainfall at Koror, Yap, Lukonor, Kapingamarangi, and Kosrae. Pago Pago was also drier than normal.
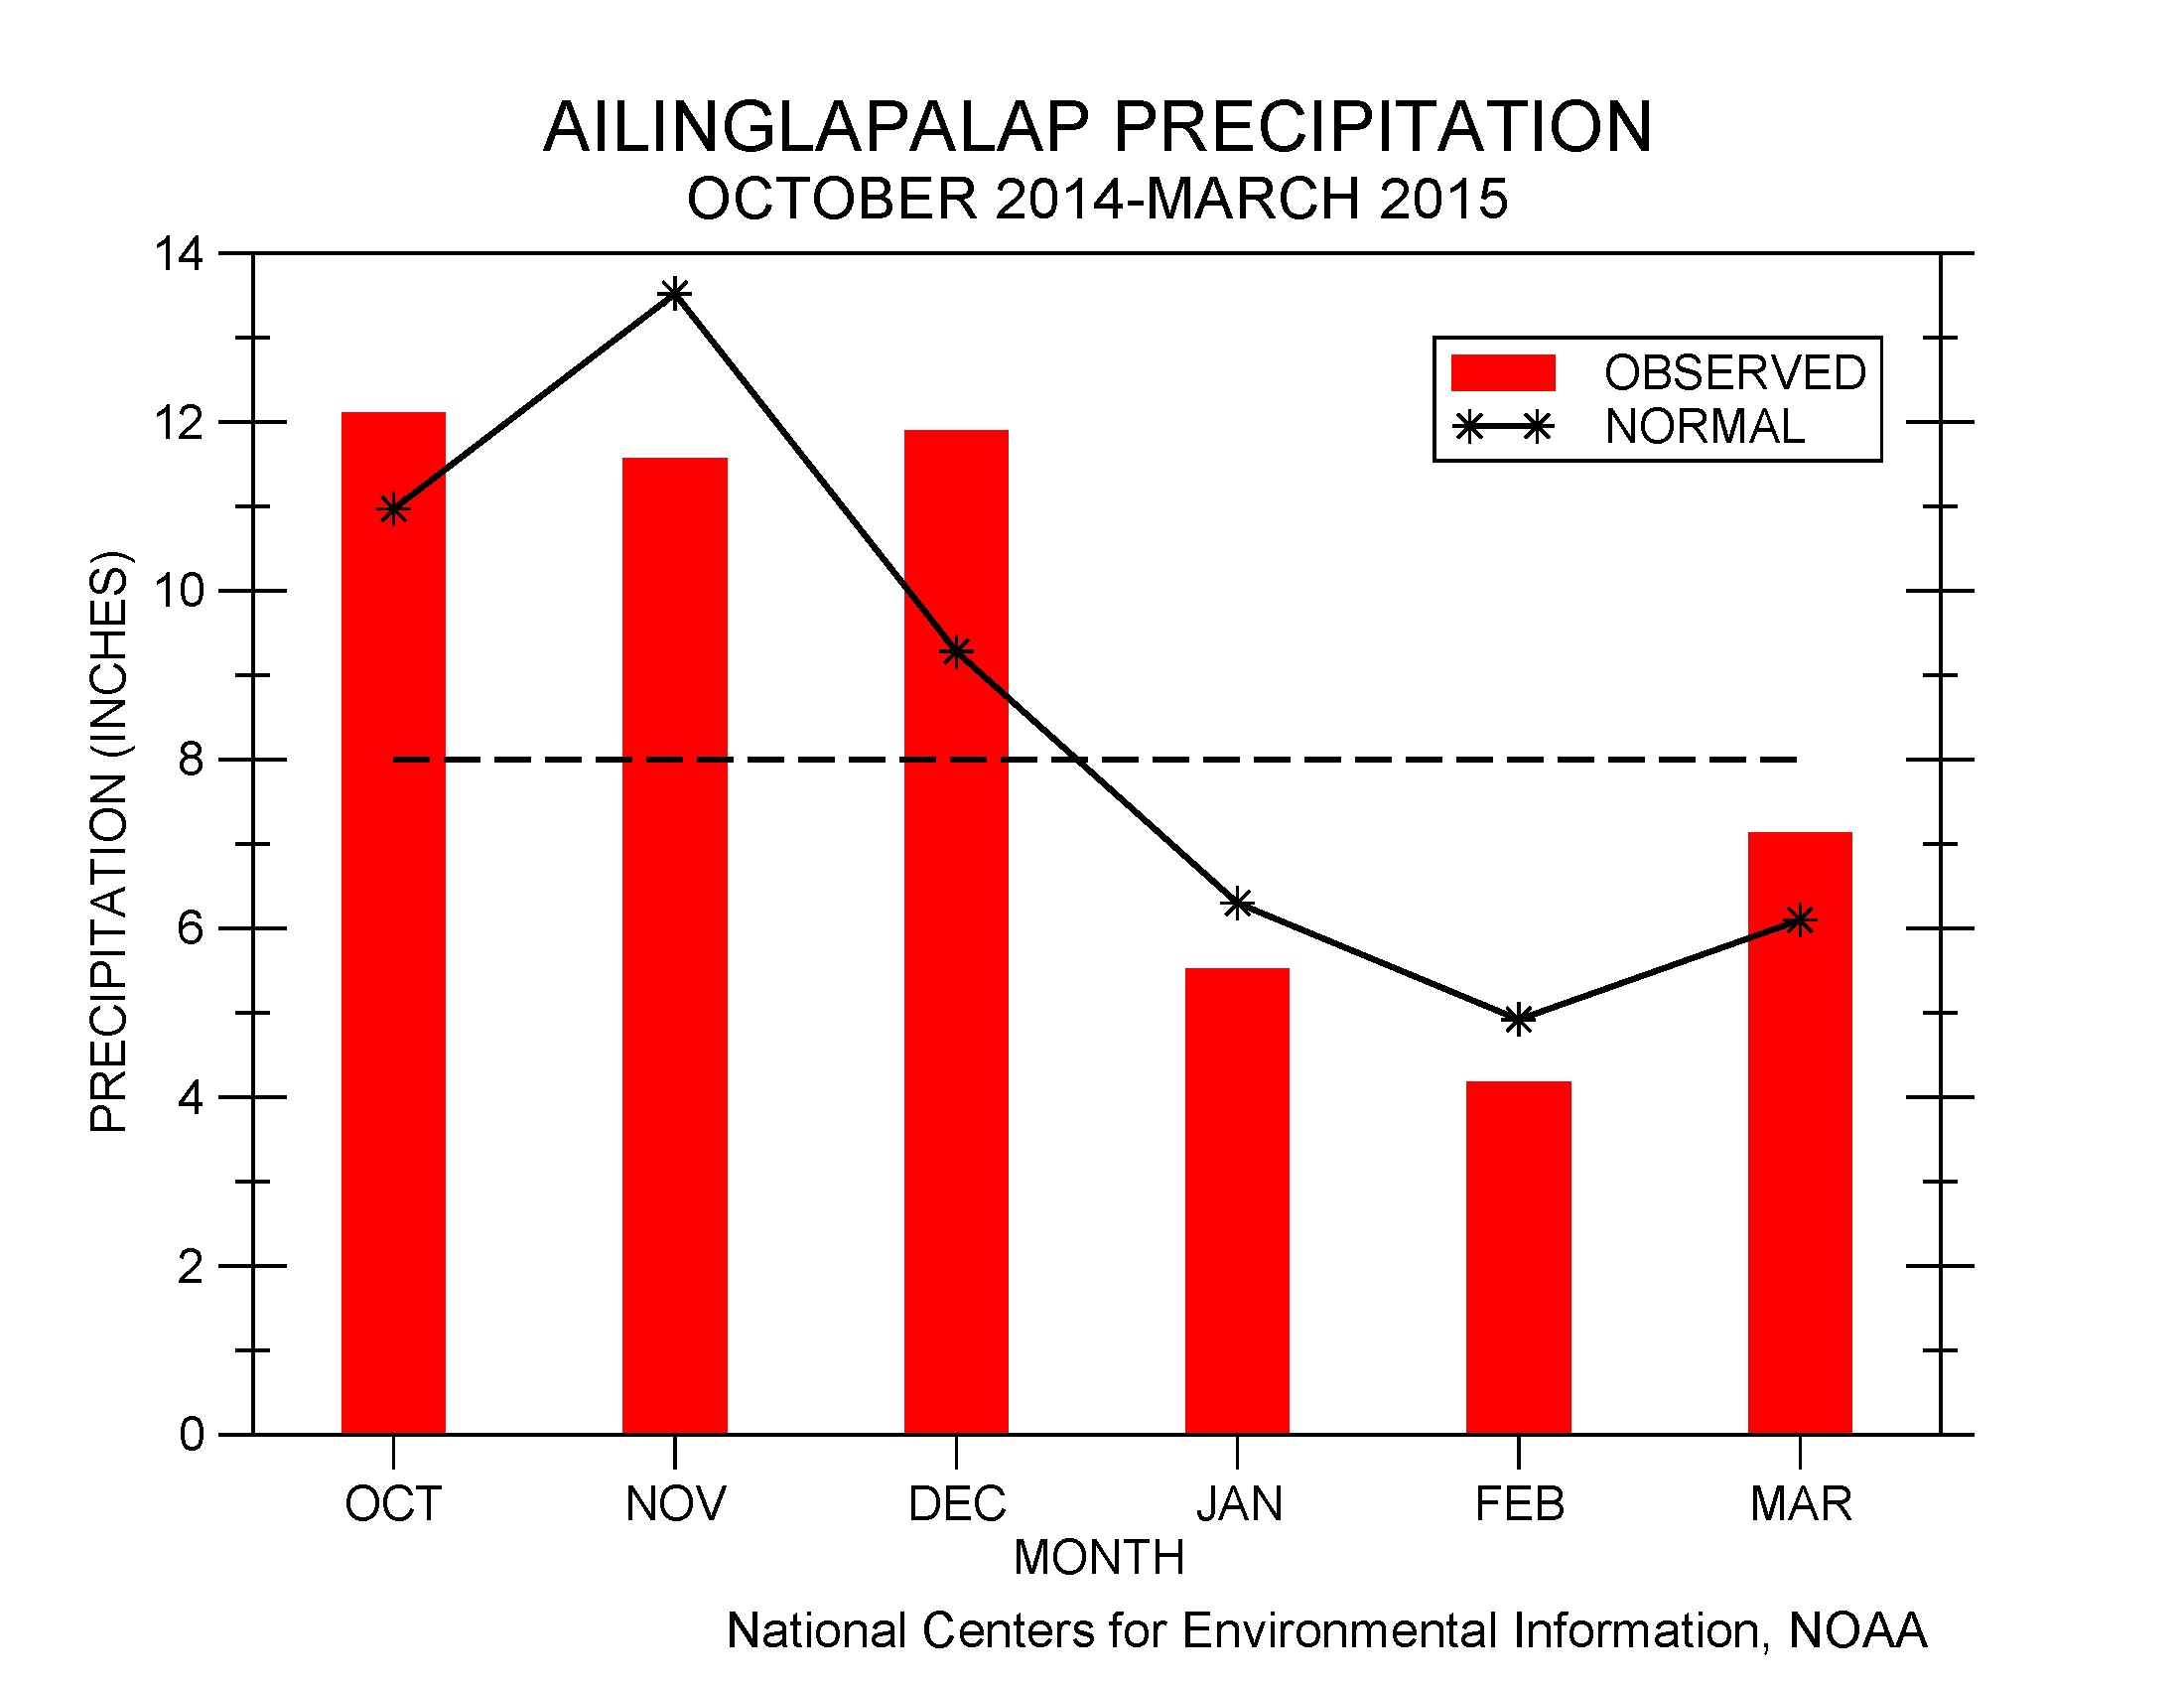
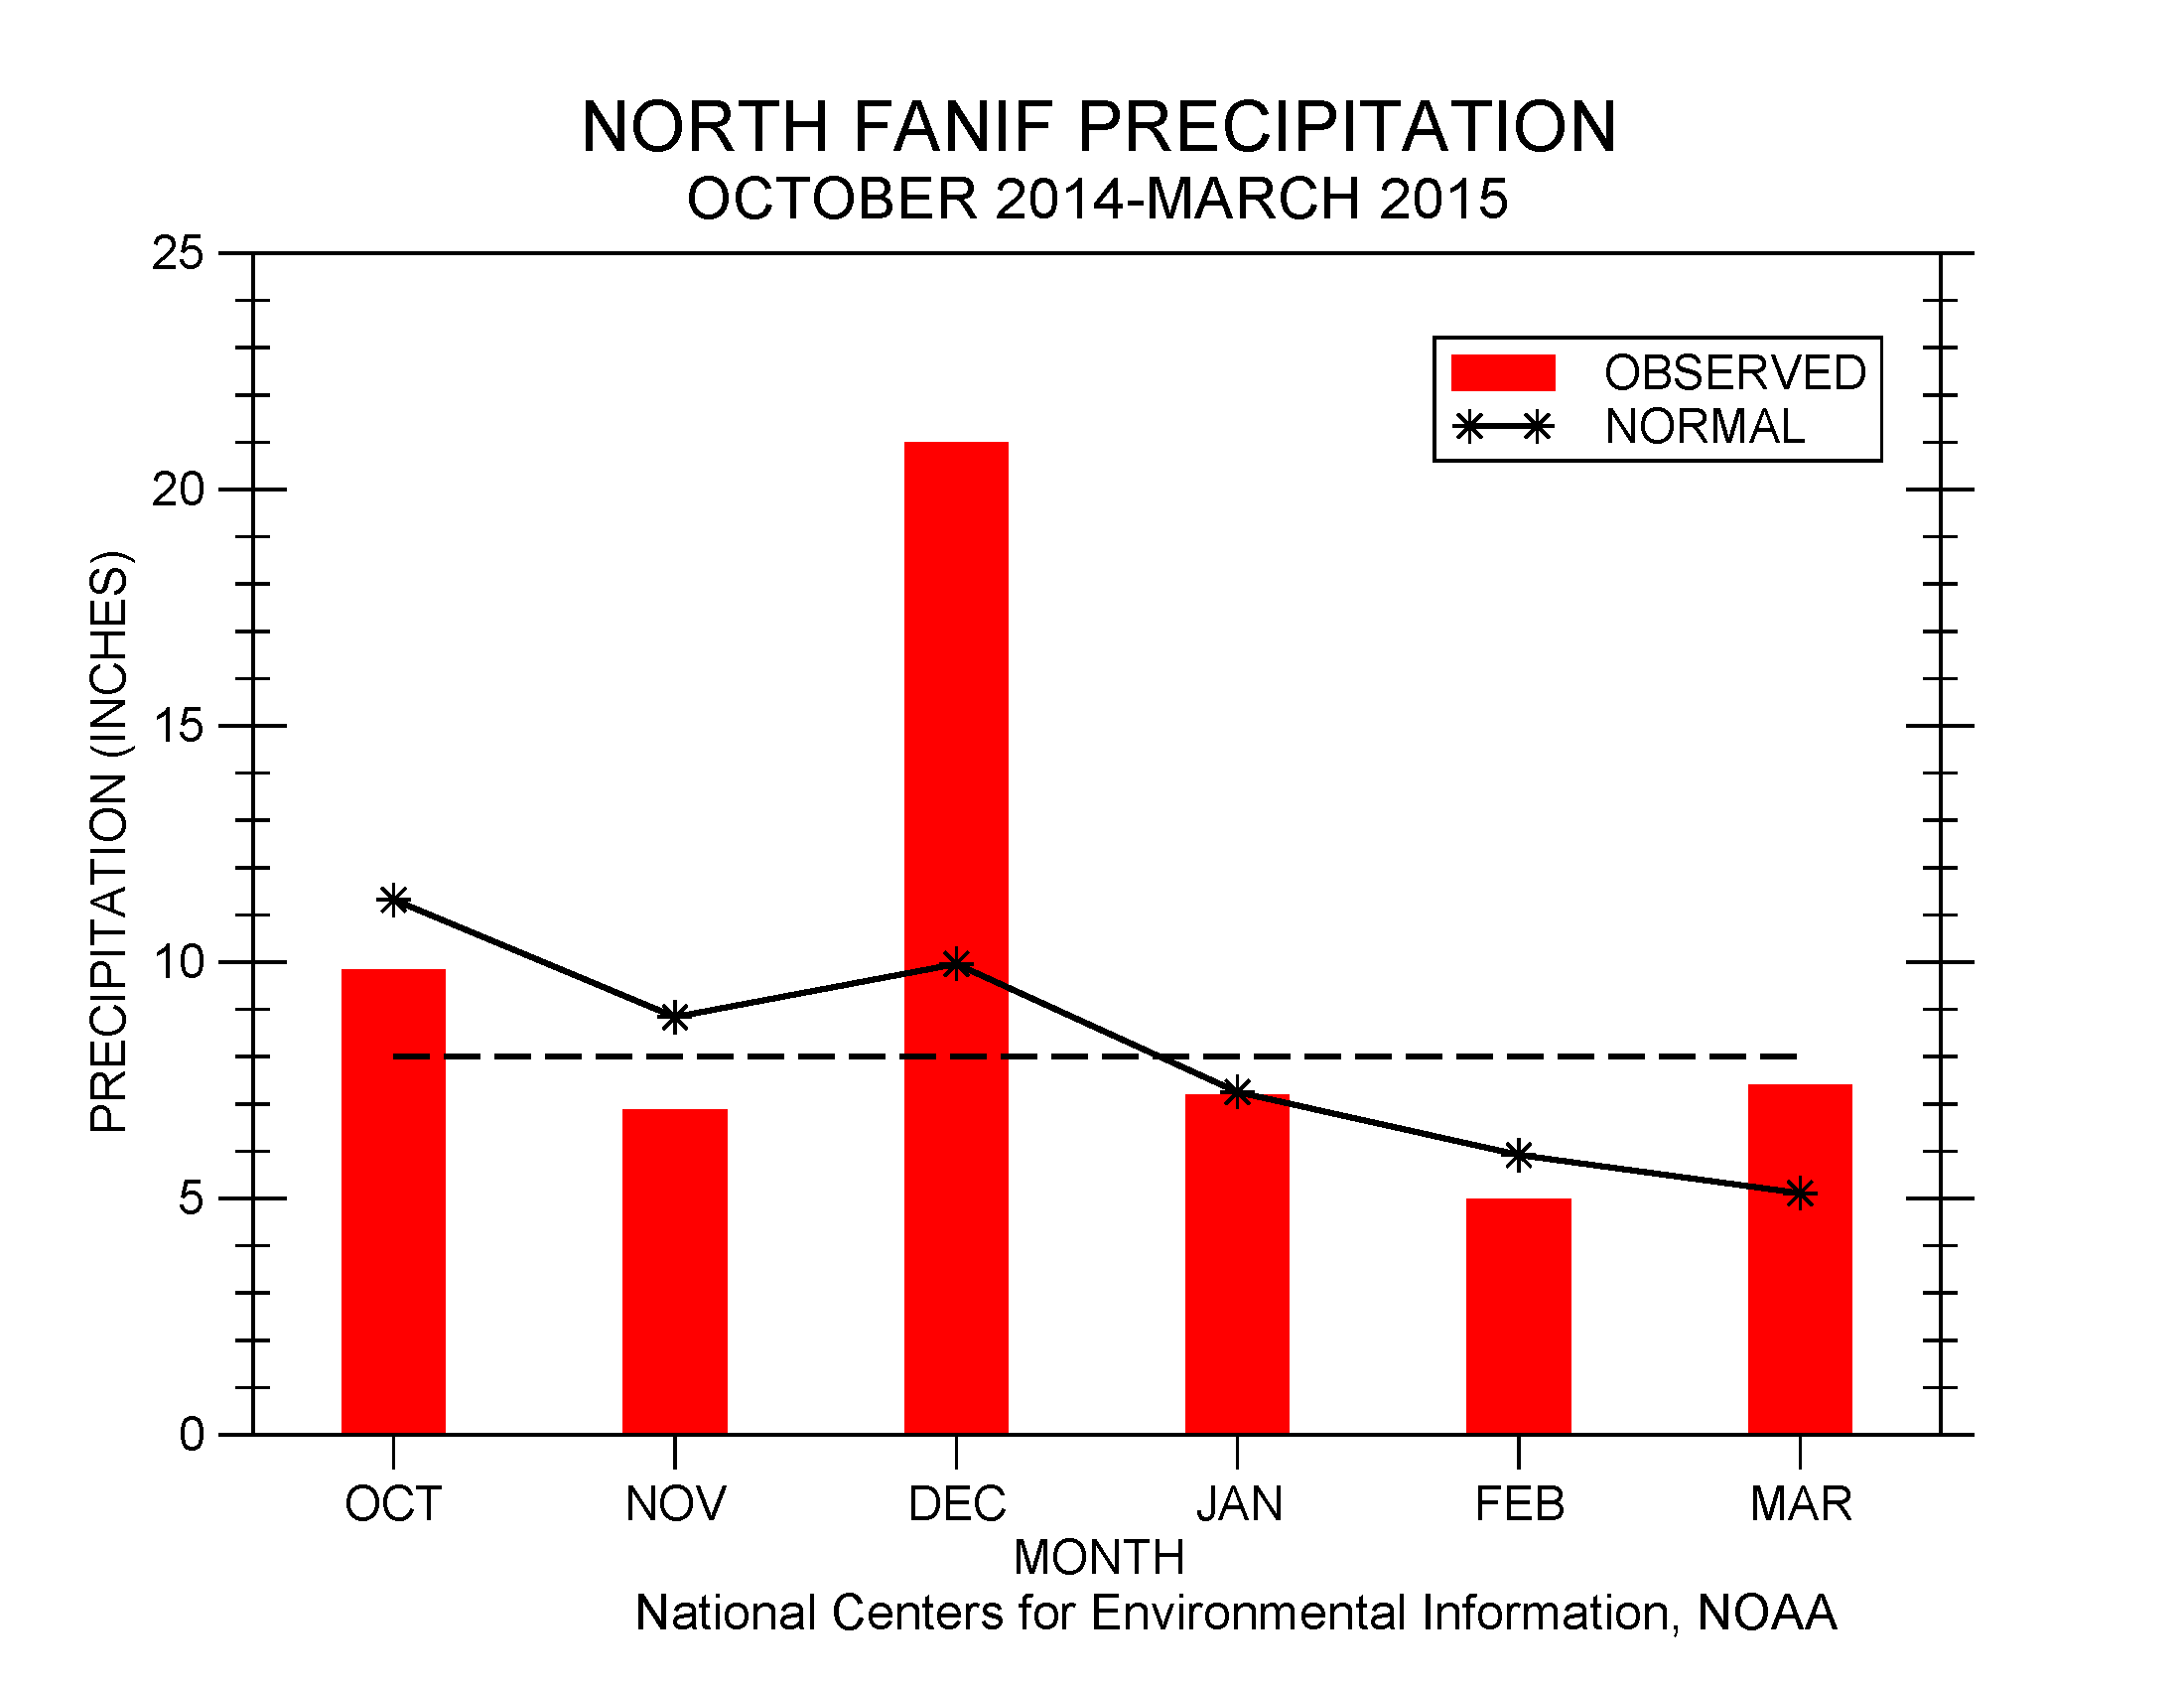
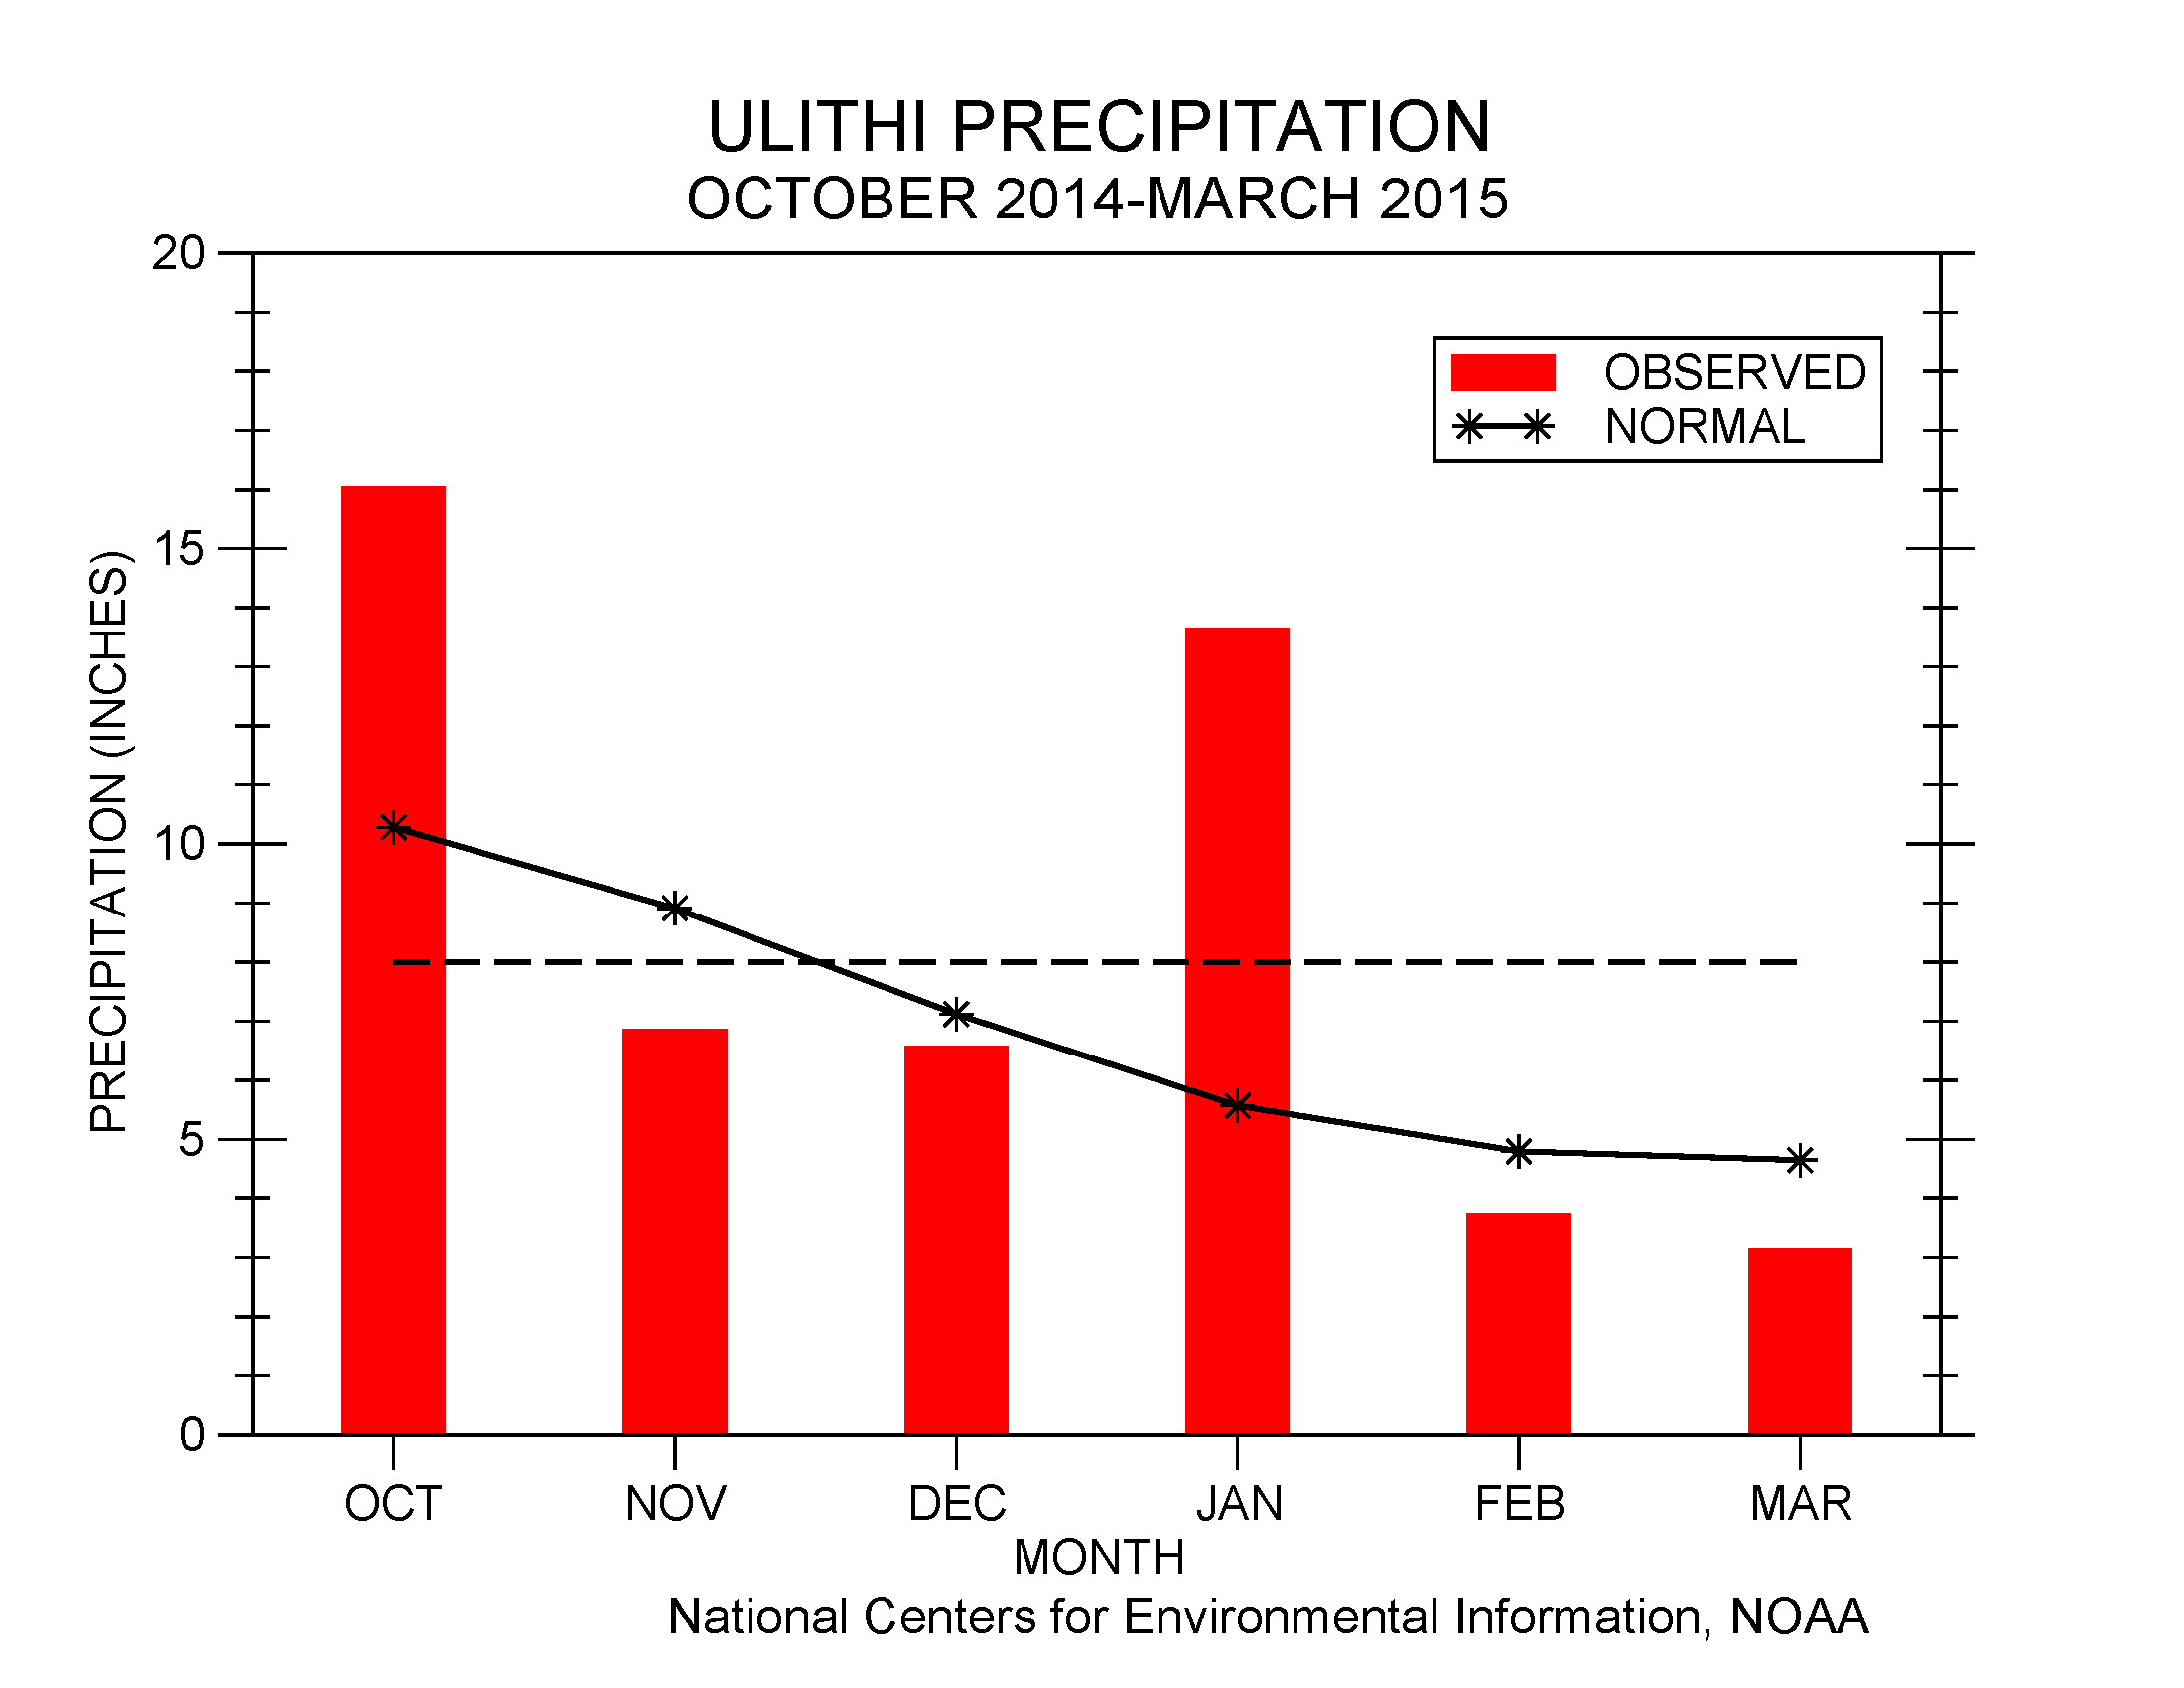
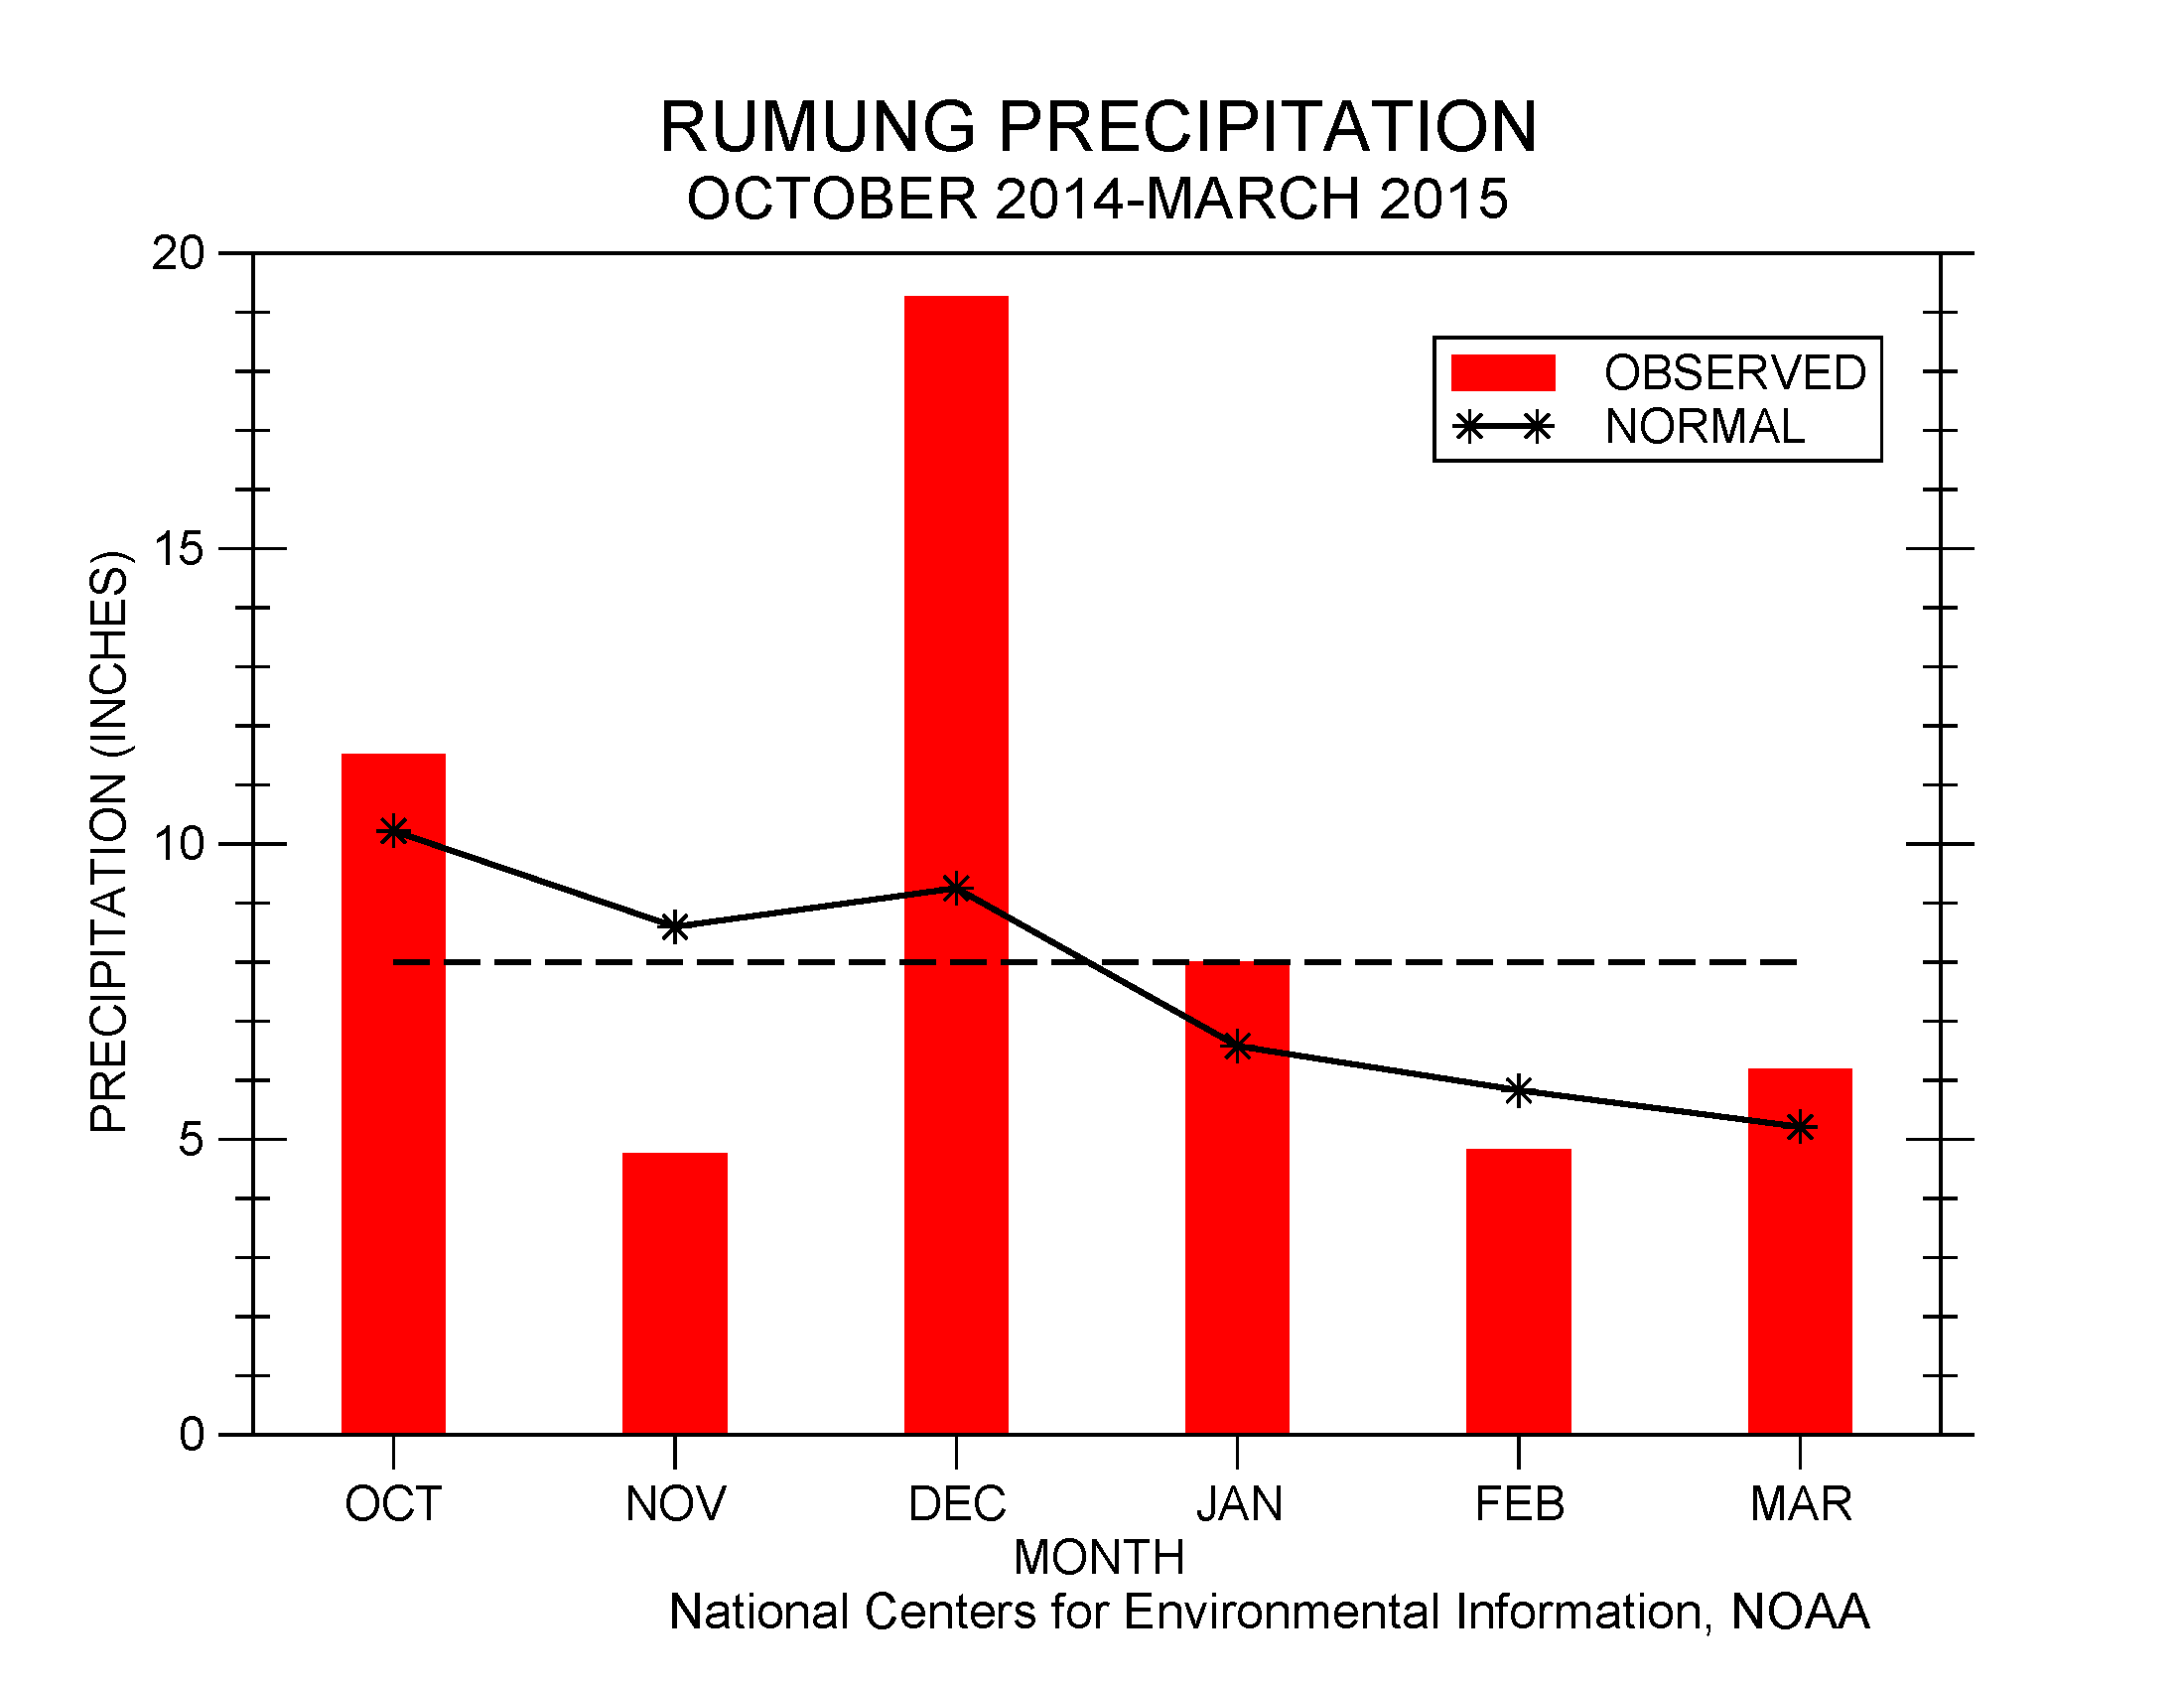
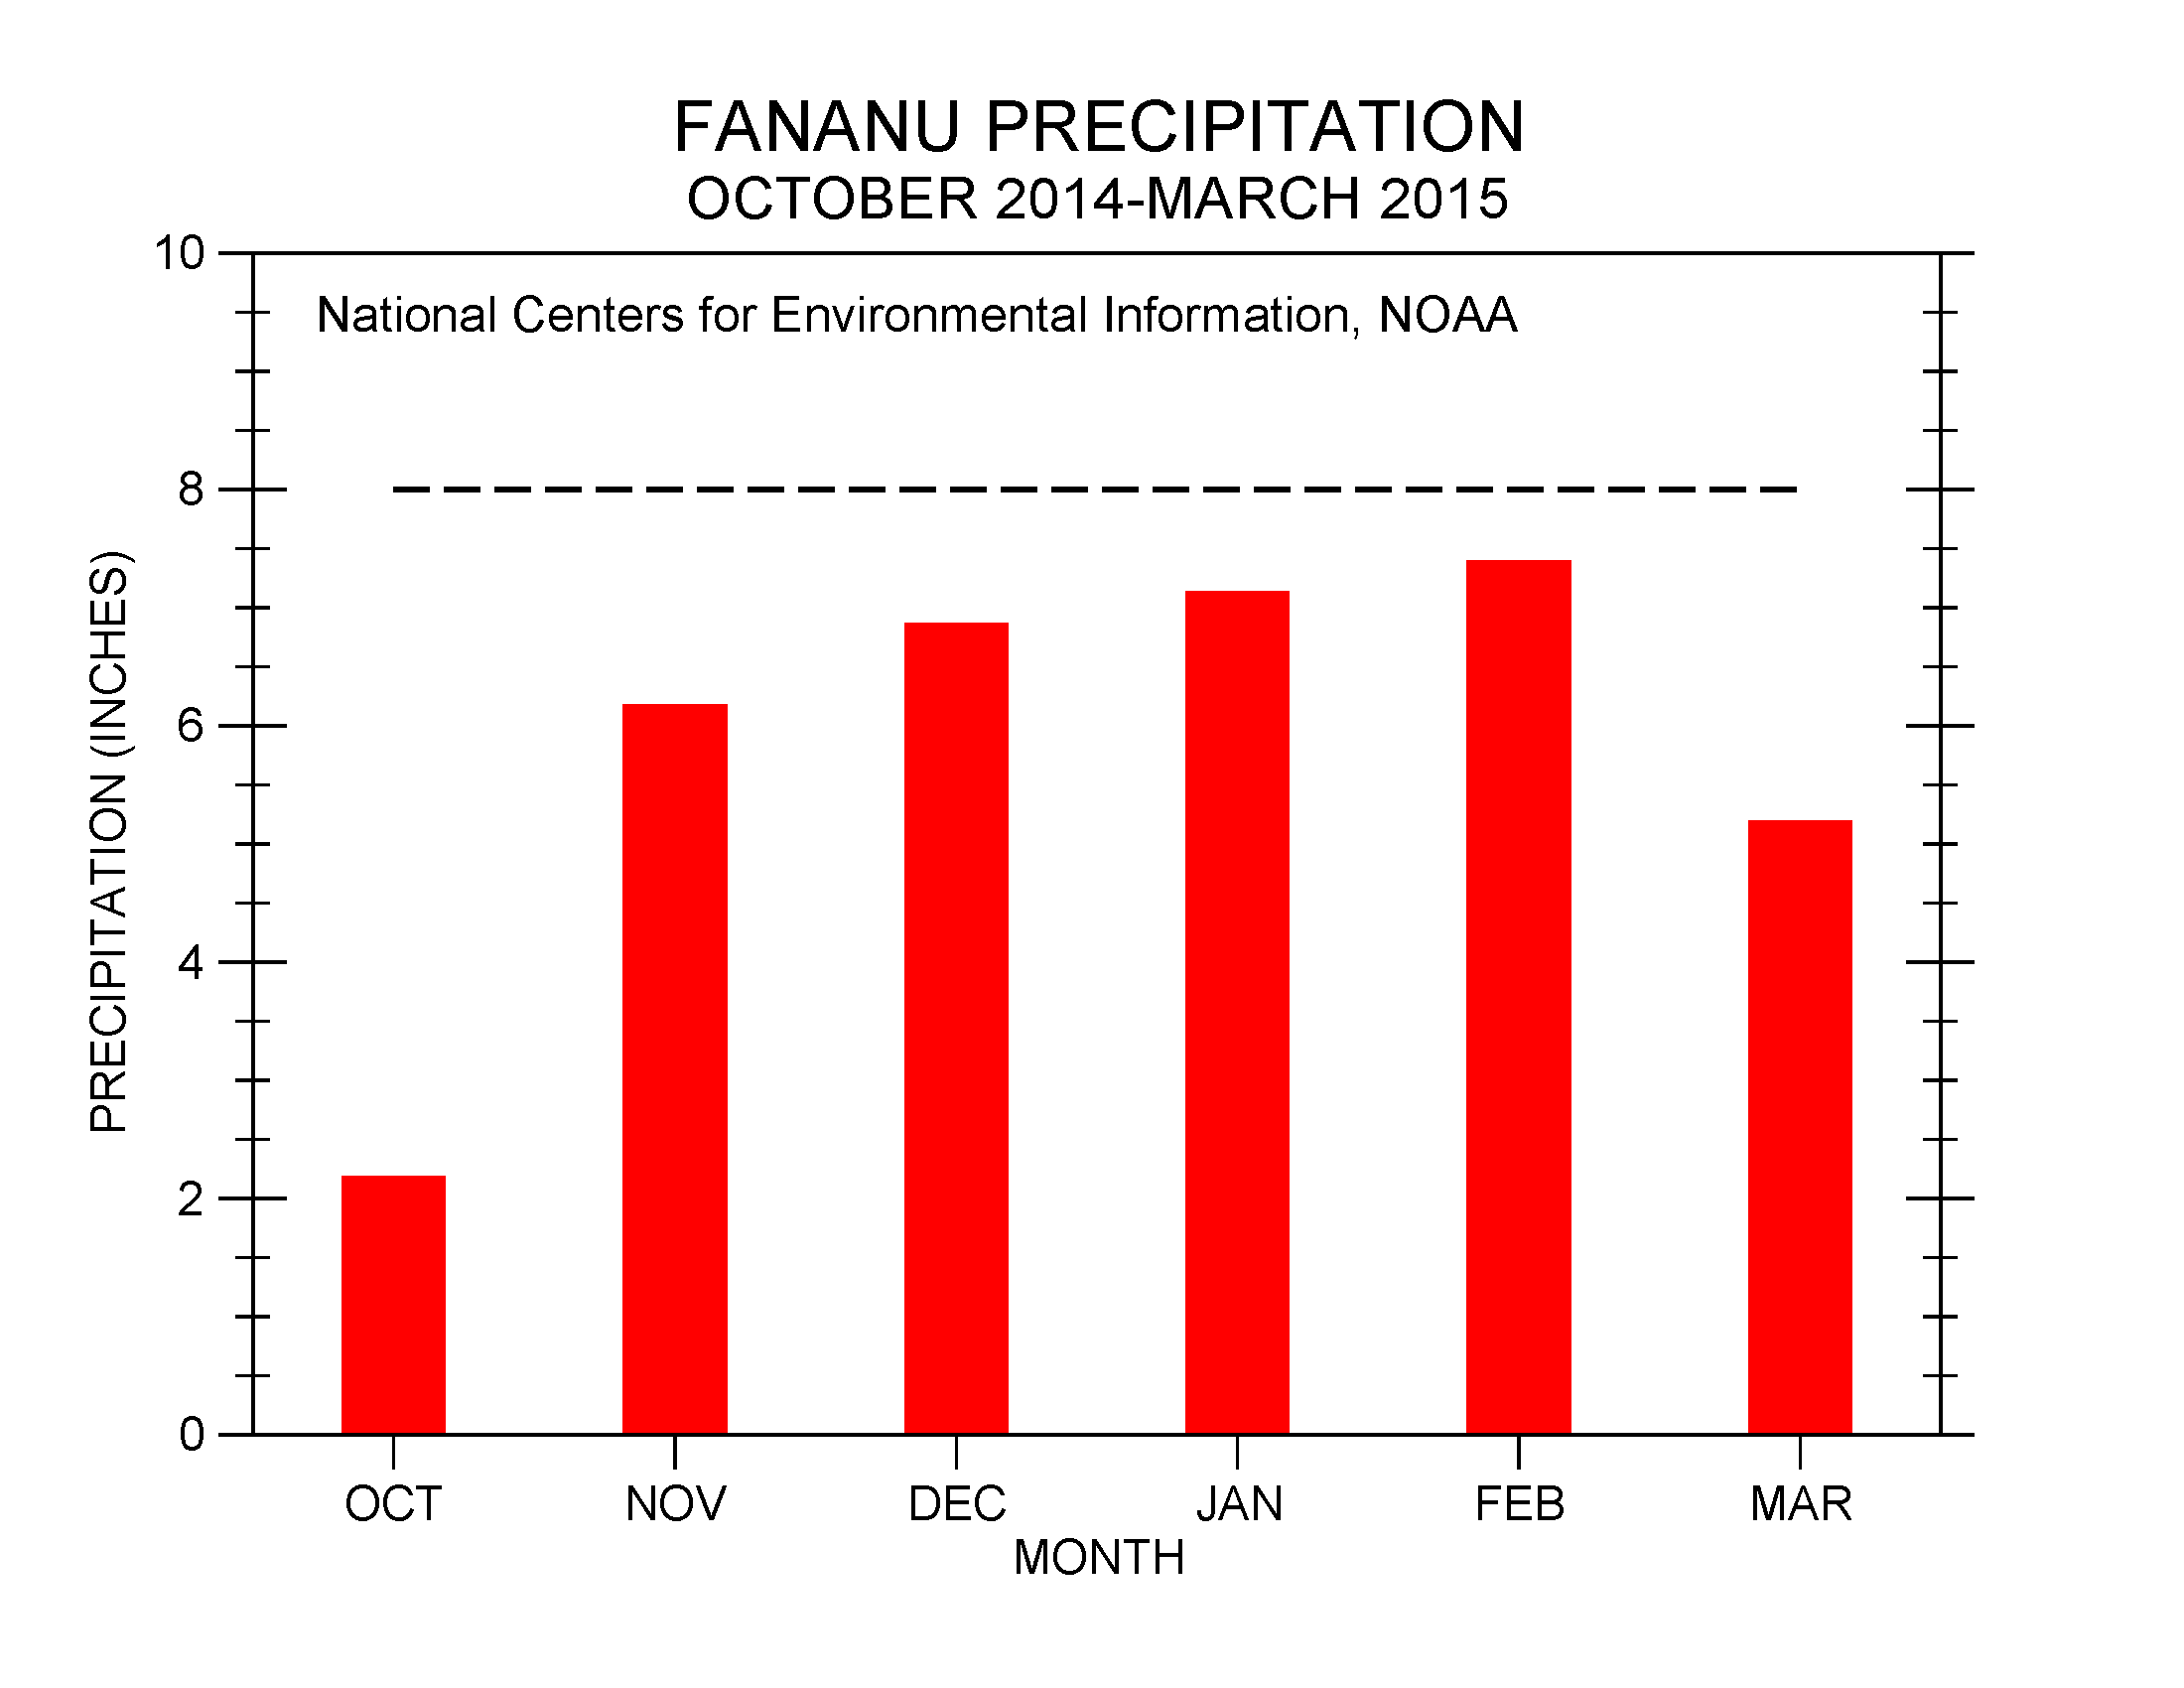
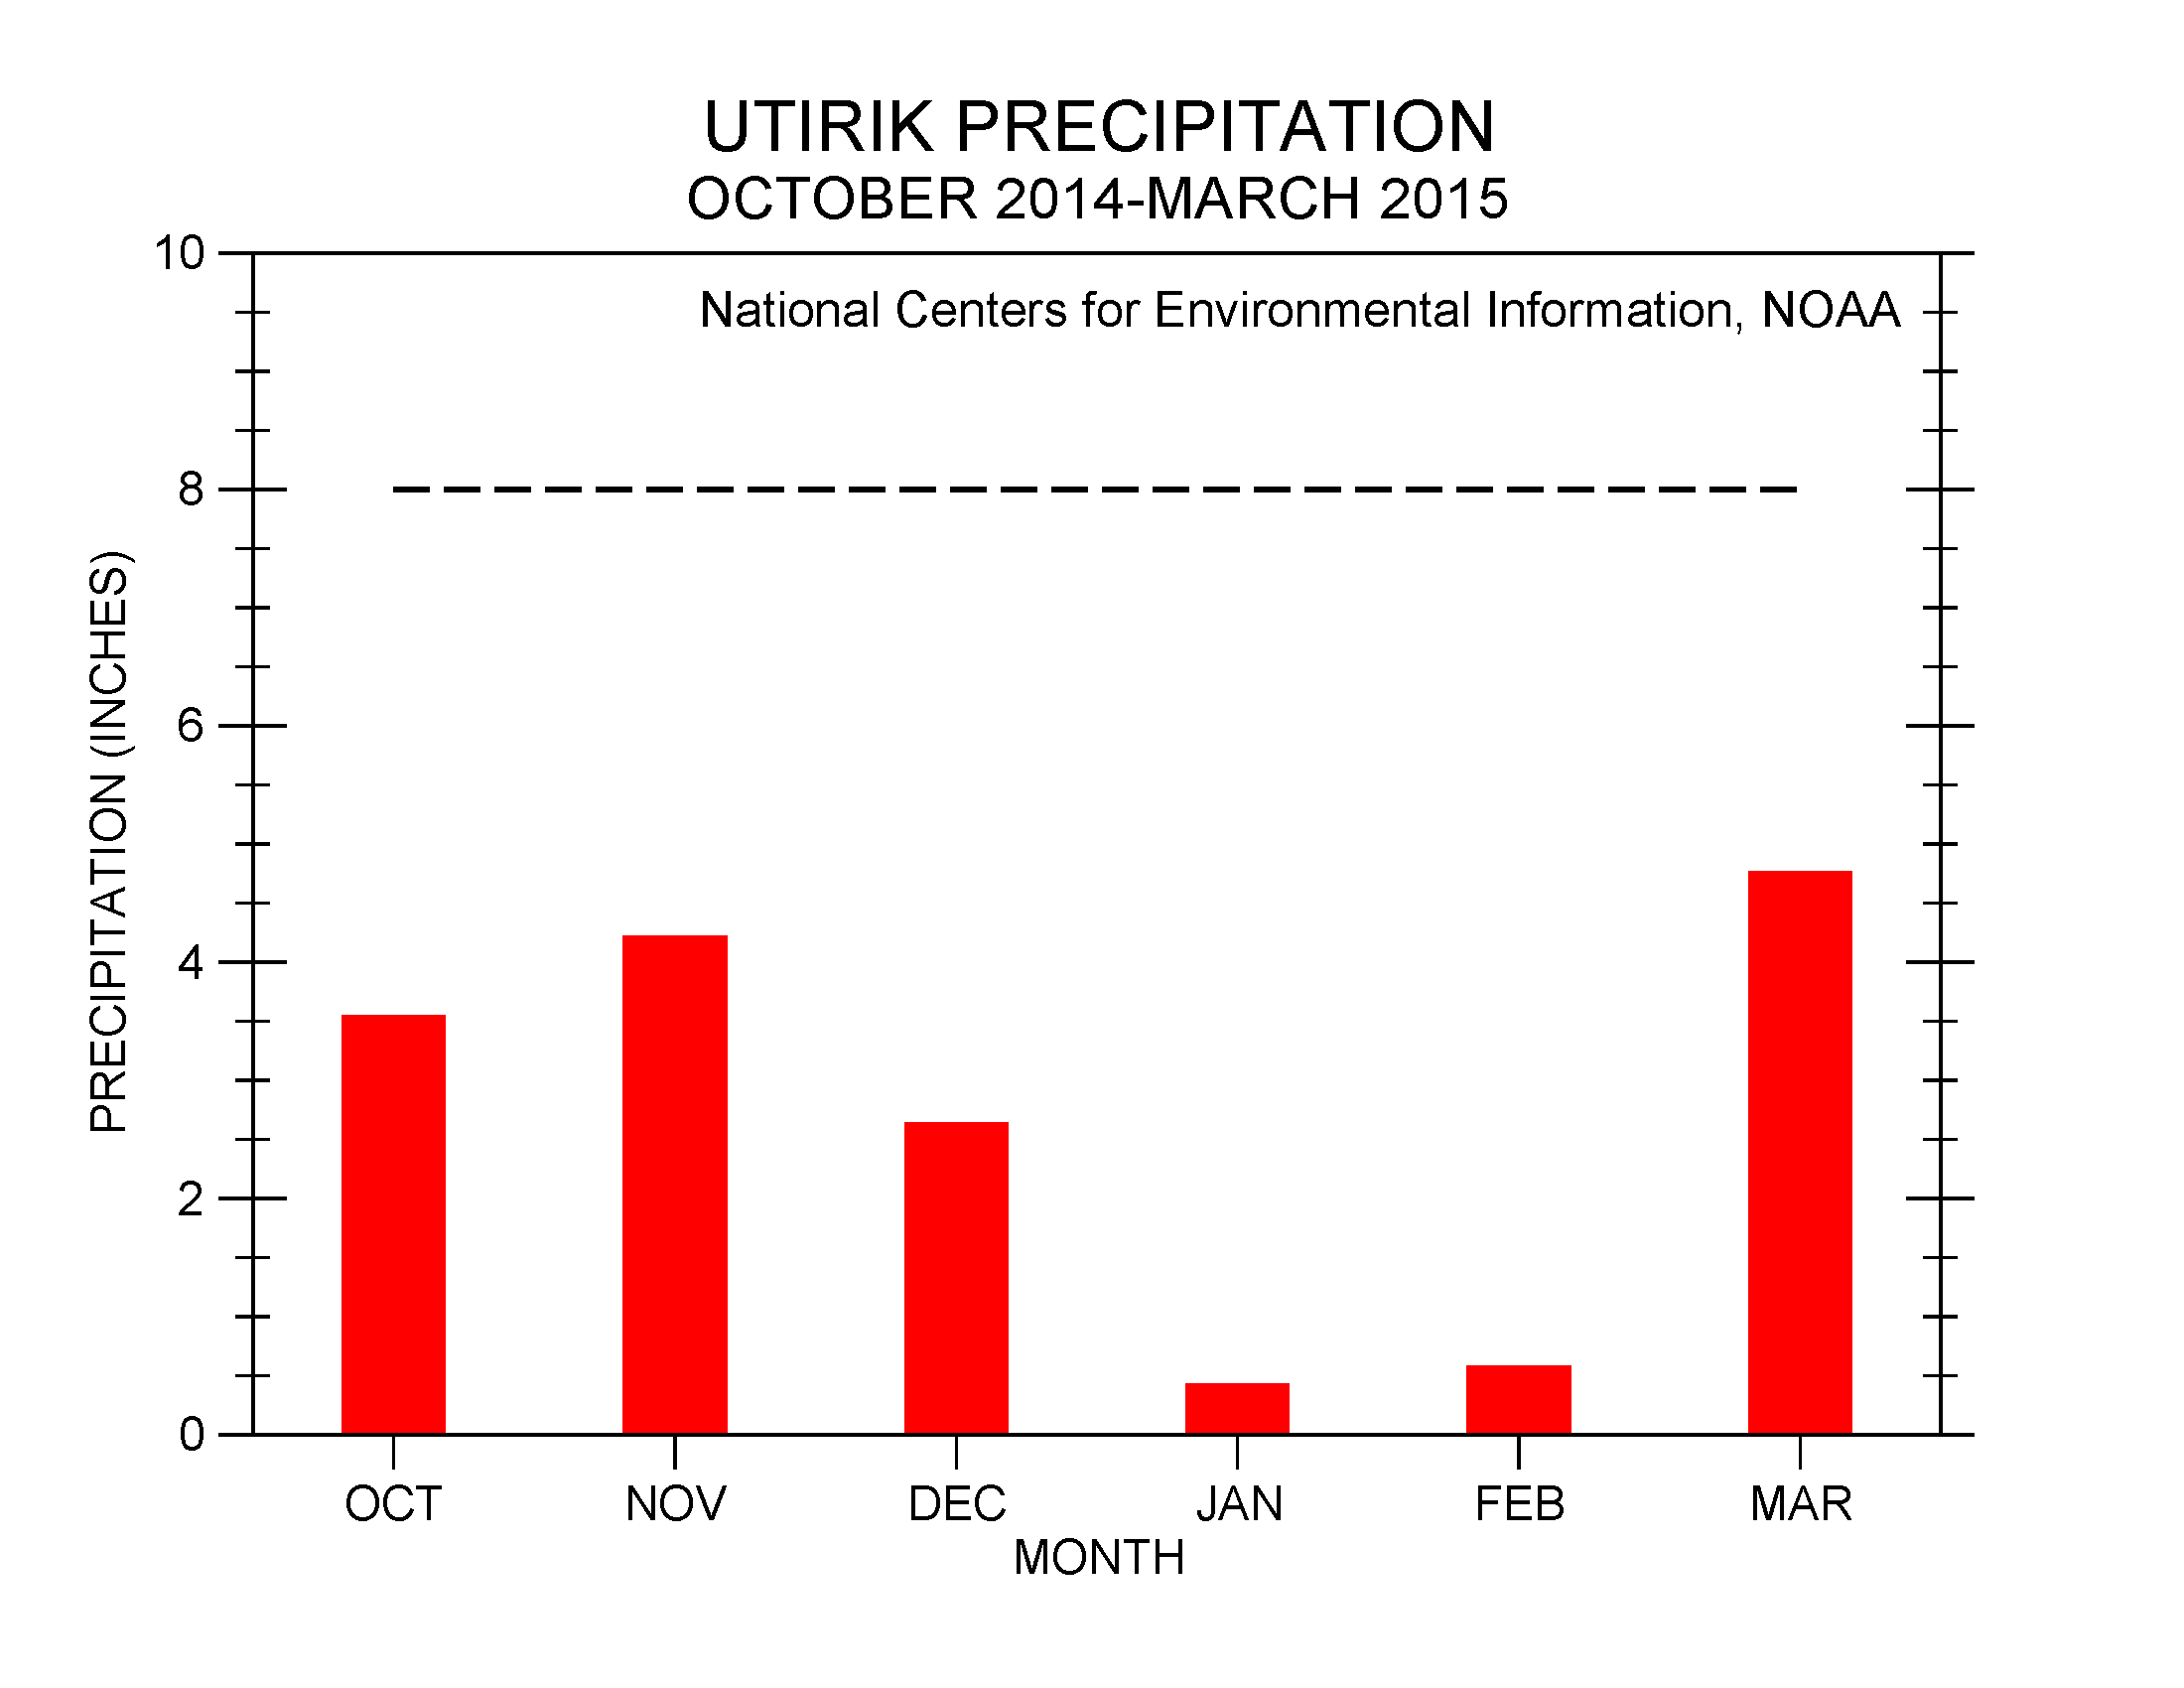
At most of the drier-than-normal stations, the rainfall amounts were below the minimum thresholds (4 or 8 inches) required to meet most monthly water needs. The 4- and 8-inch thresholds are important because, if monthly precipitation falls below the threshold, then drought becomes a concern. While some stations in the Marshall Islands benefited from the tropical systems, others continued dry. Kwajalein, Majuro, and Mili received well over 20 inches of rain, while Ailinglapalap and Utirik reported less than 8 inches. In Micronesia, Chuuk and Pohnpei received over 17 inches of rain, while Fananu, Kapingamarangi, Nukuoro, and Yap reported less than 8 inches, and Pingelap, Tofol, and Ulithi reported less than 4 inches.
Ailinglapalap, Koror, and Yap were below the 8-inch threshold for the third consecutive month. Four of the last five months have been drier than 8 inches at North Fanif, Ulithi, Yap, and Rumung. Five of the last six months have been drier than 8 inches at Koror. Fananu has been below the 8-inch threshold for six consecutive months. Utirik has had less than 8 inches of rain for the six consecutive month, four of which were below the 4-inch threshold.
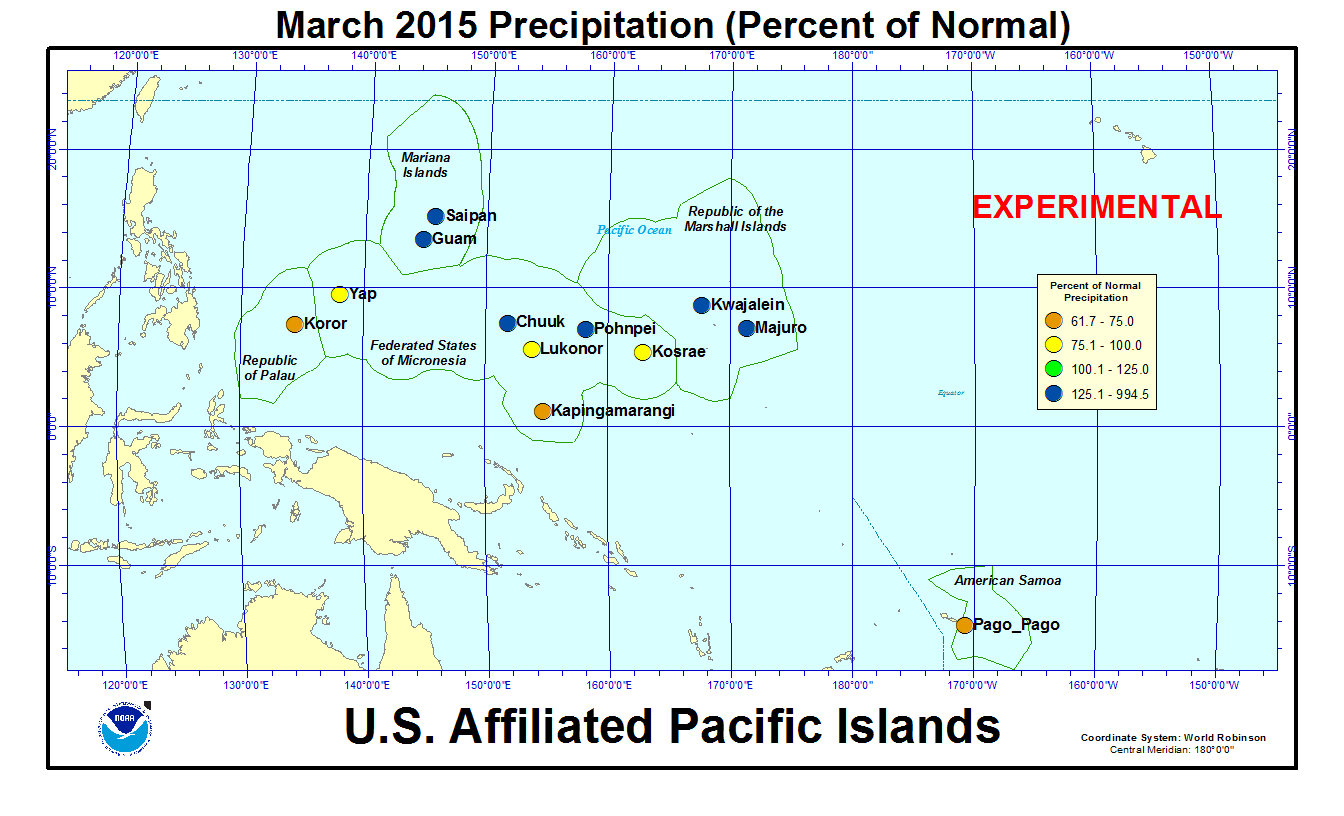
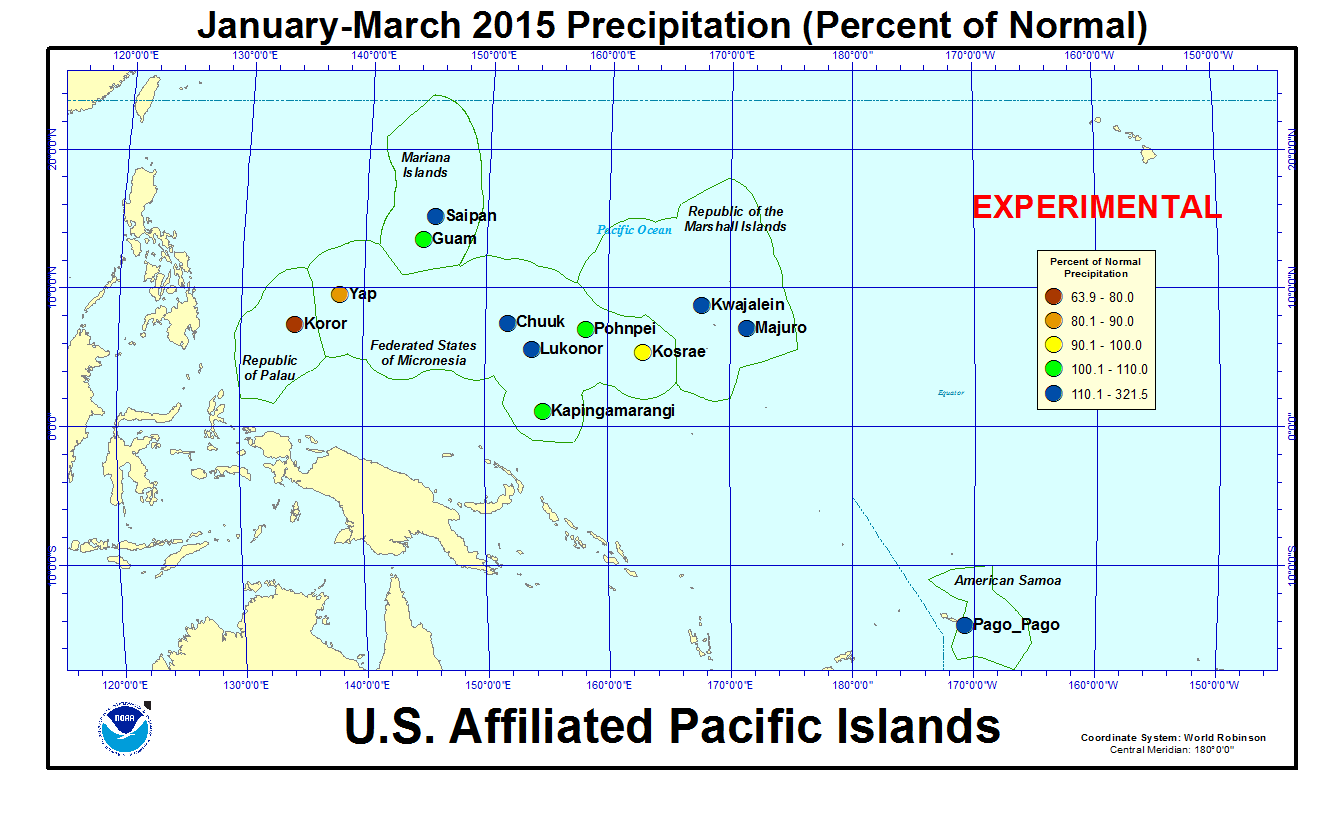
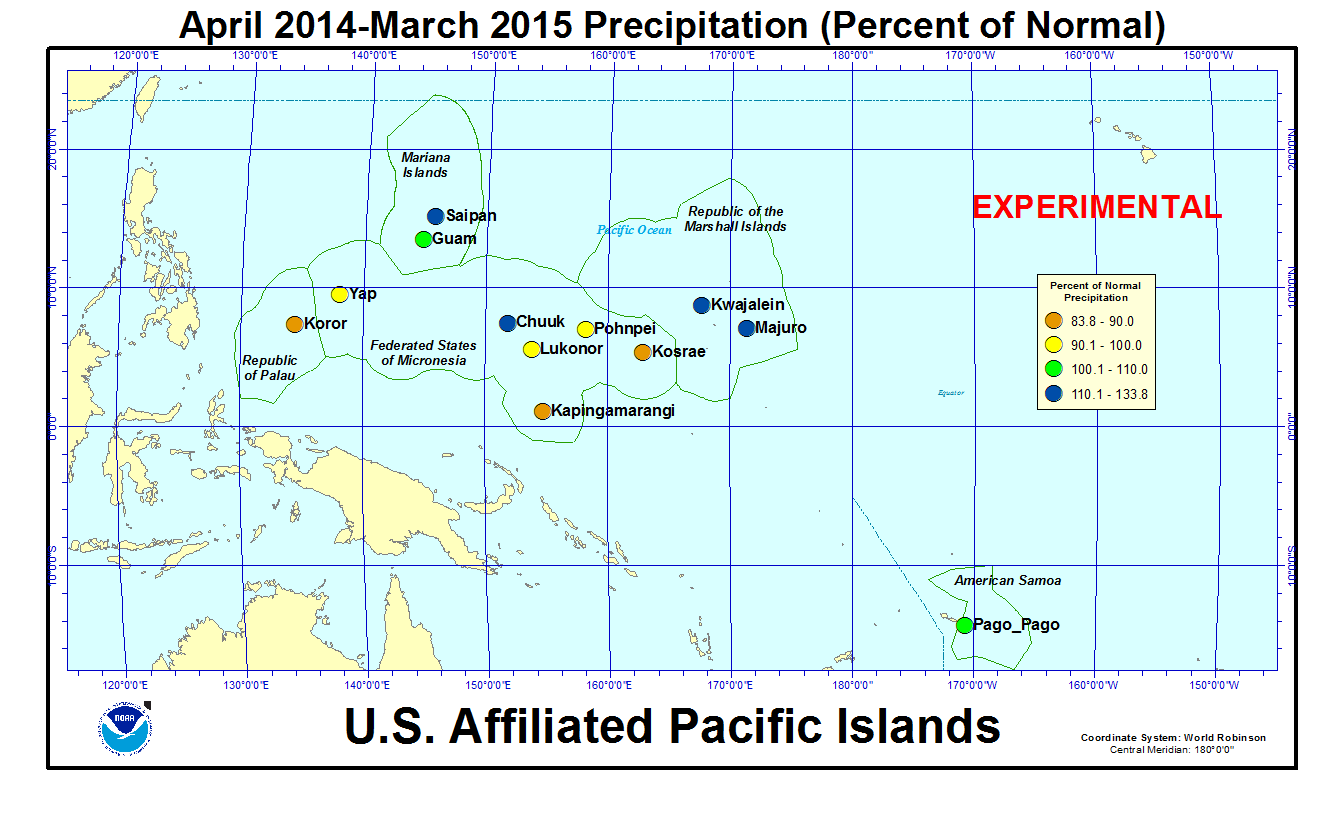
As measured by percent of normal precipitation, Koror, Kapingamarangi, Kosrae, and Yap were drier than normal in both the short term (March and year to date [January-March 2015]) and long term (12-month time scale, April 2014-March 2015). Pago Pago was drier than normal in March but mostly wetter than normal. Lukonor and Pohnpei were wet in the short term but dry in the long term. Chuuk, Guam, Kwajalein, Majuro, and Saipan were wetter than normal at both the short- and long-term time scales.
| Station Name | Apr 2014 | May 2014 | Jun 2014 | Jul 2014 | Aug 2014 | Sep 2014 | Oct 2014 | Nov 2014 | Dec 2014 | Jan 2015 | Feb 2015 | Mar 2015 | Apr- Mar |
|---|---|---|---|---|---|---|---|---|---|---|---|---|---|
| Chuuk | 111% | 116% | 76% | 125% | 121% | 166% | 120% | 66% | 57% | 142% | 134% | 209% | 113% |
| Guam NAS | 108% | 99% | 98% | 290% | 62% | 108% | 164% | 75% | 76% | 213% | 6% | 198% | 106% |
| Kapingamarangi | 43% | 83% | 56% | 86% | 96% | 109% | 130% | 140% | 116% | 229% | 131% | 62% | 89% |
| Koror | 224% | 63% | 57% | 121% | 77% | 137% | 63% | 54% | 118% | 64% | 83% | 69% | 84% |
| Kosrae | 150% | 93% | 117% | 175% | 59% | 77% | 114% | 68% | 86% | 116% | 114% | 91% | 89% |
| Kwajalein | 366% | 80% | 104% | 120% | 58% | 88% | 154% | 96% | 68% | 74% | 149% | 994% | 134% |
| Lukonor | 72% | 116% | 110% | 78% | 77% | 146% | 138% | 70% | 86% | 228% | 97% | 99% | 93% |
| Majuro | 246% | 75% | 90% | 201% | 82% | 134% | 88% | 66% | 67% | 106% | 63% | 329% | 119% |
| Pago Pago | 152% | 81% | 154% | 333% | 60% | 40% | 29% | 136% | 141% | 201% | 102% | 64% | 108% |
| Pohnpei | 87% | 87% | 121% | 108% | 74% | 128% | 100% | 108% | 104% | 78% | 100% | 138% | 99% |
| Saipan | 168% | 205% | 92% | 113% | 71% | 191% | 105% | 265% | 47% | 184% | 14% | 315% | 128% |
| Yap | 226% | 39% | 83% | 110% | 65% | 125% | 77% | 84% | 197% | 92% | 89% | 93% | 97% |
| Station Name | Apr 2014 | May 2014 | Jun 2014 | Jul 2014 | Aug 2014 | Sep 2014 | Oct 2014 | Nov 2014 | Dec 2014 | Jan 2015 | Feb 2015 | Mar 2015 | Apr- Mar |
|---|---|---|---|---|---|---|---|---|---|---|---|---|---|
| Chuuk | 13.80" | 13.06" | 8.91" | 14.92" | 15.55" | 19.44" | 13.78" | 6.99" | 6.46" | 14.32" | 9.68" | 17.37" | 154.28" |
| Guam NAS | 2.74" | 3.36" | 6.08" | 29.39" | 9.08" | 13.66" | 18.77" | 5.51" | 3.87" | 8.56" | 0.18" | 4.09" | 105.29" |
| Kapingamarangi | 5.83" | 9.97" | 7.77" | 12.16" | 7.84" | 10.86" | 10.64" | 13.02" | 11.37" | 20.91" | 12.19" | 7.05" | 129.61" |
| Koror | 16.38" | 7.45" | 9.91" | 22.45" | 10.40" | 16.10" | 7.45" | 6.12" | 13.14" | 6.48" | 7.07" | 5.11" | 128.06" |
| Kosrae | 26.29" | 16.59" | 17.08" | 26.06" | 8.32" | 11.00" | 12.51" | 9.38" | 13.80" | 19.28" | 14.73" | 14.57" | 189.61" |
| Kwajalein | 19.24" | 5.36" | 7.22" | 11.88" | 5.61" | 9.49" | 17.17" | 10.80" | 4.54" | 2.33" | 3.94" | 23.37" | 120.95" |
| Lukonor | 8.18" | 13.58" | 12.85" | 12.50" | 10.80" | 14.79" | 15.57" | 6.37" | 9.65" | 19.16" | 8.70" | 9.16" | 141.31" |
| Majuro | 23.20" | 7.58" | 9.86" | 22.49" | 9.64" | 14.93" | 11.14" | 8.85" | 7.68" | 8.24" | 4.32" | 21.65" | 149.58" |
| Pago Pago | 14.29" | 7.84" | 8.22" | 18.48" | 3.22" | 2.60" | 2.68" | 13.76" | 18.13" | 26.87" | 12.22" | 6.88" | 135.19" |
| Pohnpei | 15.96" | 17.33" | 17.95" | 16.74" | 10.52" | 16.06" | 15.32" | 15.97" | 16.67" | 10.24" | 9.58" | 18.14" | 180.48" |
| Saipan | 4.41" | 4.87" | 3.32" | 10.04" | 9.33" | 19.31" | 11.15" | 14.87" | 1.80" | 4.66" | 0.35" | 5.95" | 90.06" |
| Yap | 12.72" | 3.07" | 9.95" | 16.62" | 9.58" | 16.89" | 9.34" | 7.40" | 16.77" | 5.86" | 4.60" | 4.22" | 117.02" |
| Station Name | Apr 2014 | May 2014 | Jun 2014 | Jul 2014 | Aug 2014 | Sep 2014 | Oct 2014 | Nov 2014 | Dec 2014 | Jan 2015 | Feb 2015 | Mar 2015 | Apr- Mar |
|---|---|---|---|---|---|---|---|---|---|---|---|---|---|
| Chuuk | 12.47" | 11.30" | 11.66" | 11.98" | 12.86" | 11.71" | 11.51" | 10.61" | 11.25" | 10.10" | 7.25" | 8.32" | 136.77" |
| Guam NAS | 2.53" | 3.40" | 6.18" | 10.14" | 14.74" | 12.66" | 11.44" | 7.38" | 5.11" | 4.01" | 3.03" | 2.07" | 99.09" |
| Kapingamarangi | 13.64" | 12.08" | 13.78" | 14.15" | 8.13" | 9.93" | 8.19" | 9.27" | 9.84" | 9.15" | 9.27" | 11.43" | 145.85" |
| Koror | 7.32" | 11.83" | 17.48" | 18.53" | 13.50" | 11.77" | 11.84" | 11.39" | 11.16" | 10.18" | 8.56" | 7.44" | 152.90" |
| Kosrae | 17.51" | 17.75" | 14.64" | 14.91" | 14.22" | 14.22" | 10.94" | 13.83" | 16.11" | 16.67" | 12.93" | 16.06" | 213.87" |
| Kwajalein | 5.26" | 6.72" | 6.93" | 9.87" | 9.74" | 10.74" | 11.18" | 11.28" | 6.66" | 3.16" | 2.64" | 2.35" | 90.41" |
| Lukonor | 11.31" | 11.69" | 11.65" | 15.93" | 14.04" | 10.15" | 11.32" | 9.08" | 11.27" | 8.41" | 8.93" | 9.26" | 151.36" |
| Majuro | 9.42" | 10.11" | 11.01" | 11.17" | 11.69" | 11.17" | 12.73" | 13.44" | 11.39" | 7.74" | 6.88" | 6.58" | 125.25" |
| Pago Pago | 9.39" | 9.66" | 5.33" | 5.55" | 5.38" | 6.53" | 9.26" | 10.14" | 12.84" | 13.34" | 12.00" | 10.68" | 125.57" |
| Pohnpei | 18.41" | 19.96" | 14.81" | 15.43" | 14.26" | 12.55" | 15.27" | 14.83" | 16.08" | 13.18" | 9.55" | 13.17" | 182.36" |
| Saipan | 2.63" | 2.38" | 3.62" | 8.91" | 13.13" | 10.09" | 10.62" | 5.61" | 3.85" | 2.53" | 2.59" | 1.89" | 70.25" |
| Yap | 5.63" | 7.85" | 12.04" | 15.08" | 14.82" | 13.50" | 12.18" | 8.83" | 8.51" | 6.39" | 5.19" | 4.56" | 120.31" |
[top]
State/Regional/National Moisture Status
A detailed review of drought and moisture conditions is available for all contiguous U.S. states, the nine standard regions, and the nation (contiguous U.S.):
| northeast u. s. | east north central u. s. | central u. s. |
| southeast u. s. | west north central u. s. | south u. s. |
| southwest u. s. | northwest u. s. | west u. s. |
| Contiguous United States |
[top]
Contacts & Questions