Contents Of This Report:
|
|
Please note that the values presented in this report are based on preliminary data. They will change when the final data are processed, but will not be replaced on these pages.
National Drought Overview
|
|
[top]
Detailed Drought Discussion
Overview
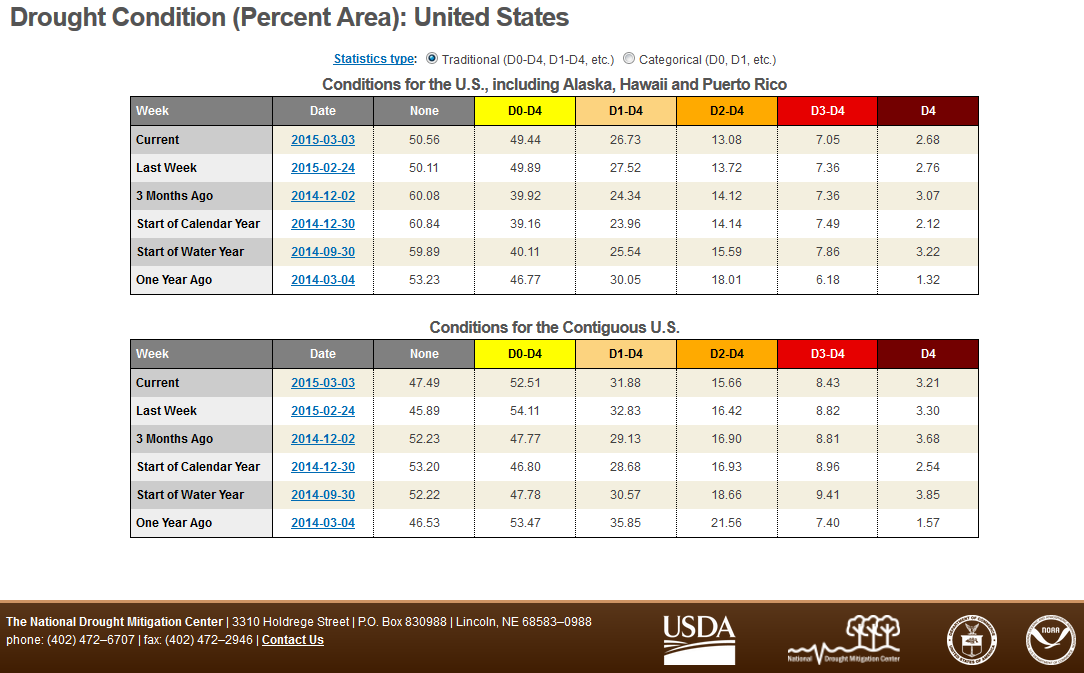
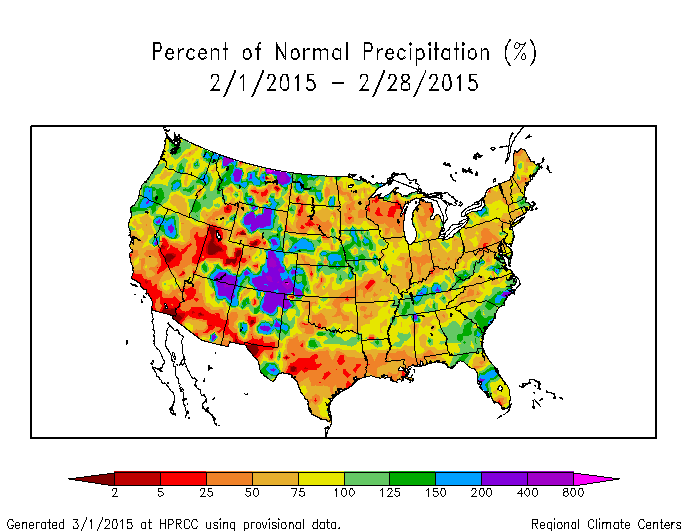
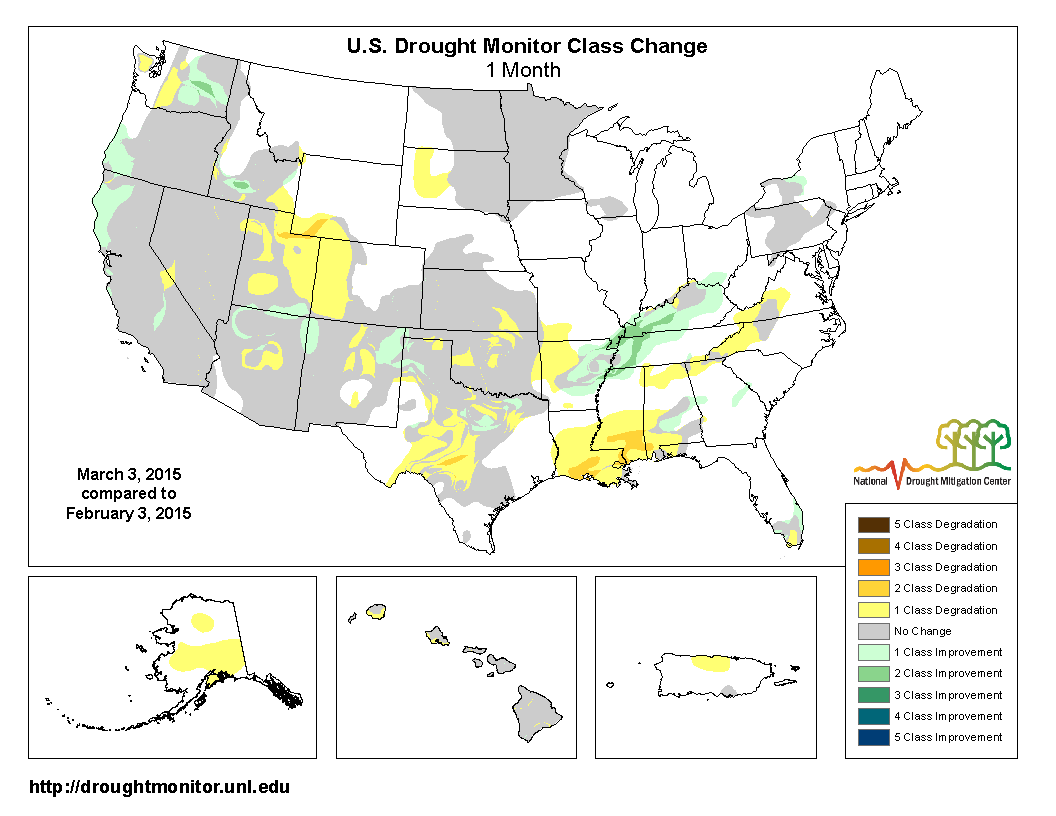
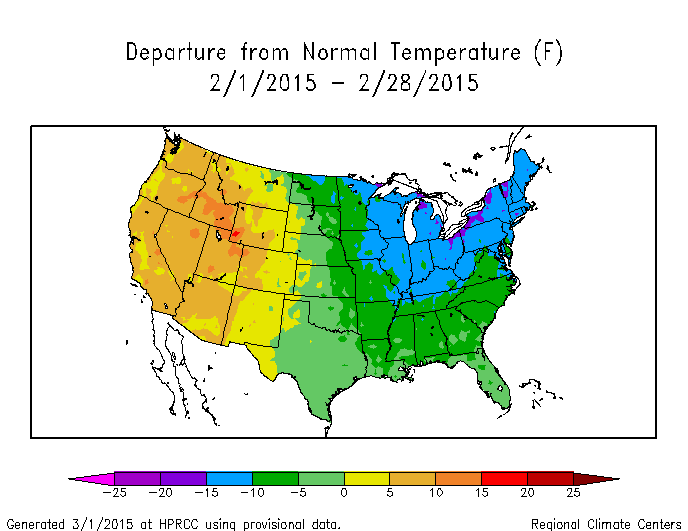
February 2015 was dominated by an upper-level circulation pattern that consisted of a long-wave ridge over the western CONUS and a long-wave trough over the East. The ridge deflected many Pacific weather systems and generally inhibited precipitation over the West, resulting in large areas with below-normal precipitation. Short-wave troughs and low pressure centers moving in the upper-level flow would ride across the top of the ridge and occasionally produce a storm system that brought precipitation, generally to the Pacific Northwest and Rocky Mountains. But the precipitation was mostly rain instead of snow, due to the well-above-normal temperatures caused by the ridge, and contributed little toward helping the much-below-normal mountain snowpack recover, especially in the coastal ranges. As a result, drought expanded in the West, primarily in the intermountain basin and Central Rockies. The upper-level trough funneled cold and dry polar air masses into the central and eastern CONUS and kept Gulf of Mexico moisture out of the Northern Plains to Upper Midwest. Low pressure systems formed along the cold fronts associated with the polar air masses, bringing a wintry mix of precipitation to the Southern and Central Plains, Midwest, South, and Northeast. While these storms expanded the snow cover area, their precipitation was not enough to give many areas a monthly total that was above normal. Consequently, February ended up drier than normal for much of the Plains, Midwest, and Northeast. Drought expanded in the Southern Plains and along the Central Gulf of Mexico Coast, but contracted from the Mid-Mississippi Valley to Ohio Valley. February was drier than normal across much of Alaska and the Hawaiian Islands, with drought and abnormal dryness expanding in both states. When integrated across the CONUS, February 2015 ranked as the 20th driest February in the 1895-2015 record. On balance, the national drought footprint expanded when compared to last month, increasing from 23.9 percent of the U.S. as a whole to about 26.7 percent of the U.S. in moderate to exceptional drought, according to USDM statistics. According to the Palmer Drought Index, which goes back to the beginning of the 20th century, about 15.0 percent of the CONUS was in moderate to extreme drought at the end of February, an increase of about 3.6 percent compared to last month.
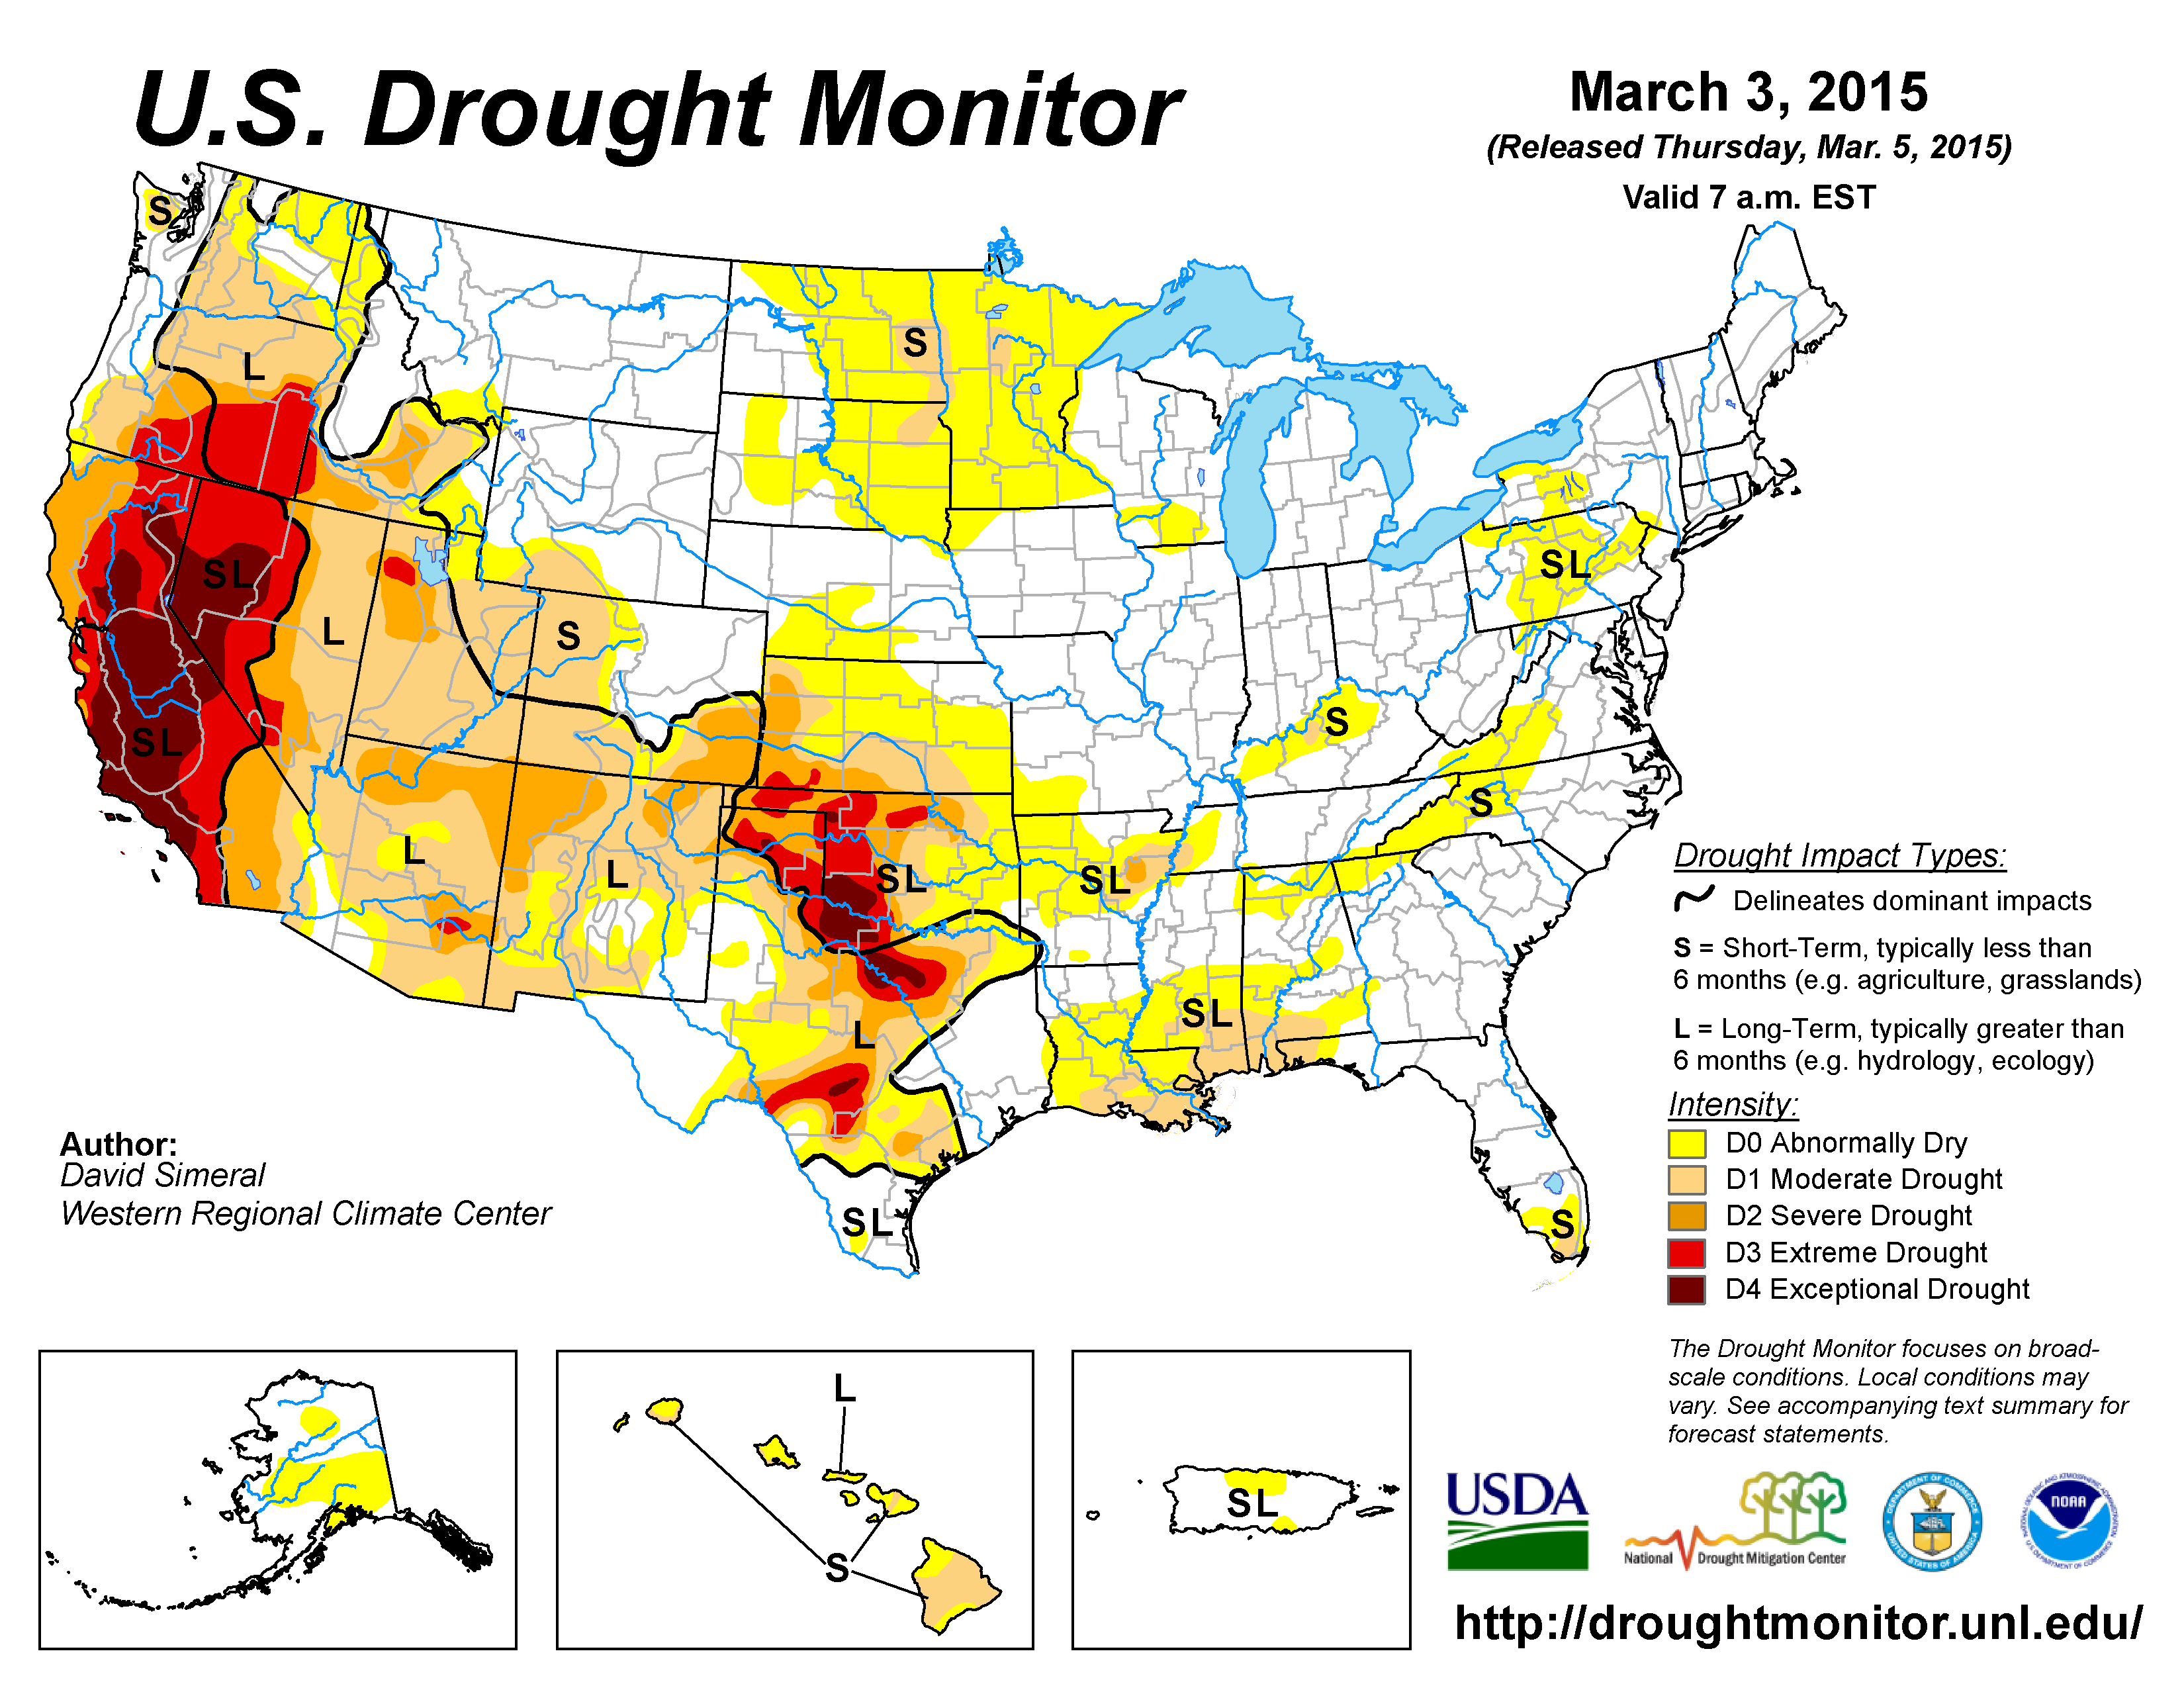
The U.S. Drought Monitor drought map valid March 3, 2015.
By the end of the month:
- moderate (D1) drought covered a large area of the U.S. from the West Coast to the Central and Southern Great Plains, connected across parts of New Mexico, with large areas of more intense drought within the moderate drought area;
- there were two epicenters of extreme (D3) to exceptional (D4) drought within this large moderate to severe (D2) drought area — one located in the California-Nevada-Oregon region and the other in the Southern Plains centered in northern Texas and adjacent Oklahoma; and
- areas of moderate drought persisted along parts of the Gulf of Mexico coast from Louisiana to Florida, in Hawaii, in Arkansas, and in the Northern Plains.
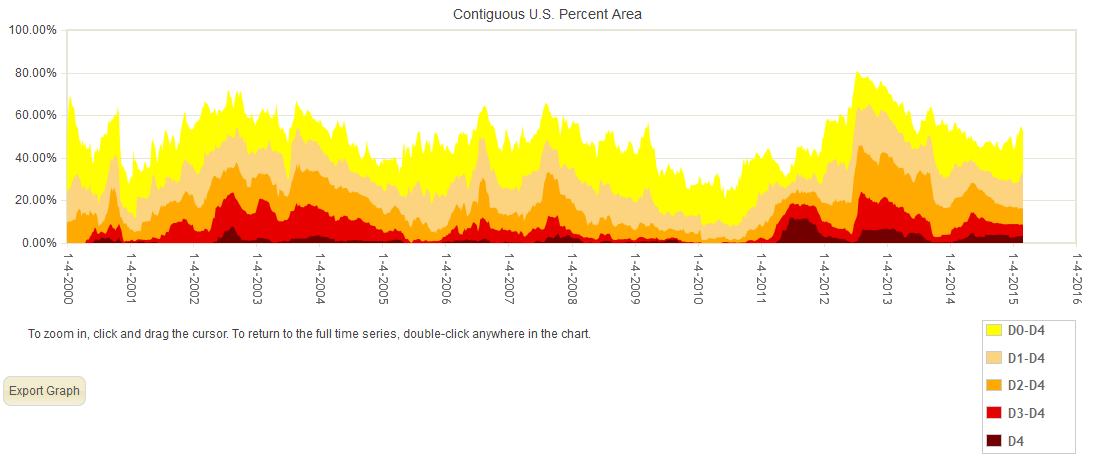
Percent area of the CONUS in moderate to exceptional drought, January 4, 2000 to present, based on the U.S. Drought Monitor.
Palmer Drought Index
The Palmer drought indices measure the balance between moisture demand (evapotranspiration driven by temperature) and moisture supply (precipitation). The Palmer Z Index depicts moisture conditions for the current month, while the Palmer Hydrological Drought Index (PHDI) and Palmer Drought Severity Index (PDSI) depict the current month's cumulative moisture conditions integrated over the last several months. While both the PDSI and PHDI indices show long-term moisture conditions, the PDSI depicts meteorological drought while the PHDI depicts hydrological drought. The PDSI map shows less severe and extensive drought in the West and parts of the Plains than the PHDI map because the meteorological conditions that produce drought are not as long-lasting as the hydrological impacts.
|
 |
Used together, the Palmer Z Index and PDSI maps show that short-term dry conditions occurred over parts of the West, which had areas in long-term drought during January, maintaining or intensifying drought by the end of February. Short-term dry conditions reduced the January long-term wet conditions over the Upper Midwest and Northeast. Short-term dry conditions occurred over the the January near-normal conditions along the Central Gulf of Mexico Coast, but were not intense enough to show up as long-term drought.
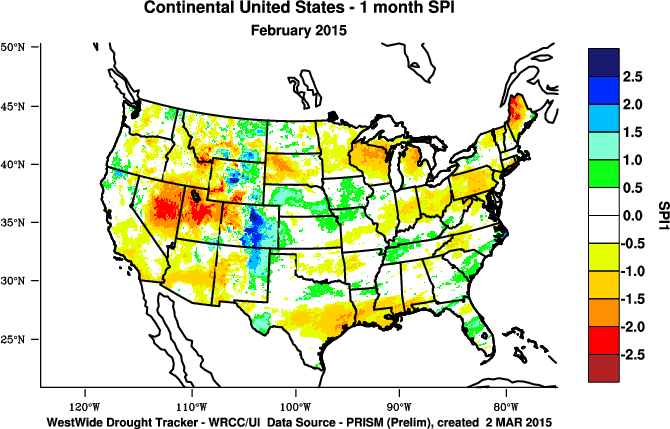
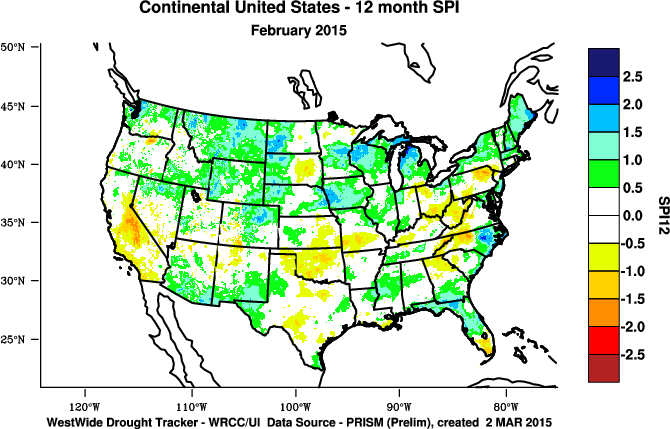
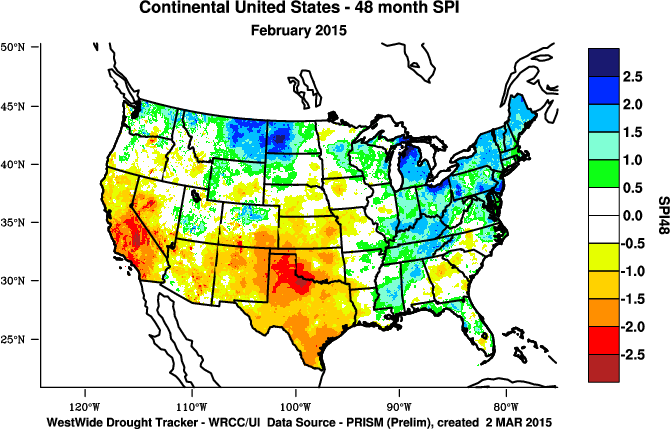
Standardized Precipitation Index
The Standardized Precipitation Index (SPI) measures moisture supply. The SPI maps here show the spatial extent of anomalously wet and dry areas at time scales ranging from 1 month to 24 months.
 |
 |
 |
The SPI maps illustrate how moisture conditions have varied considerably through time and space over the last two years. Dryness across parts of the Northern Plains to Northeast is evident in February and the last 2 to 3 months and even extends as far back as 6 months. Much of the Central Plains to Mid-Atlantic States has been dry, especially at the 2 to 3 month time scale. Dryness along the Gulf of Mexico Coast has been acute during February and the last 6 to 9 months. The West Coast (except California's interior valleys) received enough precipitation in February and December, and earlier, to register as near-normal on the February and 3 to 12 month SPI maps, but January dryness is behind the widespread dry conditions across the West at 2 months. Great Basin dryness is evident at the 1 to 6-month time scales. The long-term dryness in the West and Southern Plains shows up at the 24-month time scale.
 |
 |
 |
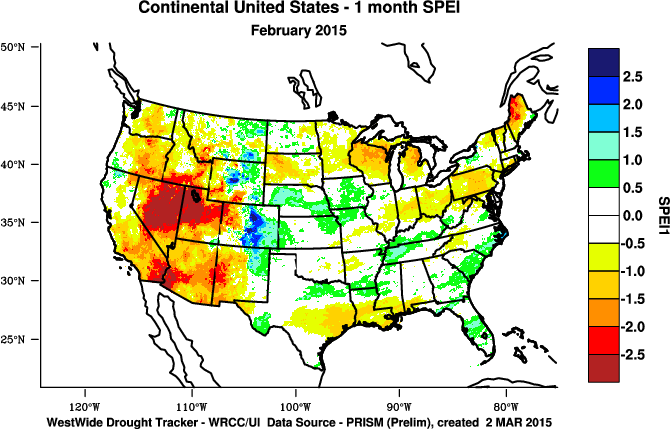
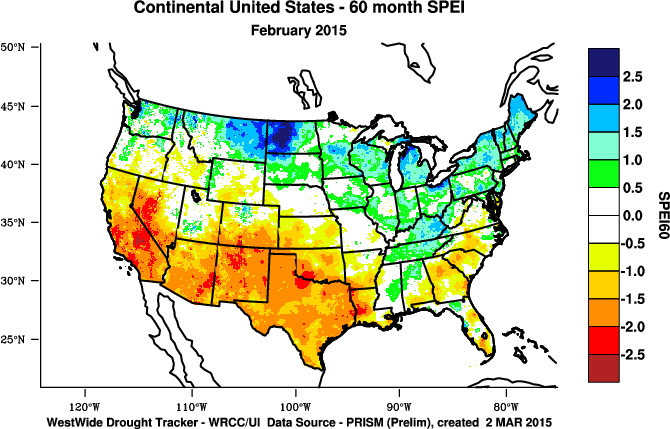
Standardized Precipitation Evapotranspiration Index
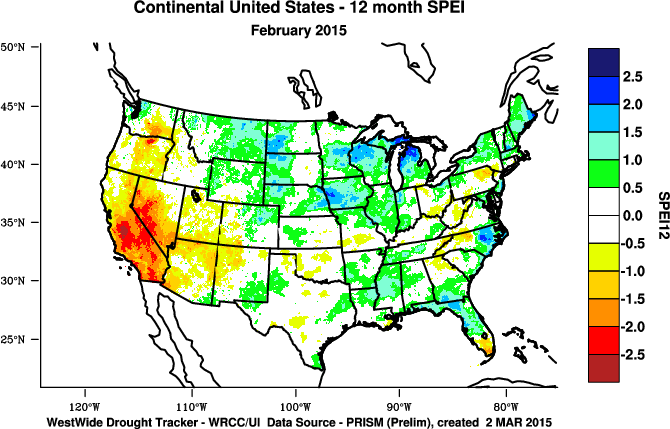
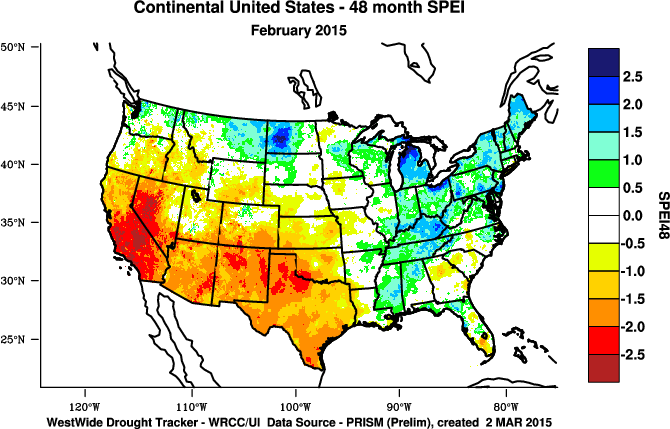
The SPI measures water supply (precipitation), while the SPEI (Standardized Precipitation Evapotranspiration Index) measures the combination of water supply (precipitation) and water demand (evapotranspiration as computed from temperature). Warmer temperatures tend to increase evapotranspiration, which generally makes droughts more intense.
 |
 |
Temperatures were unusually warm in the West during February. In winter when temperatures are normally low, the effect of the warm temperature anomalies is usually muted, but the magnitude of the record warm February temperatures made a noticeable difference in the SPEI and SPI. When the entire year is considered, the record warm temperatures in the West significantly intensified drought conditions when the 12-month SPEI is compared to the SPI. The unusual western warmth of the last several years contributed to more intense drought on the SPEI maps compared to the SPI maps at longer time scales.
 |
 |
Agricultural, Hydrological, and Meteorological Indices and Impacts
 |
 |
Drought conditions were reflected in numerous agricultural, hydrological, and other meteorological indicators, both observed and modeled.
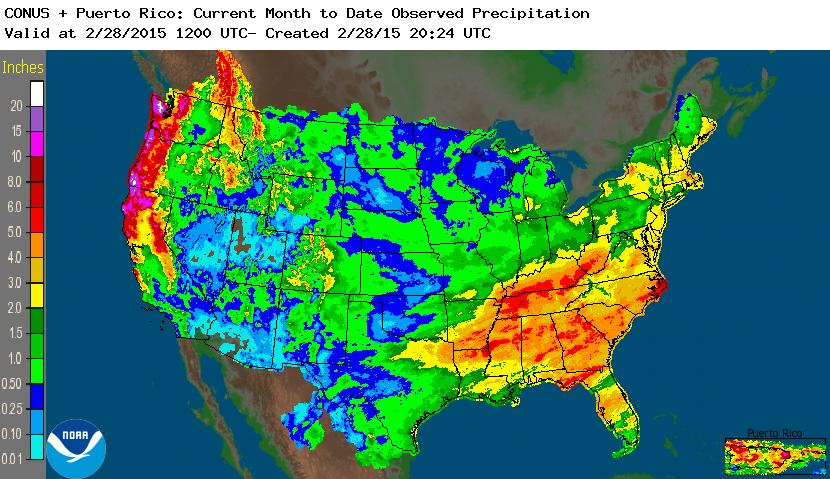
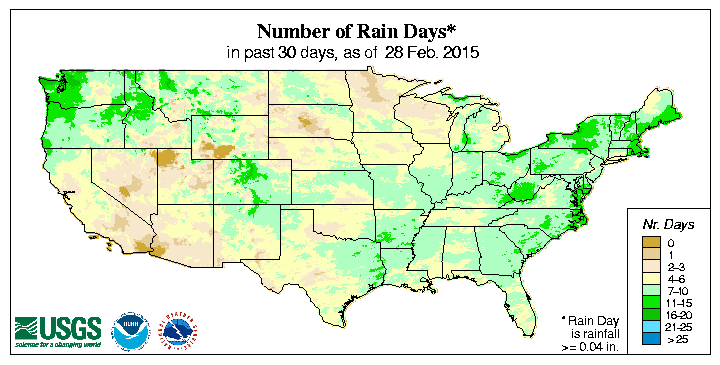
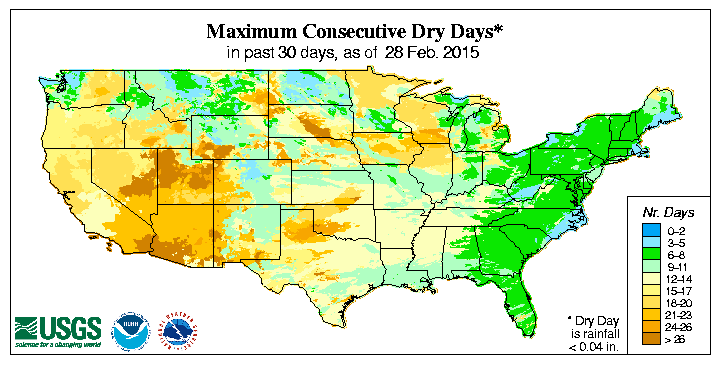
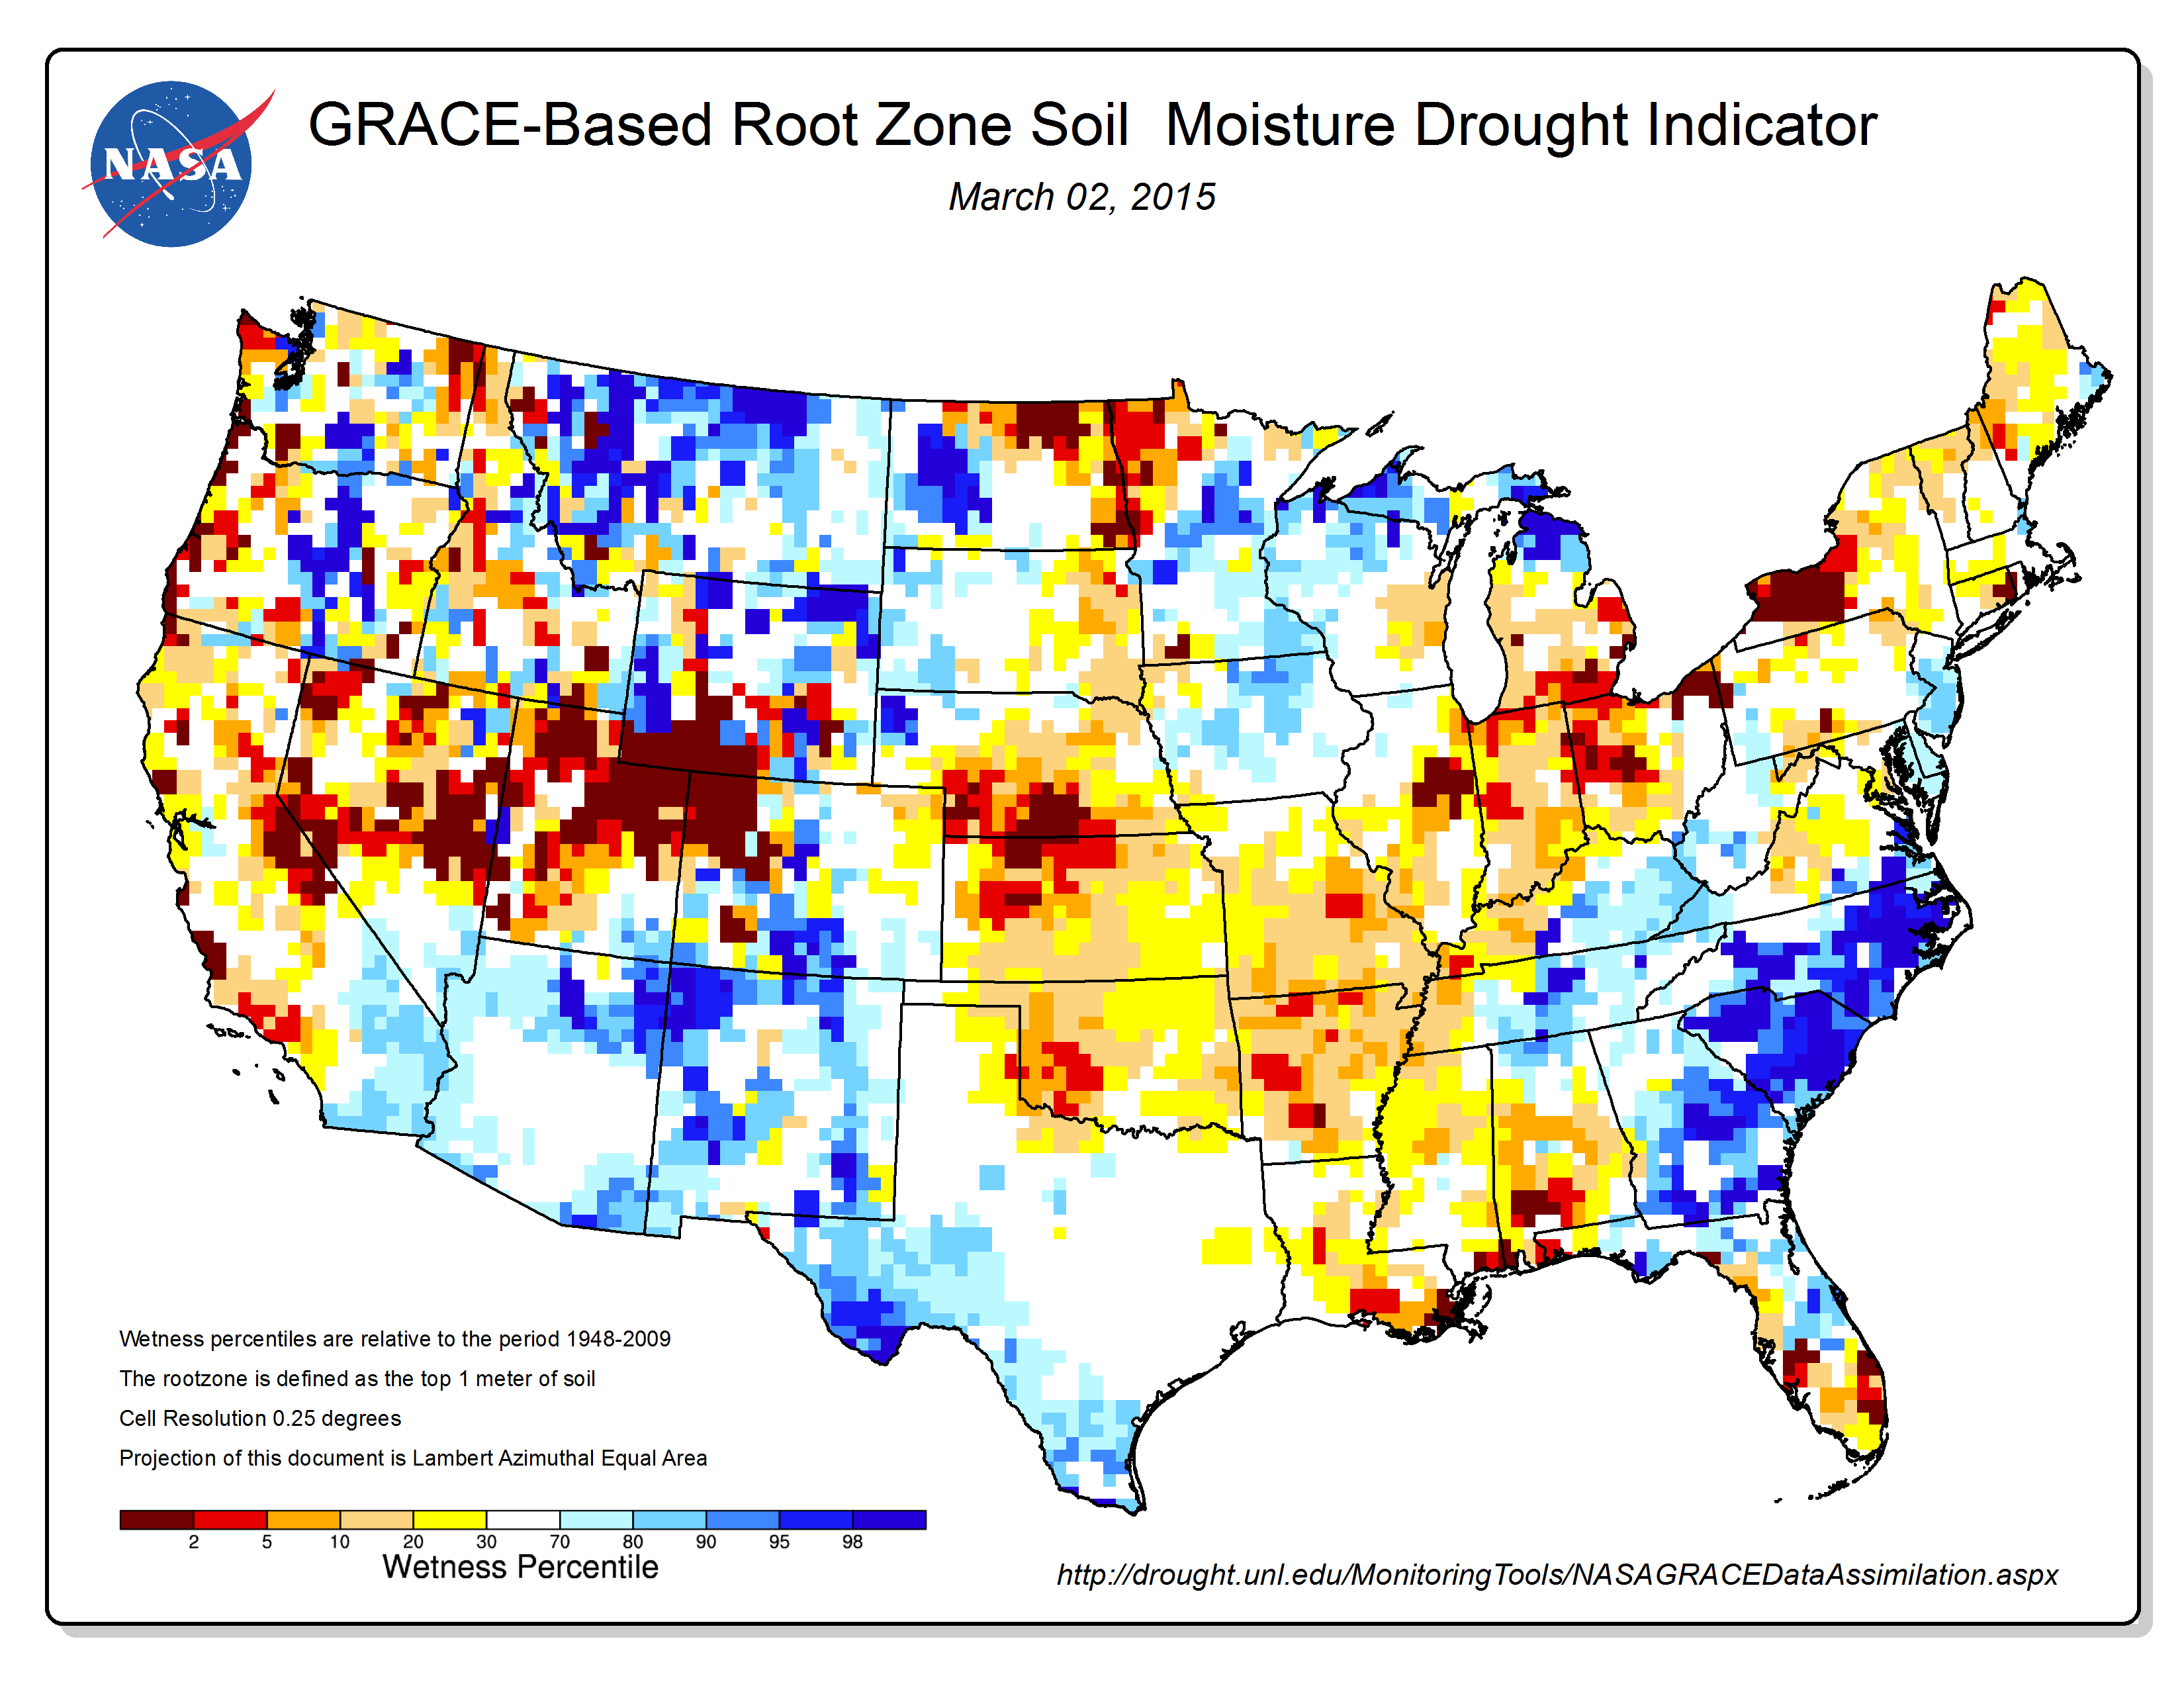
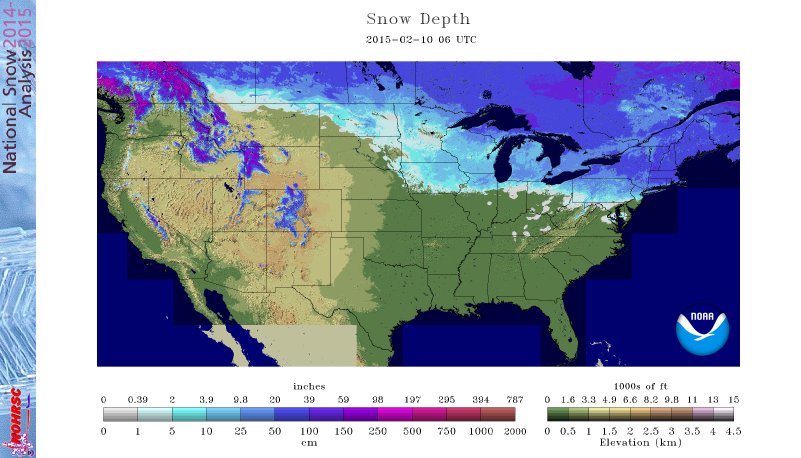
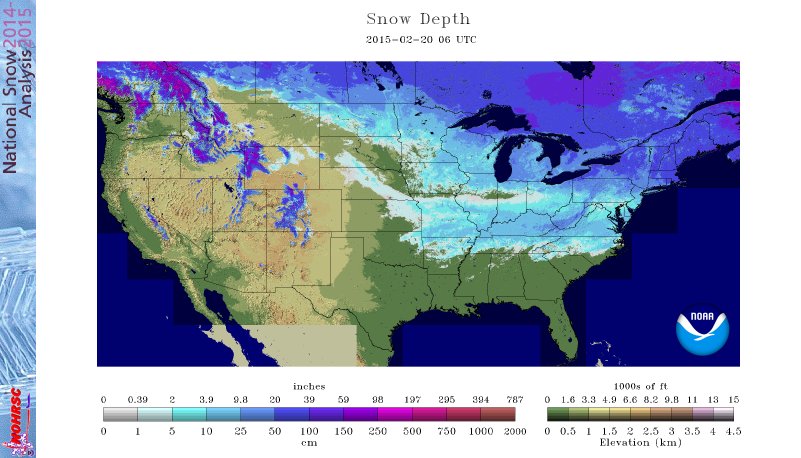
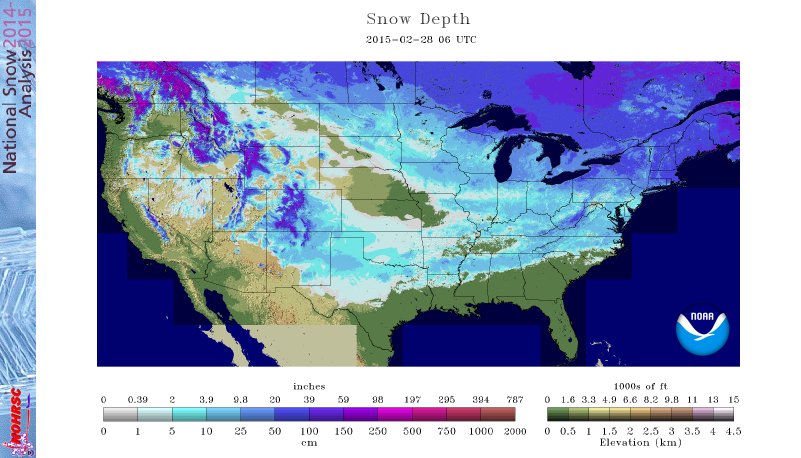
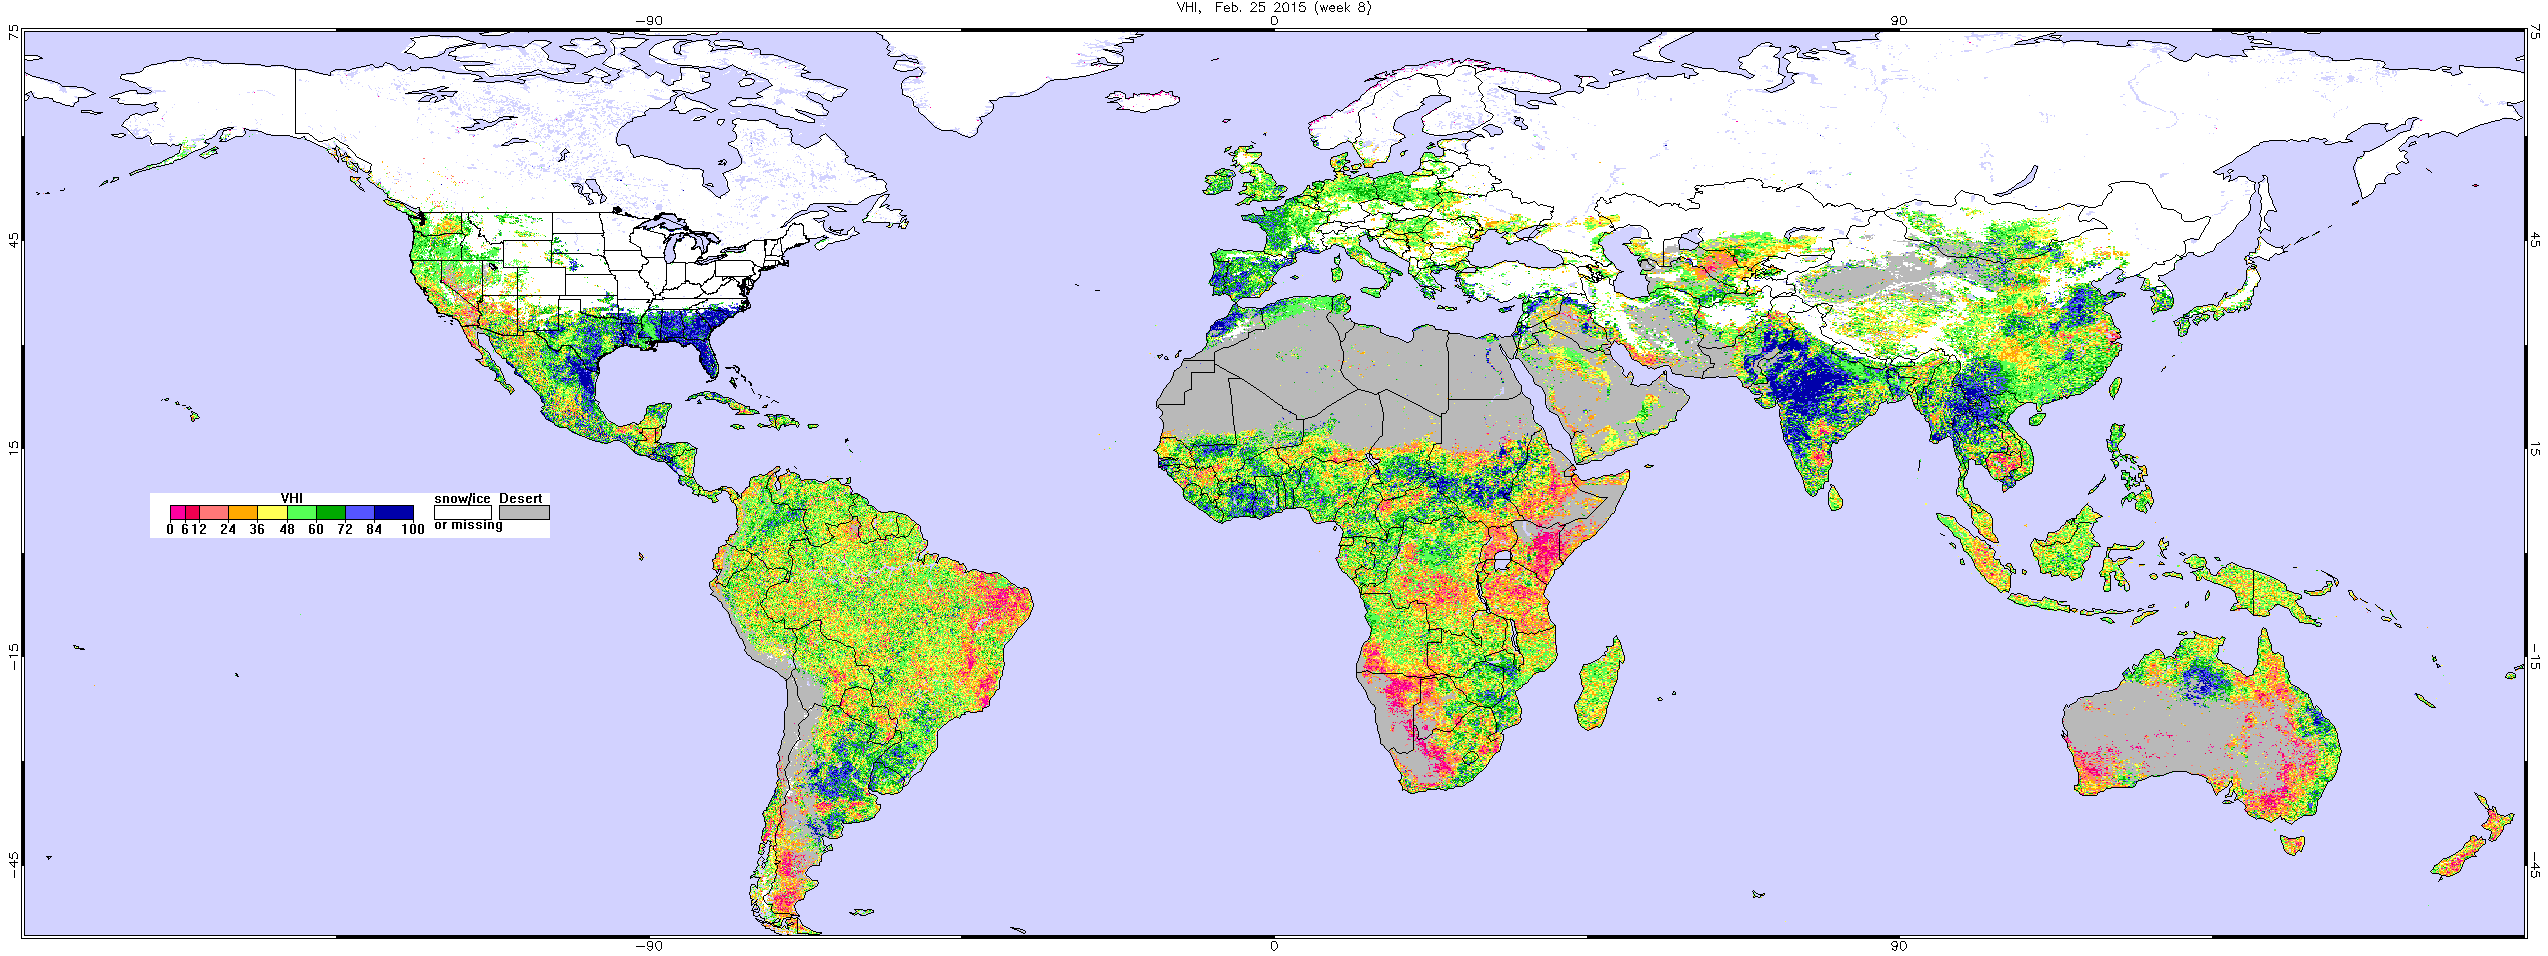
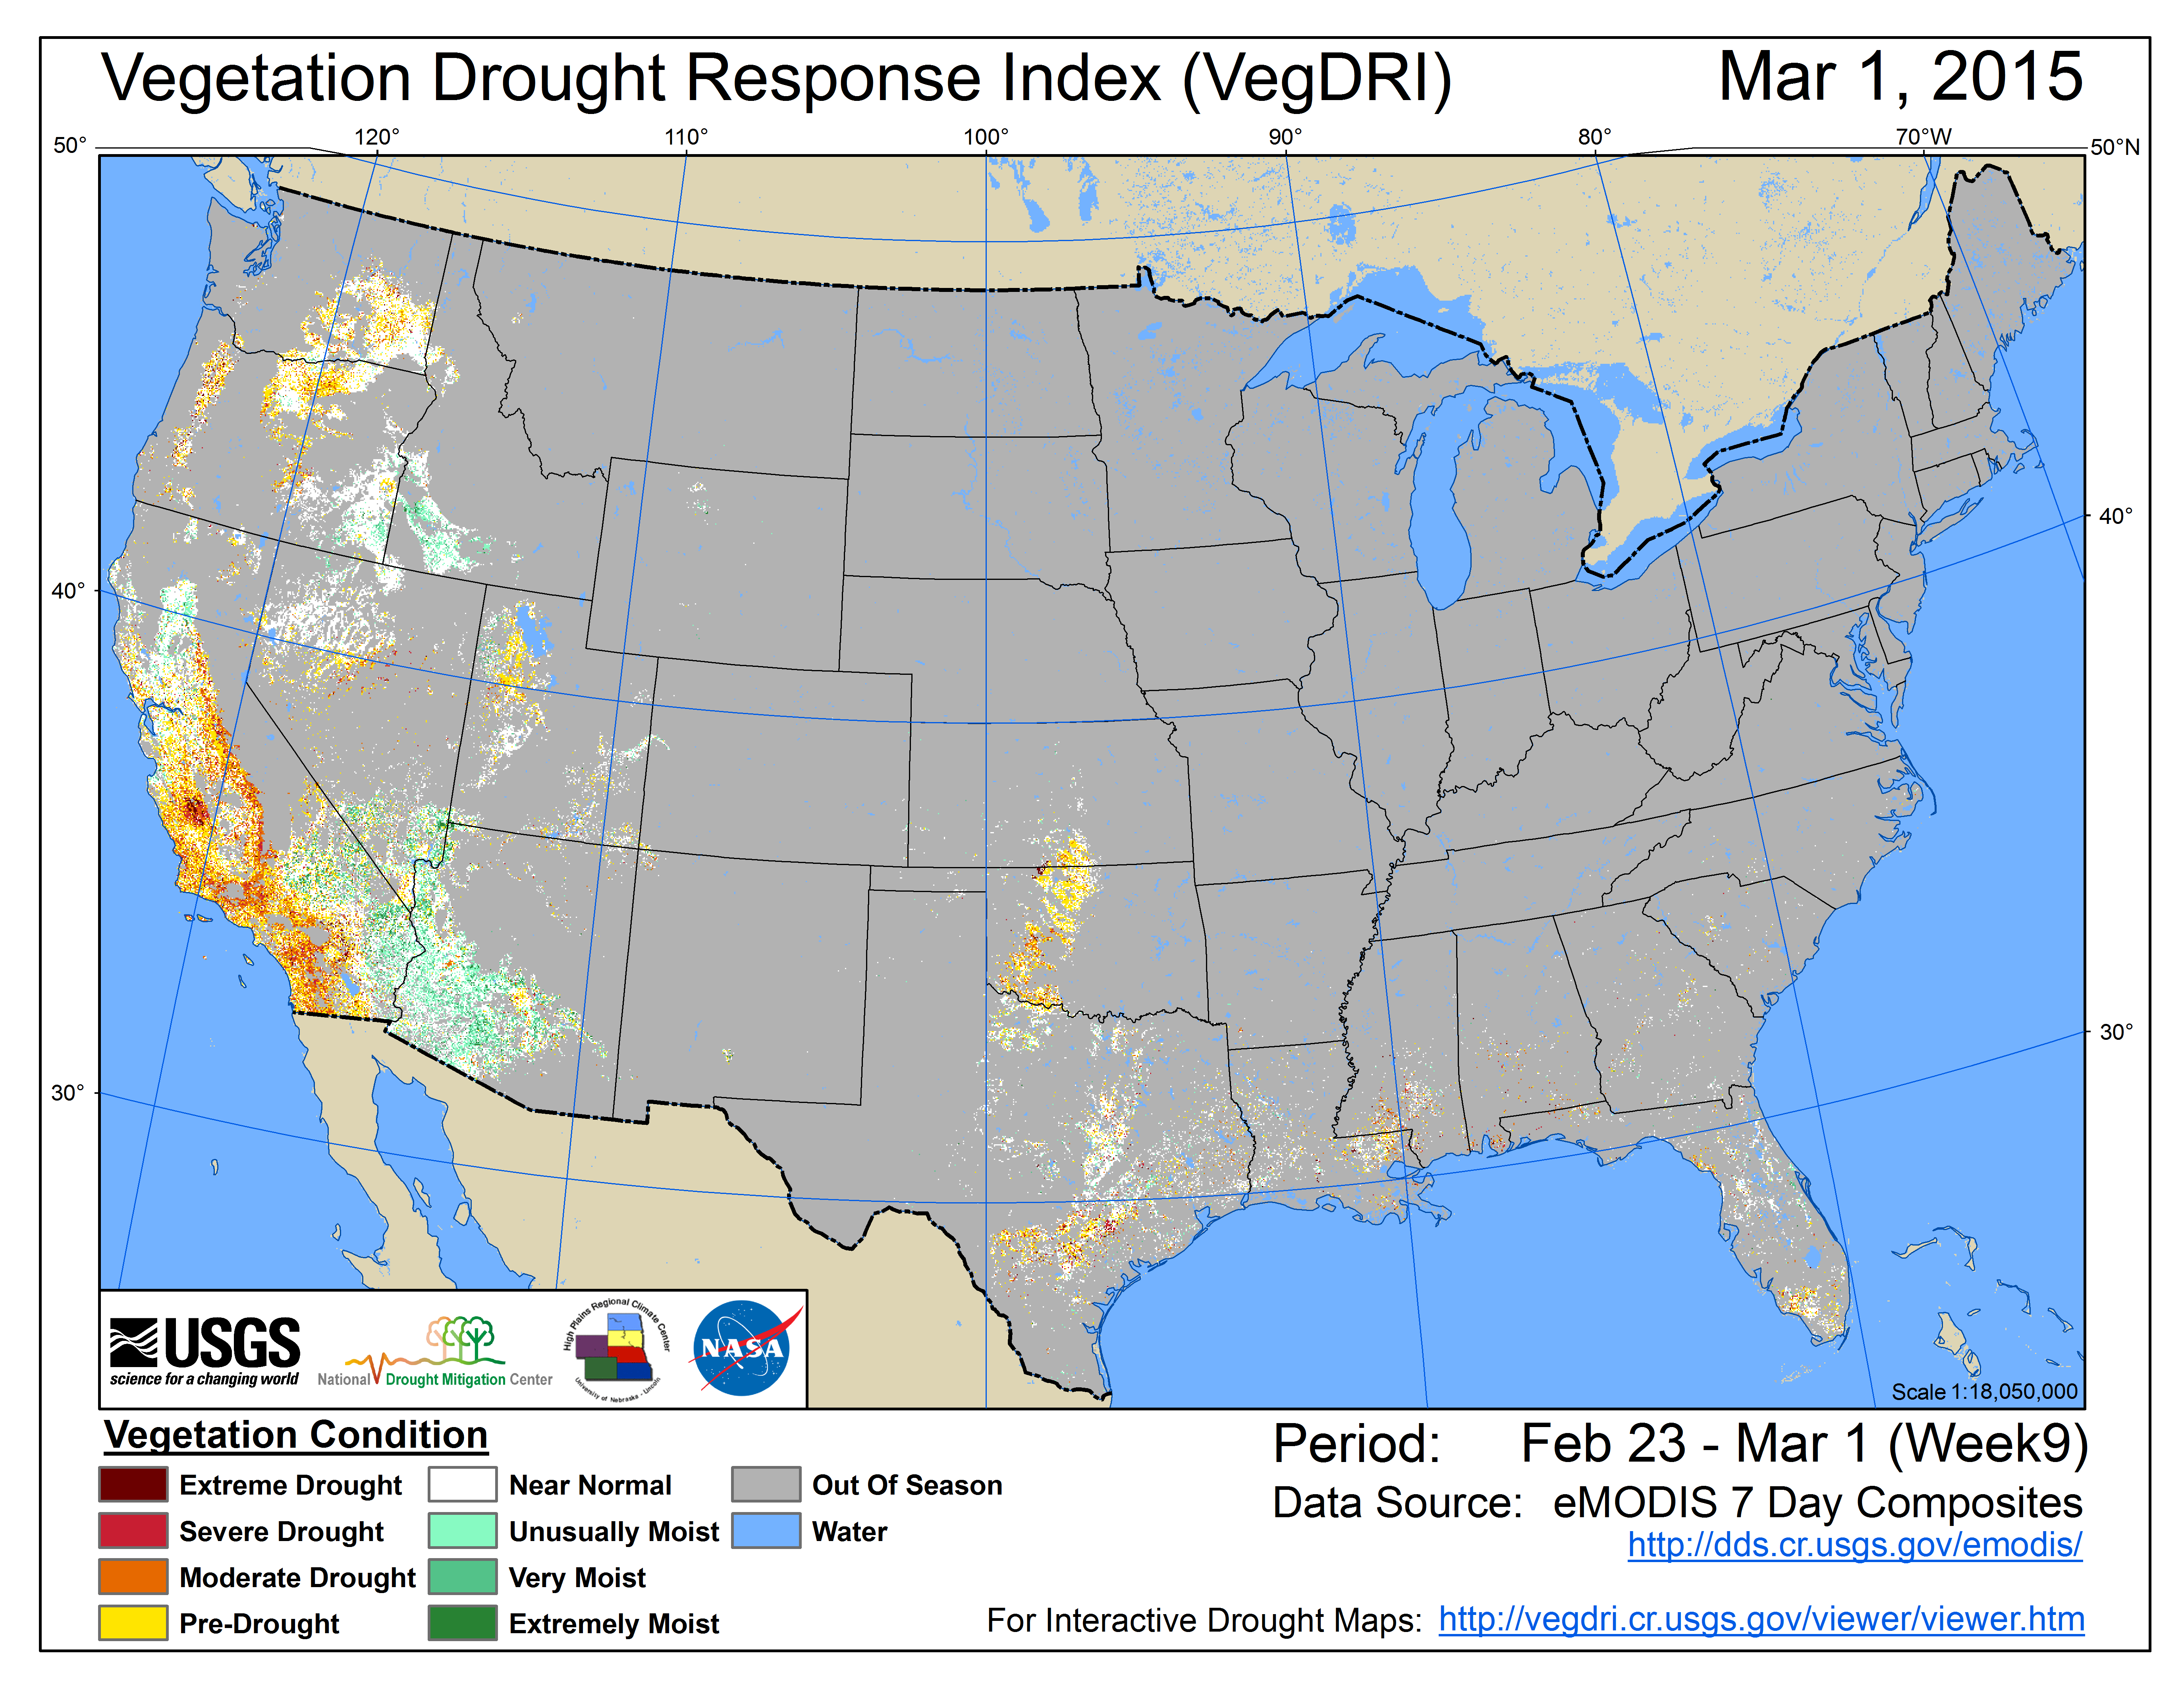
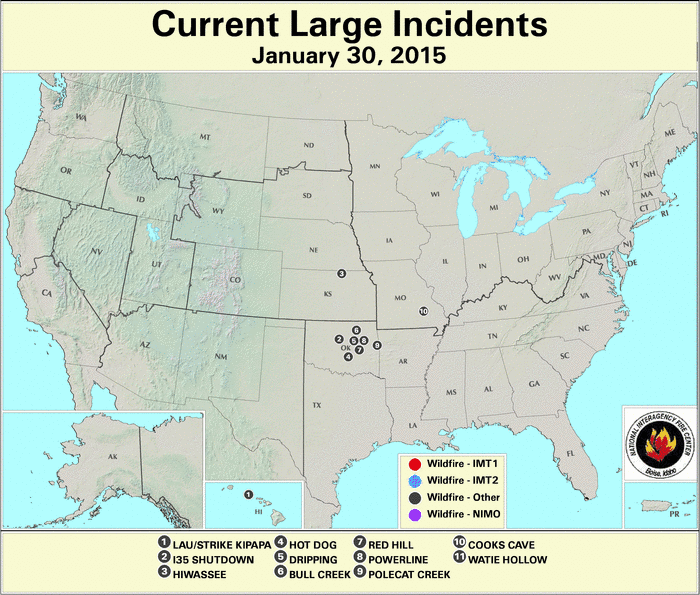
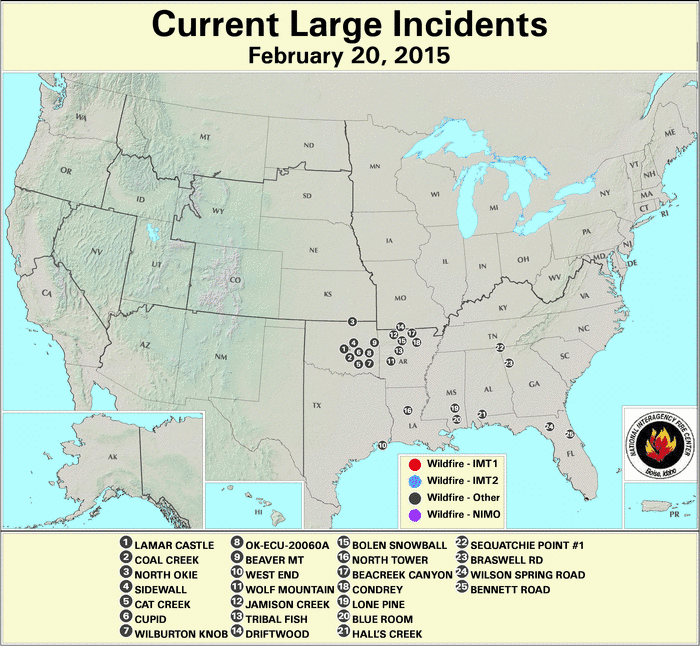
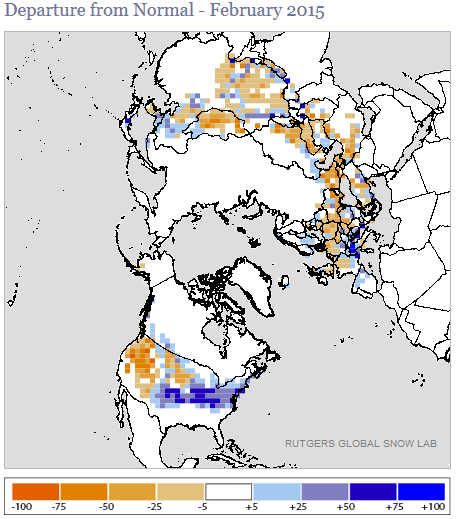
The dryness of February 2015 was reflected in below-normal precipitation totals, few days with precipitation, and long runs of dry days, especially in the Southwest and from the Great Plains to Great Lakes. The lack of precipitation during February, coupled with unusually warm temperatures which increased evaporation, further dried soils in parts of the West. Soil moisture continued quite dry across parts of the Central to Southern Plains. Even though temperatures were well below normal and the soils were frozen under a carpet of snow (snow cover for February 10, 20, 28), modeled soil moisture also decreased from the Upper Midwest to Northeast. Satellite observations of vegetative condition revealed some stress in the West and Southern Plains. Several large wildfires in the Southern Plains had spread from Oklahoma into the Southeast by mid-month.
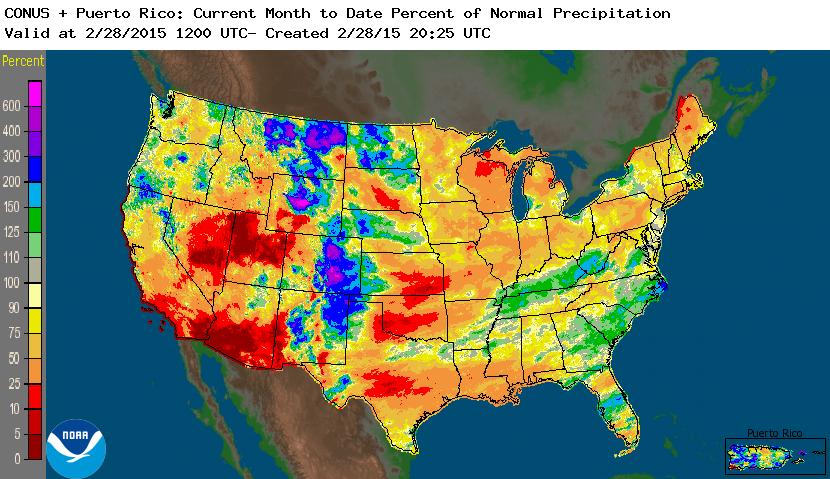
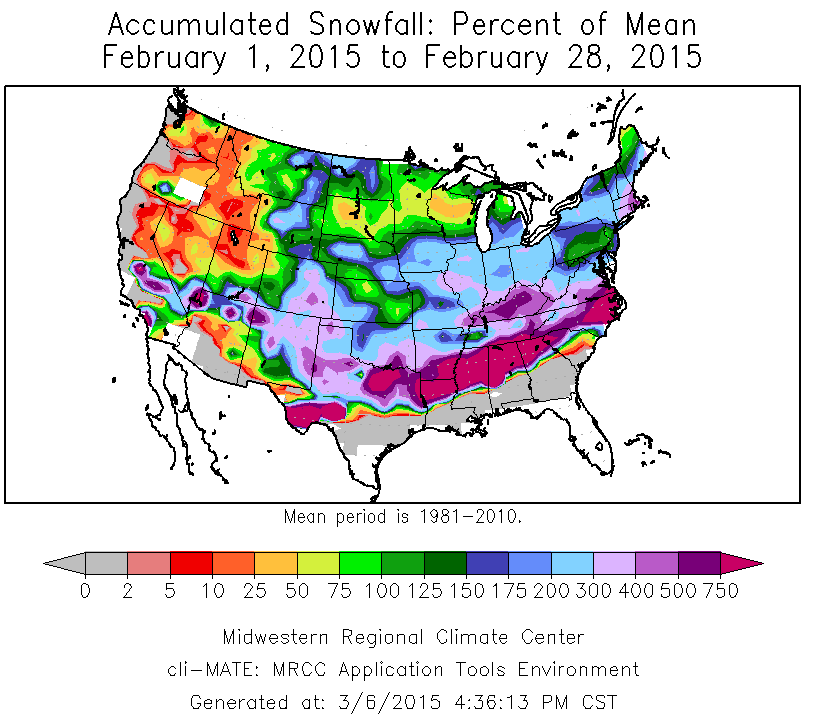
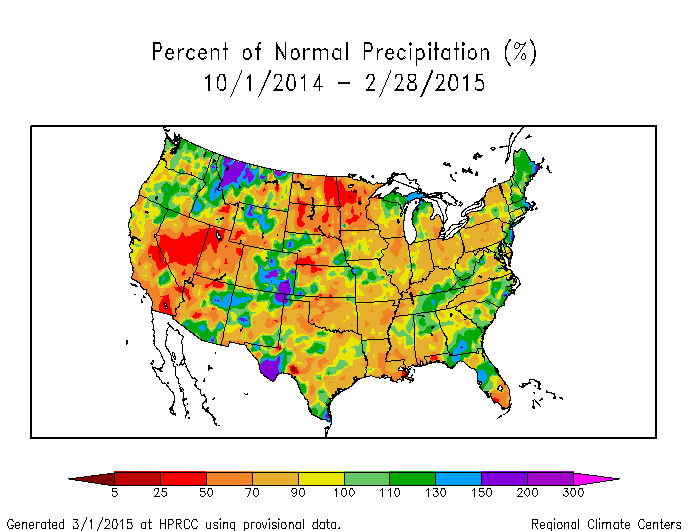
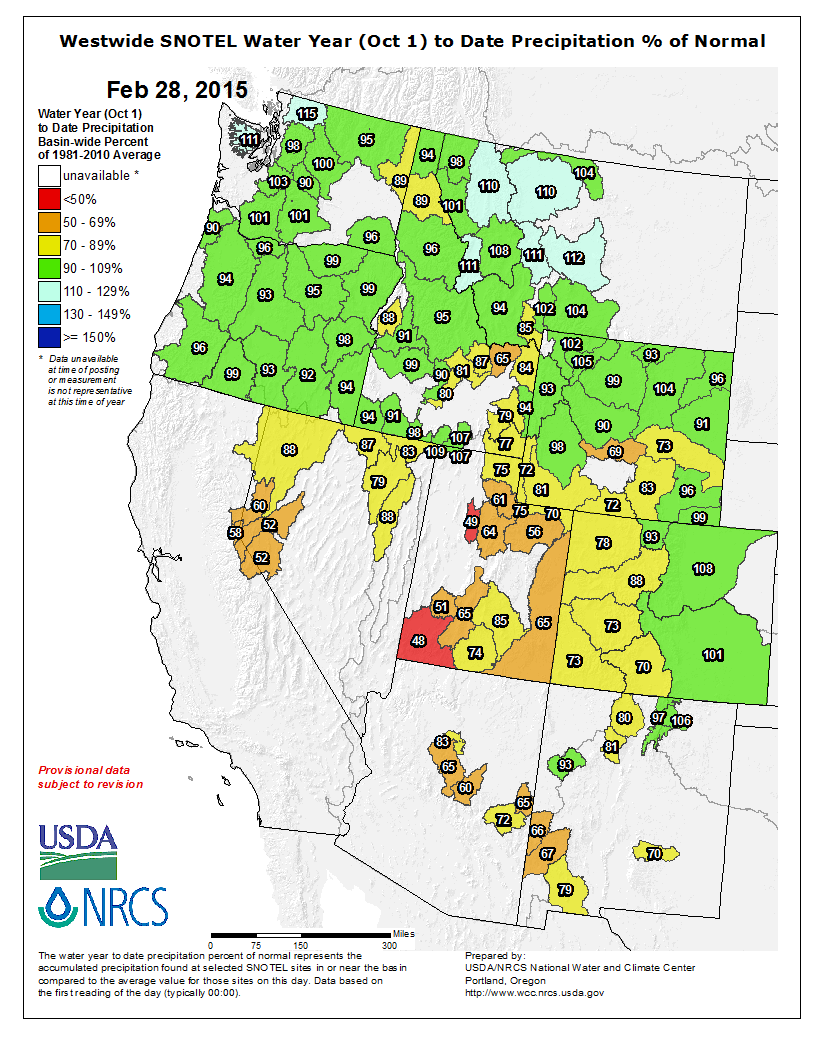
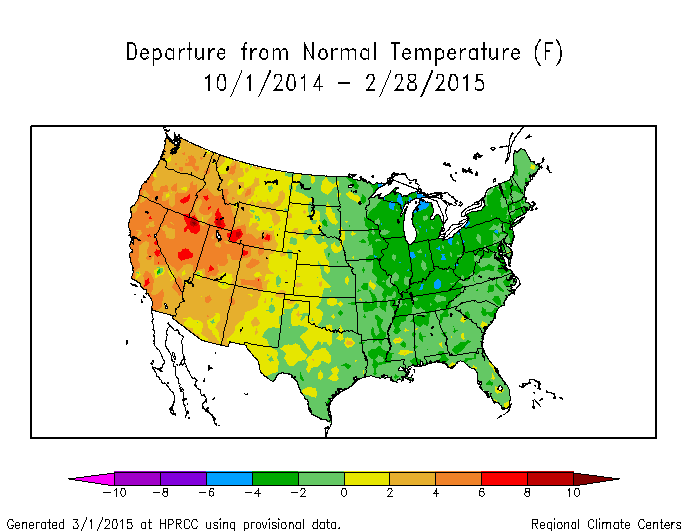
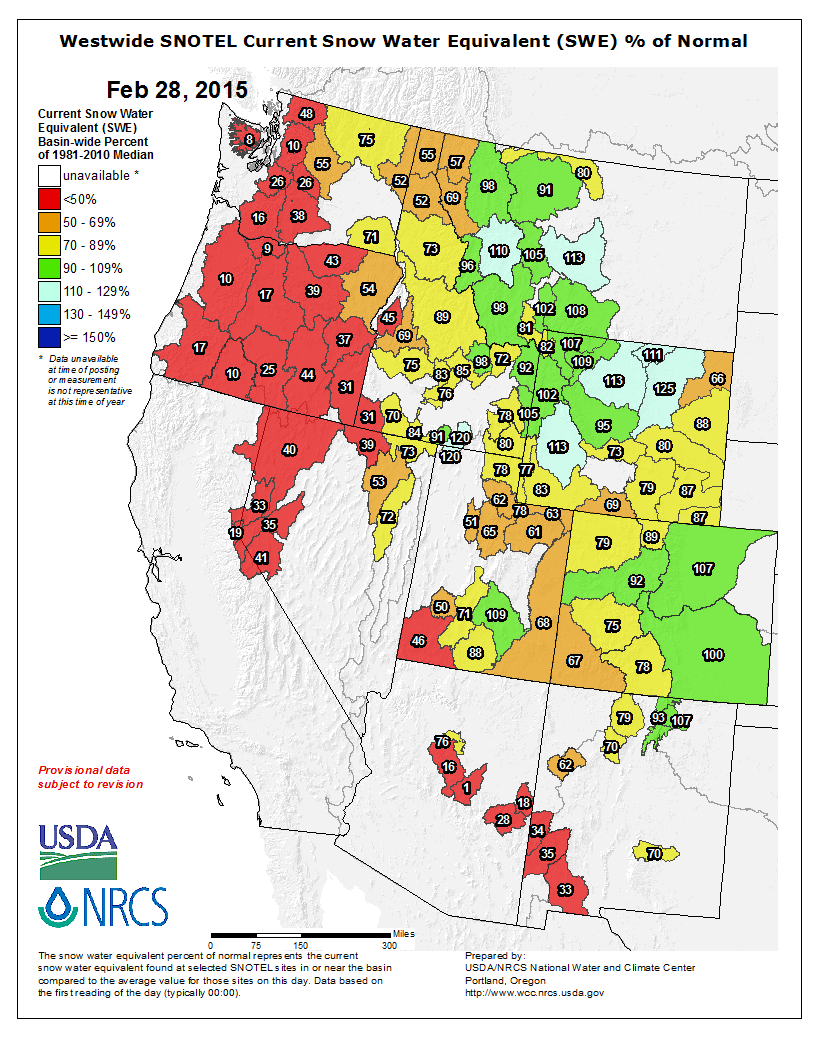
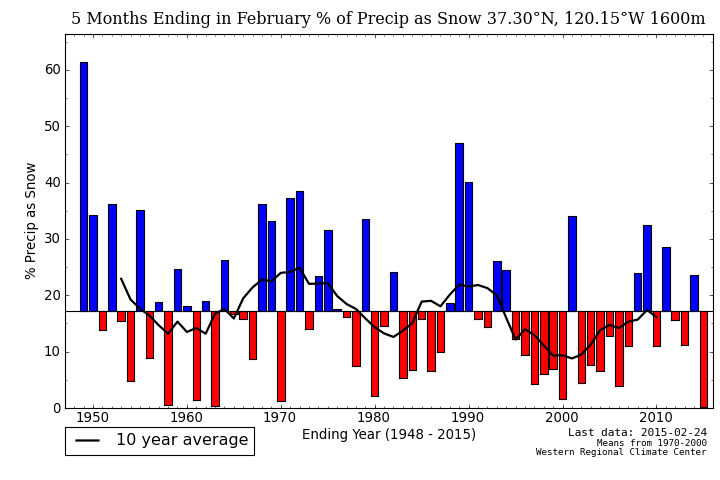
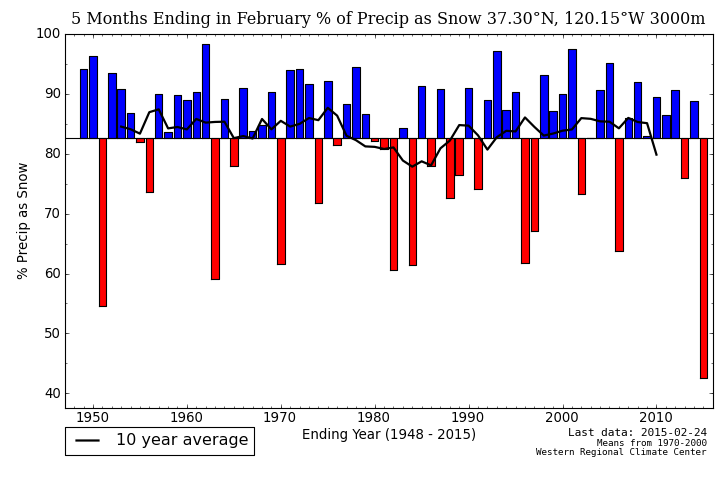
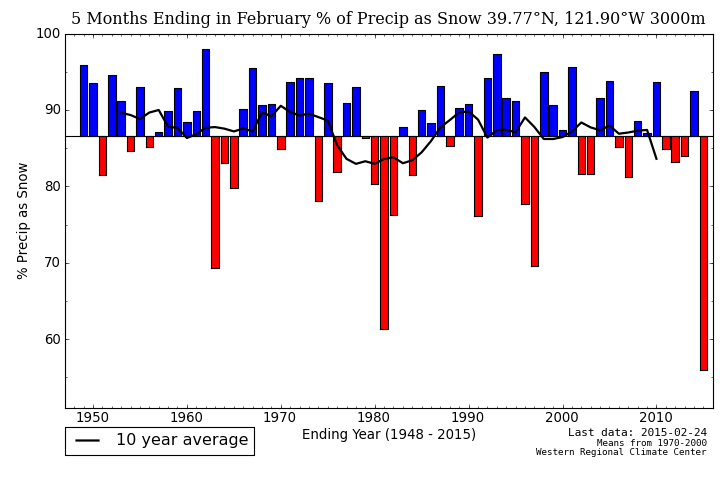
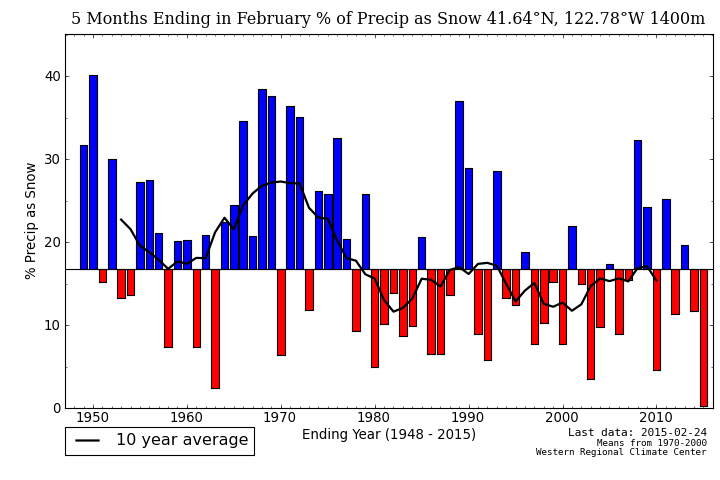
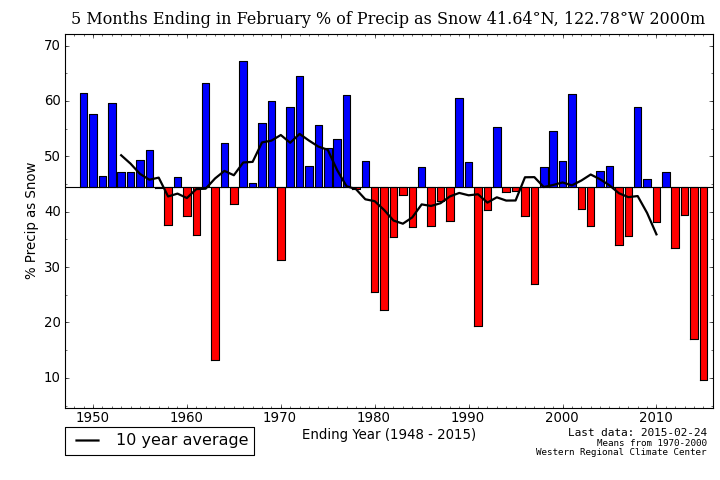
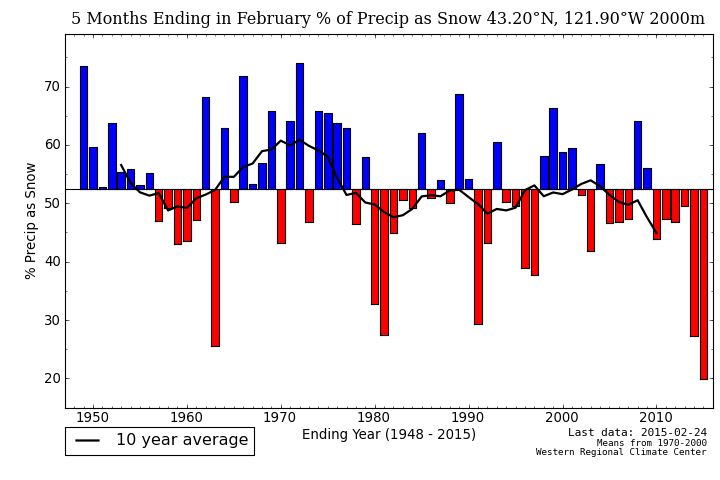
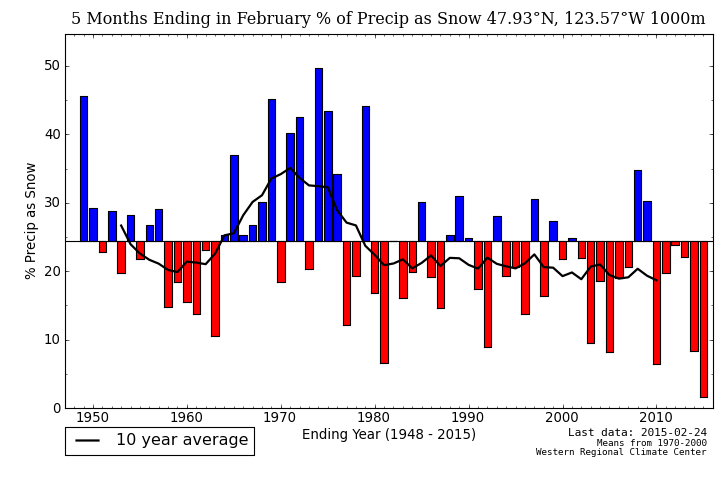
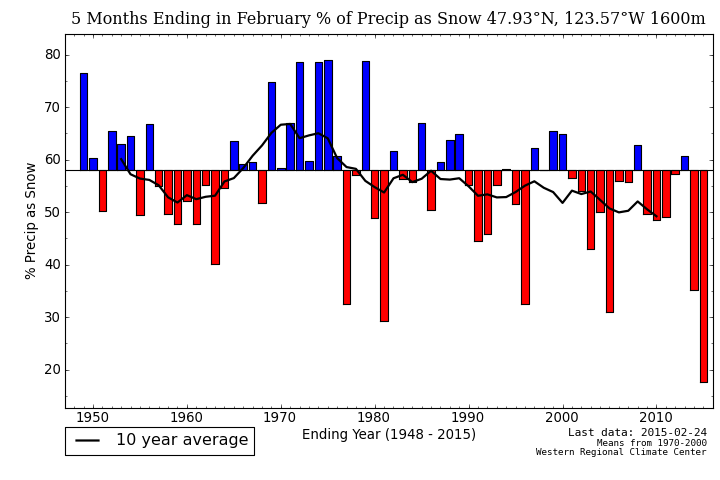
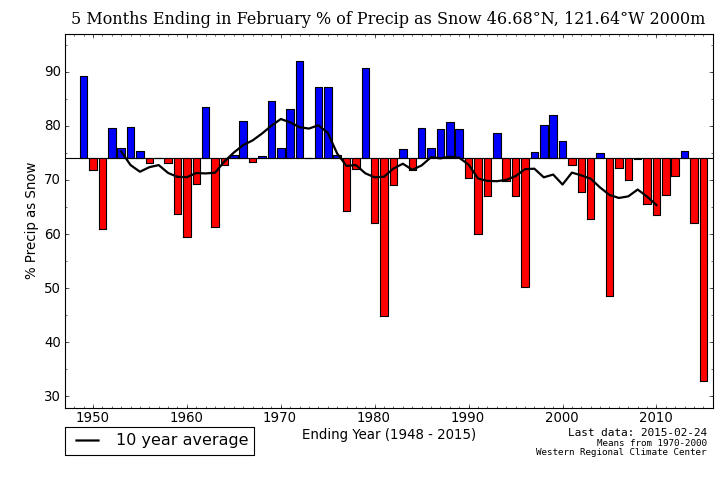
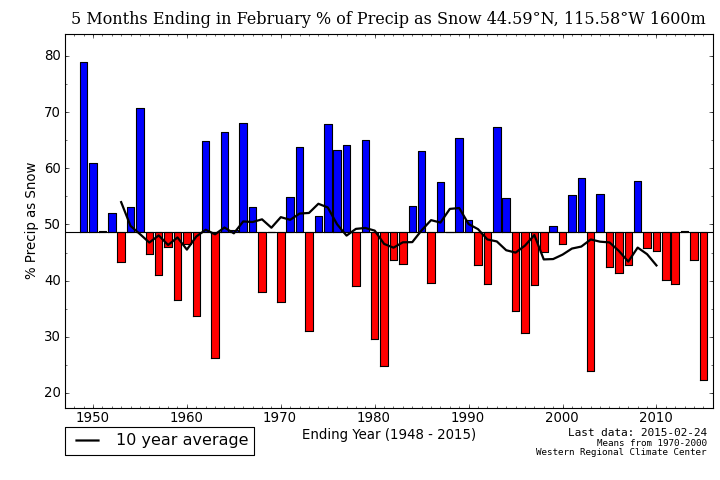
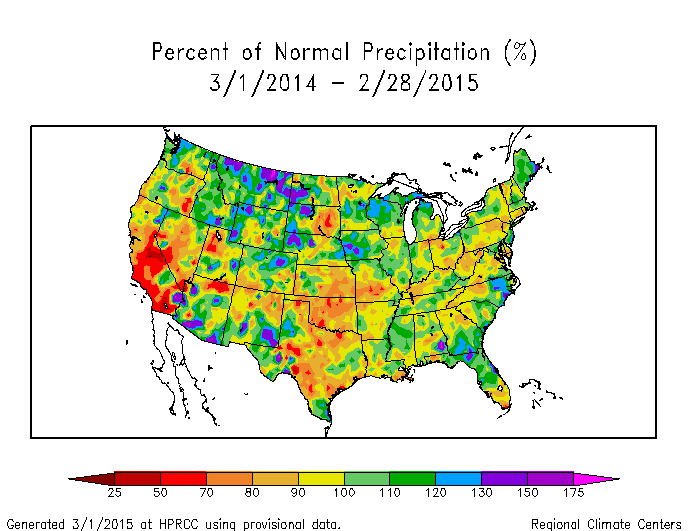
Although parts of the West have received near to above-normal total precipitation for February and the water year to date (October 1-present), much of the precipitation has fallen as rain instead of snow due to the well-above-normal temperatures, so the mountain snowpack and snow cover have been well below normal in many areas, especially the Far West. In fact, for the five months ending in February, the percent of precipitation falling as snow has reached record low levels at several mountain locations in California (1600 meters, 3000 meters, 3000 meters), Oregon (1400 meters, 2000 meters, 2000 meters), Washington (1000 meters, 1600 meters, 2000 meters), and Idaho. A thick winter snowpack is important for western hydrology as it provides a major water source when it melts during the spring and summer.
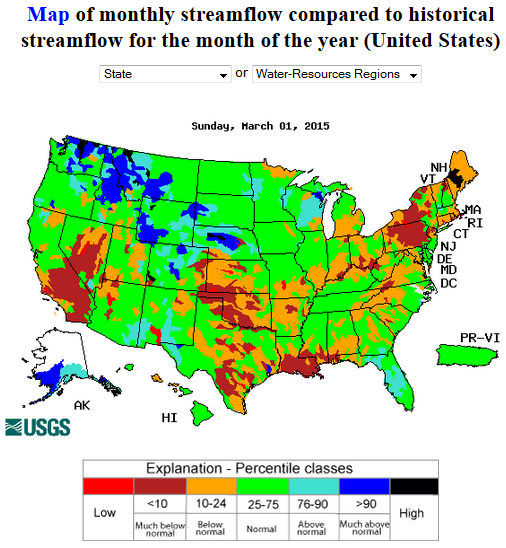
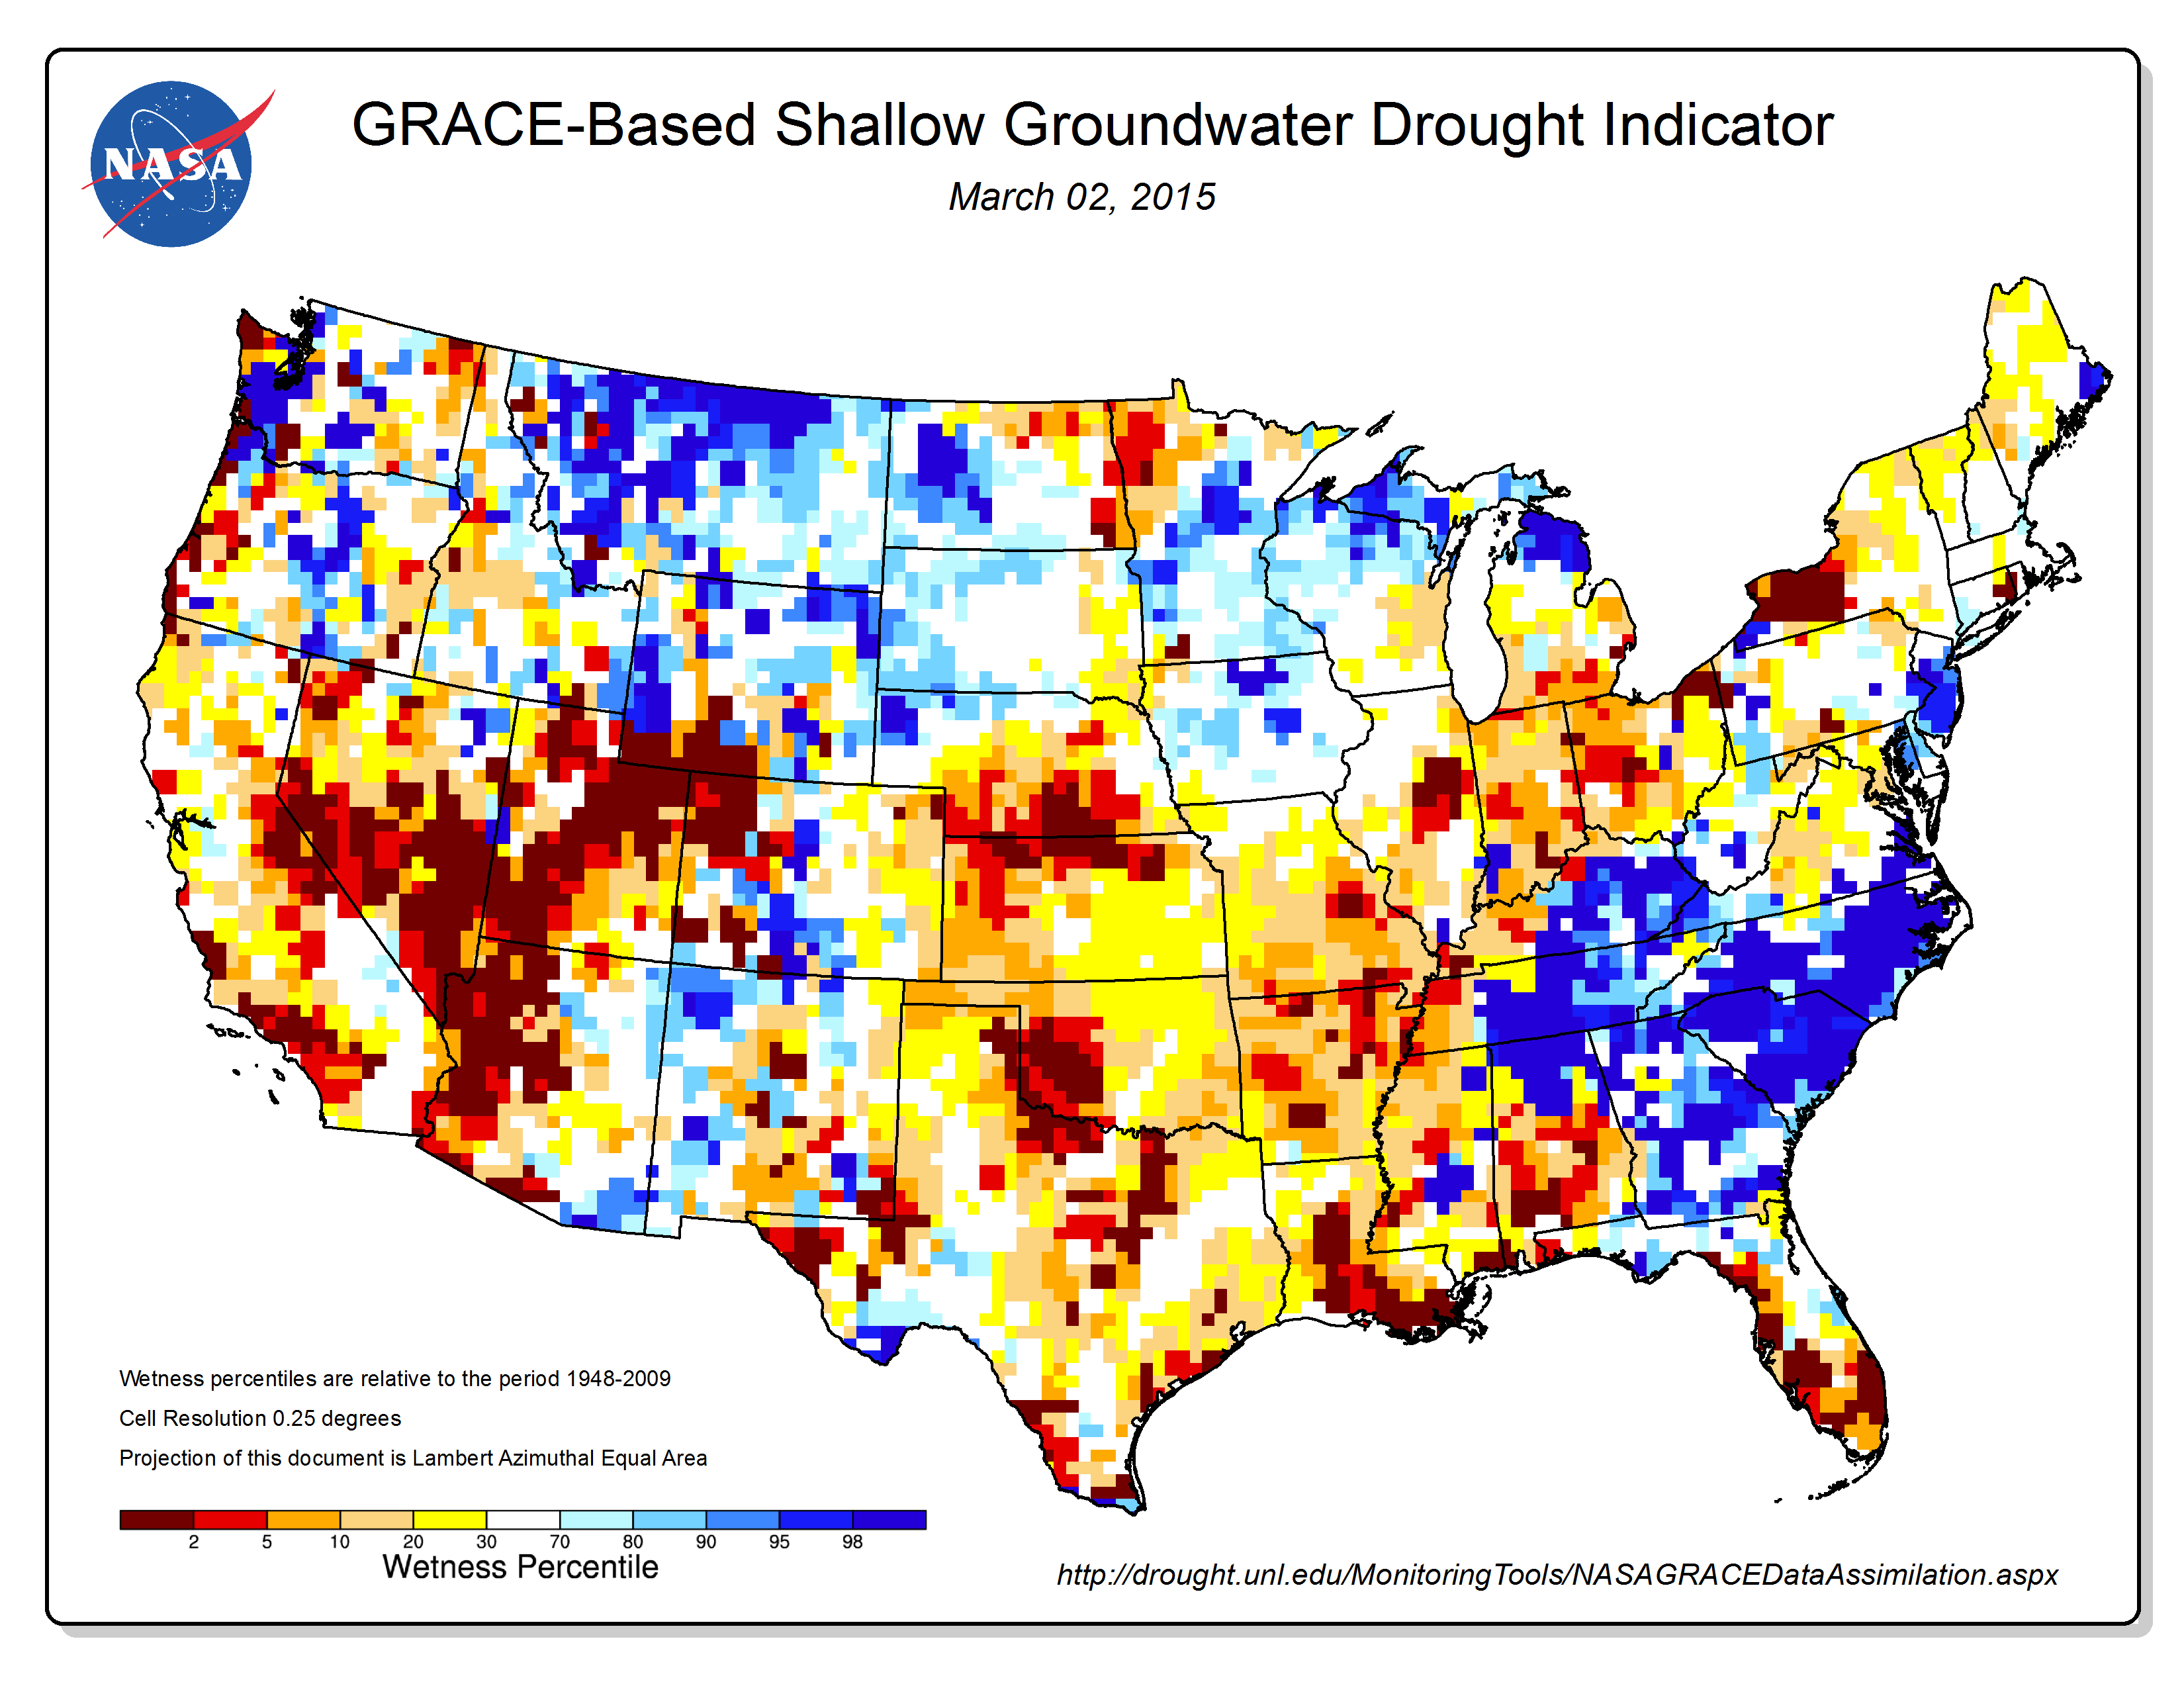
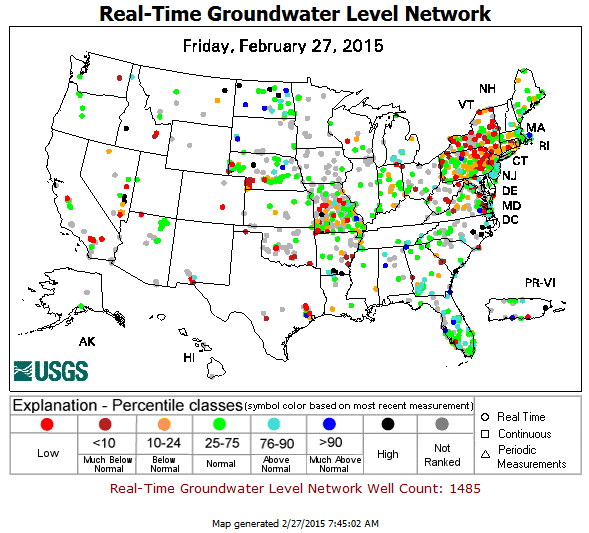
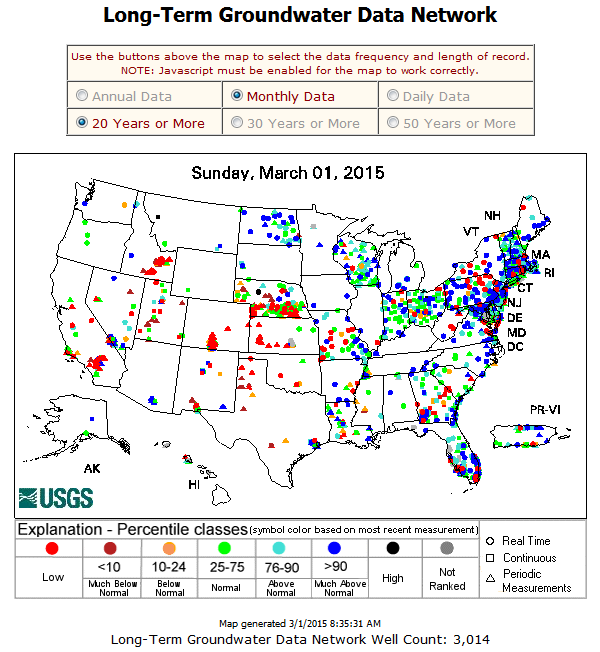
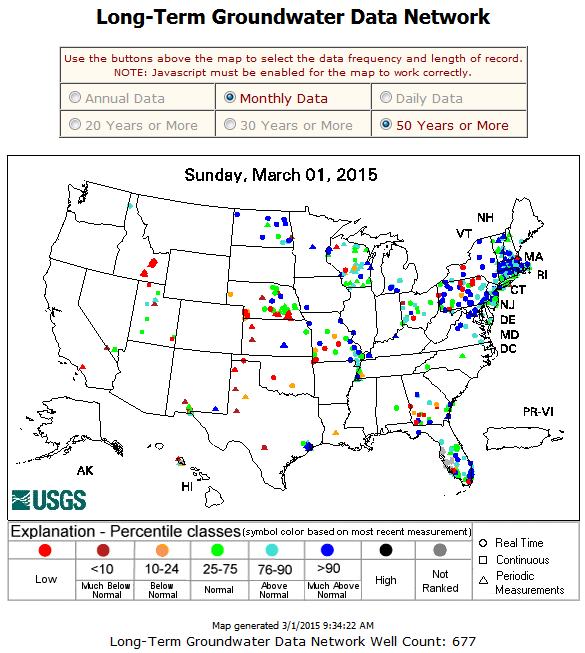
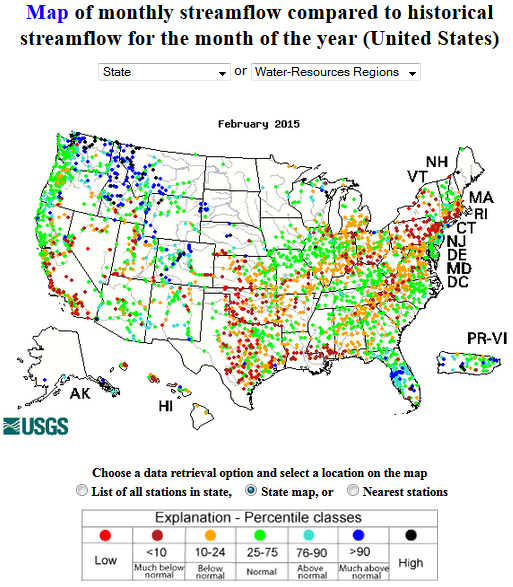
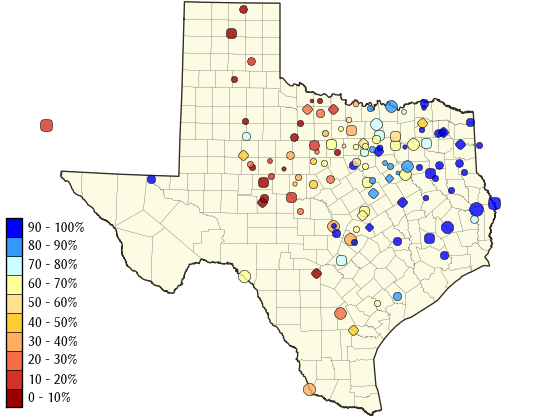
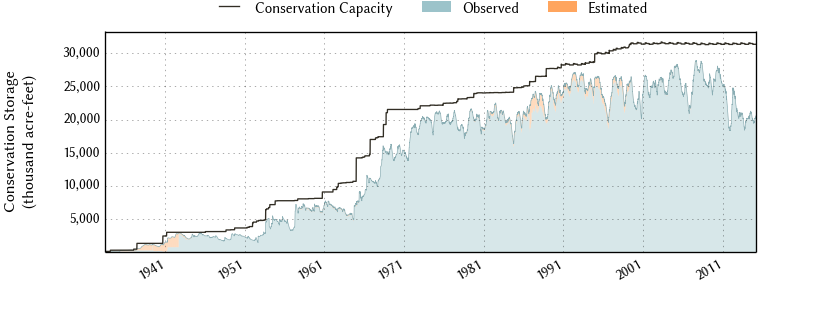
Three-plus years of drought in the West to Southern Plains have significantly depleted groundwater and reservoir levels. Some groundwater well stations have reached the lowest levels observed in the last 20 to 50 years. Groundwater feeds many streams, and the low groundwater levels are reflected in below-normal streamflow levels, with some streams in the Central to Southern Plains reaching record low levels. Reservoirs were below average statewide in Arizona, Nevada, New Mexico, and Oregon. Reservoirs in California and western to central Texas were seriously depleted, with those in Texas, averaged across the state, stuck at the lowest levels in 30 years.
Regional Discussion
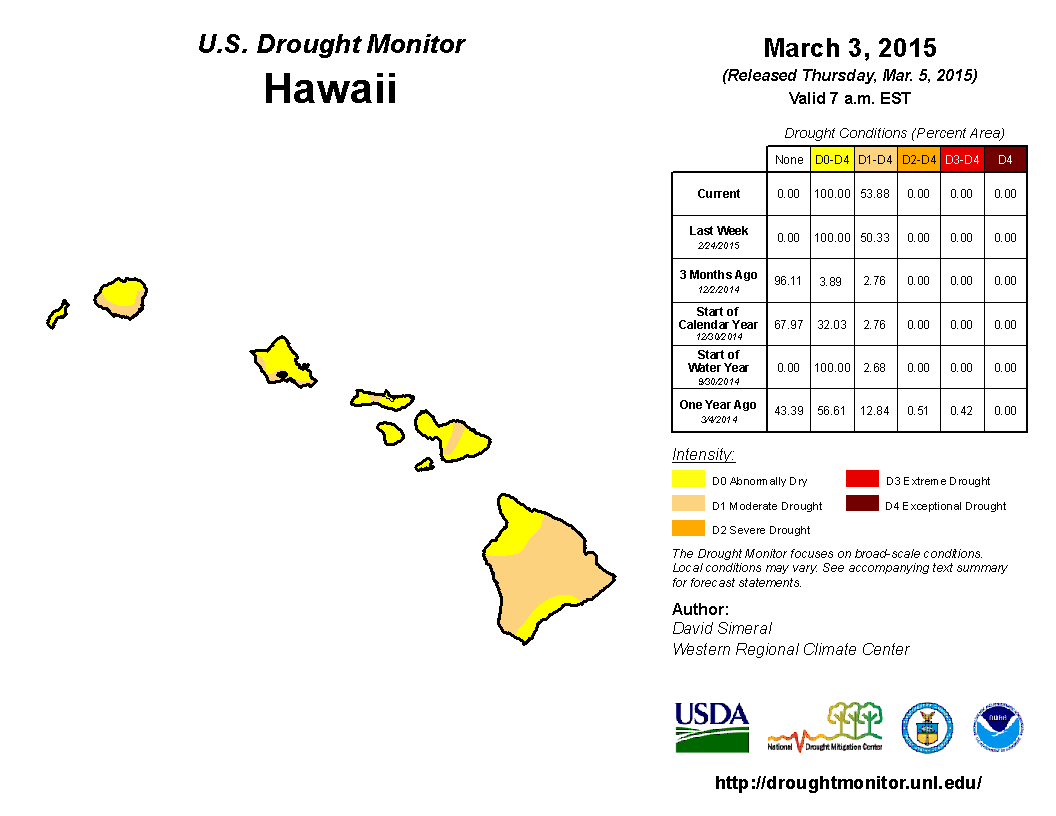
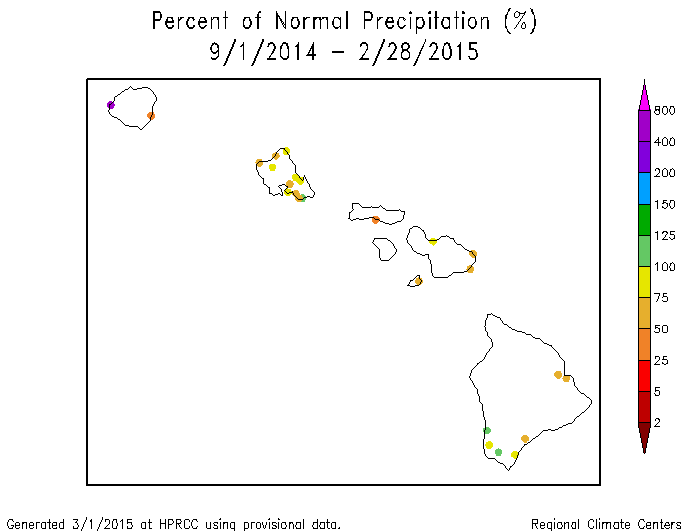
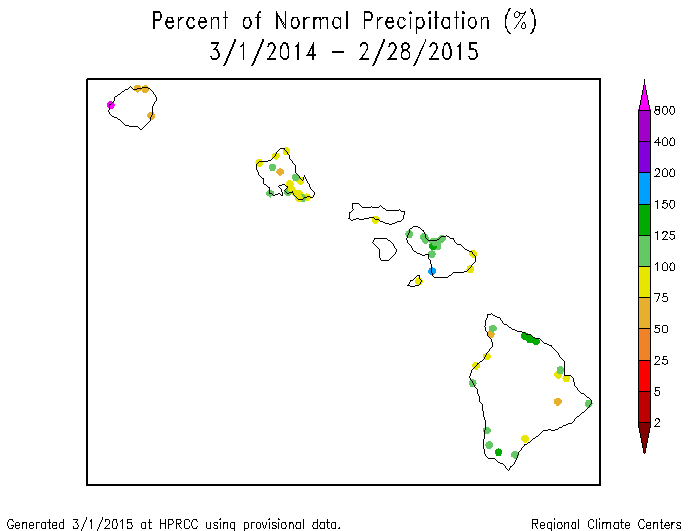
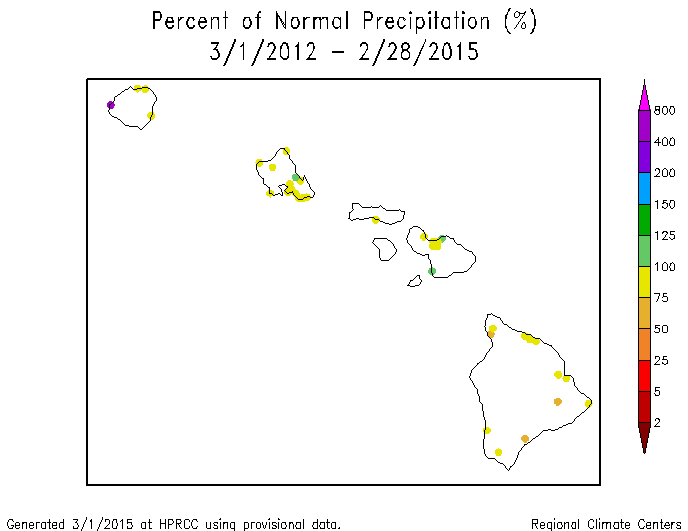
Hawaii: February 2015 was drier than normal across much of Hawaii. The last 2 to 3 months have been much drier than normal across the state. Even with the rainfall from October 2014 and earlier, the last 5, 6, and 8 months averaged drier than normal at most stations. The precipitation anomaly pattern was mixed at 11 to 12 and even 24 months, but dryness was dominant at 36 months. The dryness was reflected in below-normal streamflow on some of the islands. On the USDM map, moderate drought expanded to cover more than half (53.9 percent) of the state, reflecting the persistently low precipitation as well as the continued low reservoir situation in central Molokai and the Upcountry Maui area.
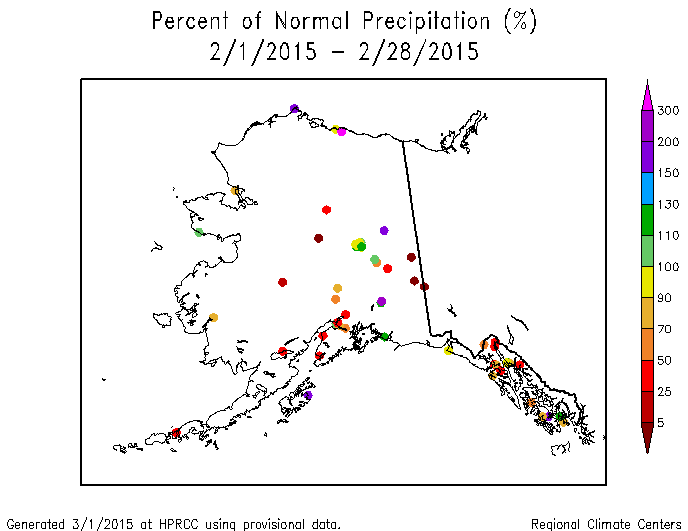
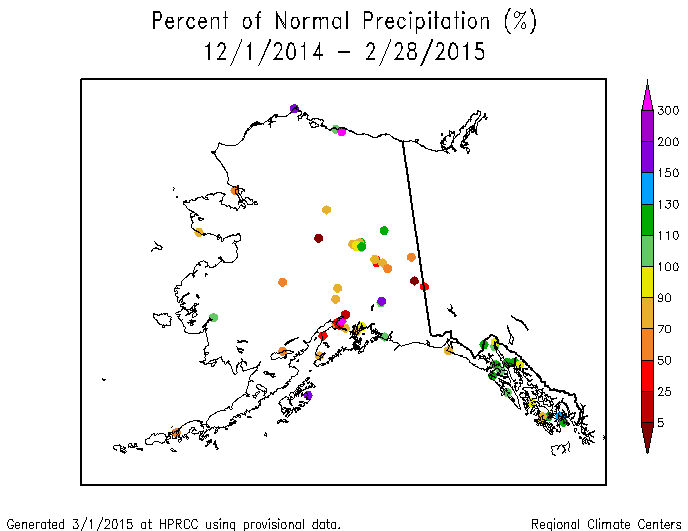
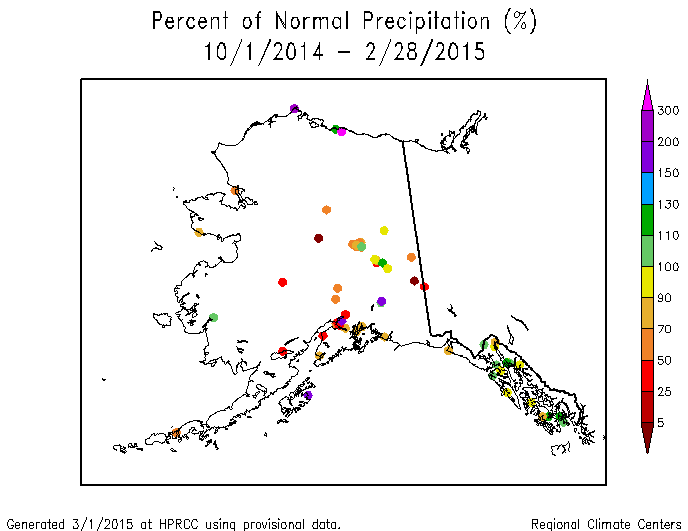
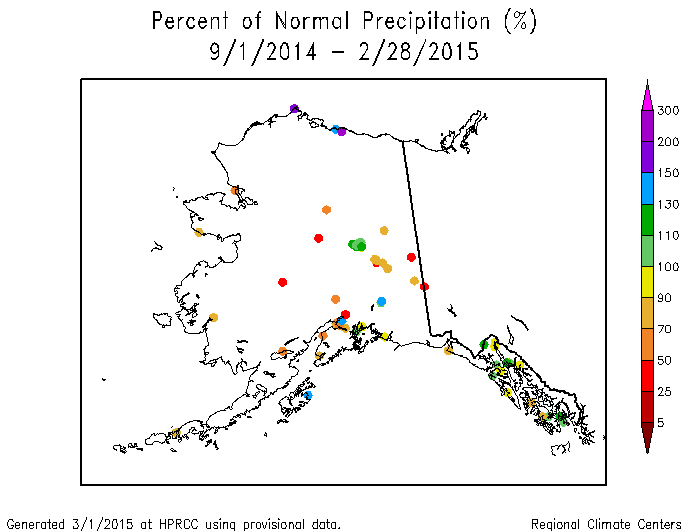
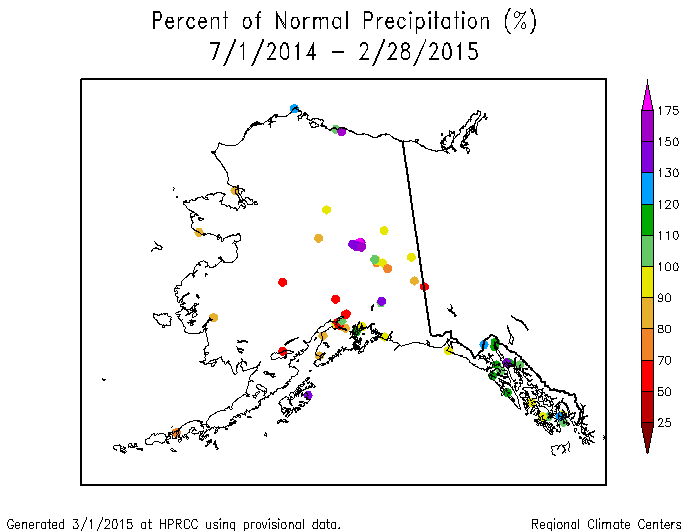
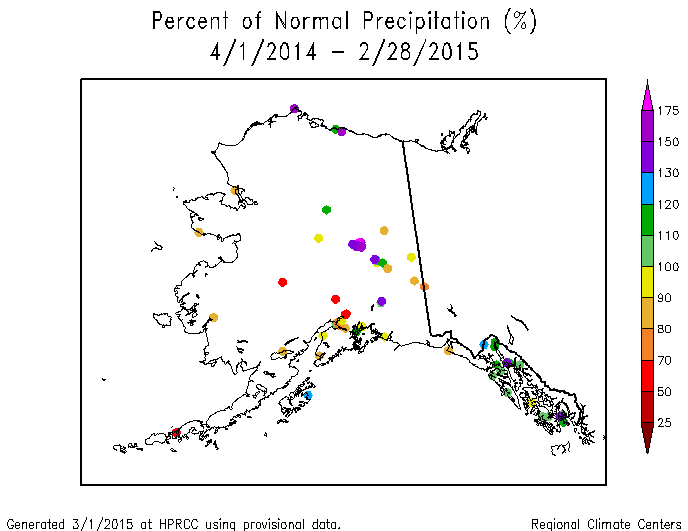
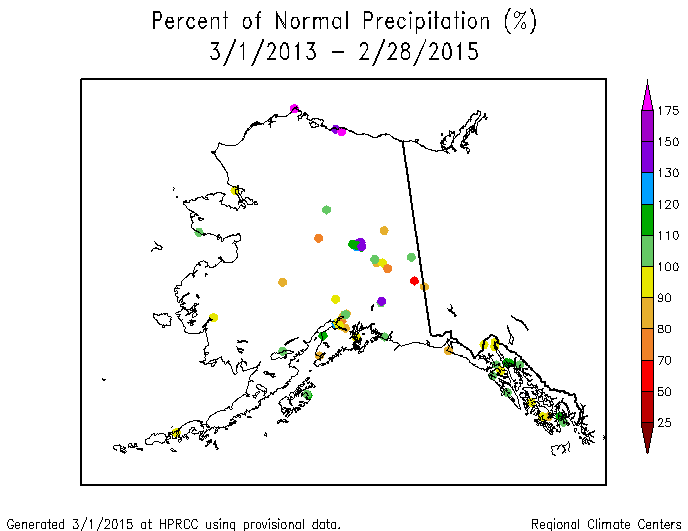
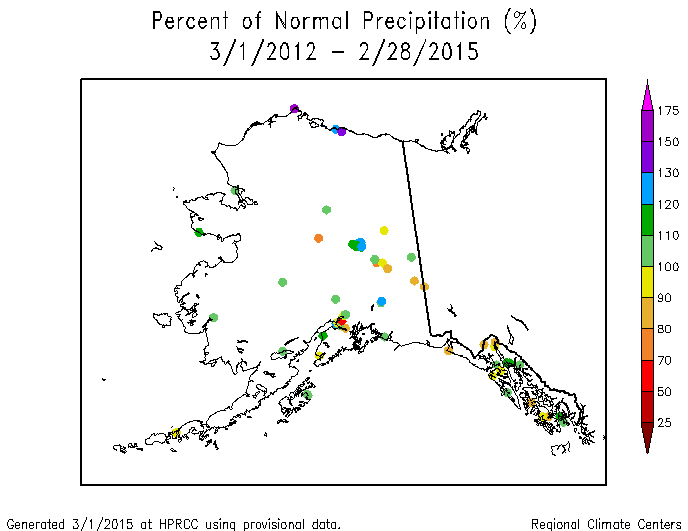
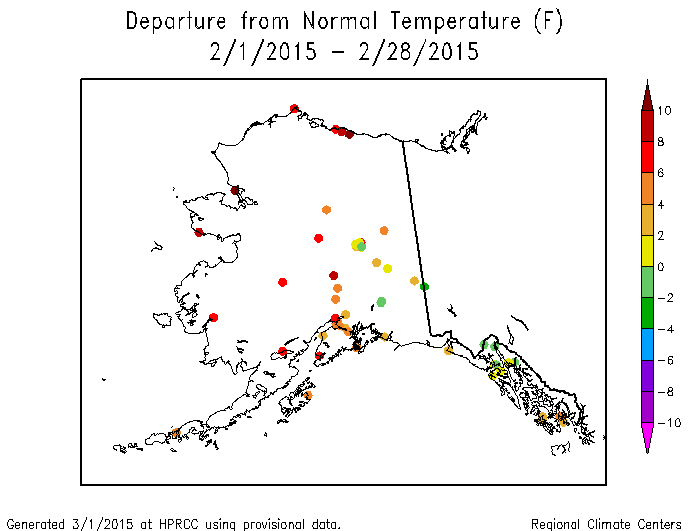
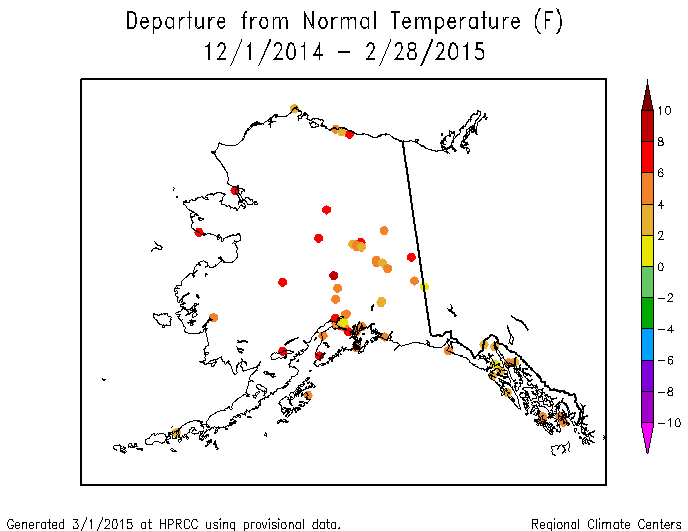
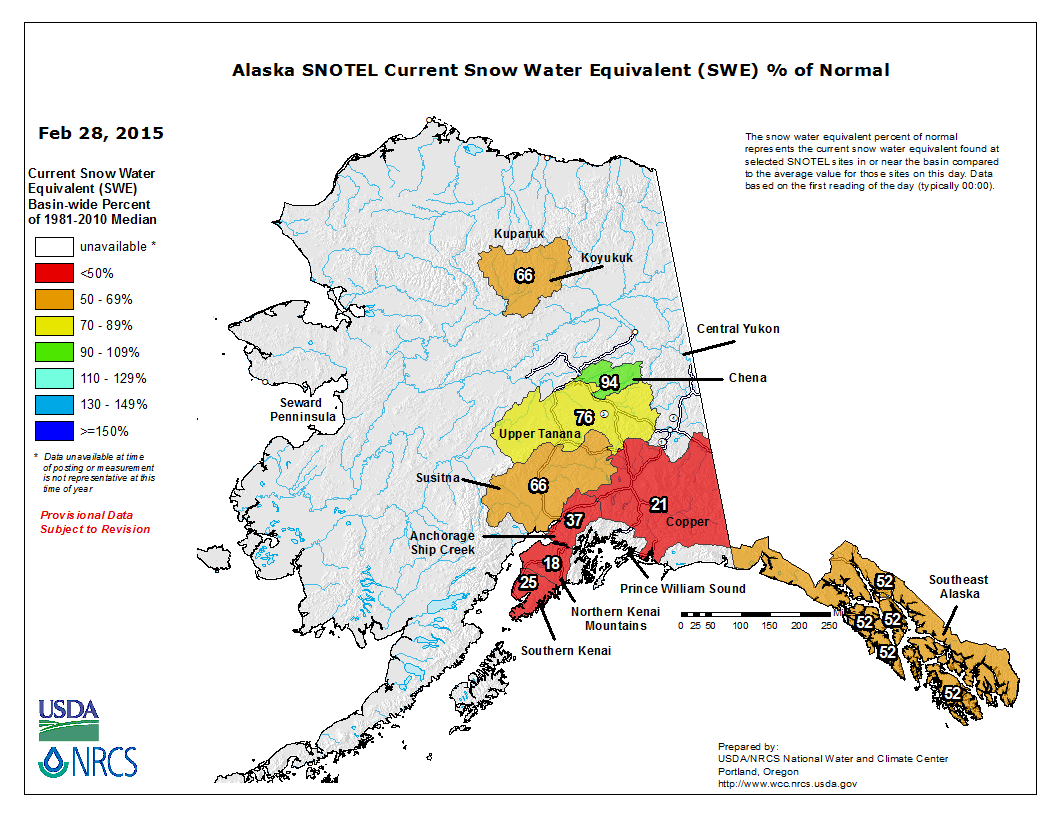
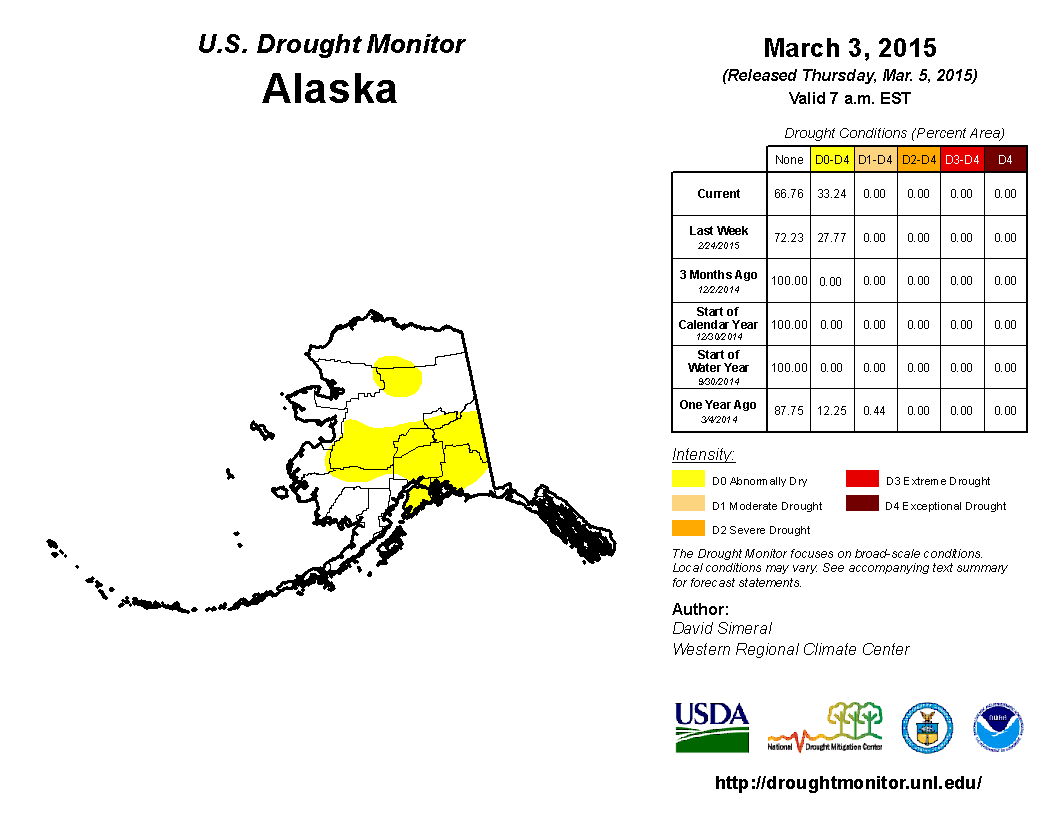
Alaska: Precipitation across Alaska was mostly drier than normal during February. The pattern was consistent at both the low elevation stations and high elevation SNOTEL stations. The panhandle and north coastal stations were generally wetter than normal, while the rest of the stations were drier than normal, for much of the last year (last 2, 3, 5, 6, 8, 11, and 12 months). The pattern was mixed for the last 24 months and predominantly wetter than normal at the 36-month time scale. The persistent upper-level circulation pattern (ridge), which reduced the precipitation, also brought widespread above-normal temperatures for the last one to three months. Concurrent with the below-normal precipitation and above-normal temperatures was a reduction in snowpack and increase in streamflow. Soil moisture models indicated drying soils in the south central and southwest portions of the state. Abnormal dryness covered a third of the state on the March 3rd USDM map.
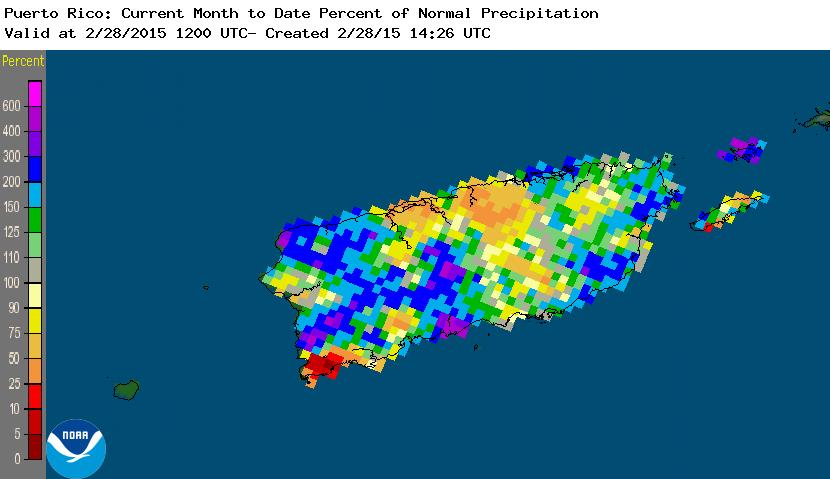
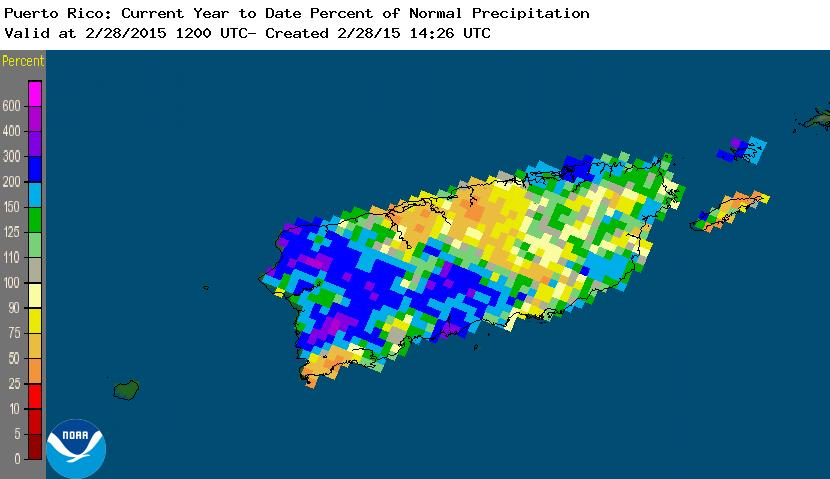
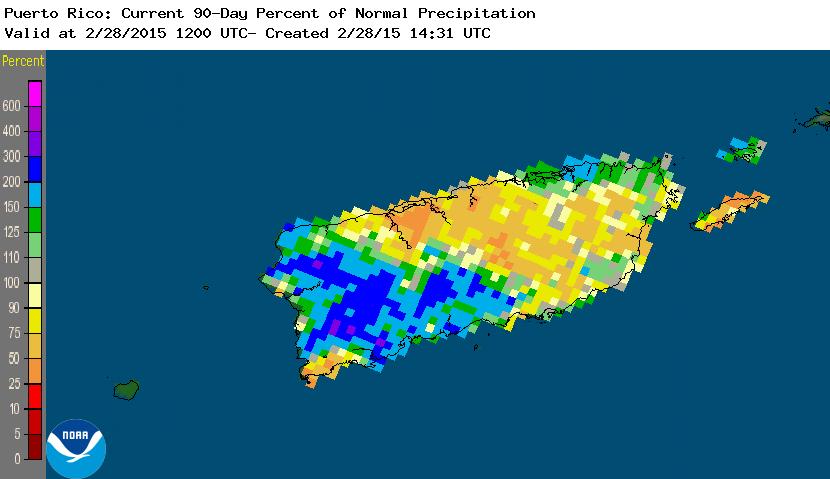
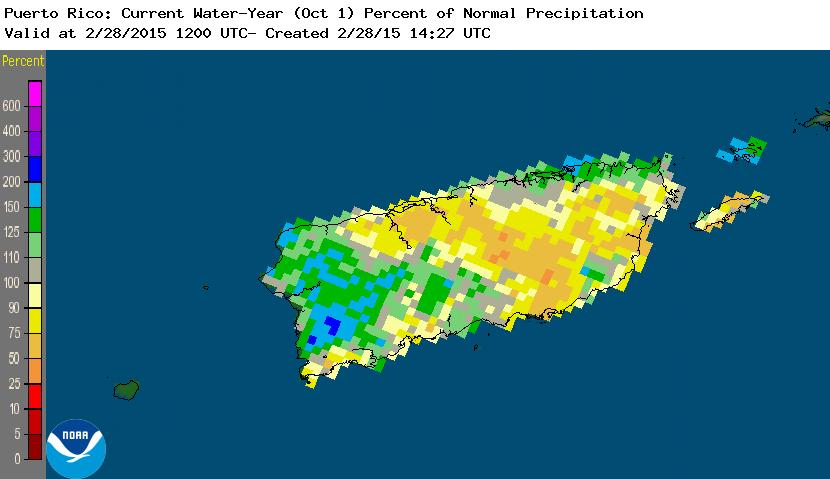
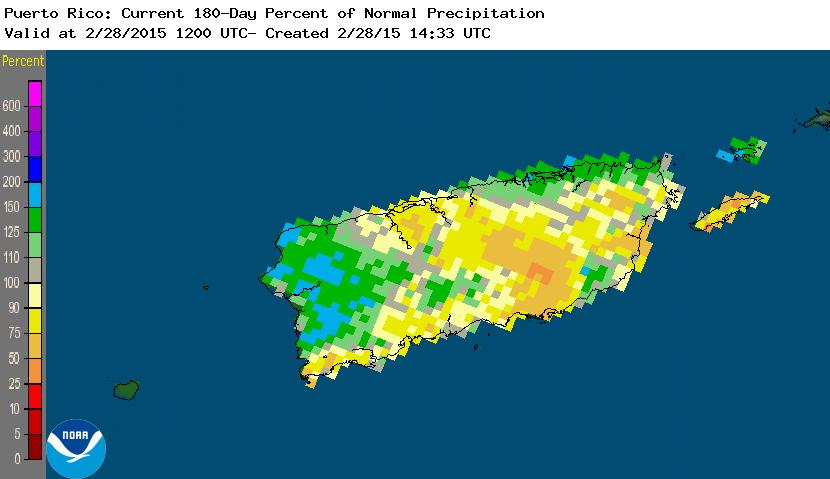
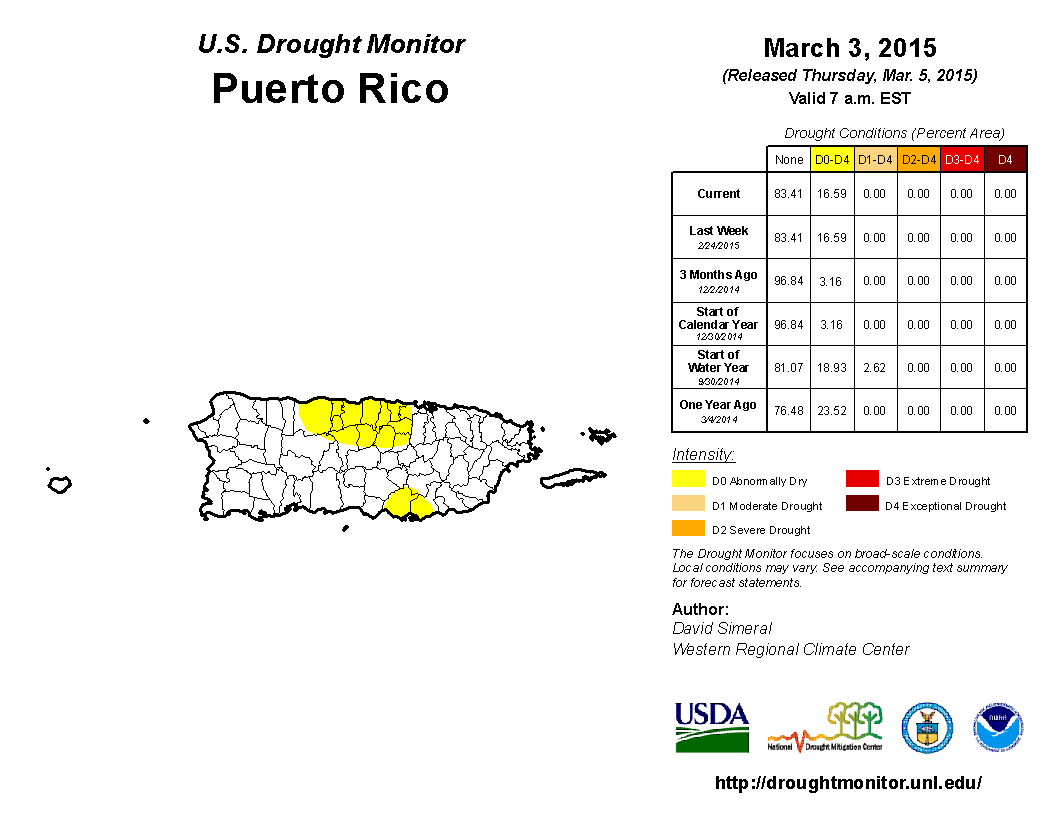
Puerto Rico: February continued a drier-than-normal trend for north-central Puerto Rico. The drier-than-normal area becomes bigger and extends further south and east at the longer time scales (last 2, 3, 5, 6 months). On the March 3rd USDM map, abnormal dryness continued for a sixth (16.6 percent) of Puerto Rico.
 |
|
The February precipitation anomaly pattern of dryness in the West, Plains to Midwest, and Northeast was reflected in the state ranks, with 24 states ranking in the driest third of the historical record. But portions of the states were not as dry and this tempered the statewide ranks. Record to near record warm temperatures accompanied the dryness in the West.
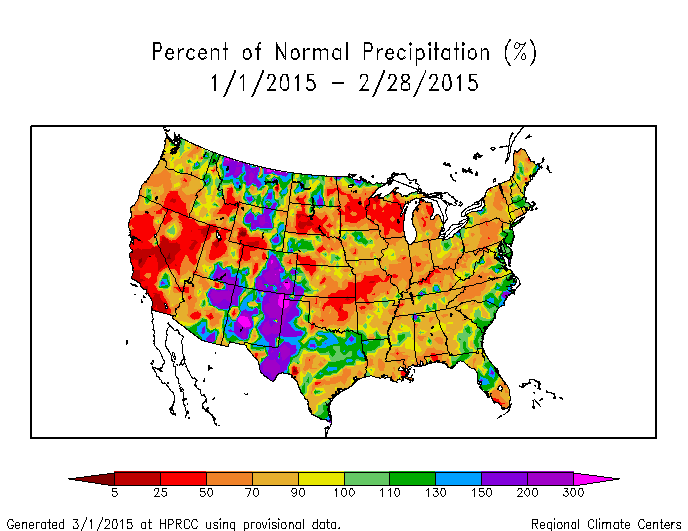
Dryness was more widespread for the year-to-date, with 28 states ranking in the driest third of the historical record. Wisconsin had the third driest January-February in the 1895-2015 record and California ranked eleventh driest. January-February 2015 marked the fifth consecutive much drier-than-normal January-February for California.
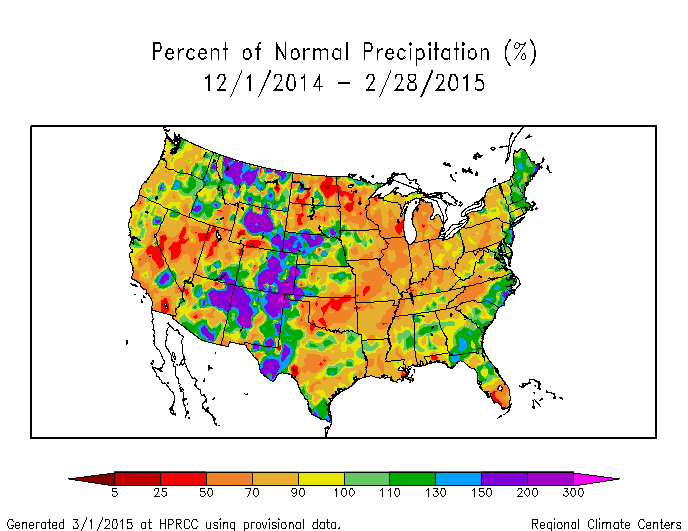
Precipitation that fell during December 2014 reduced the dry area for winter, with 18 states ranking in the driest third of the historical record. Record to near record warm temperatures were widespread in the West for December 2014-February 2015.
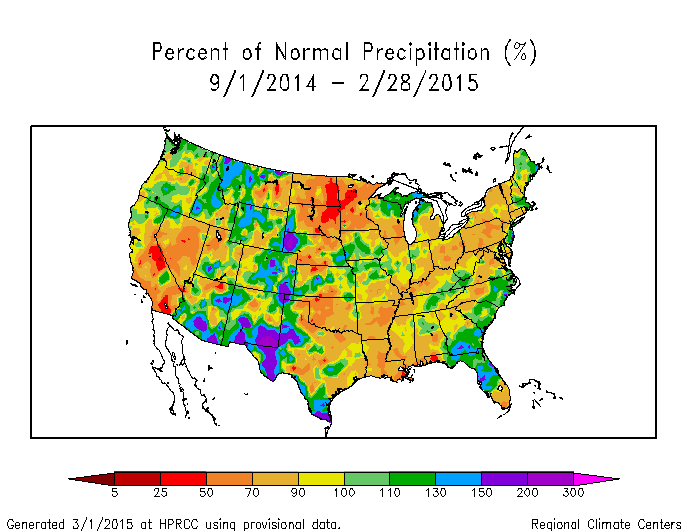
September 2014-February 2015 was drier than normal in the Far West, Southern Plains, and Midwest to Northeast, and much drier than normal in the Northern Plains. But no state ranked in the tenth driest, or drier, category, and only 12 states ranked in the driest third of the historical record. Precipitation was more widespread over the last 12 months, with only four states ranking in the driest third of the historical record for March 2014-February 2015. Temperatures were record warm across the West for the last six to 12 months.
|
|
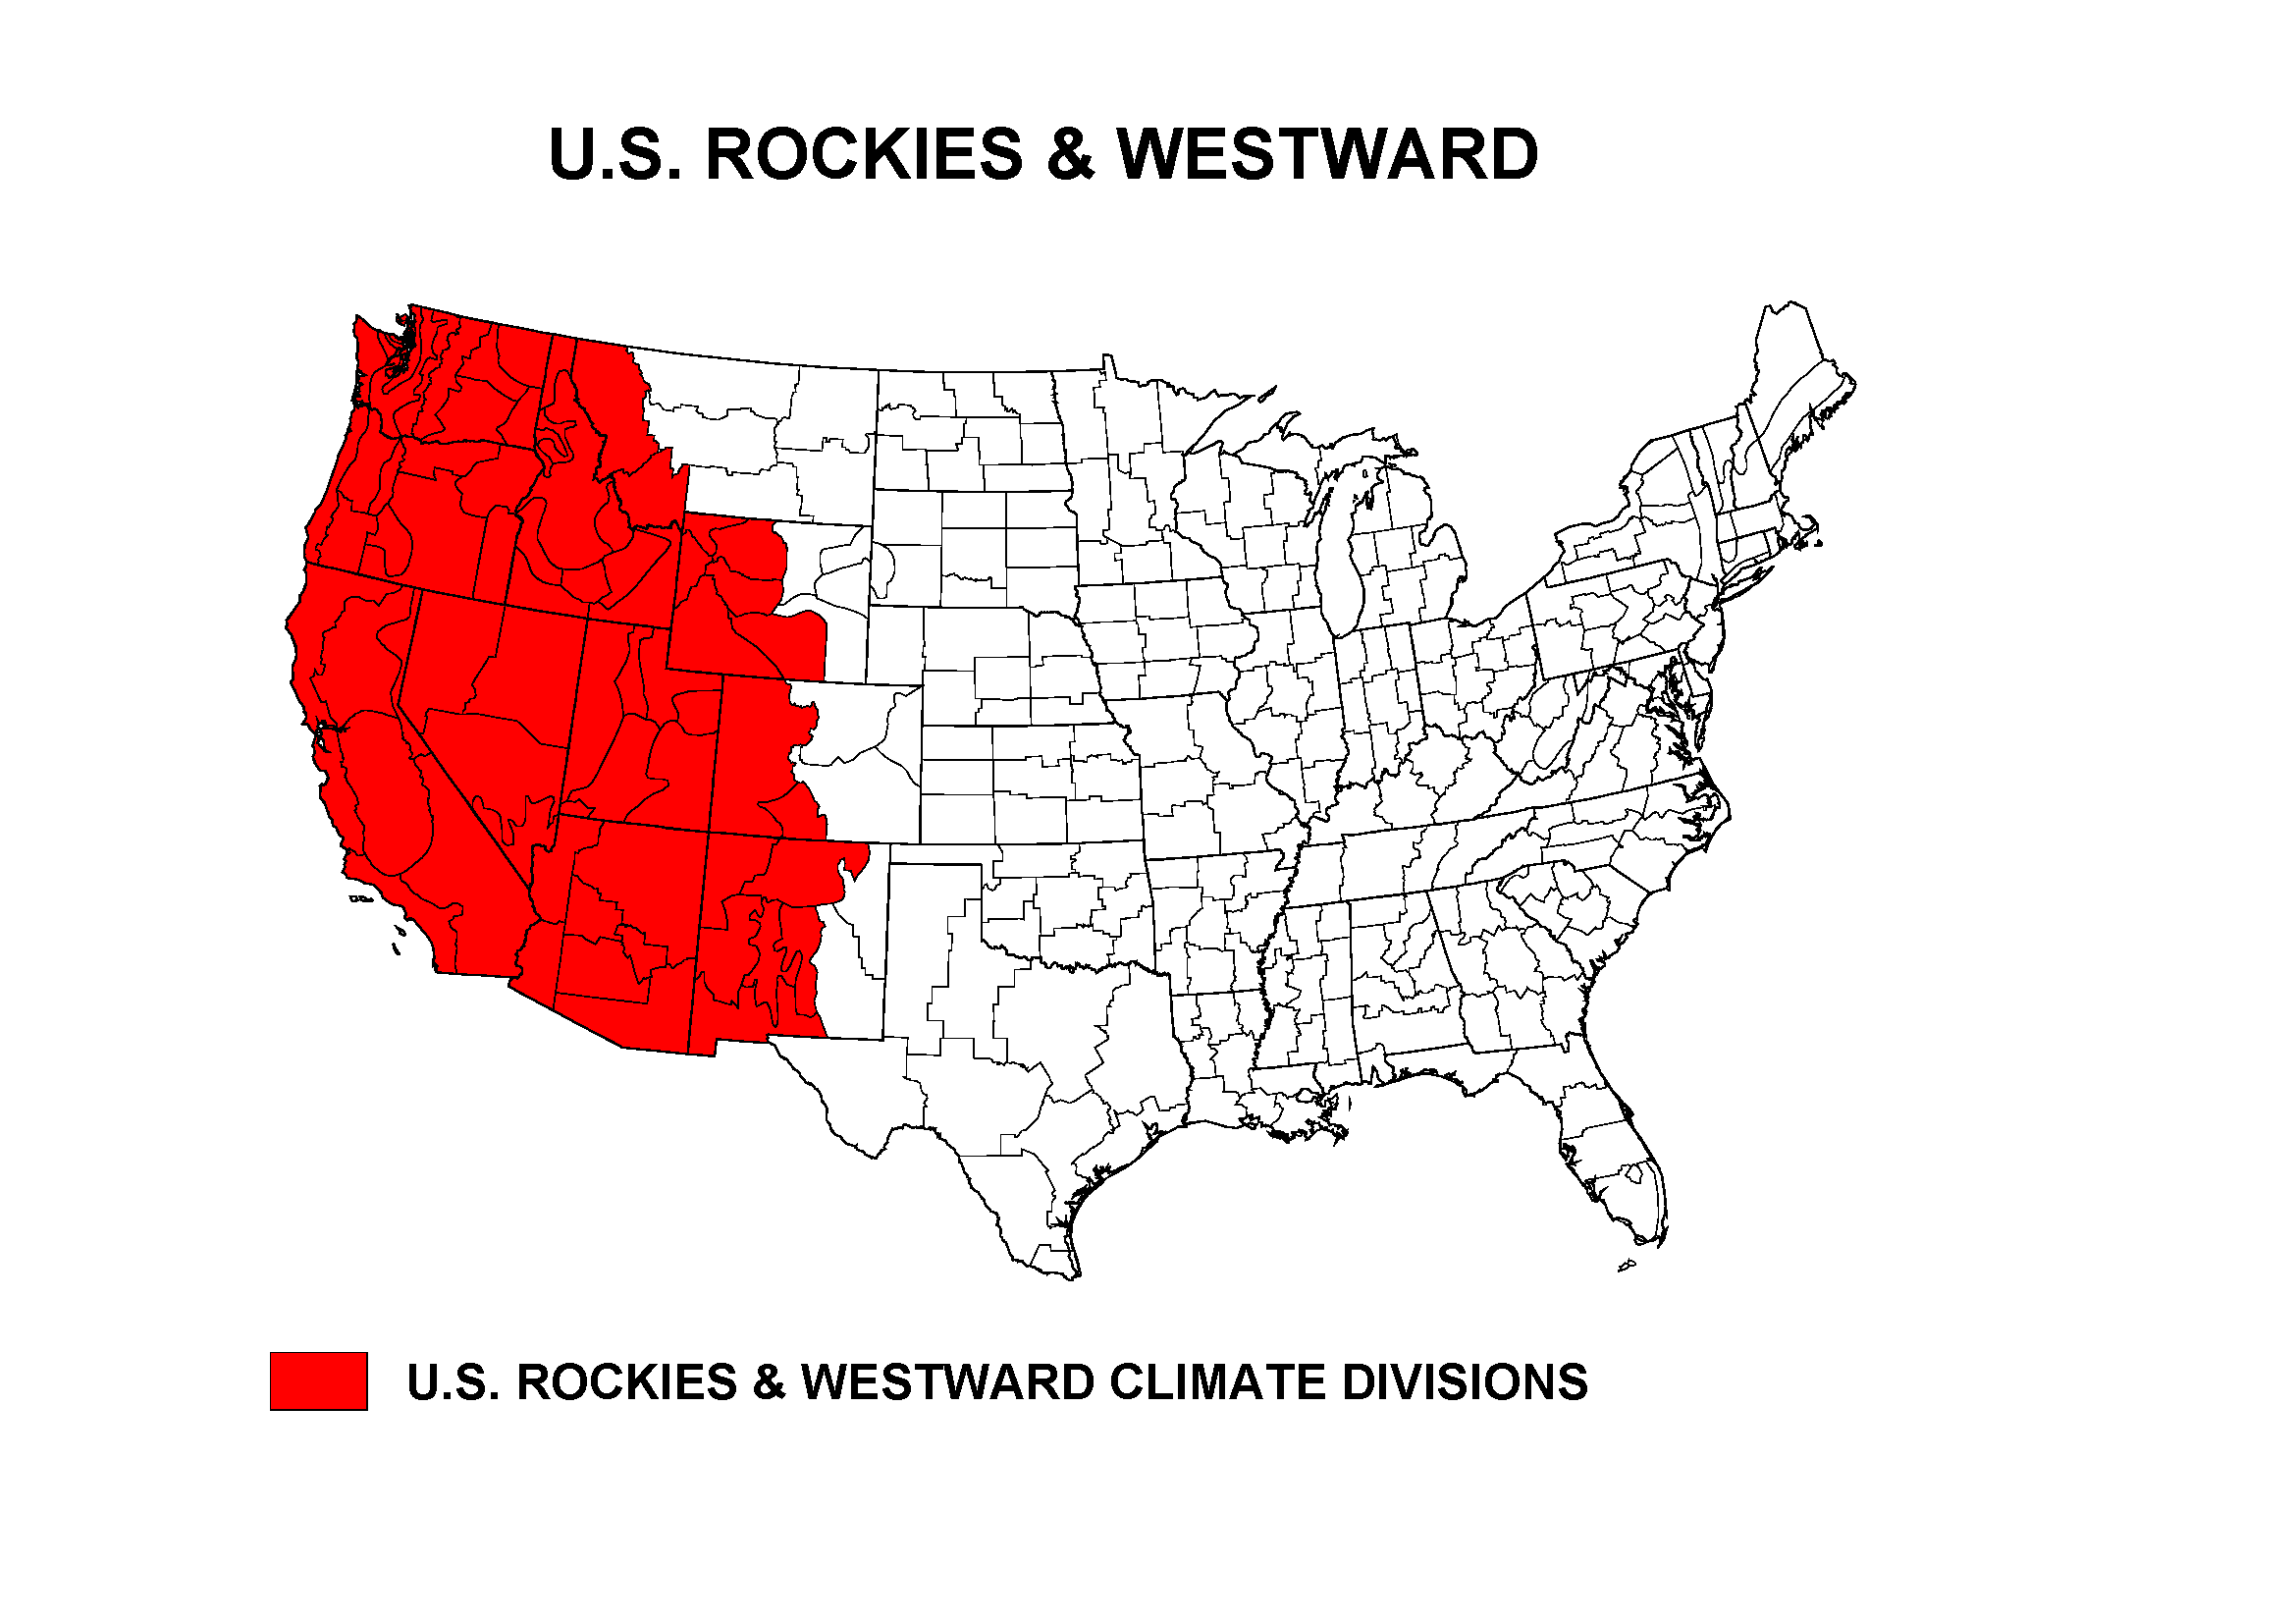
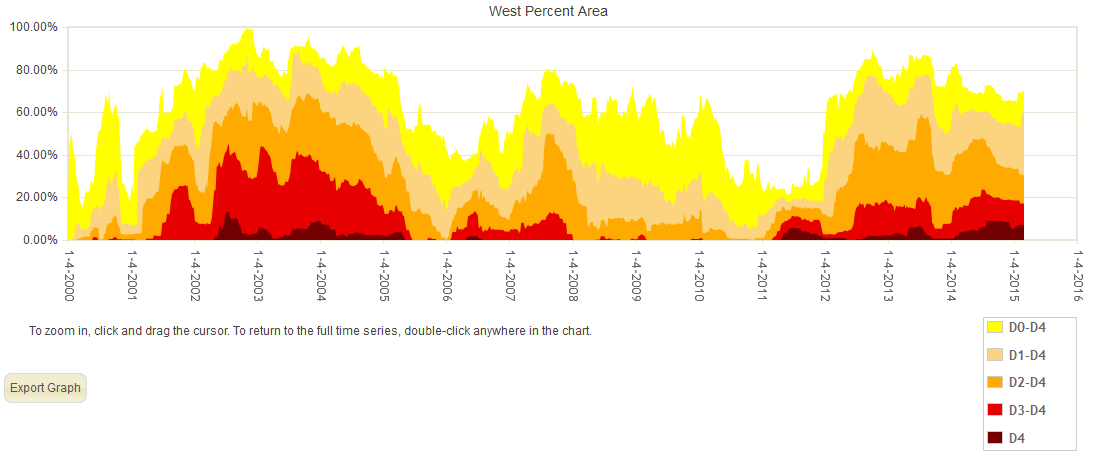
Percent area of the Western U.S. in moderate to extreme drought, January 1900 to present, based on the Palmer Drought Index.
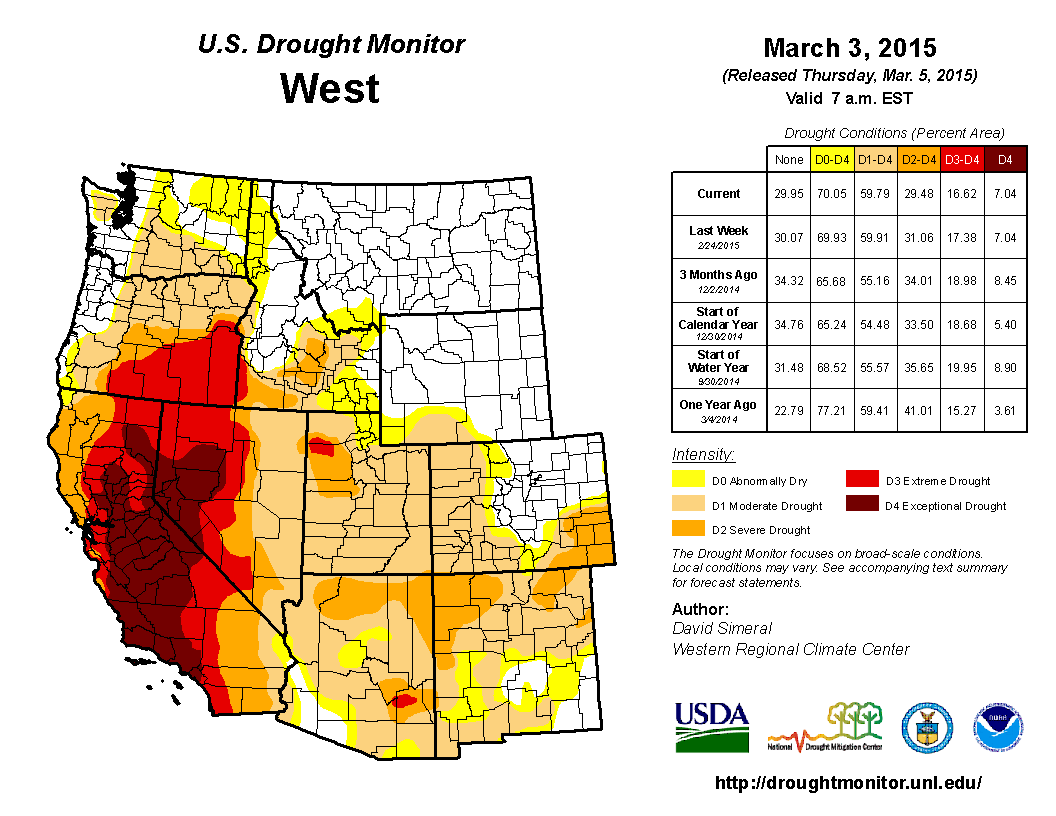
As noted above, dry weather has dominated the West for much of the last three years, resulting in significant hydrological (low lake, reservoir, and stream levels) and agricultural impacts. According to the USDM, 59.8 percent of the West was experiencing moderate to exceptional drought at the end of February, which is an increase compared to the previous month. The Palmer Drought Index percent area statistic for the West was 45.0 percent, an increase of about 10 percent compared to the previous month.
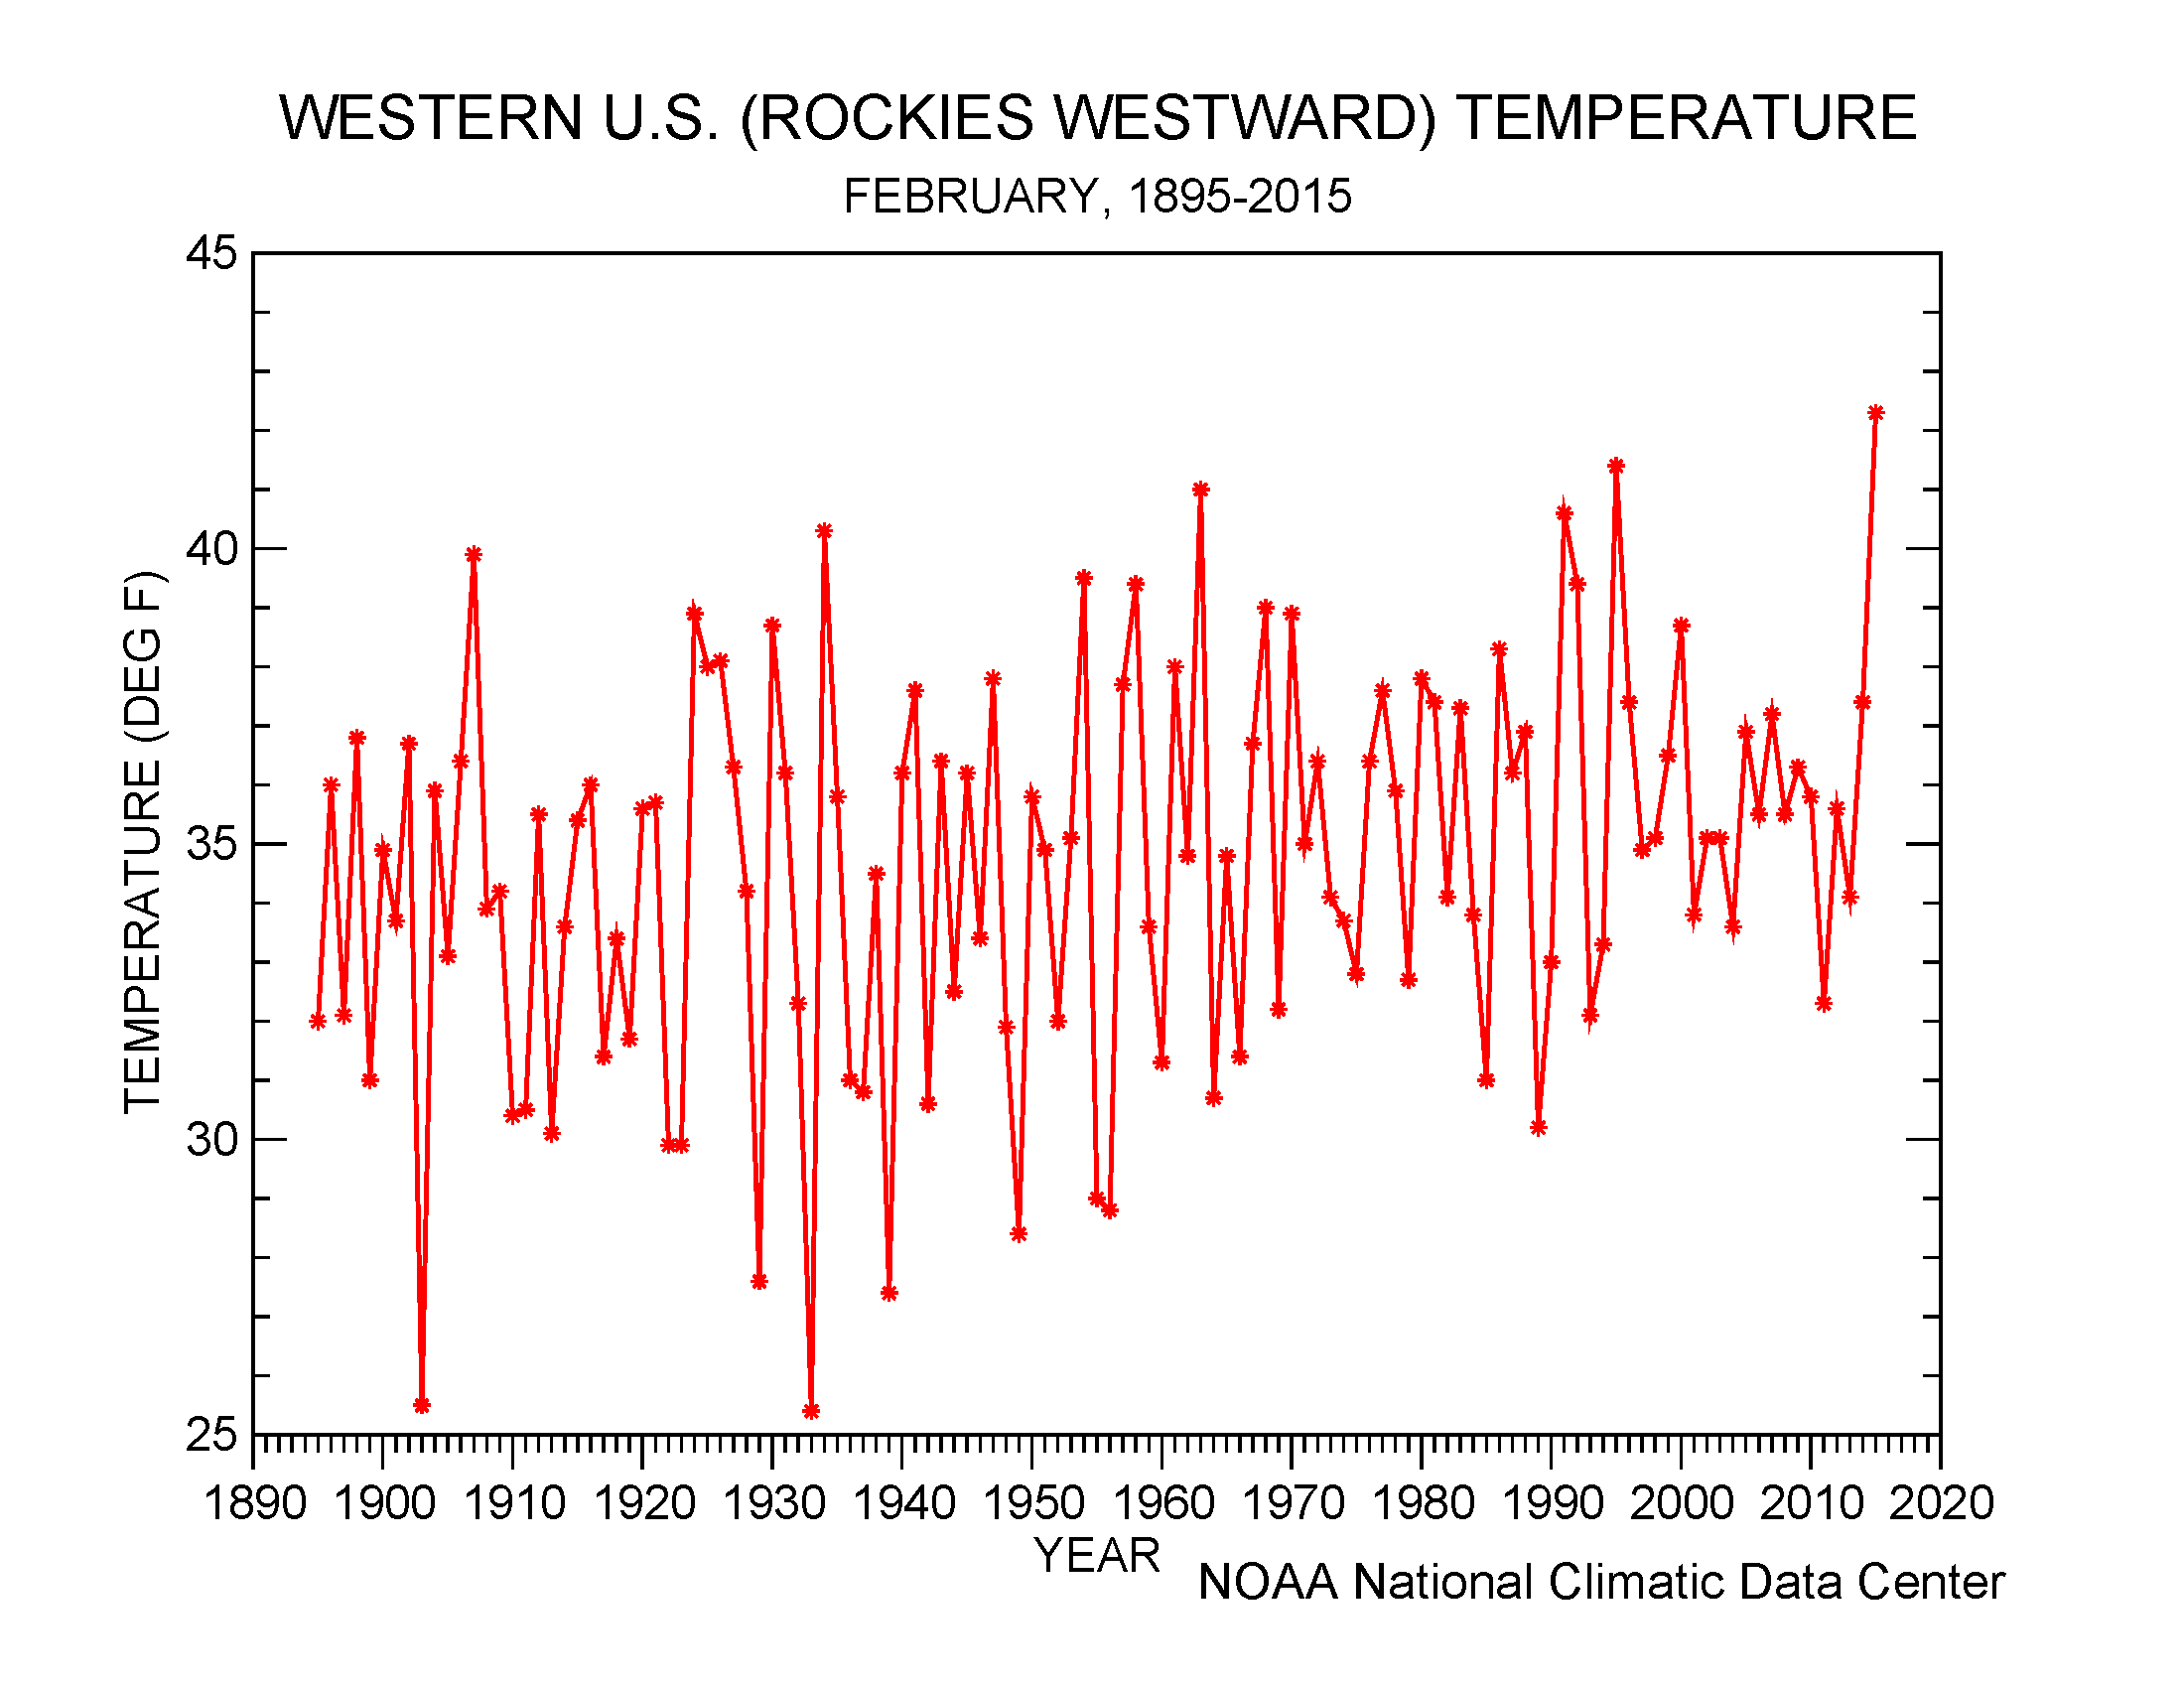
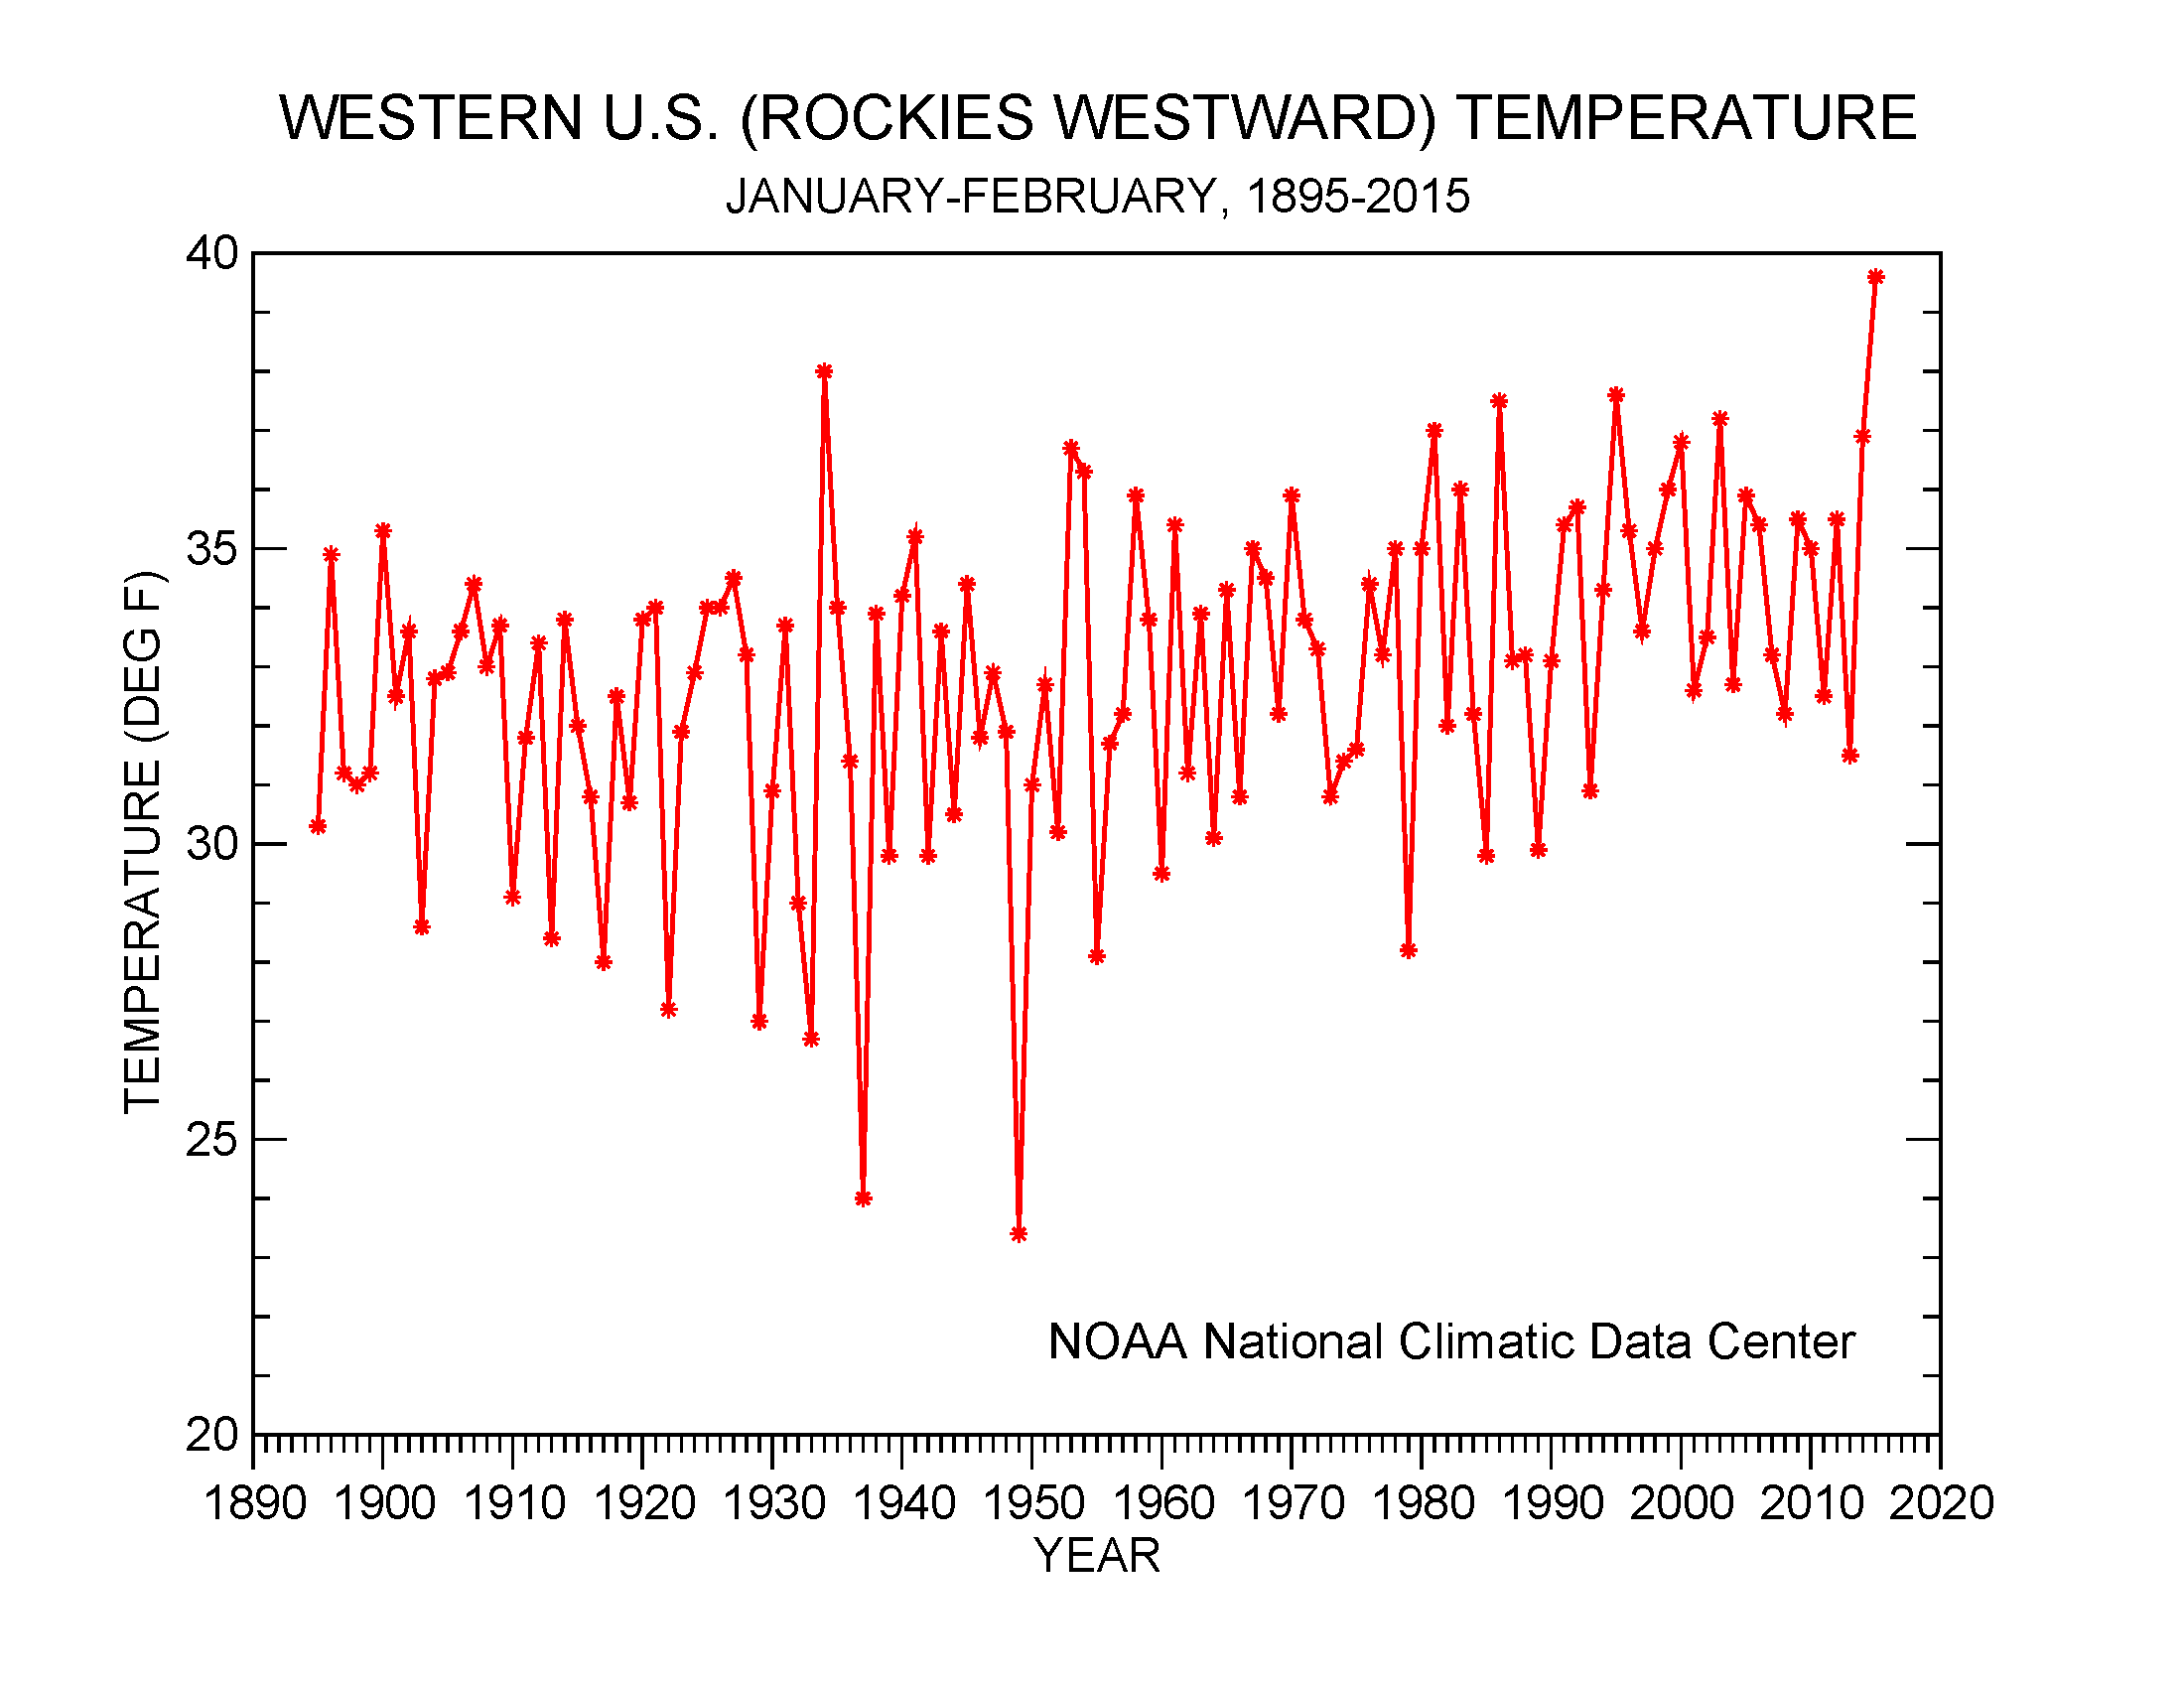
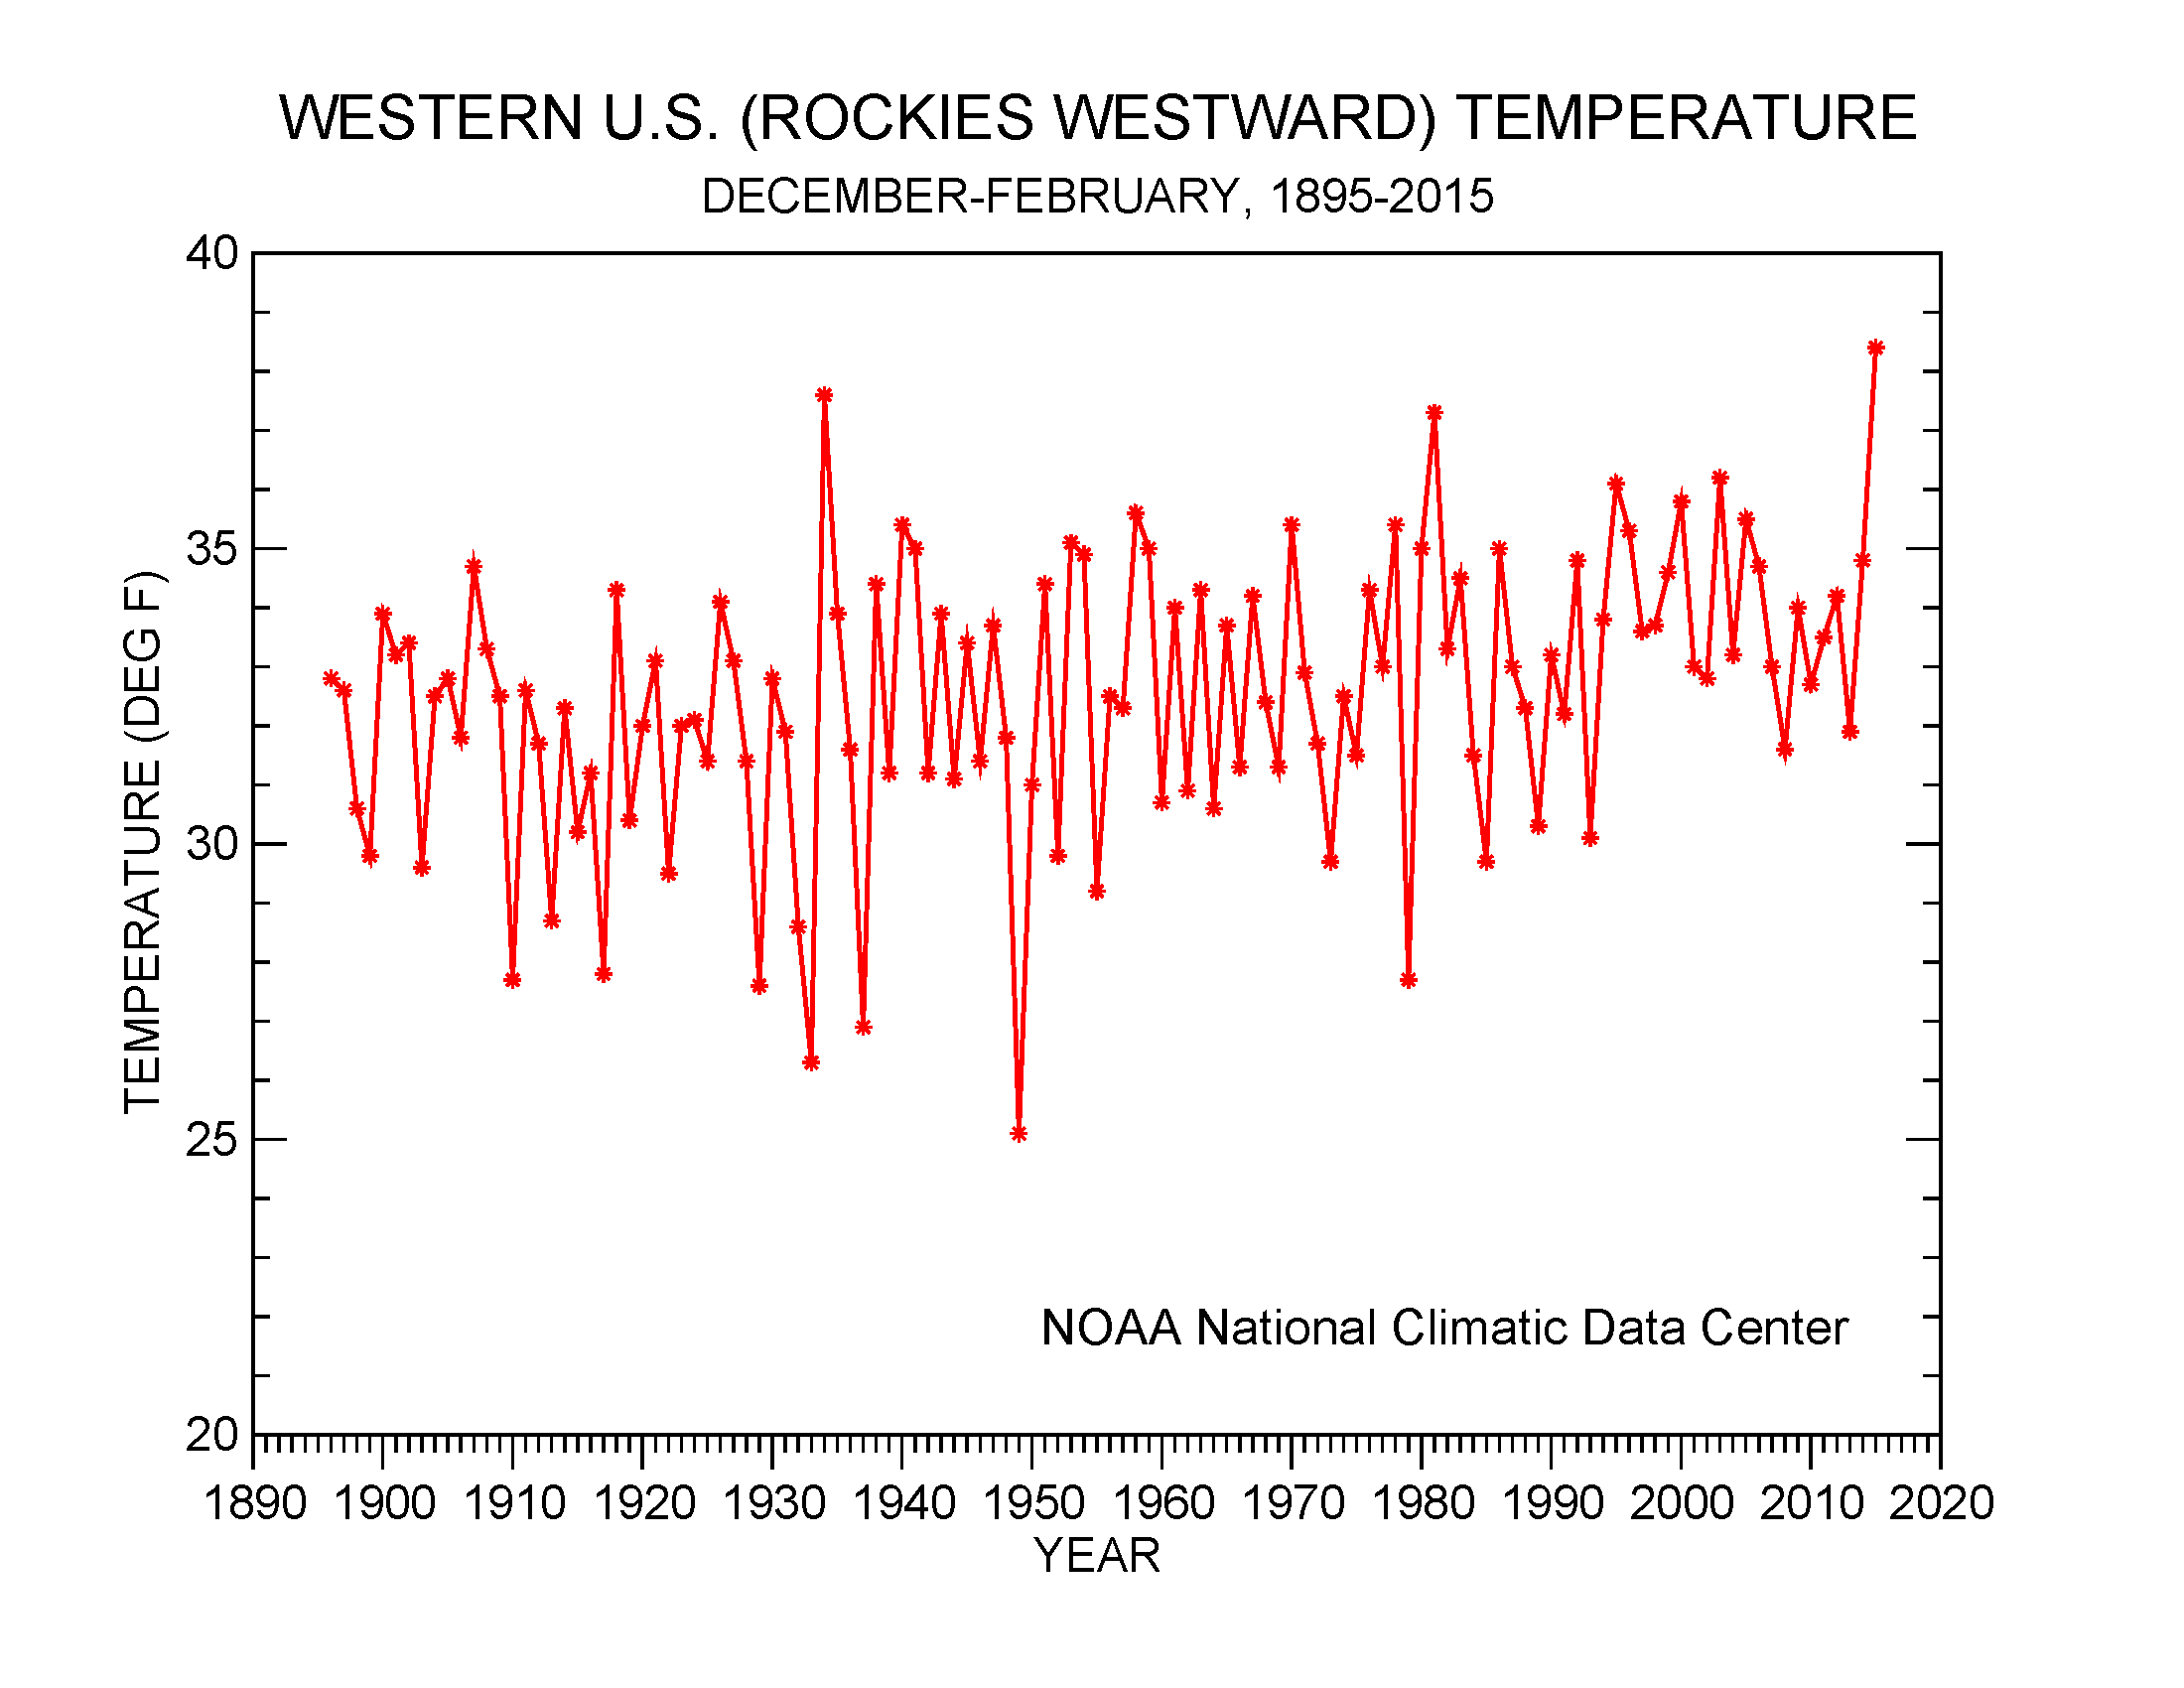
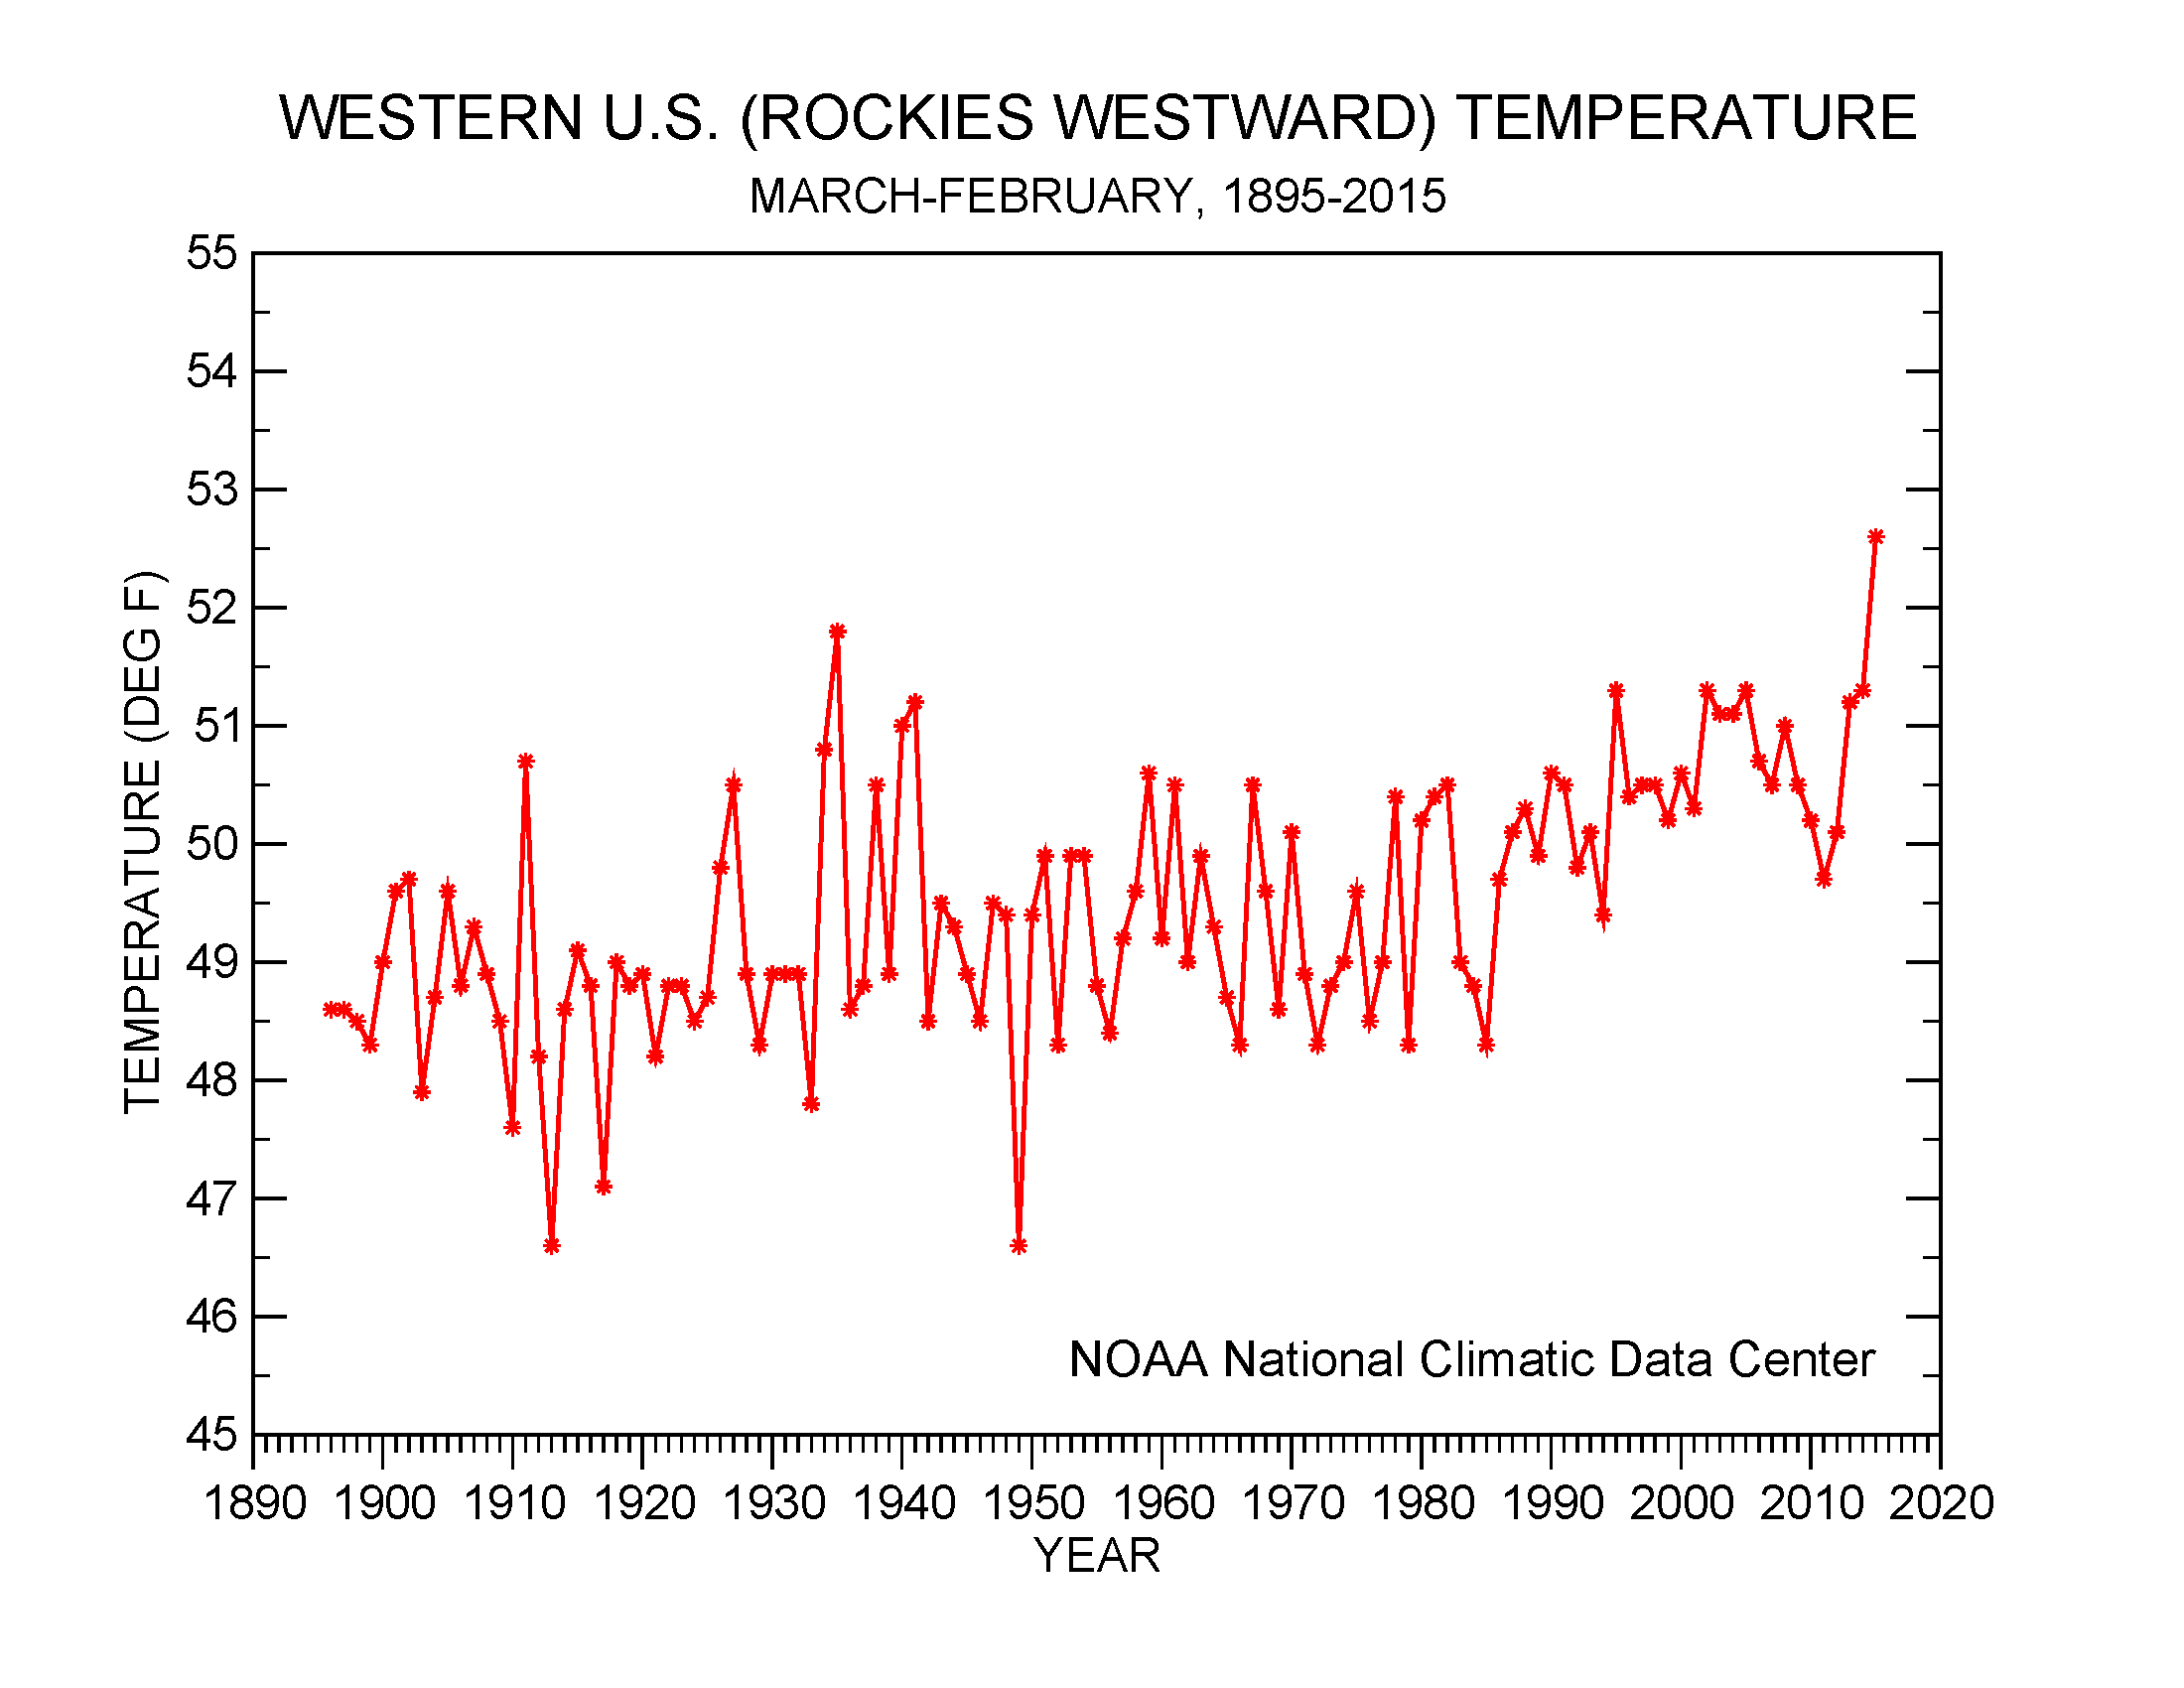
As noted earlier, record warm temperatures have been widespread and persistent across the West. When temperatures are aggregated across the region (from the Rockies westward) and across time, 2015 and 2014-2015 rank as record warm regionwide for February, the year to date (January-February), winter (December-February), and the last 12 months (March-February).
|

|
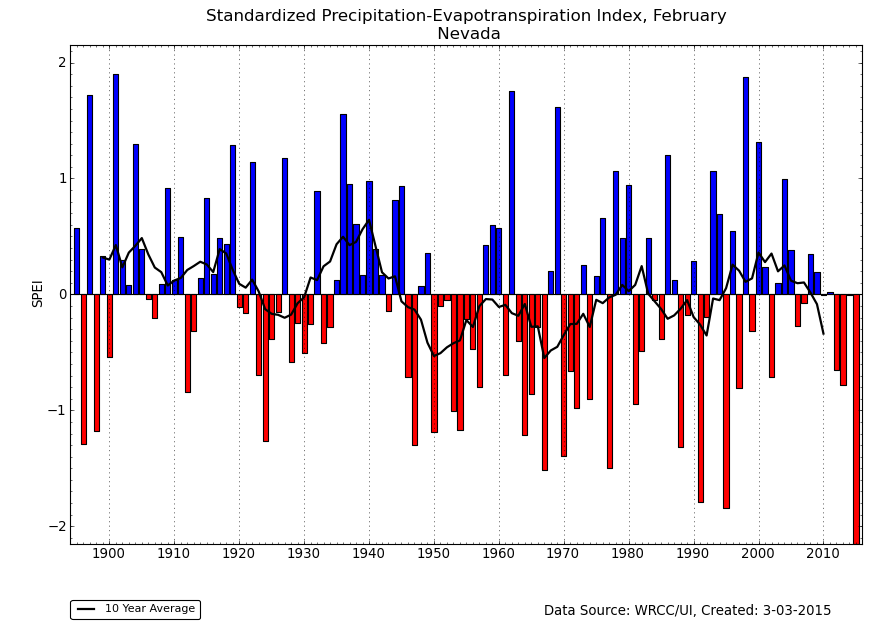
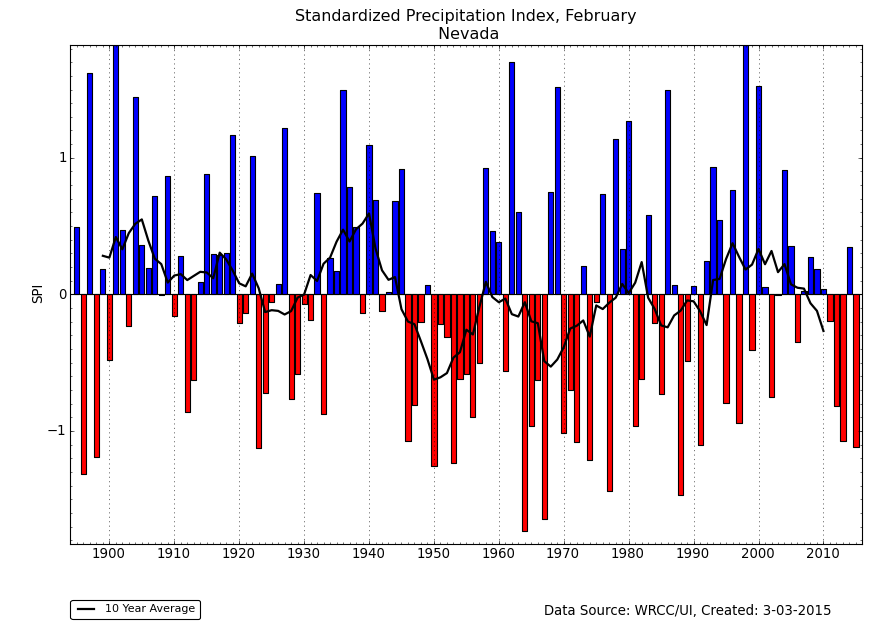
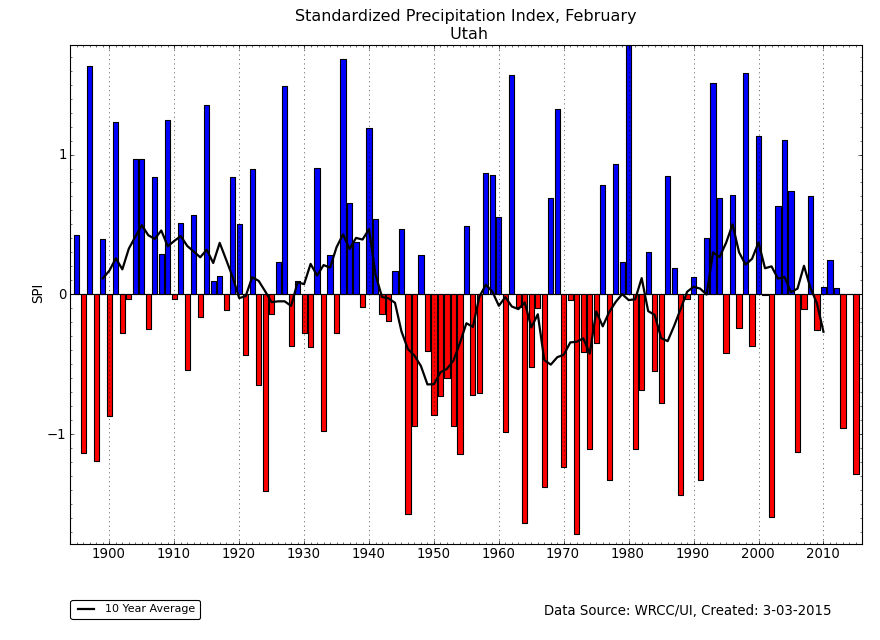
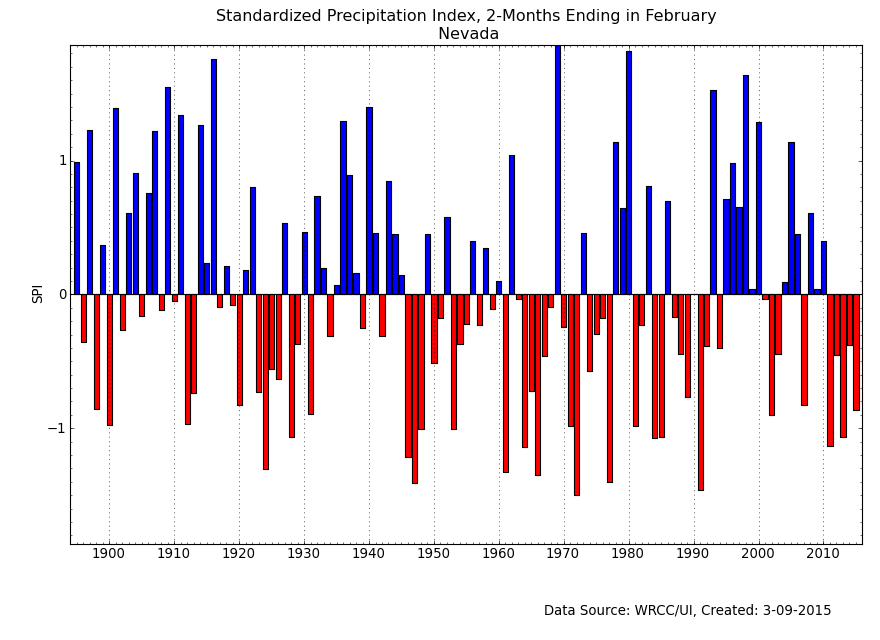
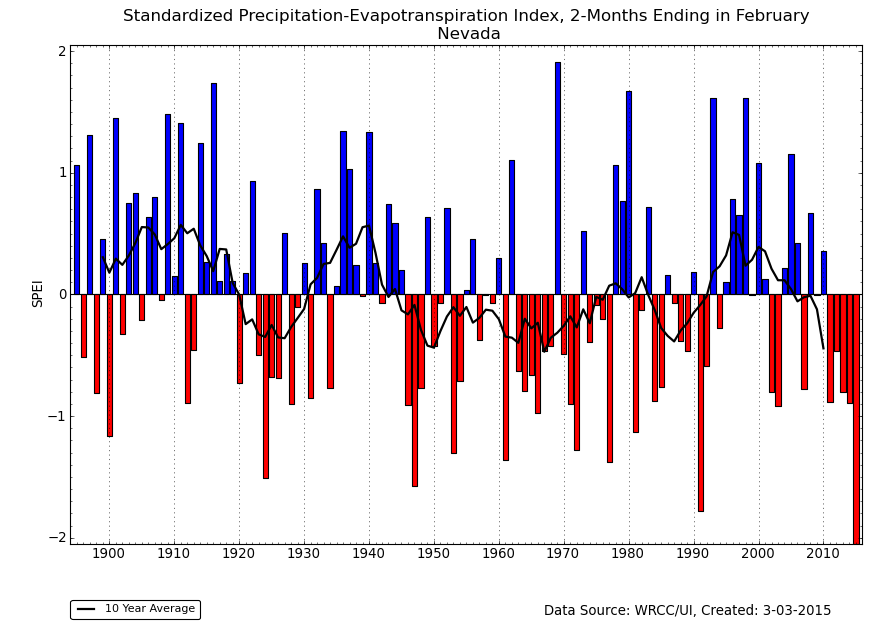
Nevada and Utah were an epicenter of dryness during February 2015, as seen in the SPI map. Based on precipitation (e.g., SPI) alone, the state ranks for February 2015 were 38th driest for Nevada and 29th driest for Utah. Utah had the warmest February on record and Nevada the second warmest. When temperature is also taken into account, both Nevada and Utah had the driest February on record, based on the SPEI. For Nevada, the year-to-date ranked as the 17th driest January-February (based on precipitation) but warmest (based on temperature) on record, and this difference is evident when the SPI (24th driest) is compared to the SPEI (driest).
|
|
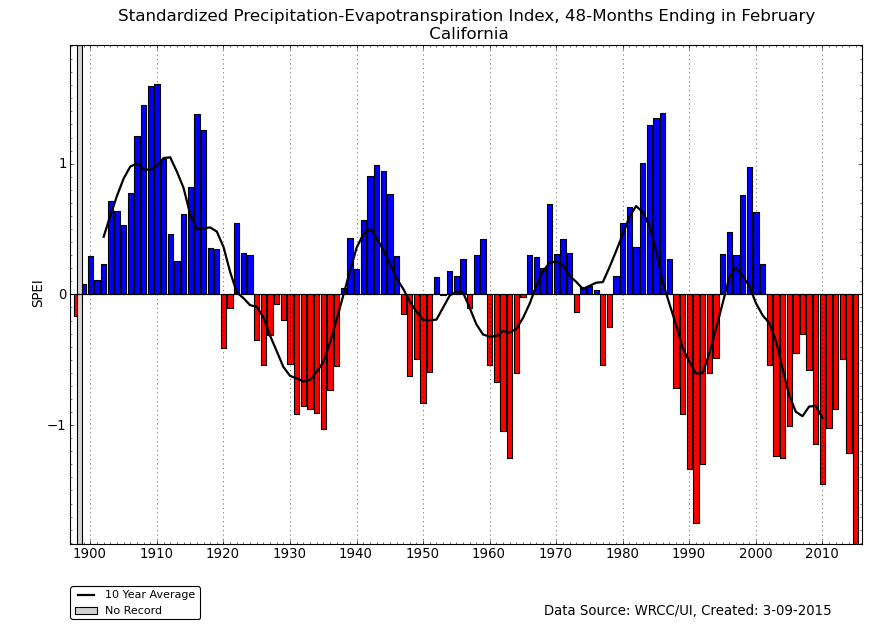
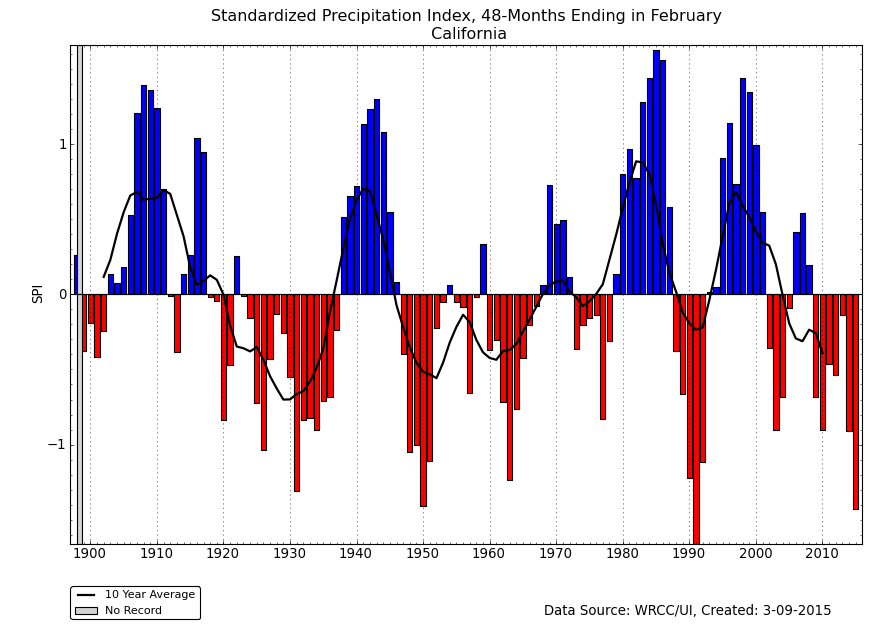
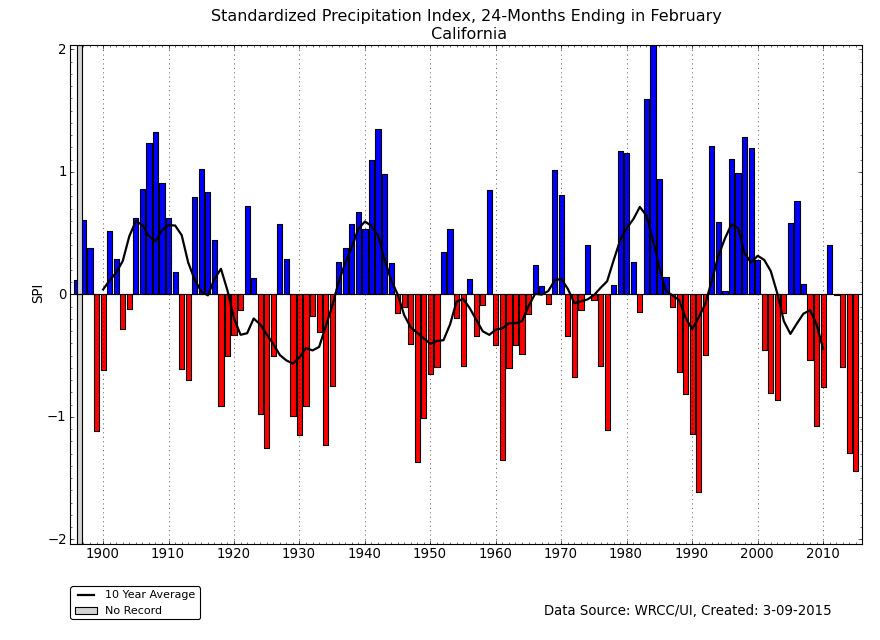
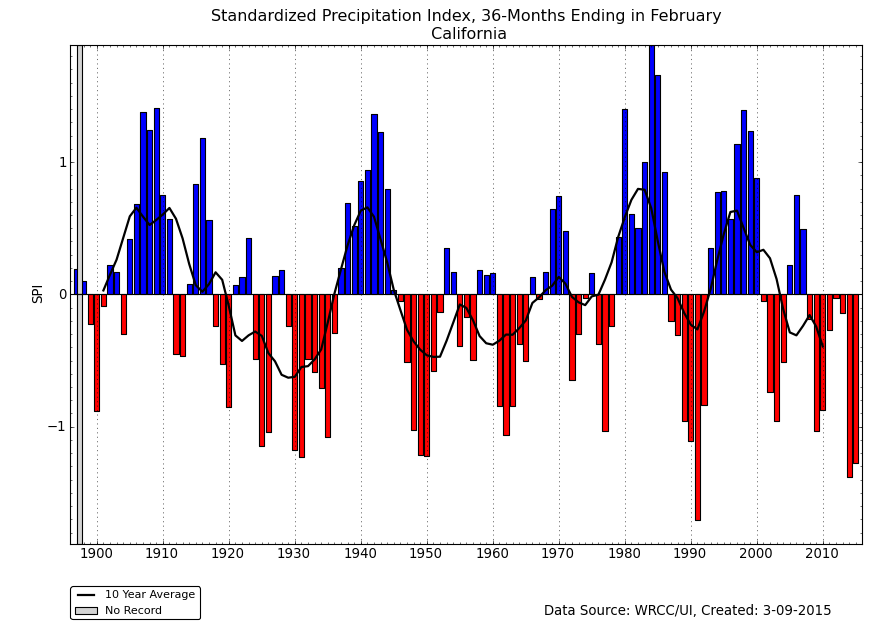
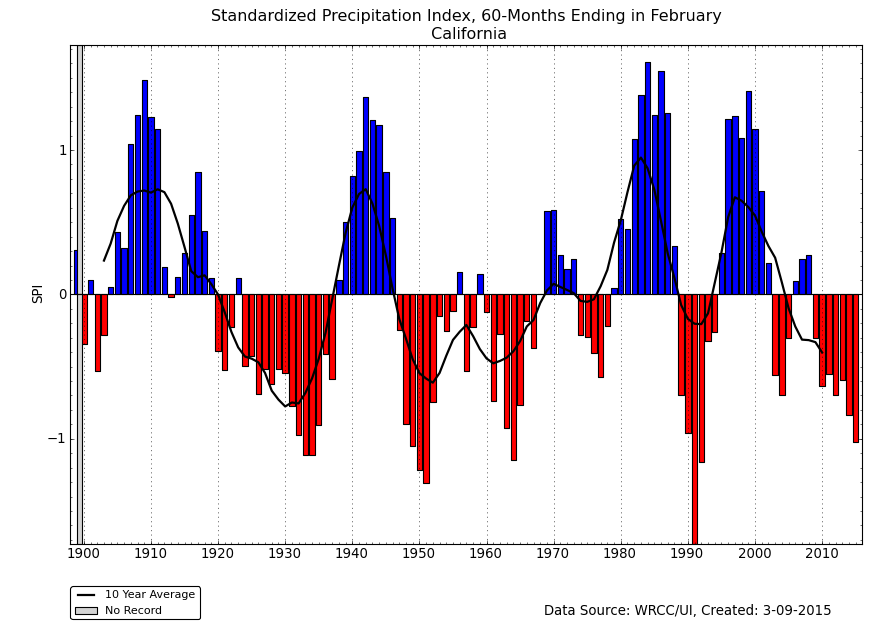
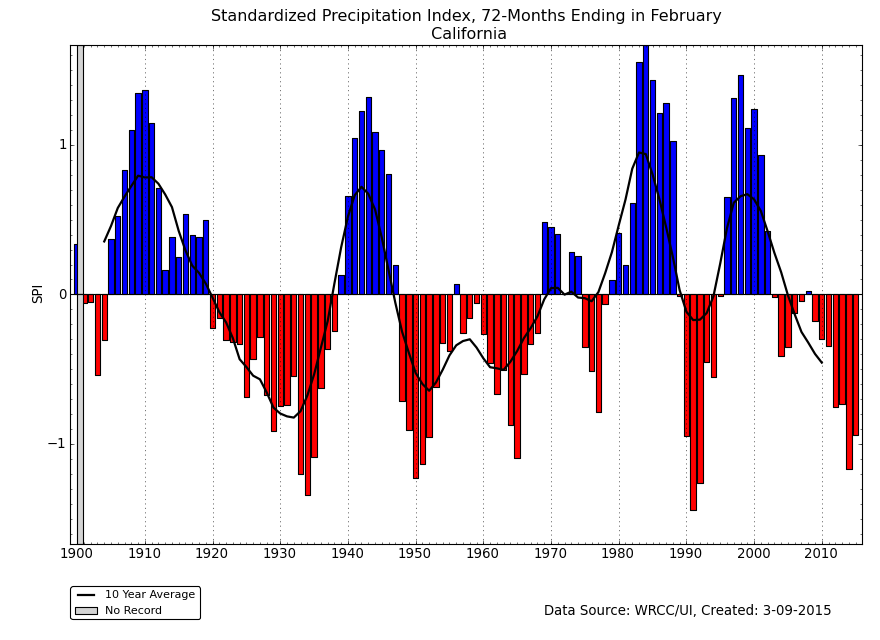
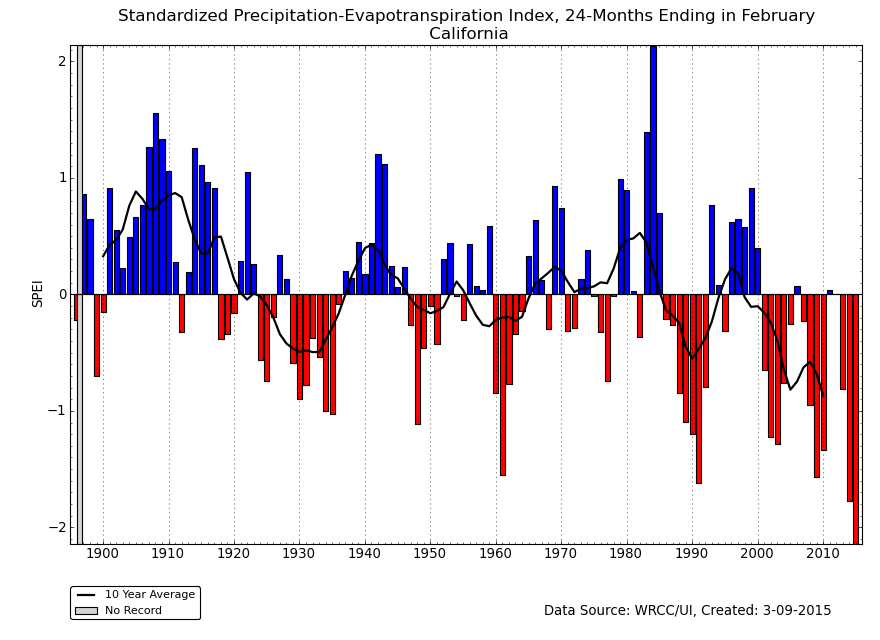
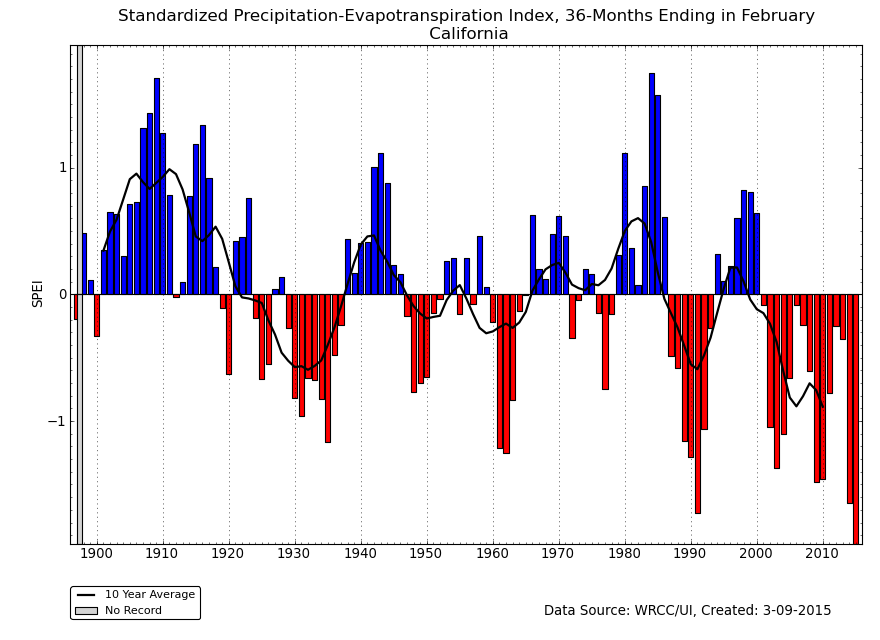
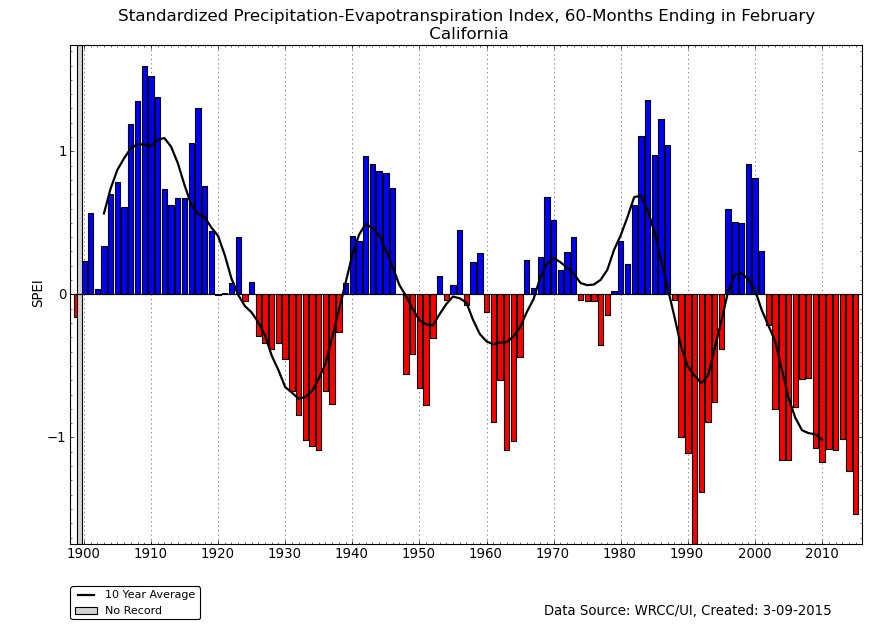
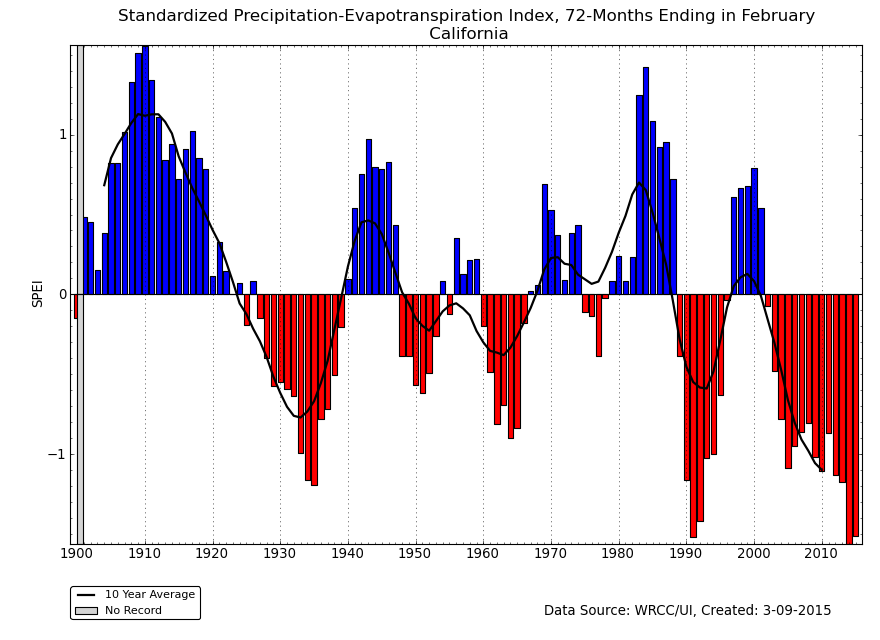
The record warm temperatures in the West during the last several years have increased evaporation and exacerbated the drought conditions. This is easily seen by comparing the SPI to the SPEI for California for several time periods ending in February 2015. The lack of precipitation for the last several years has given the state an SPI rank of second driest for the last 24 months (March 2013-February 2015) (behind March 1989-February 1991), third driest for the last 36 months, second driest for the last 48 months, ninth driest for the last 60 months, and 12th driest for the last 72 months. When temperature-defined moisture demand is included via the SPEI, the state has a rank of driest for the last 24, 36, and 48 months; second driest for the last 60 months (behind 1986-1991); and third driest for the last 72 months.
|
|
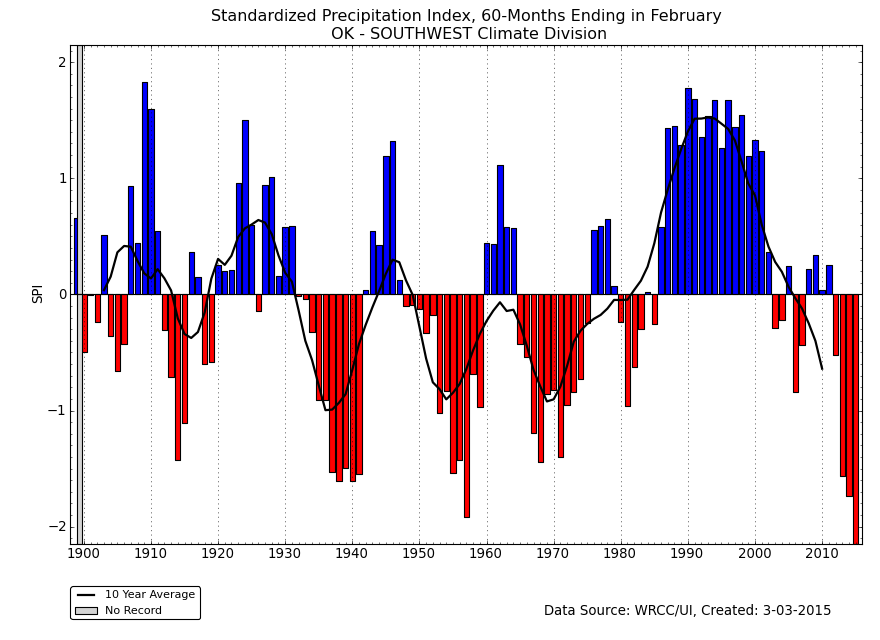
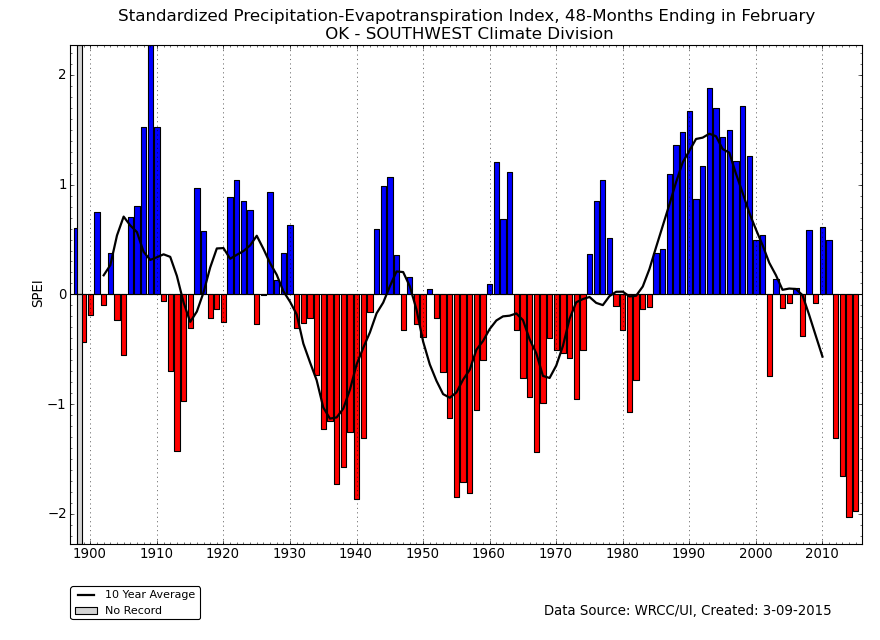
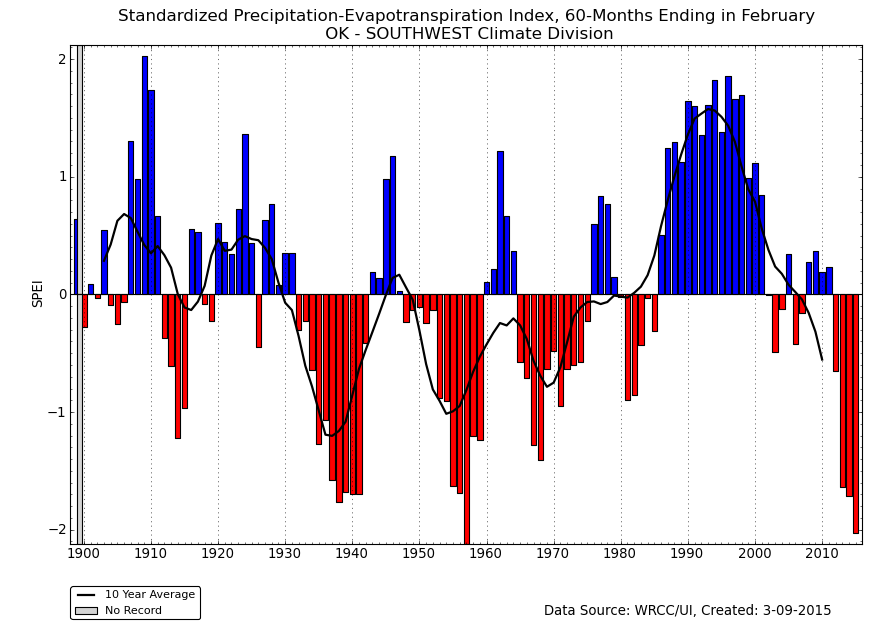
Parts of the Southern Plains have received near to above-normal precipitation in recent months, but other parts (especially Oklahoma) have been drier than normal. Southwest Oklahoma (climate division 7) stands out as an epicenter of drought in the Southern Plains. According to the PDSI, meteorological drought has ended in Oklahoma, but the PHDI indicates that hydrological drought continues, especially in Southwest Oklahoma. The precipitation that has fallen over the last year or two has not been enough to make up for deficits that have built up over the last five years. Each of the last five years (March-April 12-month periods) has been drier than normal for Southwest Oklahoma, resulting in a record dry 60-month SPI. Record warm temperatures enhanced evapotranspiration and intensified drought during 2011-2012, but near-normal temperatures during the last couple years have reduced the 48- and 60-month SPEI to only second most extreme on record.
 |
 |
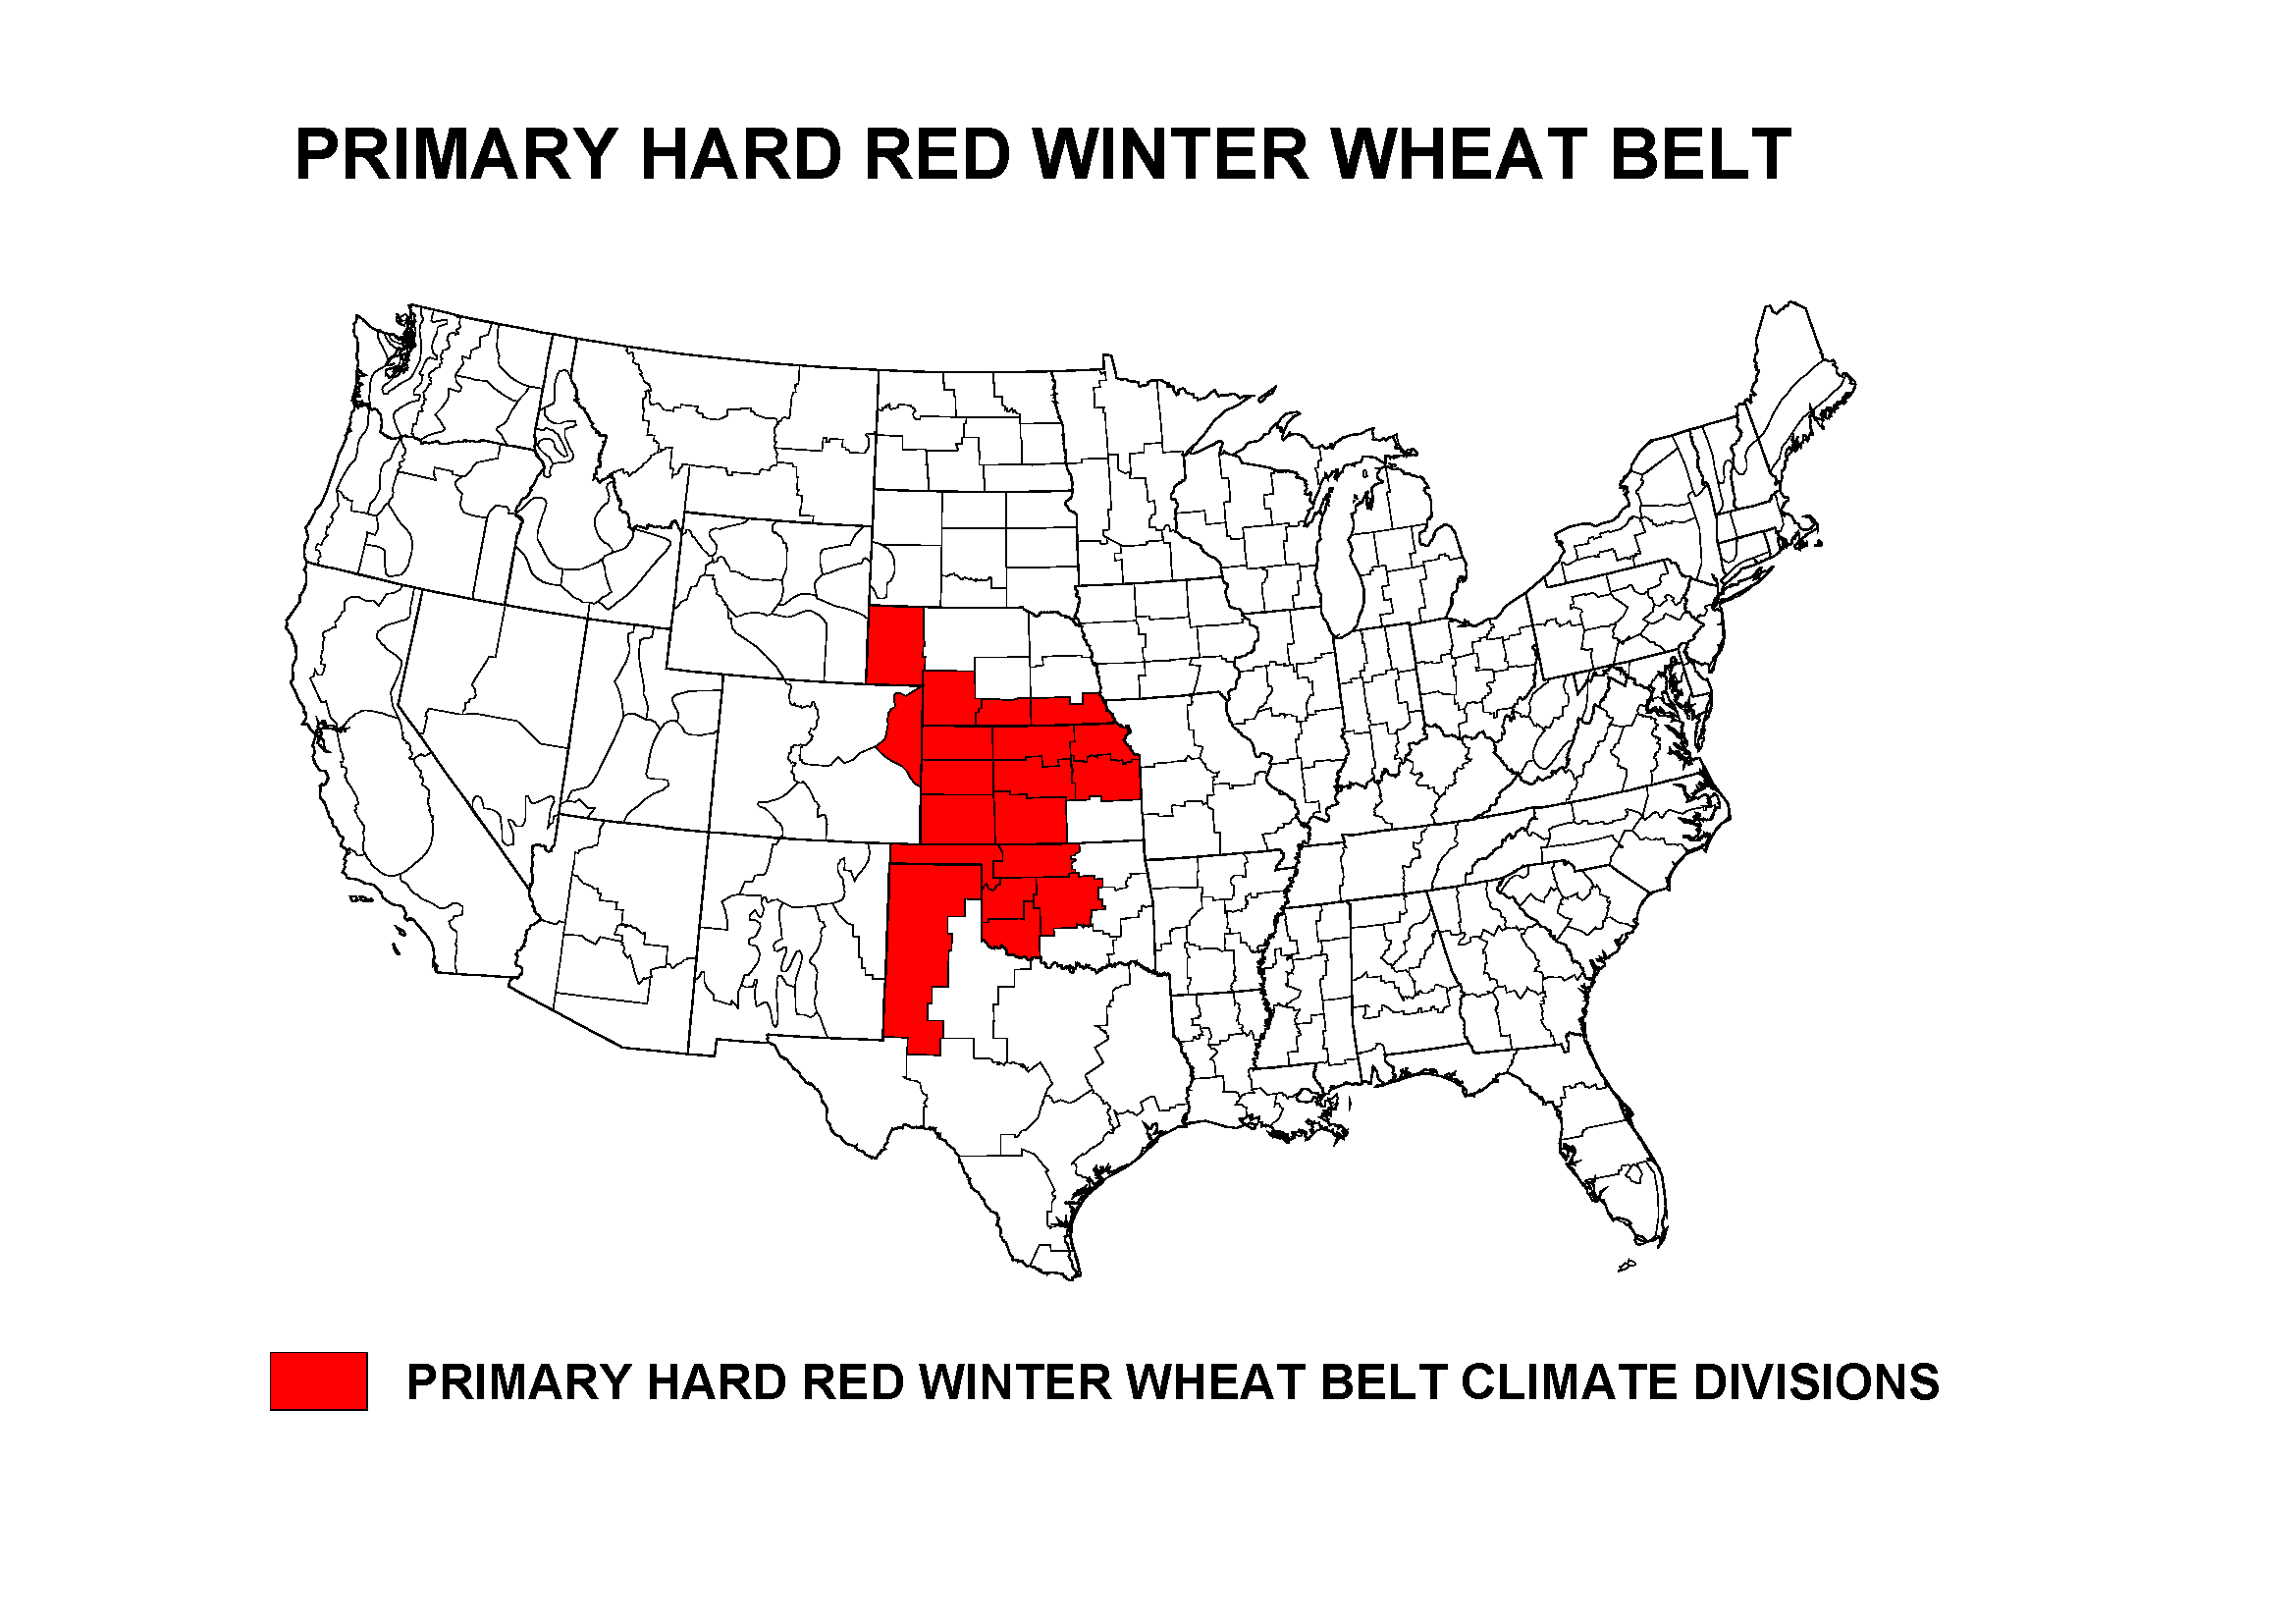
October marks the start of the growing season for the Primary Hard Red Winter Wheat agricultural belt. While portions of the region were drier than normal this month, February 2015 ranked in the middle of the 1895-2015 record for precipitation at 56th driest, and 52nd coolest for temperature, regionwide. The growing season to date ranked as the 60th driest and 37th warmest October-February in the 120-year record. The last three growing season-to-date periods have averaged slightly drier than normal, regionwide.
NOAA Regional Climate Centers:
A more detailed drought discussion, provided by the NOAA Regional Climate Centers and others, can be found below.
West
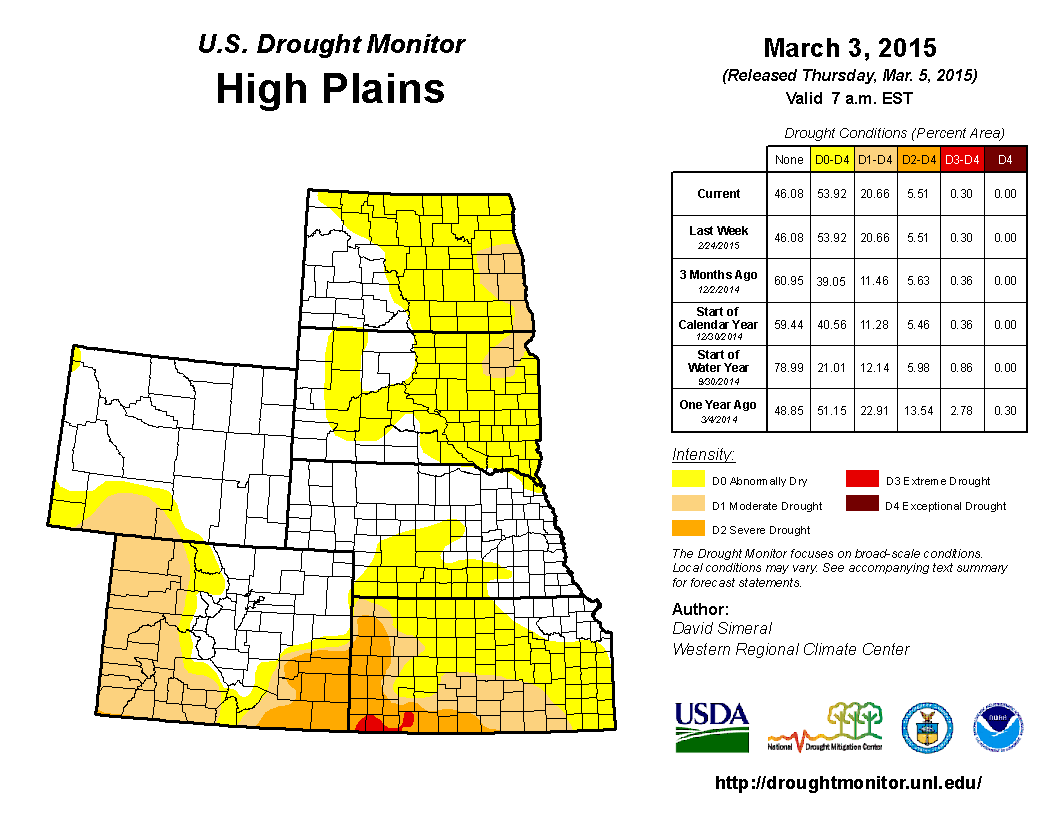
As described by the High Plains Regional Climate Center, this month, there was a large contrast in temperatures across the United States due to a ridge to the west and a trough to the east. The extreme warmth in the west was a concern due to the continued low snowpack and the cold in the east allowed for wintry weather to impact locations even in the Deep South. Because the High Plains region was on the dividing line of the warm and cold air, eastern areas were below normal, central areas were near normal, and western areas were above normal.
After a fairly dry January, precipitation returned in February for some areas of the High Plains region, especially along the Front Range in Colorado, areas of central Wyoming, and portions of Kansas, Nebraska, and North Dakota. There were dry areas of the region as well, including South Dakota, southern Kansas, southwestern Wyoming, and portions of eastern North Dakota and northwestern Colorado where precipitation totaled 50 percent of normal, at best. A few isolated areas received little to no precipitation and ranked in the top 10 driest Februaries on record. At this time of the year, precipitation does not contribute a large percentage of the annual total; however, dry areas will need to be monitored this spring when deficits can grow more quickly.
Although typically a quiet time of the year for drought developments/improvements in the High Plains region, drought conditions expanded over the past month, according to the latest releases of the USDM. The total area in drought (D1-D4) increased from about 12 percent to just over 20 percent with moderate drought conditions (D1) expanding across western Colorado and into southern Wyoming. A combination of unseasonably warm weather and a low snow water equivalent in the mountain snowpack has led to this depiction on the USDM. For the region as a whole, this expanded the total D1 coverage from about 7 percent to 15 percent. The remaining severe (D2) and extreme (D3) drought conditions in portions of eastern Colorado and western and southern Kansas remained unchanged. Meanwhile, abnormally dry conditions (D0) expanded into central Colorado, southwestern Wyoming, and west-central South Dakota. In areas receiving heavy rain and snow, such as northeastern Kansas and southeastern Nebraska, D0 was eliminated. As more data are collected and analyzed, drought impacts are still being realized in some parts of the region. According to a study by the U.S. Forest Service and Colorado State Forest Survey, the spruce beetle epidemic has expanded due to a combination of factors, one of which is drought. Southwestern areas of the state have experienced the most rapid expansion of the infestation. On a related matter, the mountain pine beetle epidemic has slowed, most likely due to a lack of live trees.
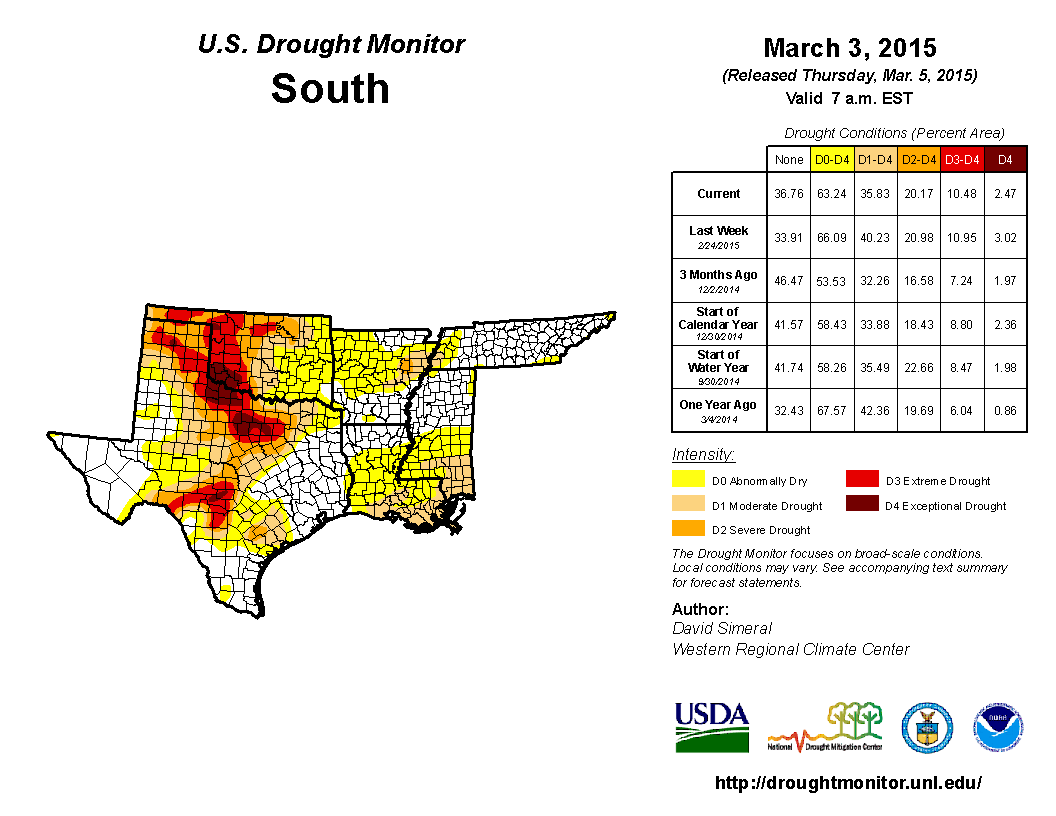
As explained by the Southern Regional Climate Center, February was a cold month for all six states in the Southern region and, with the exception of western Tennessee, the month was a drier than normal month. Conditions were especially dry throughout central Texas, where most stations received half (or less) of the normal precipitation for the month. Similar shortfalls were observed across central Louisiana, southwestern Oklahoma, and southern Mississippi. Elsewhere, precipitation totals ranged between 70 to 90 percent of normal, except for in western Tennessee, where most stations reported values that were near normal to slightly above normal. For Louisiana, it was their twenty-seventh driest February on record (1895-2015). All other state rankings fell within the two middle quartiles.
Drought conditions in the Southern region changed only slightly from the previous month. In southwestern Texas, below normal precipitation led to an introduction of extreme drought. Similarly, persistent dryness in southern Louisiana and southern Mississippi has resulted in an area of moderate drought along the north central Gulf of Mexico coast. Above normal precipitation in western Tennessee has alleviated drought conditions there, however, much of the area is still considered abnormally dry. Elsewhere, conditions have not changed much, with a bulk of the counties in northwestern Texas and western Oklahoma still experiencing severe, extreme and exceptional drought. In Texas, winter wheat and pecans are doing well across the state. Dairy production has increased 2% from the summer months and the number of cattle have increased after hitting a 48-year record low in 2014. Cotton is expected to have a large reduction due to the cold weather, so many farmers have turned to growing sorghum instead. Soil moisture fared better in the South Plains than in the Panhandle where the soil moisture was short to adequate. The counties of Hale and Swisher now have adequate soil moisture after previously suffering from drought conditions. Ecologically, there were more snow geese found in the state than in previous years. Unseasonably warm temperatures for a portion of the month brought out sand bass and other fish for early season fishing. Statewide reservoirs rose nearly a full percent from the beginning of the month, going from 65.0% to 65.9%. In east Texas, most reservoirs are at or near capacity. In the panhandle, north Texas, and southcentral Texas, reservoir levels are running on the low side, which has prompted experts in Austin and Amarillo to deliberate further water conservation solutions (Information provided by the Texas Office of State Climatology).
As summarized by the Midwest Regional Climate Center, February 2015 had some of the coldest temperatures seen in decades, tying the year 1904 as the 7th coldest February on record (1895-2015) for the Midwestern region. February accumulated precipitation across the region remained 0.5 to 1.25 inches (1.3-3.2 cm) below normal except in southeast Kentucky, northern Missouri, most of Iowa, and small areas along Lake Superior and Lake of the Woods which were only 0.25 to 0.5 inch (0.6-1.3 cm) above average. This resulted in a majority of the Midwest region experiencing only 50-75 percent of normal accumulated precipitation, with the entire region experiencing its 28th driest February on record only observing 1.21 inches (3.1 cm), 0.51 inch (1.3 cm) below normal (70 percent of normal).
The region was drier than normal during the 2014-2015 winter season in terms of total accumulated precipitation, with portions of Kentucky and southwest Missouri being 3.0 to 5.0 inches (7.6 to 12.7 cm) below normal. Ohio, Indiana, Illinois, remainder of Missouri, Michigan, eastern Iowa and Minnesota, along with much of Wisconsin were all 1.0 to 3.0 inches (2.5 to 7.6 cm) below normal. The Midwest region observed precipitation during winter 2014-2015 was 4.2 inches (10.7 cm), 1.5 inches (3.8 cm) below normal and the 15th driest winter on record for the Midwest.
D0 drought conditions remained in place across much of Kentucky, primarily west of the Appalachian Mountains. Minnesota remained in D0 drought for the entire month, as little precipitation fell across the state. At the beginning of winter, much of Minnesota and far northwest Iowa were classified as Abnormally Dry on the USDM and remained classified as such through the season. Entering mid-December, western Kentucky and far southeast Missouri joined the ranks of Abnormally Dry. Conditions remained stationary till mid-January when growth of the water shortage in Kentucky spread eastward and reached Moderate Drought status in the far southwest. By January 27, 2015 the lack of precipitation across the region resulted in additional growth of drought conditions: all of Minnesota had been classified as Abnormally Dry with small isolated regions of Moderate Drought, followed by a dry region across southeast Iowa, northern Missouri, northwest Illinois, and southern Wisconsin. Abnormally Dry and Moderate Drought in Kentucky was noted across the state west of the Appalachian Mountains. Following the January 31-February 2, 2015 winter storm across the central Midwest, drought status was removed across Missouri, Iowa, and northwest Illinois. Southern Wisconsin remained in drought status having received little snow from the event. Much of Kentucky reached Moderate drought conditions by February 17th but received relief from additional winter storms so that by March, drought status for the state had been downgraded to Abnormally dry along the northern counties near the Ohio River west of the Indiana and Ohio state line.
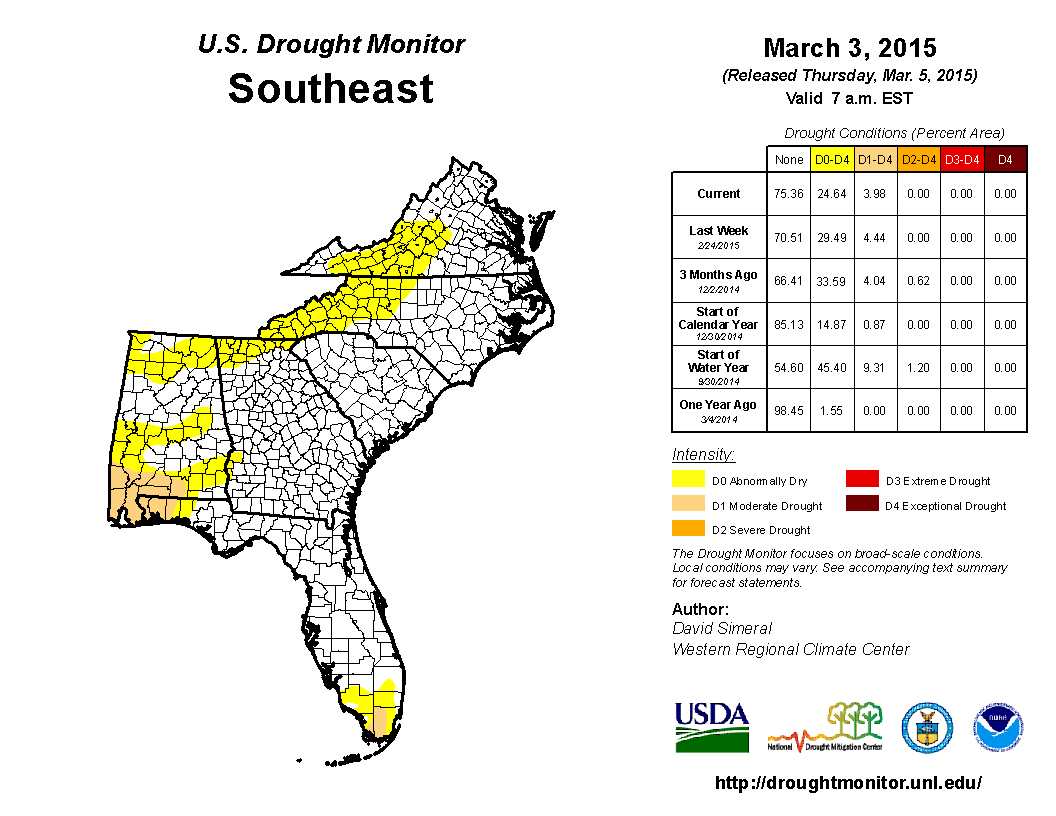
As noted by the Southeast Regional Climate Center, precipitation was slightly below normal but highly variable across the Southeast during February. The driest locations were found across northern Virginia, western North Carolina, southern Alabama, and the western tip of the Florida Panhandle. Monthly precipitation totals were 2 to 4 inches (50.8 to 101.6 mm) below normal, or about 50 to 25 percent of normal, in these areas. Precipitation was slightly above normal for much of Puerto Rico and the U.S. Virgin Islands. Mean temperatures in February were well below average across much of the region.
A modest change in drought conditions was noted for the Southeast during February. The percentage of the region under drought-free conditions (less than D1) decreased slightly from 99 percent on the 3rd to 96 percent on the 24th. Moderate (D1) drought expanded northward and eastward from the Mobile Bay area of coastal Alabama during the month, covering the entire southwestern portion of the state as well as the western tip of the Florida Panhandle. Approximately 17 percent of Alabama was under moderate drought conditions by the end of February, which is a significant increase from only 2 percent coverage at the beginning of the month. In addition, a small area of moderate drought developed in the Everglades region of southern Florida. Numerous freeze events during the latter half of the month damaged about 10 to 30 percent of the blueberry crop across portions of southern Georgia.
As explained by the Northeast Regional Climate Center, February ended on the dry side of normal in the Northeast. The region saw 1.92 inches (48.77 mm) of precipitation, 70 percent of normal, which made it the 12th driest February on record. All states were drier than normal, with three states ranking the month among their top 20 driest: Connecticut, 11th driest; Pennsylvania, 13th driest; and Maine, 16th driest. Departures ranged from 56 percent of normal in Massachusetts to 83 percent of normal in West Virginia. Winter also ended on the dry side of normal, but barely. The region saw 8.87 inches (225.30 mm) of precipitation, 96 percent of normal. Six states were wetter than normal, while five states were drier than normal and one state was at normal. Departures for all states ranged from 79 percent of normal in Pennsylvania to 118 percent of normal in Maine. Despite the Northeast generally being drier than normal during February and winter, snowfall was above normal in most areas. According to the USDM, 17 to 18 percent of the region was experiencing abnormally dry conditions throughout the month. February was an extraordinarily cold month in the Northeast. The region's average temperature of 13.5 degrees F (-10.3 degrees C) was 12.7 degrees F (7.1 degrees C) below normal. This made it the 2nd coldest February on record behind 1934, which had an average temperature of 12.0 degrees F (-11.1 degrees C).
As summarized by the Western Regional Climate Center, strong and persistent high pressure anchored over the West this month resulted in a large number of record temperatures in the Sierra Nevada, Great Basin, and Central Rockies. February was the 3rd consecutive month of widespread above normal temperatures in the West, and the 15th consecutive month for the state of California. Precipitation varied widely, having no recognizable pattern across the West, with record February totals in areas of the central and southern Rockies and drier than normal conditions in central and southern California as well as large areas of the Great Basin.
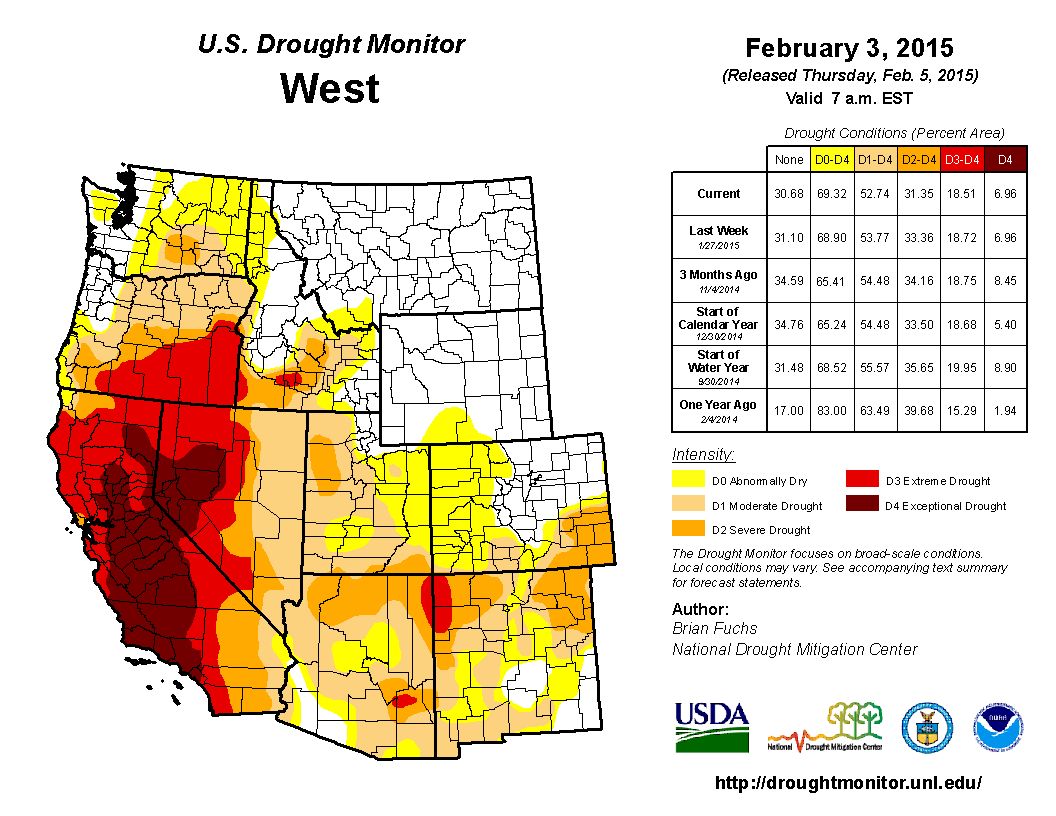
Following a warm and dry start to the month, the second half of February brought cold and snowy conditions to the central and southern Rockies. A series of storms in early February brought beneficial precipitation to northern California and areas of the Pacific Northwest, helping to improve drought conditions in these areas. At the end of the month, severe to exceptional drought persisted in 67% of California, 48% of Nevada, and 34% of Oregon. At month's end, snowpack remained meager in the Cascades, with many locations less than 25% of normal snow water equivalent (SWE). The Sierra Nevada fared slightly better thanks to a cold storm at the end of the month and had SWE values 20-40% of normal. Throughout the Rockies, basin average SWE values ranged from roughly 80-110% of normal.
Warm conditions were observed across Western and Southcentral Alaska as well as the North Slope. In western Alaska, Kotzebue noted an average temperature of 10.2 F (-12.1 C) for the month, 11.1 F (6.2 C) above average and the 3rd warmest February since records began in 1897. Precipitation was highly variable across the state, though generally below normal in the Southcentral and Southeast regions and parts of the Interior. For the snow season to-date (since July 1), Anchorage has only received 20.5 in (52 cm), making this season the 2nd least snowy on record so far. Normal snowfall at Anchorage by the end of February is 60.3 in (153 cm). The famed Iditarod sled race was altered to accommodate the warmth and dryness. Further south, drier than normal conditions prevailed for much of Hawaii. Hilo and Honolulu recorded 55% and 43% of normal, respectively. Lihue, Kauai recorded its 5th driest February on record at 0.75 in (19 mm). At month's end, 50% of the state was experiencing moderate drought.
Pacific Islands: According to reports from National Weather Service offices, the Pacific ENSO Applications Climate Center (PEAC), and partners, conditions varied across the Pacific Islands.
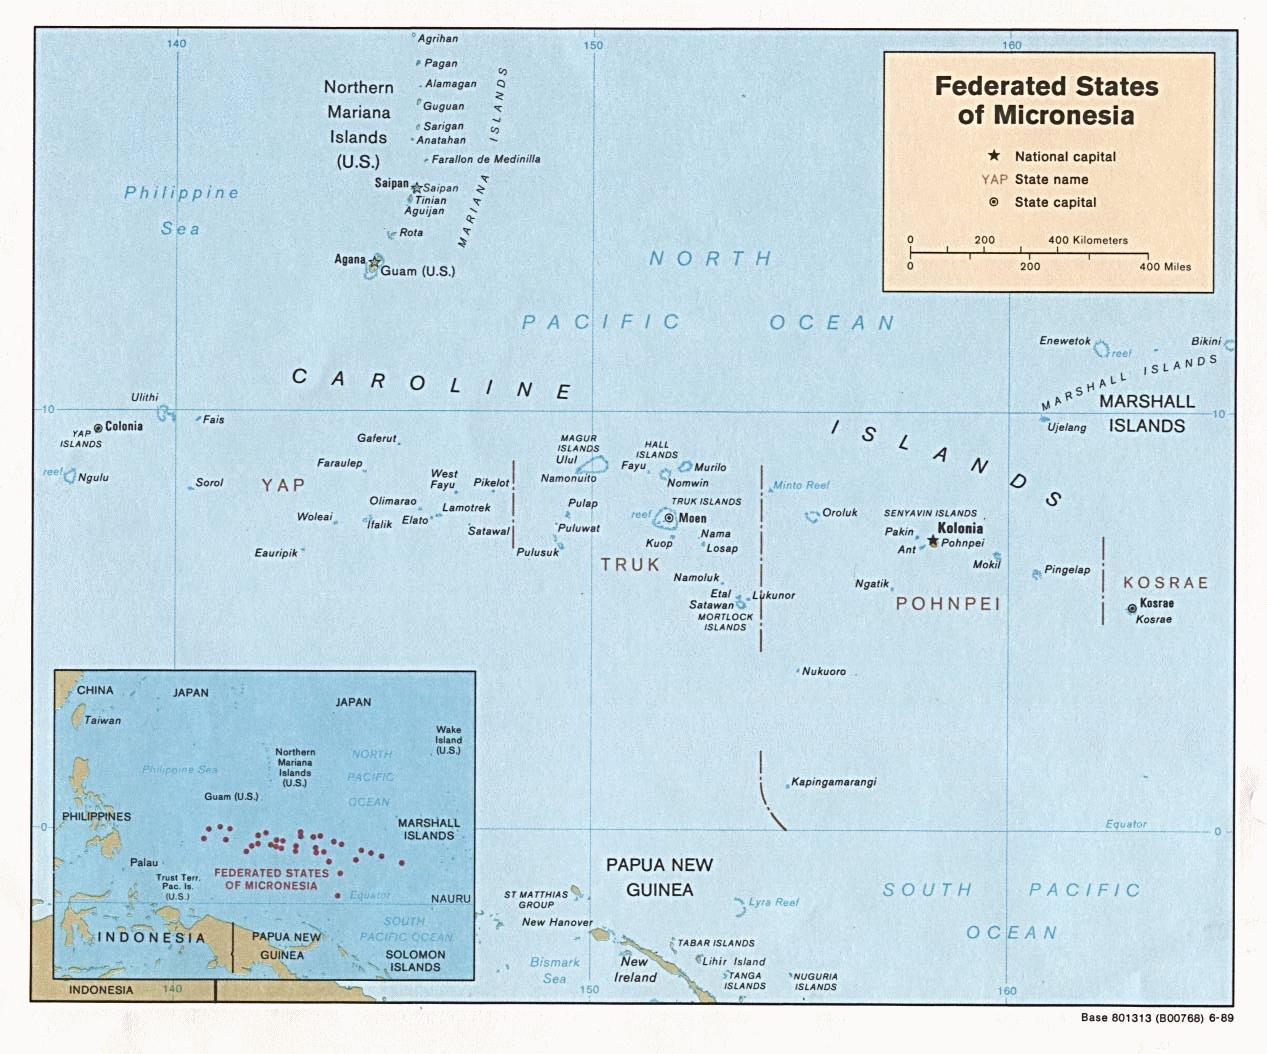
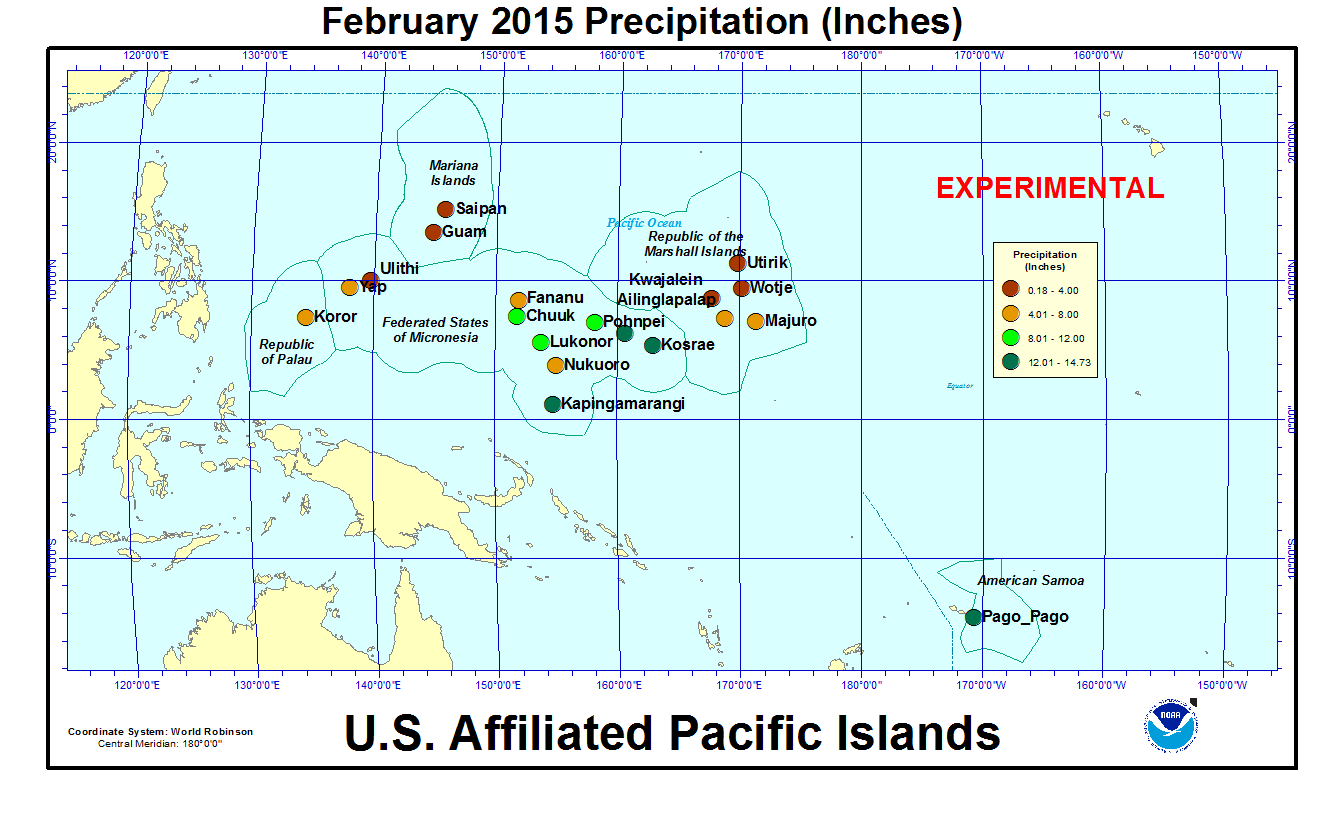
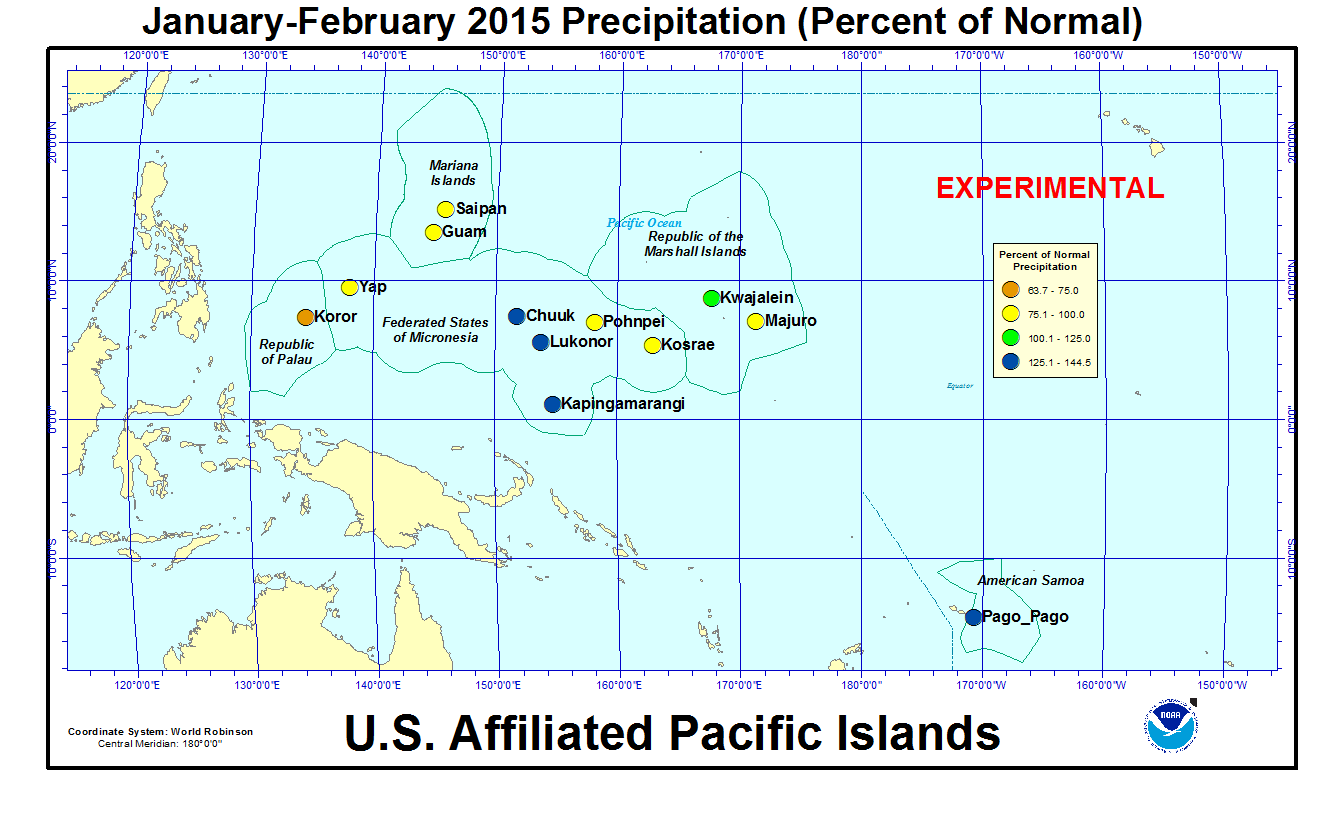
In the U.S. Affiliated Pacific Islands (maps — Micronesia, Marshall Islands, basinwide), February 2015 was drier than normal at half of the primary stations and wetter than normal at the other half. Guam, Saipan, Koror, Yap, Lukonor, and Majuro were drier than normal, while Chuuk, Kapingamarangi, Pohnpei, Kosrae, Kwajalein, and Pago Pago were wetter than normal. February is in the wet season for Pago Pago and in the dry season for the other wetter-than-normal stations.
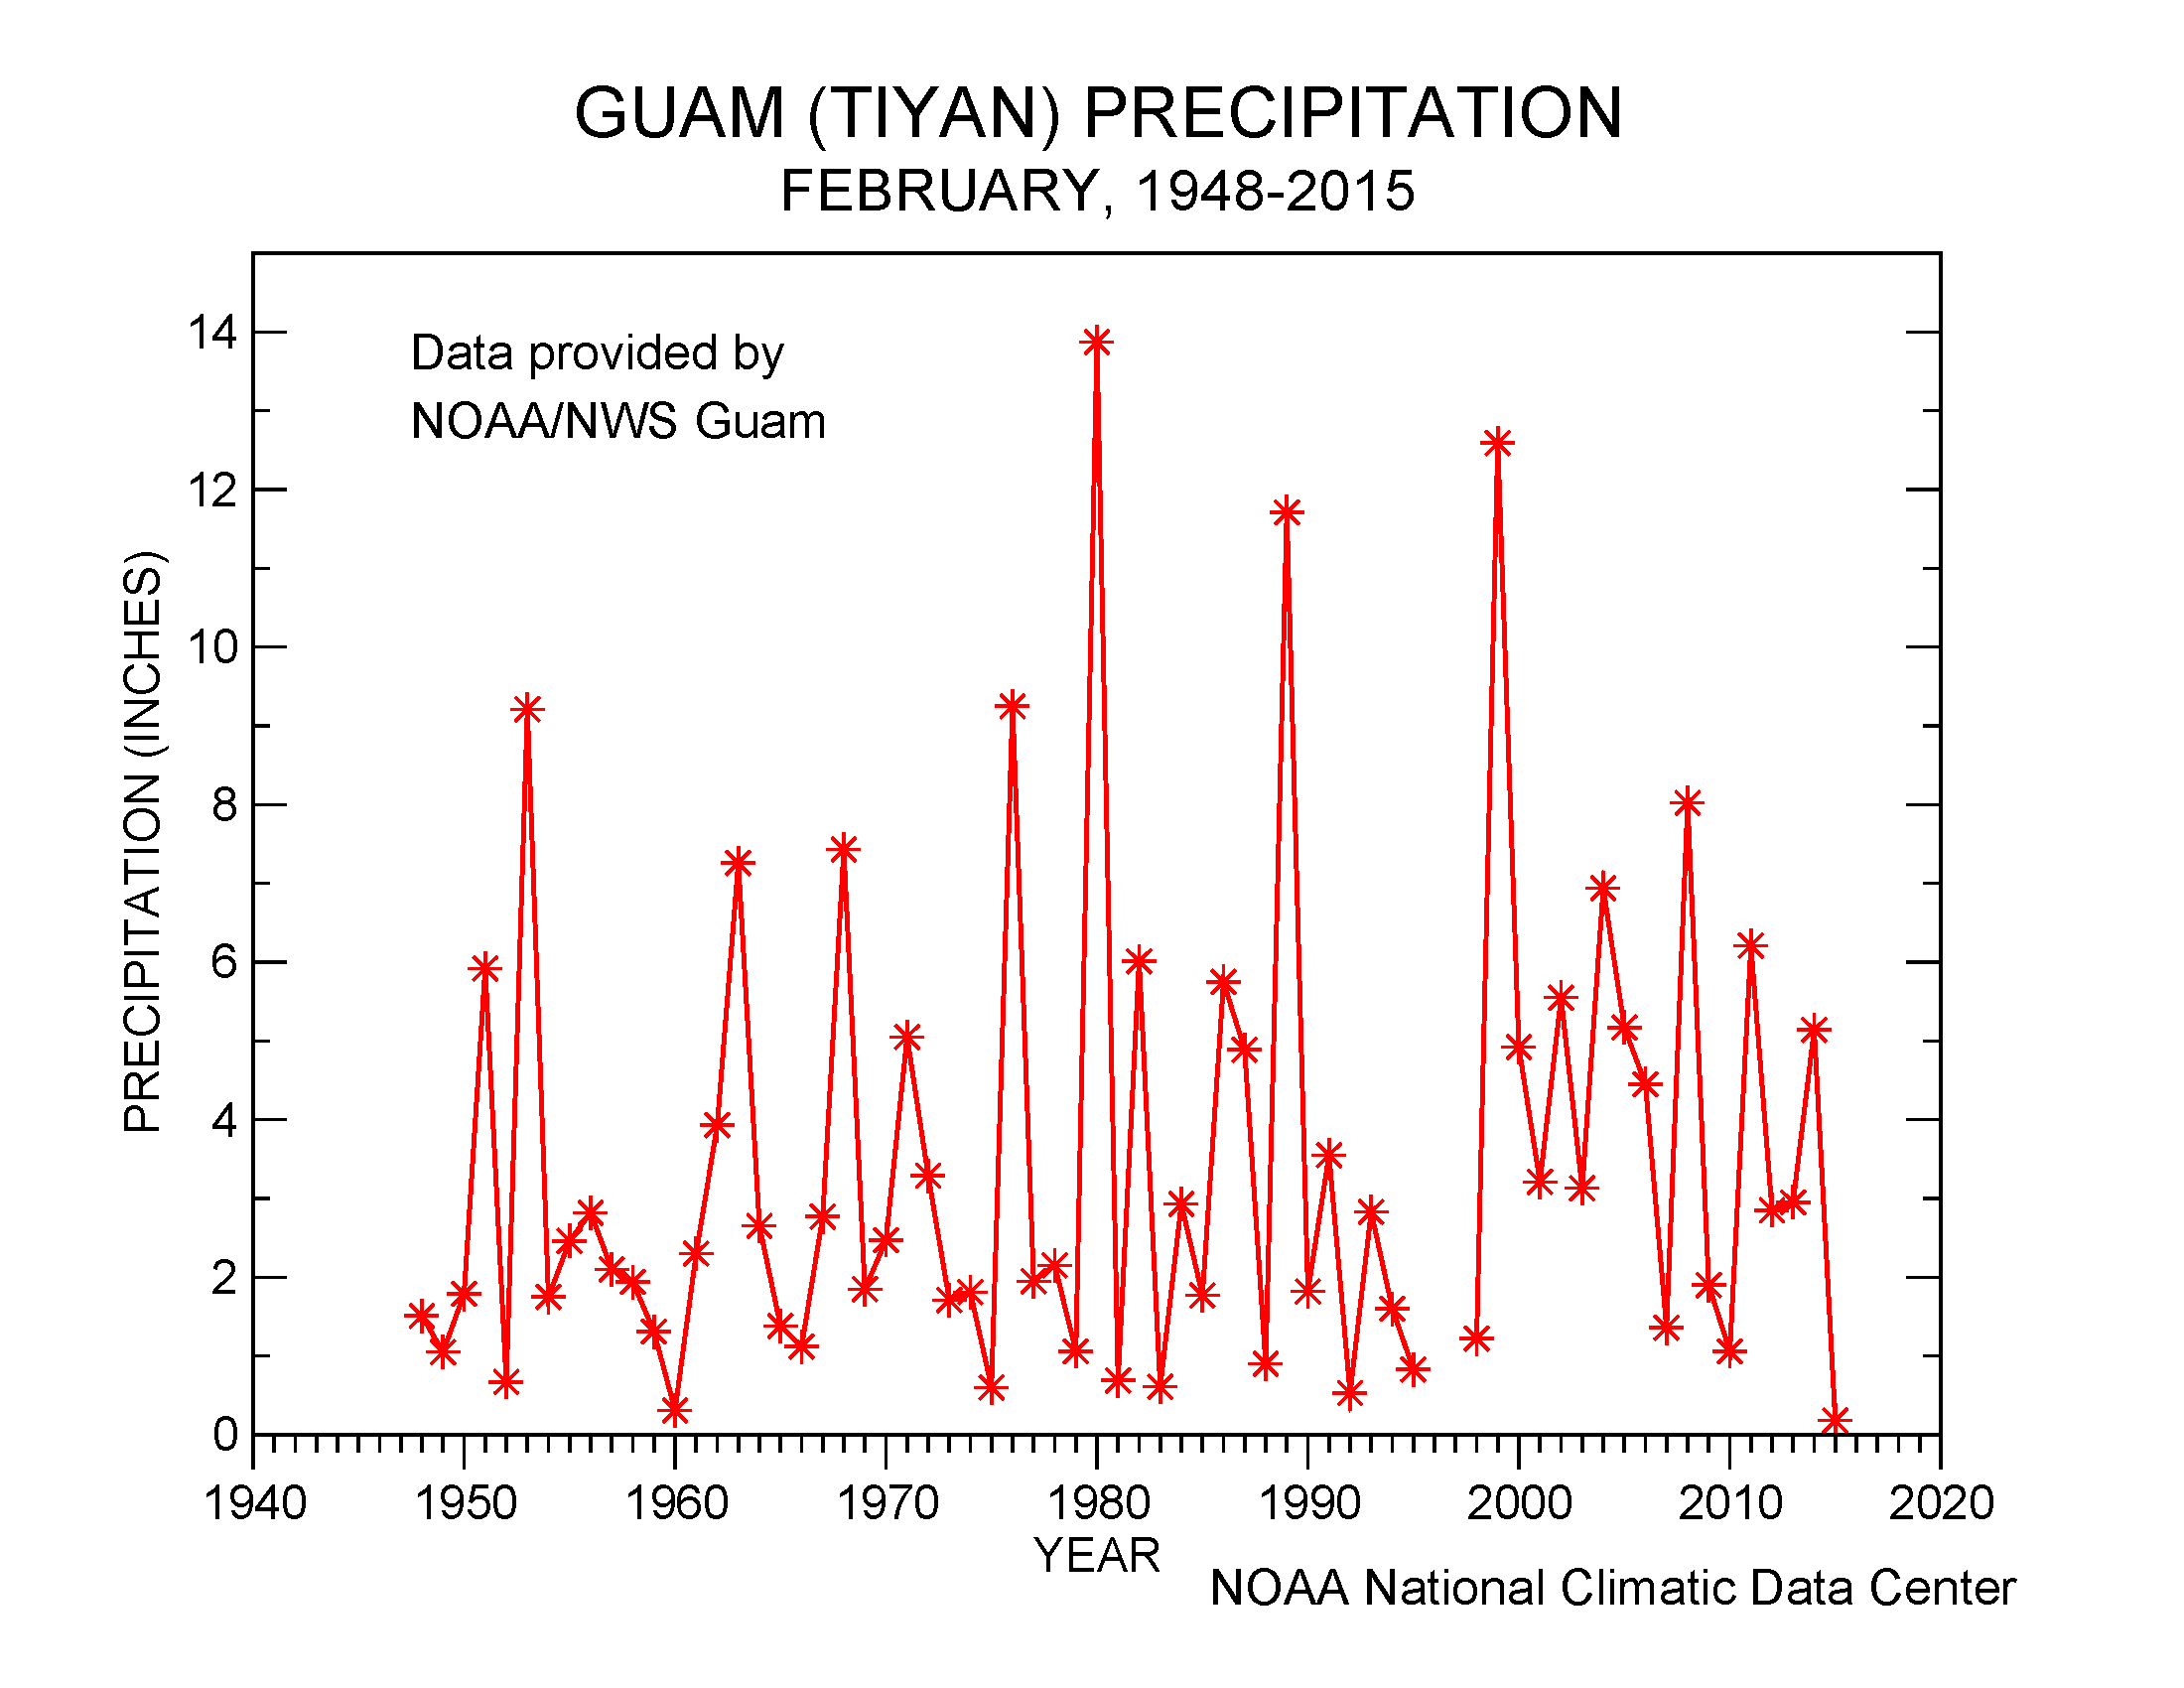
The rainfall amounts at most of the reporting stations were below the minimum thresholds (4 or 8 inches) required to meet most monthly water needs, so February 2015 could be considered to have been a mostly dry month. The 4- and 8-inch thresholds are important because, if monthly precipitation falls below the threshold, then drought becomes a concern. The Mariana Islands have been especially dry, with Guam reporting only 0.18 inch of precipitation — the driest February on record — and Saipan only 0.35 inch. Two of the last three months have been very dry at Guam and Saipan. Kwajalein (with 3.94 inches) was below the 4-inch threshold, with February marking the third consecutive month below the 8-inch threshold. Majuro (with 4.32 inches) was below the 8-inch threshold in February. Koror (with 7.07 inches) and Yap (4.60 inches) were below the 8-inch threshold for the second consecutive month. Chuyuk, Pohnpei, Kosrae, Pago Pago, Luchonoch, and Kapingamarangi were above the 8-inch threshold. Other stations in Micronesia that reported precipitation totals for February include Fananu (7.39 inches), Nukuoro (6.84 inches), Ulithi (3.72 inches), Ailinglapalap (4.17 inches), Utirik (0.59 inch), and Wotje (0.93 inch), which were all below the 8-inch threshold. The northern Marshall Islands have been especially dry, with Utirik and Wotje receiving less than 4 inches of rain for each of the last three months and less than 8 inches for each of the last five months. Pingelap was wet with 14.13 inches of rain in February.
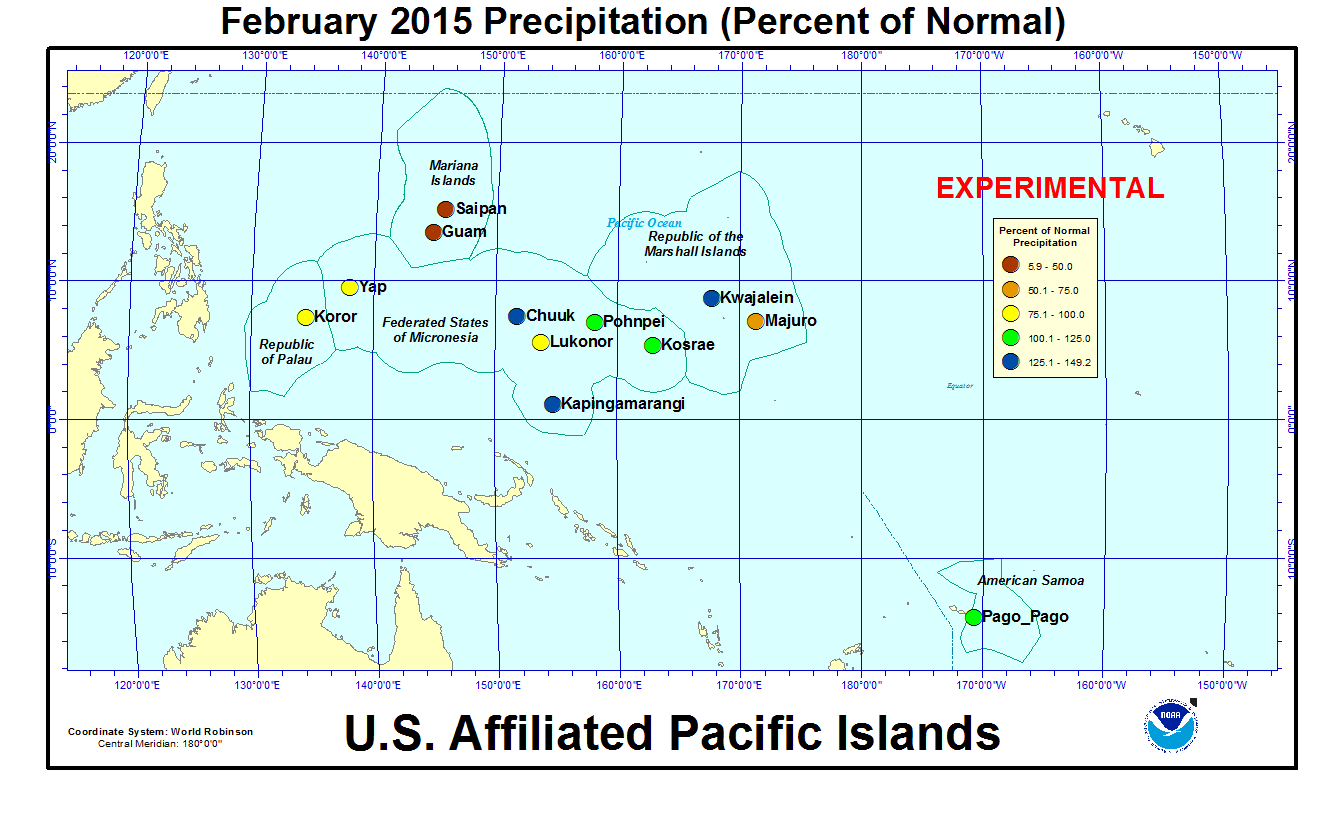
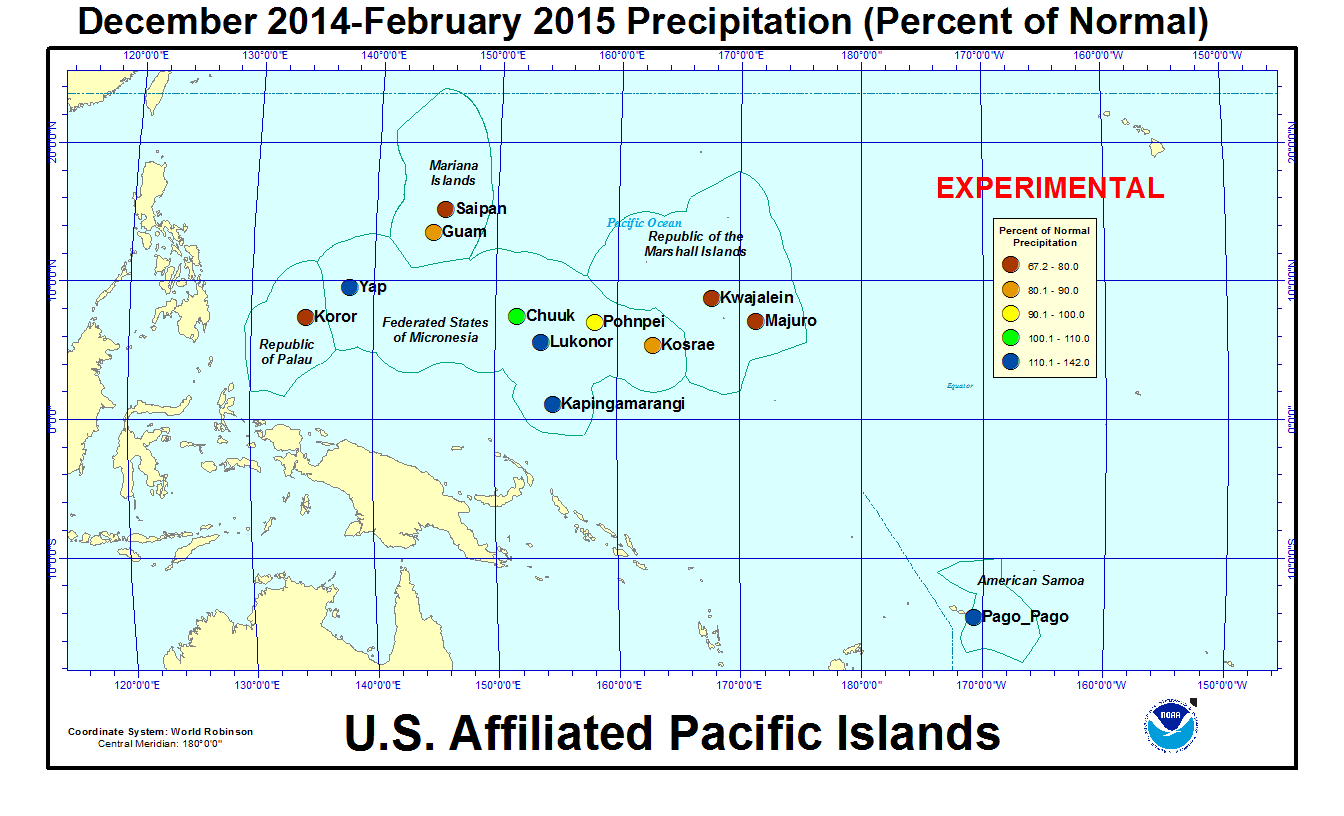
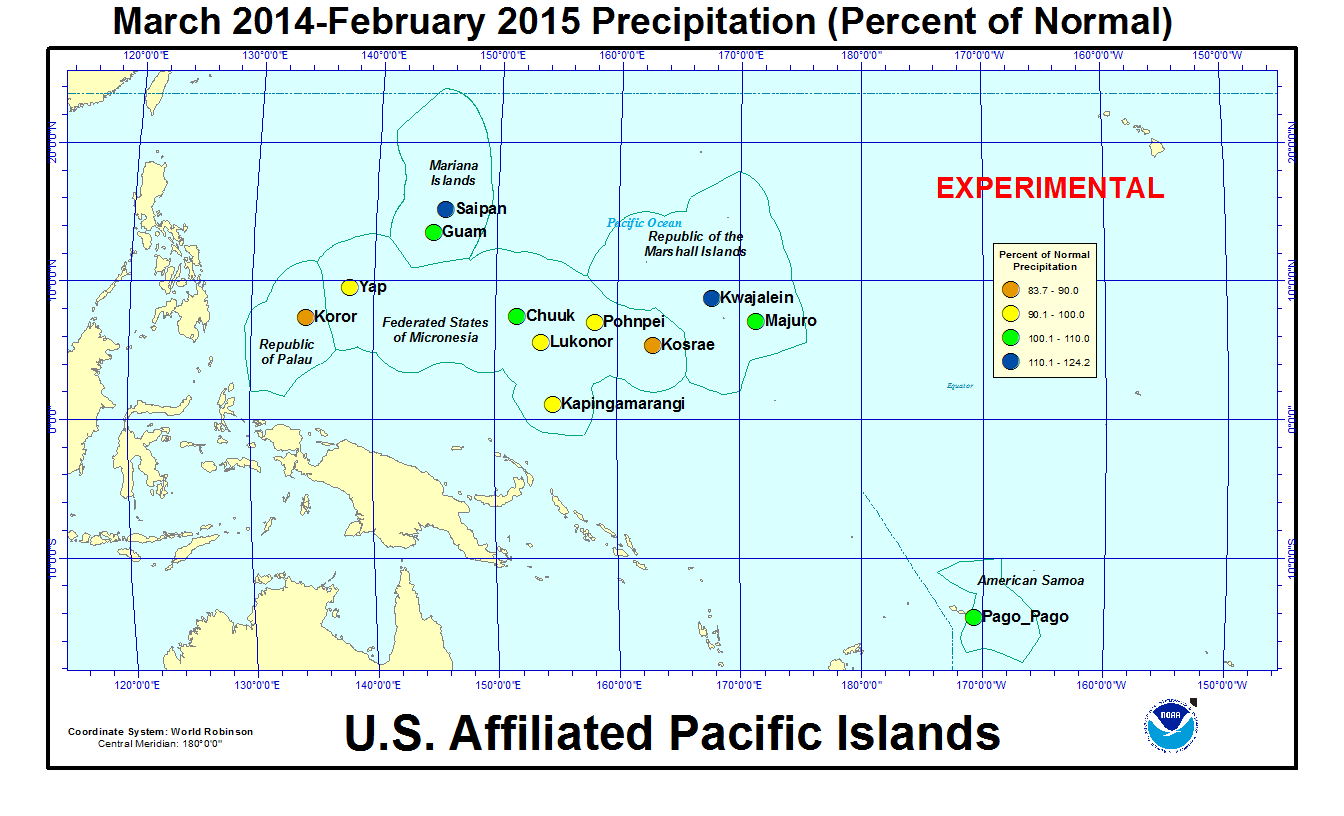
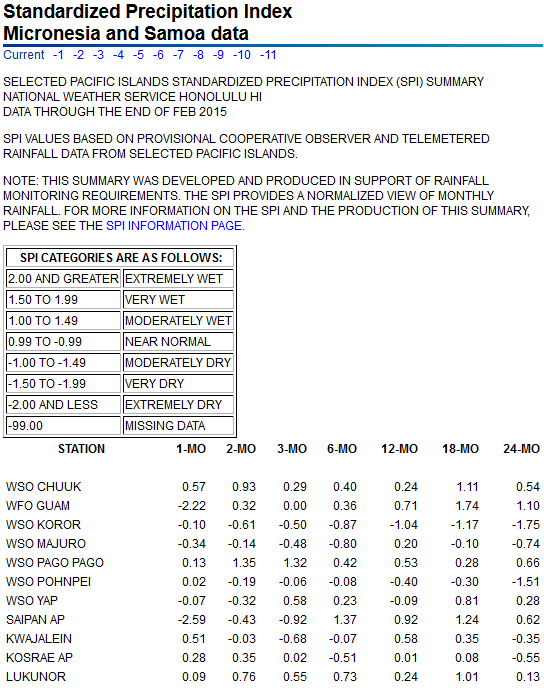
As measured by percent of normal precipitation, Koror was drier than normal in both the short term (February, year to date [January-February 2015], and three-month time scale [December 2014-February 2015]) and long term (12-month time scale, March 2014-February 2015). Pohnpei and Kosrae were wetter than normal in February but mostly drier than normal. Guam, Saipan and Majuro were dry in the short term but wet in the long term. Kapingamarangi was wet in the short term but dry in the long term. Chuuk and Pago Pago were wetter than normal at both the short- and long-term time scales. The precipitation pattern for the other stations varied.
| Station Name | Mar 2014 | Apr 2014 | May 2014 | Jun 2014 | Jul 2014 | Aug 2014 | Sep 2014 | Oct 2014 | Nov 2014 | Dec 2014 | Jan 2015 | Feb 2015 | Mar- Feb |
|---|---|---|---|---|---|---|---|---|---|---|---|---|---|
| Chuuk | 89% | 111% | 116% | 76% | 125% | 121% | 166% | 120% | 66% | 57% | 142% | 134% | 106% |
| Guam NAS | 141% | 108% | 99% | 98% | 290% | 62% | 108% | 164% | 75% | 76% | 213% | 6% | 105% |
| Kapingamarangi | 81% | 43% | 83% | 56% | 86% | 96% | 109% | 130% | 140% | 116% | 229% | 131% | 90% |
| Koror | 68% | 224% | 63% | 57% | 121% | 77% | 137% | 63% | 54% | 118% | 64% | 83% | 84% |
| Kosrae | 82% | 150% | 93% | 117% | 175% | 59% | 77% | 114% | 68% | 86% | 116% | 114% | 88% |
| Kwajalein | 475% | 366% | 80% | 104% | 120% | 58% | 88% | 154% | 96% | 68% | 74% | 149% | 120% |
| Lukonor | 138% | 72% | 116% | 110% | 78% | 77% | 146% | 138% | 70% | 86% | 228% | 97% | 96% |
| Majuro | 91% | 246% | 75% | 90% | 201% | 82% | 134% | 88% | 66% | 67% | 106% | 63% | 107% |
| Pago Pago | 65% | 152% | 81% | 154% | 333% | 60% | 40% | 29% | 136% | 141% | 201% | 102% | 108% |
| Pohnpei | 112% | 87% | 87% | 121% | 108% | 74% | 128% | 100% | 108% | 104% | 78% | 100% | 97% |
| Saipan | 167% | 168% | 205% | 92% | 113% | 71% | 191% | 105% | 265% | 47% | 184% | 14% | 124% |
| Yap | 153% | 226% | 39% | 83% | 110% | 65% | 125% | 77% | 84% | 197% | 92% | 89% | 100% |
| Station Name | Mar 2014 | Apr 2014 | May 2014 | Jun 2014 | Jul 2014 | Aug 2014 | Sep 2014 | Oct 2014 | Nov 2014 | Dec 2014 | Jan 2015 | Feb 2015 | Mar- Feb |
|---|---|---|---|---|---|---|---|---|---|---|---|---|---|
| Chuuk | 7.43" | 13.80" | 13.06" | 8.91" | 14.92" | 15.55" | 19.44" | 13.78" | 6.99" | 6.46" | 14.32" | 9.68" | 144.34" |
| Guam NAS | 2.91" | 2.74" | 3.36" | 6.08" | 29.39" | 9.08" | 13.66" | 18.77" | 5.51" | 3.87" | 8.56" | 0.18" | 104.11" |
| Kapingamarangi | 9.26" | 5.83" | 9.97" | 7.77" | 12.16" | 7.84" | 10.86" | 10.64" | 13.02" | 11.37" | 20.91" | 12.19" | 131.82" |
| Koror | 5.08" | 16.38" | 7.45" | 9.91" | 22.45" | 10.40" | 16.10" | 7.45" | 6.12" | 13.14" | 6.48" | 7.07" | 128.03" |
| Kosrae | 13.12" | 26.29" | 16.59" | 17.08" | 26.06" | 8.32" | 11.00" | 12.51" | 9.38" | 13.80" | 19.28" | 14.73" | 188.16" |
| Kwajalein | 11.17" | 19.24" | 5.36" | 7.22" | 11.88" | 5.61" | 9.49" | 17.17" | 10.80" | 4.54" | 2.33" | 3.94" | 108.75" |
| Lukonor | 12.76" | 8.18" | 13.58" | 12.85" | 12.50" | 10.80" | 14.79" | 15.57" | 6.37" | 9.65" | 19.16" | 8.70" | 144.91" |
| Majuro | 5.96" | 23.20" | 7.58" | 9.86" | 22.49" | 9.64" | 14.93" | 11.14" | 8.85" | 7.68" | 8.24" | 4.32" | 133.89" |
| Pago Pago | 6.95" | 14.29" | 7.84" | 8.22" | 18.48" | 3.22" | 2.60" | 2.68" | 13.76" | 18.13" | 26.87" | 12.22" | 135.26" |
| Pohnpei | 14.70" | 15.96" | 17.33" | 17.95" | 16.74" | 10.52" | 16.06" | 15.32" | 15.97" | 16.67" | 10.24" | 9.58" | 177.04" |
| Saipan | 3.16" | 4.41" | 4.87" | 3.32" | 10.04" | 9.33" | 19.31" | 11.15" | 14.87" | 1.80" | 4.66" | 0.35" | 87.27" |
| Yap | 6.99" | 12.72" | 3.07" | 9.95" | 16.62" | 9.58" | 16.89" | 9.34" | 7.40" | 16.77" | 5.86" | 4.60" | 119.79" |
| Station Name | Mar 2014 | Apr 2014 | May 2014 | Jun 2014 | Jul 2014 | Aug 2014 | Sep 2014 | Oct 2014 | Nov 2014 | Dec 2014 | Jan 2015 | Feb 2015 | Mar- Feb |
|---|---|---|---|---|---|---|---|---|---|---|---|---|---|
| Chuuk | 8.32" | 12.47" | 11.30" | 11.66" | 11.98" | 12.86" | 11.71" | 11.51" | 10.61" | 11.25" | 10.10" | 7.25" | 136.77" |
| Guam NAS | 2.07" | 2.53" | 3.40" | 6.18" | 10.14" | 14.74" | 12.66" | 11.44" | 7.38" | 5.11" | 4.01" | 3.03" | 99.09" |
| Kapingamarangi | 11.43" | 13.64" | 12.08" | 13.78" | 14.15" | 8.13" | 9.93" | 8.19" | 9.27" | 9.84" | 9.15" | 9.27" | 145.85" |
| Koror | 7.44" | 7.32" | 11.83" | 17.48" | 18.53" | 13.50" | 11.77" | 11.84" | 11.39" | 11.16" | 10.18" | 8.56" | 152.90" |
| Kosrae | 16.06" | 17.51" | 17.75" | 14.64" | 14.91" | 14.22" | 14.22" | 10.94" | 13.83" | 16.11" | 16.67" | 12.93" | 213.87" |
| Kwajalein | 2.35" | 5.26" | 6.72" | 6.93" | 9.87" | 9.74" | 10.74" | 11.18" | 11.28" | 6.66" | 3.16" | 2.64" | 90.41" |
| Lukonor | 9.26" | 11.31" | 11.69" | 11.65" | 15.93" | 14.04" | 10.15" | 11.32" | 9.08" | 11.27" | 8.41" | 8.93" | 151.36" |
| Majuro | 6.58" | 9.42" | 10.11" | 11.01" | 11.17" | 11.69" | 11.17" | 12.73" | 13.44" | 11.39" | 7.74" | 6.88" | 125.25" |
| Pago Pago | 10.68" | 9.39" | 9.66" | 5.33" | 5.55" | 5.38" | 6.53" | 9.26" | 10.14" | 12.84" | 13.34" | 12.00" | 125.57" |
| Pohnpei | 13.17" | 18.41" | 19.96" | 14.81" | 15.43" | 14.26" | 12.55" | 15.27" | 14.83" | 16.08" | 13.18" | 9.55" | 182.36" |
| Saipan | 1.89" | 2.63" | 2.38" | 3.62" | 8.91" | 13.13" | 10.09" | 10.62" | 5.61" | 3.85" | 2.53" | 2.59" | 70.25" |
| Yap | 4.56" | 5.63" | 7.85" | 12.04" | 15.08" | 14.82" | 13.50" | 12.18" | 8.83" | 8.51" | 6.39" | 5.19" | 120.31" |
[top]
State/Regional/National Moisture Status
A detailed review of drought and moisture conditions is available for all contiguous U.S. states, the nine standard regions, and the nation (contiguous U.S.):
| northeast u. s. | east north central u. s. | central u. s. |
| southeast u. s. | west north central u. s. | south u. s. |
| southwest u. s. | northwest u. s. | west u. s. |
| Contiguous United States |
[top]
Contacts & Questions