Contents Of This Report:
|
|
Please note that the values presented in this report are based on preliminary data. They will change when the final data are processed, but will not be replaced on these pages.
National Drought Overview
|
|
[top]
Detailed Drought Discussion
Overview
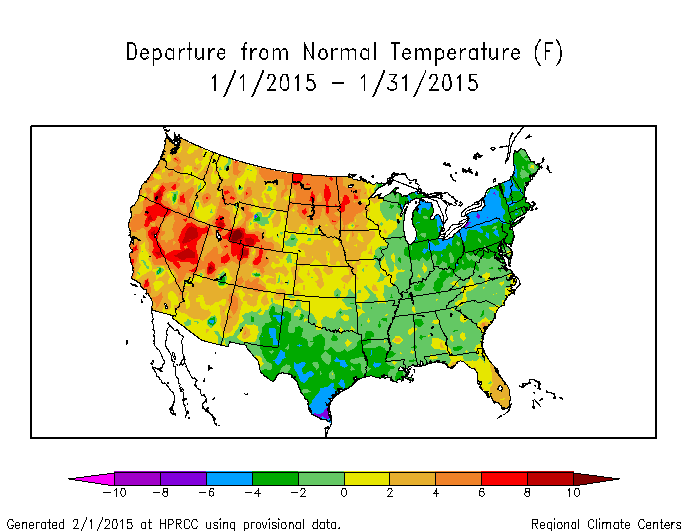
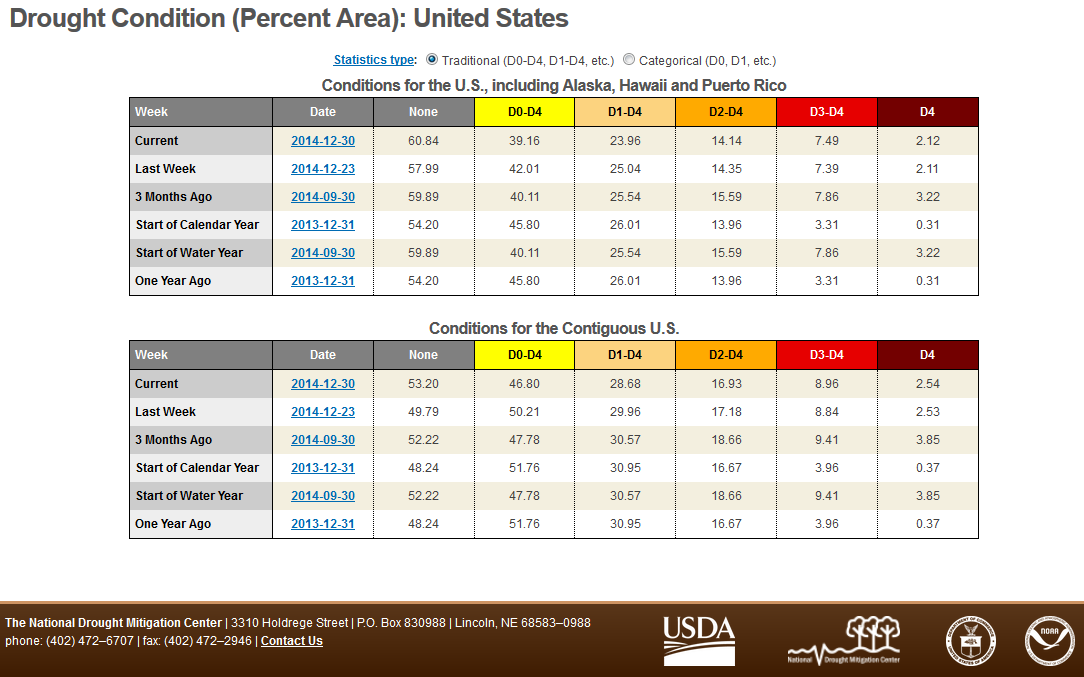
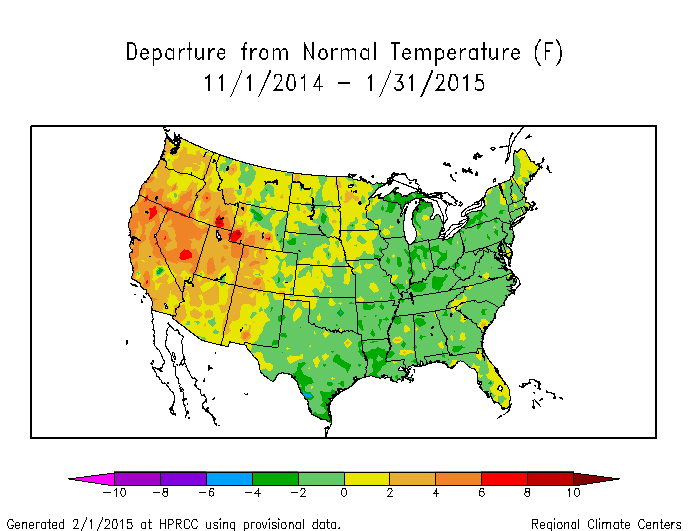
An active jet stream with a strong meridional flow over the CONUS dominated the weather pattern during most of January 2015. The circulation pattern consisted of an anomalously strong upper-level ridge over western North America and trough over the East. The ridge brought much warmer than normal temperatures to the western CONUS and deflected the storm track, resulting in drier-than-normal weather, with several states having the tenth warmest, or warmer and tenth driest, or drier January in the 1895-2015 record. The trough funneled cold, dry Arctic air masses into the central and eastern CONUS, especially during the first half of the month. The northerly flow in the upper-level circulation blocked Gulf of Mexico moisture and resulted in a drier-than-normal month for much of the Plains to Midwest. Drought conditions deteriorated across parts of the West, Plains, and Midwest. The circulation pattern shifted at mid-month, with the ridge/trough pattern being replaced by a more zonal/westerly flow. Vigorous weather systems moving in the circulation generated areas of above-normal precipitation in parts of the Southwest to Southern Plains, northern Rockies, and Mid-Atlantic to Northeast coast, improving drought conditions. January was drier than normal across much of Alaska and the Hawaiian Islands, with drought expanding to encompass almost half of Hawaii. When integrated across the CONUS, January 2015 ranked as the 18th driest January in the 1895-2015 record. On balance, the national drought footprint changed very little when compared to last month, decreasing slightly to about 23.9 percent of the U.S. as a whole, according to USDM statistics. According to the Palmer Drought Index, which goes back to the beginning of the 20th century, about 13.1 percent of the CONUS was in moderate to extreme drought at the end of January, an increase of about 2.6 percent compared to last month.
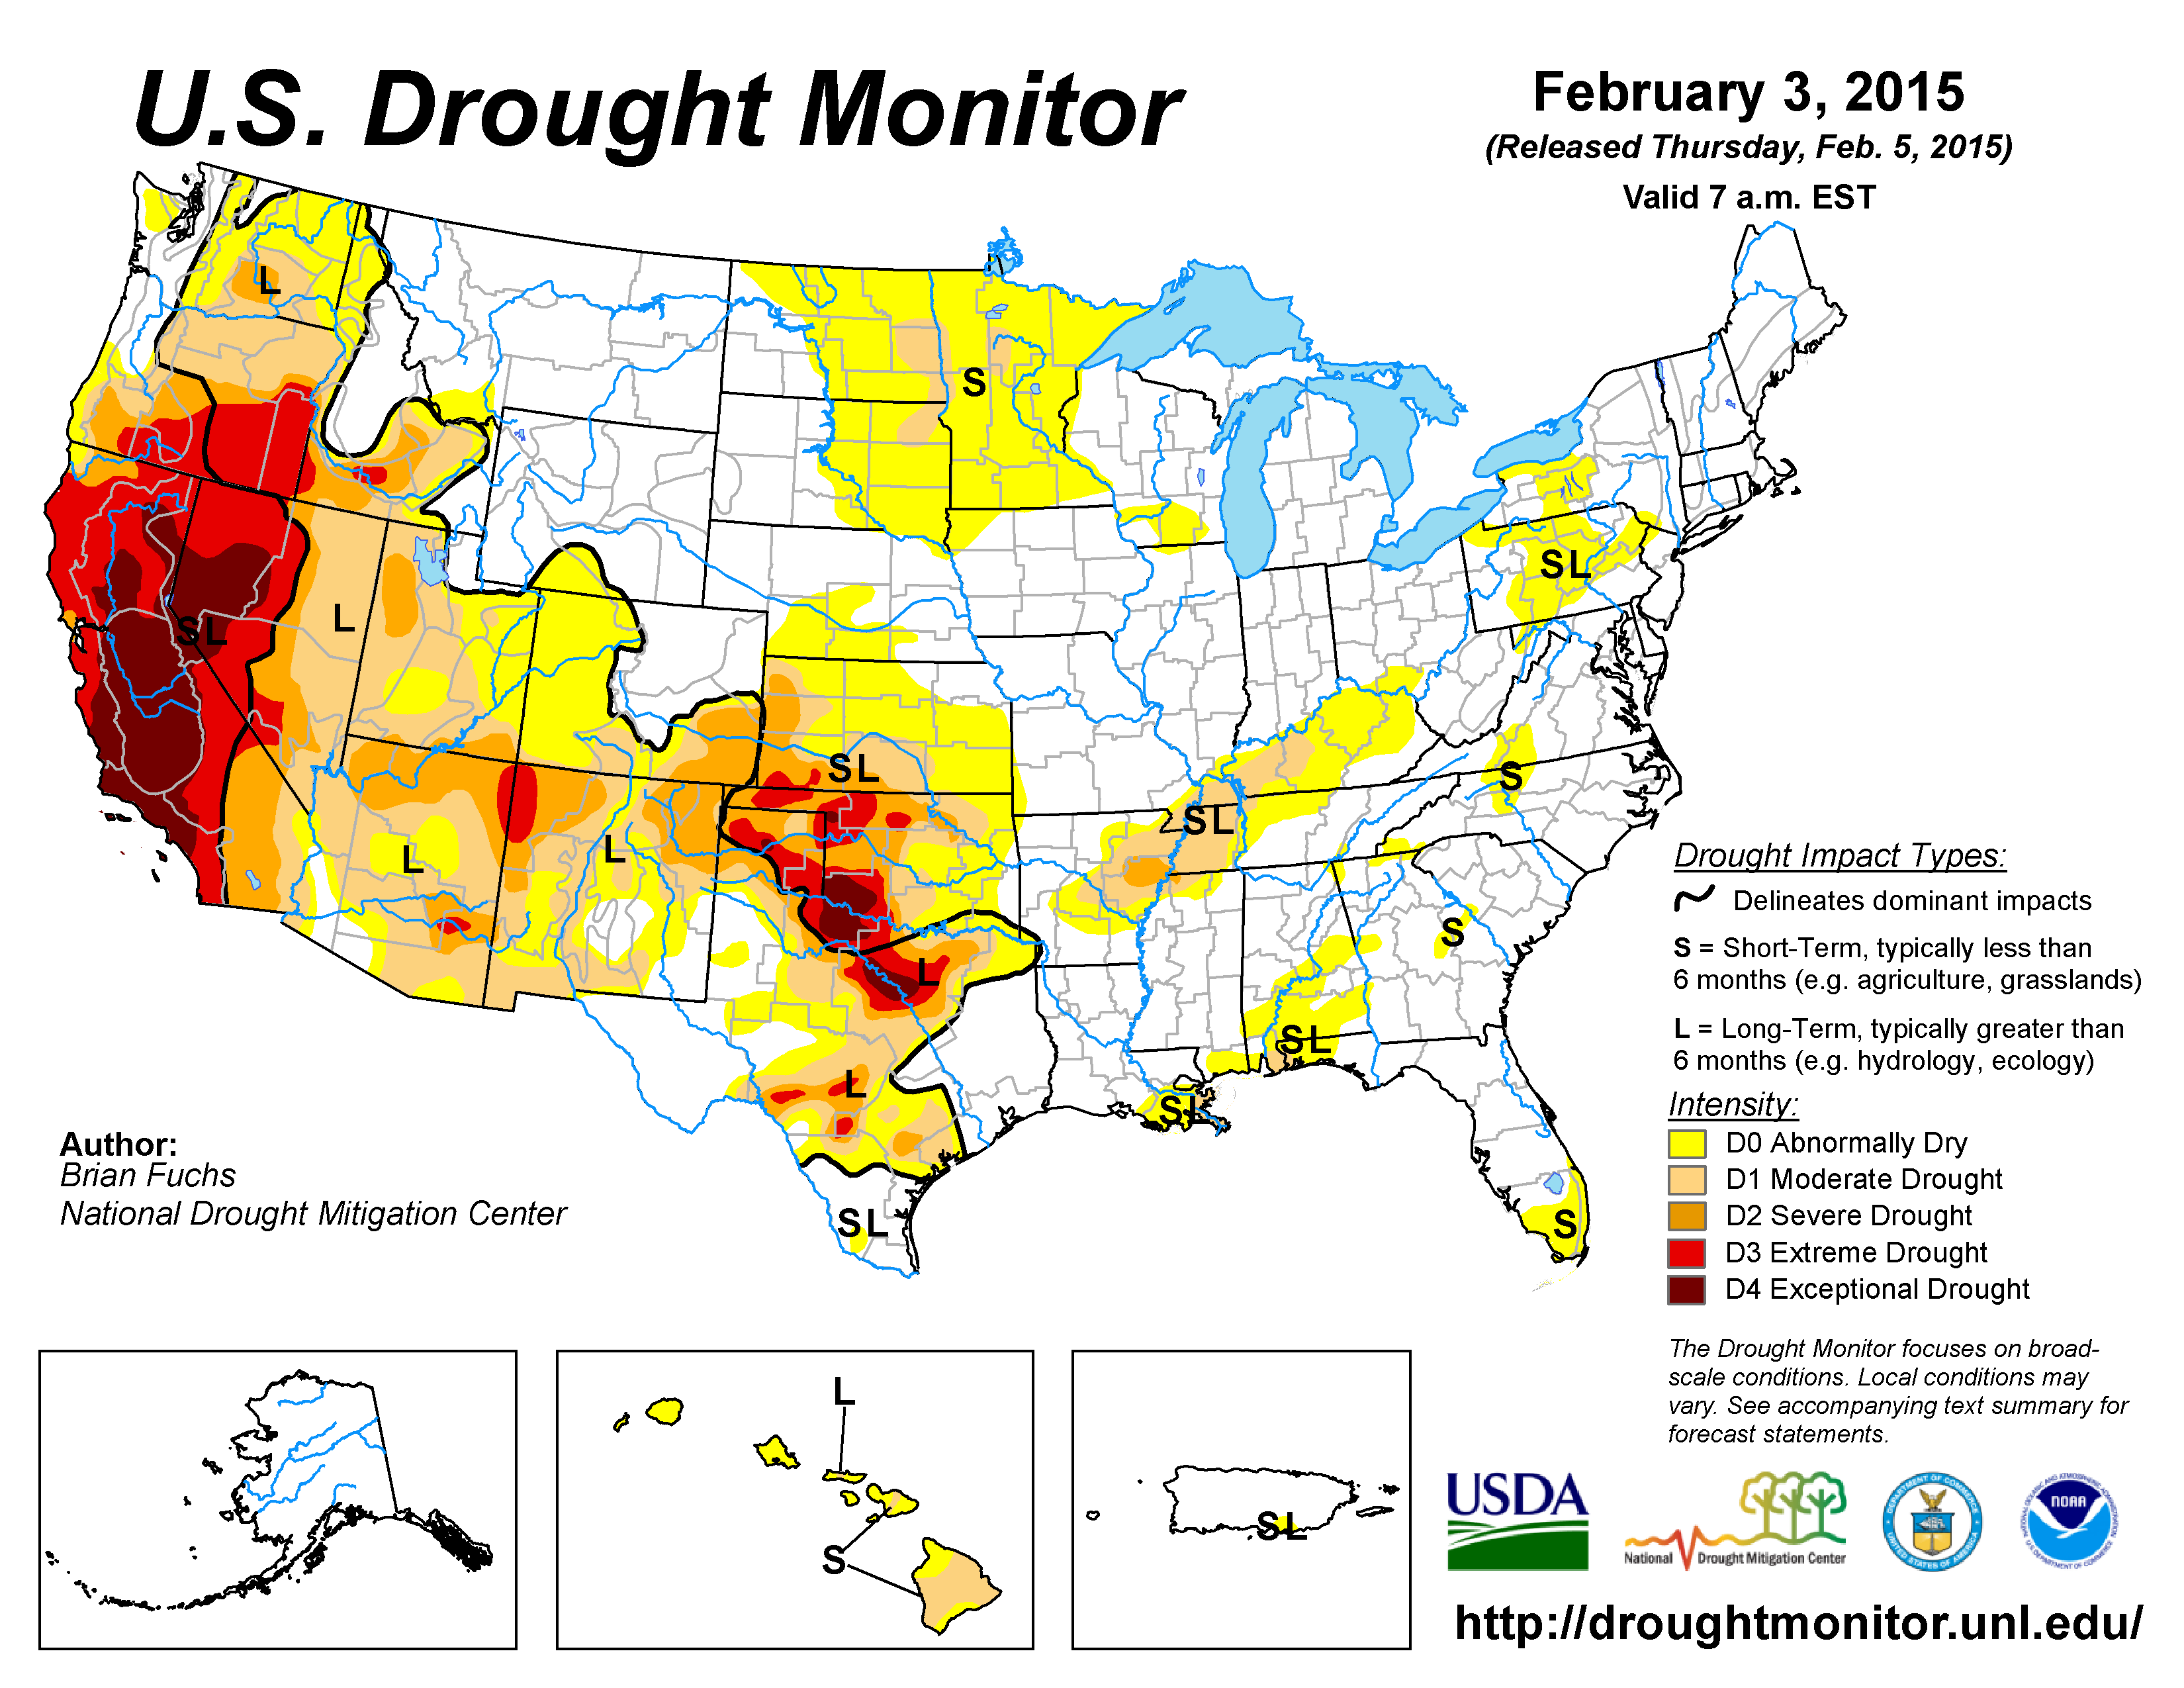
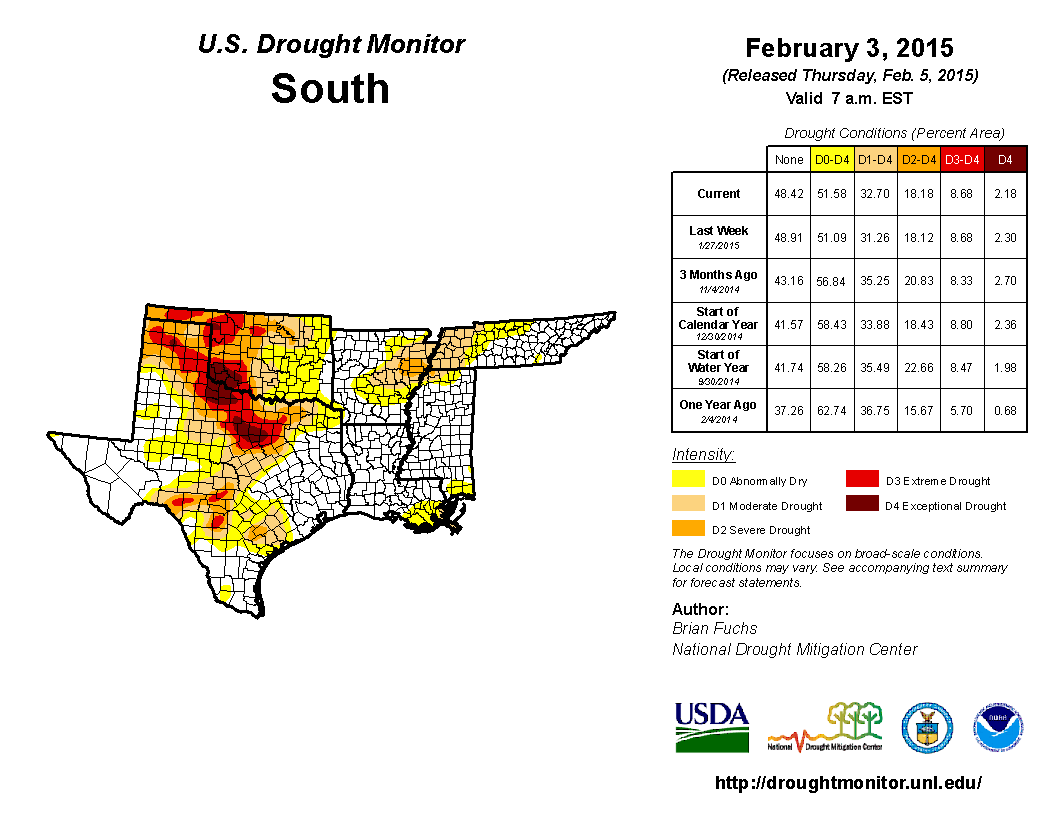
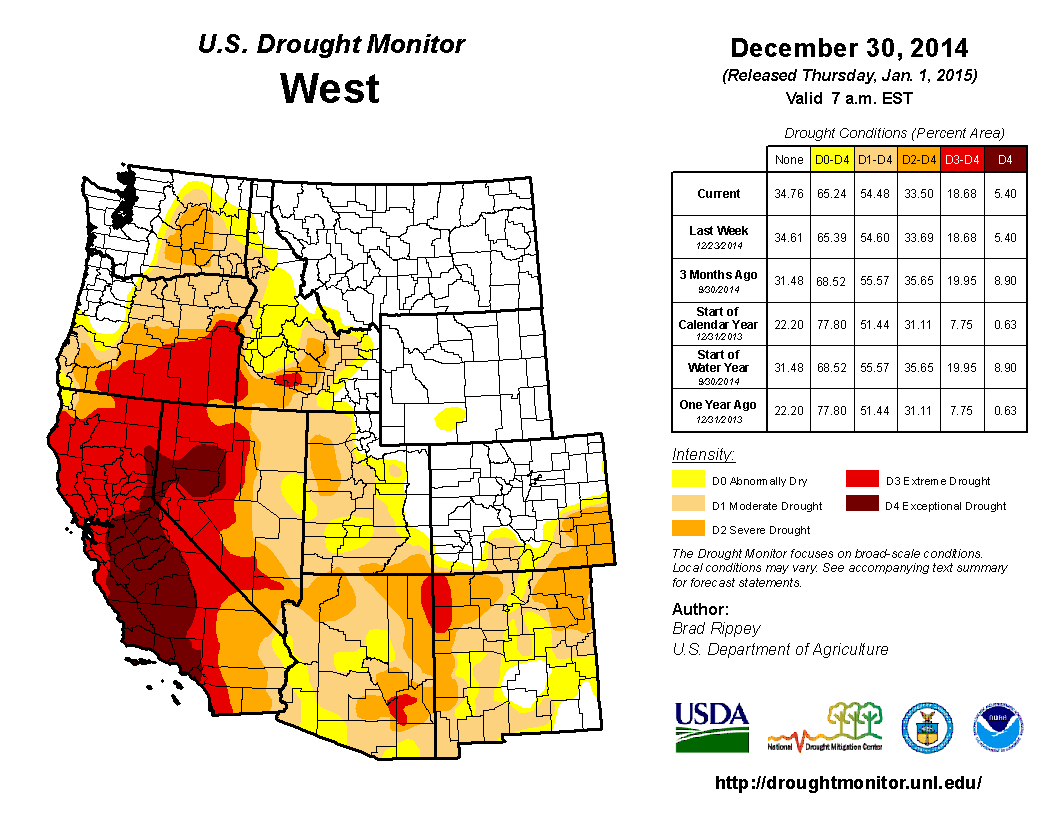
The U.S. Drought Monitor drought map valid February 3, 2015.
By the end of the month:
- moderate (D1) drought covered a large area of the U.S. from the West Coast to the Central and Southern Great Plains, connected across parts of New Mexico, with large areas of more intense drought within the moderate drought area;
- there were two epicenters of extreme (D3) to exceptional (D4) drought within this large moderate to severe (D2) drought area — one located in the California-Nevada-Oregon region and the other in the Southern Plains centered in northern Texas and adjacent Oklahoma; and
- areas of moderate drought persisted along parts of the Gulf of Mexico coast from Louisiana to Florida, in Hawaii, from Arkansas to Kentucky, and in the Northern Plains.
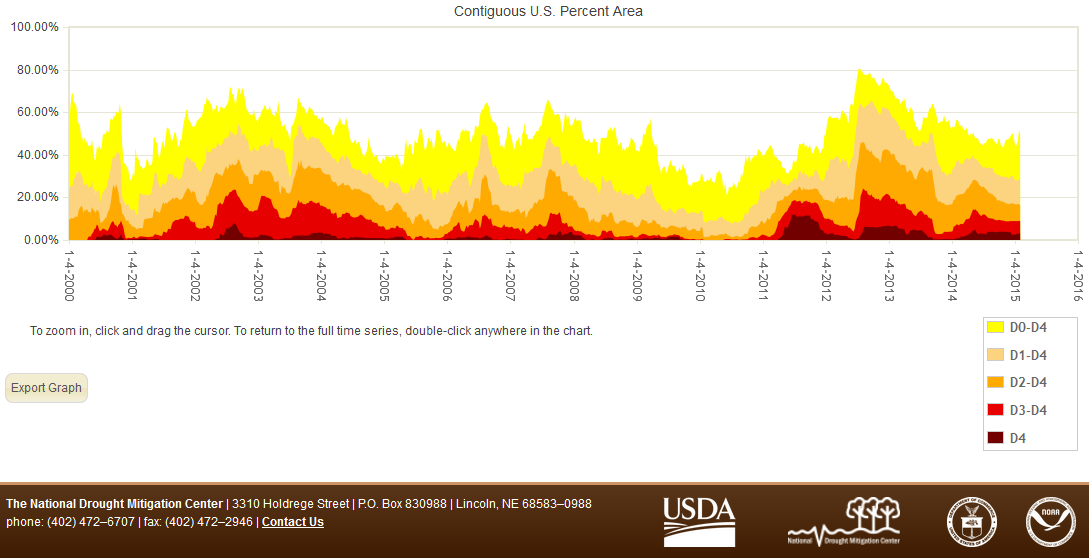
Percent area of the CONUS in moderate to exceptional drought, January 4, 2000 to present, based on the U.S. Drought Monitor.
Palmer Drought Index
The Palmer drought indices measure the balance between moisture demand (evapotranspiration driven by temperature) and moisture supply (precipitation). The Palmer Z Index depicts moisture conditions for the current month, while the Palmer Hydrological Drought Index (PHDI) and Palmer Drought Severity Index (PDSI) depict the current month's cumulative moisture conditions integrated over the last several months. While both the PDSI and PHDI indices show long-term moisture conditions, the PDSI depicts meteorological drought while the PHDI depicts hydrological drought. The PDSI map shows less severe and extensive drought in the West and parts of the Plains than the PHDI map because the meteorological conditions that produce drought are not as long-lasting as the hydrological impacts.
|
 |
Used together, the Palmer Z Index and PHDI maps show that short-term dry conditions occurred over parts of the West, which had areas in long-term drought during December, maintaining or intensifying drought by the end of January. Short-term dry conditions reduced the December long-term wet conditions over the Upper Midwest and in the Tennessee and Ohio Valleys and introduced long-term dry conditions, especially in northern Minnesota. Short-term wet conditions occurred over parts of the Southern Plains, reducing areas of long-term drought.
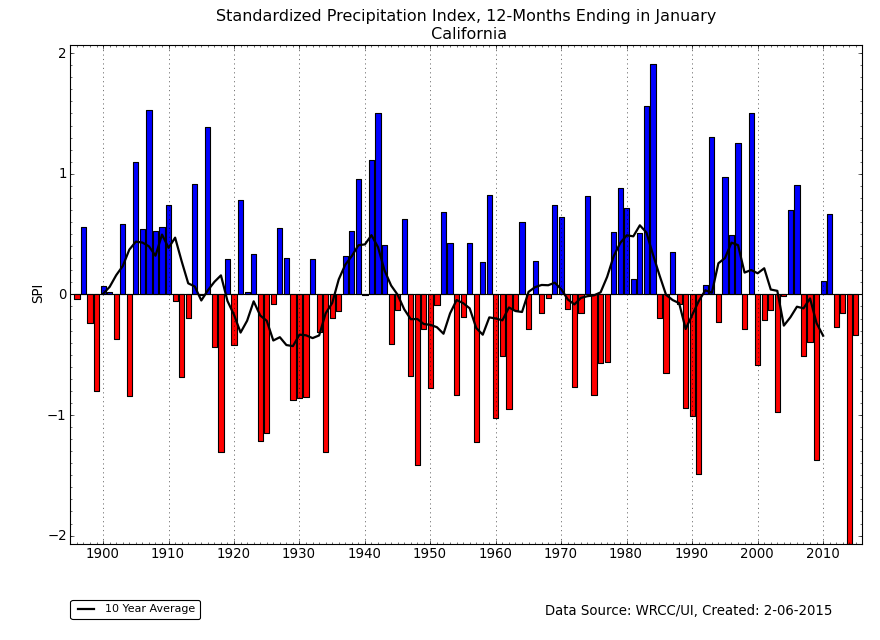
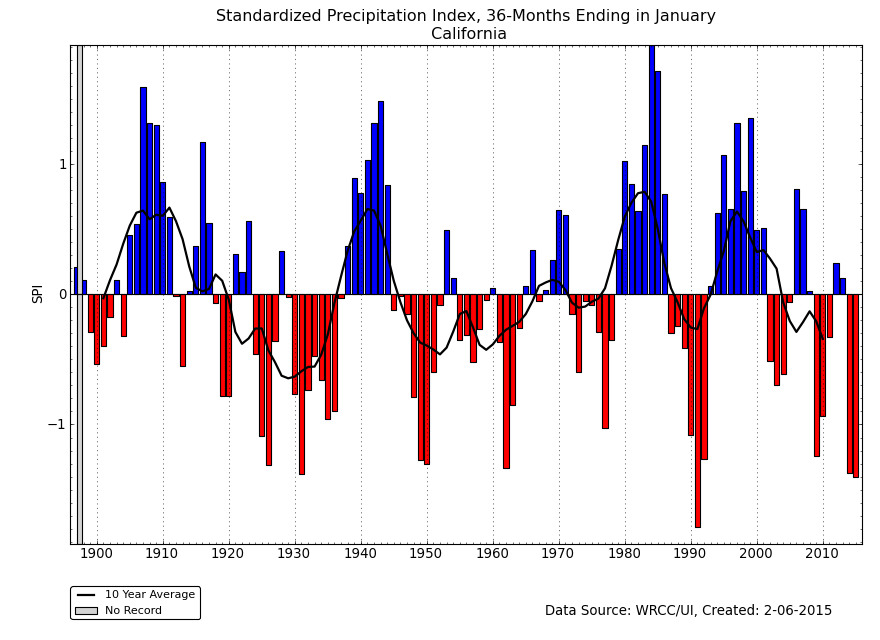
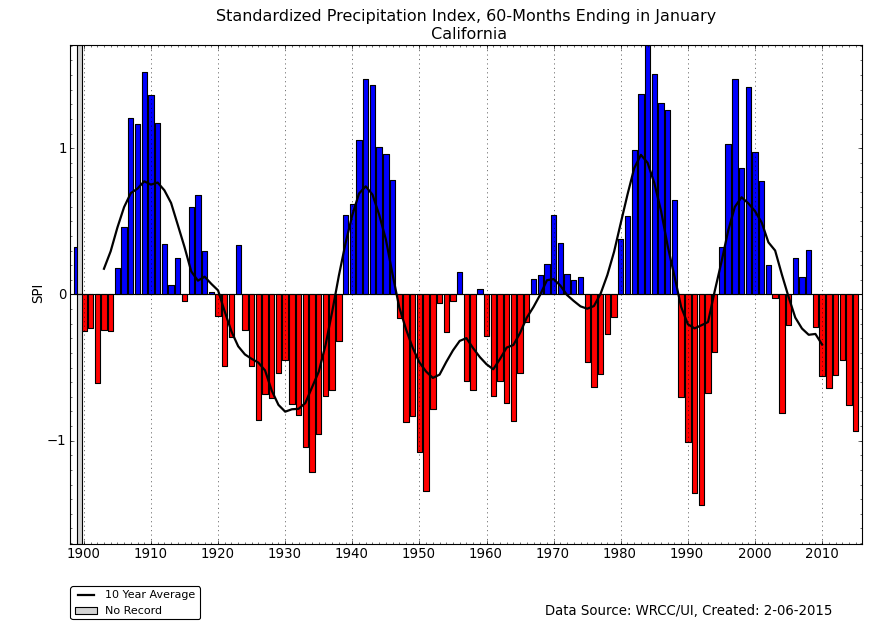
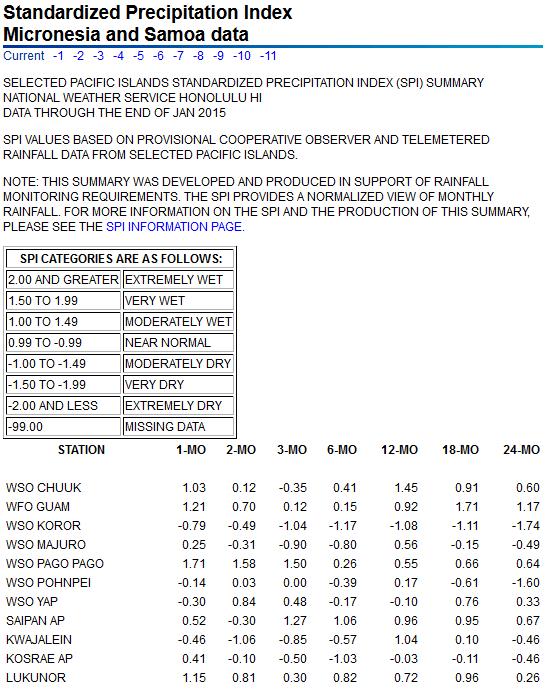
Standardized Precipitation Index
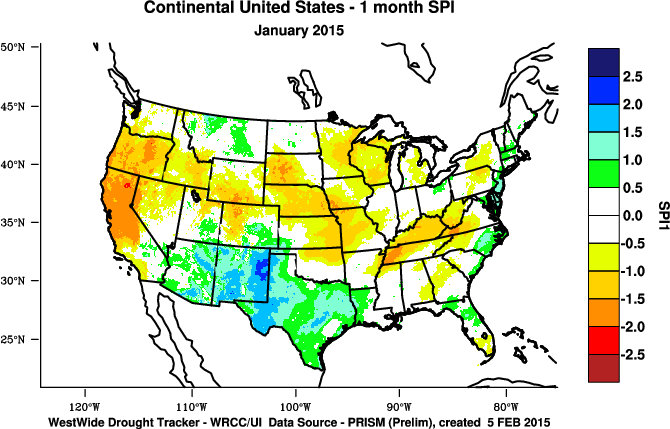
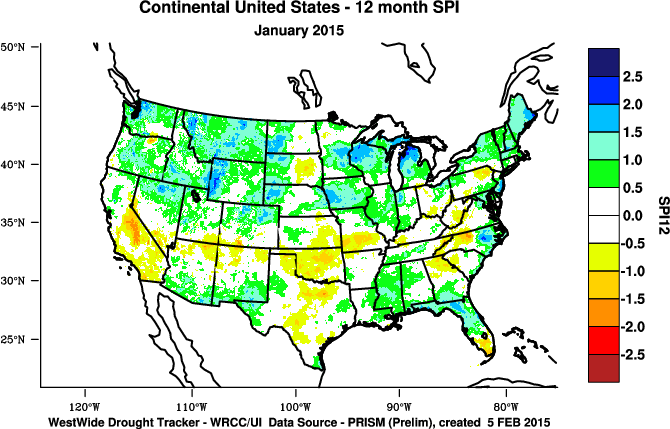
The Standardized Precipitation Index (SPI) measures moisture supply. The SPI maps here show the spatial extent of anomalously wet and dry areas at time scales ranging from 1 month to 24 months.
 |
 |
 |
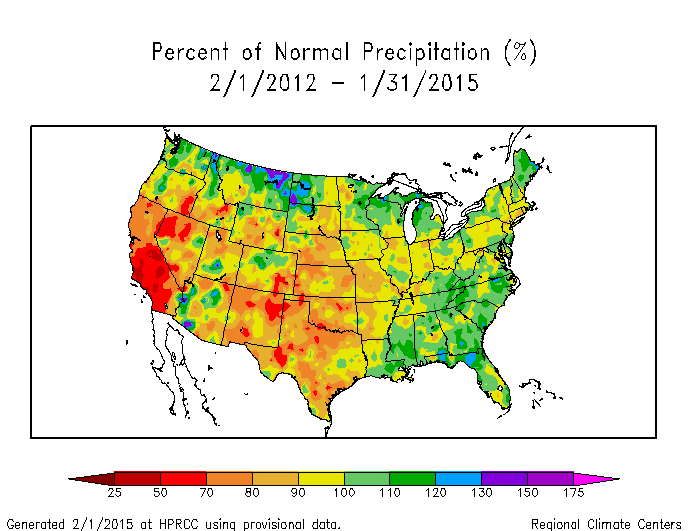
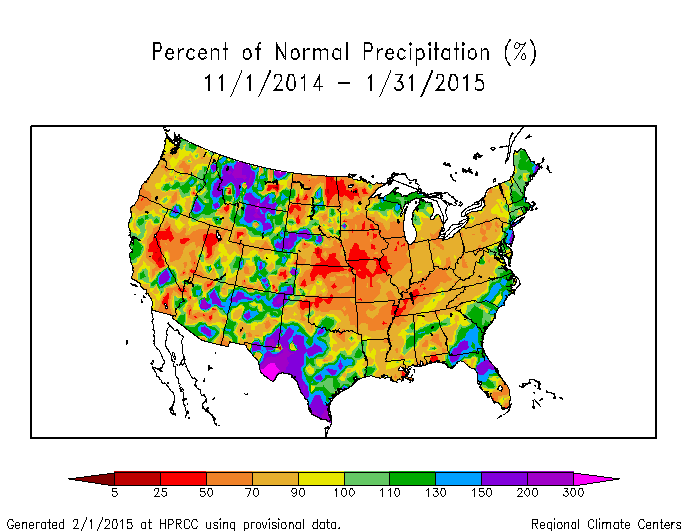
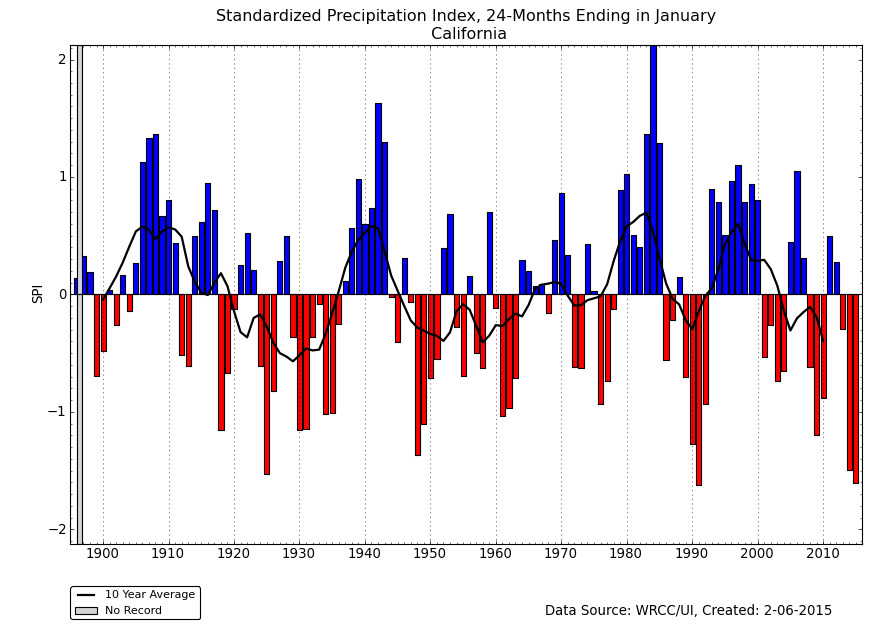
The SPI maps illustrate how moisture conditions have varied considerably through time and space over the last two years. January and the last 2 to 3 months have been dry across the Far Northern Plains to Tennessee Valley and Central to Northern Appalachians, with the dryness extending to 6 months in places. Parts of the Southeast were dry at the 6 to 9 month time scales. Most of the Southern Plains were wet during January but parts were dry, with this mixed pattern extending out to 6 months. Dryness begins to dominate at the 12 to 24 month time scales. Across much of the West, January was very dry, but heavy precipitation in December and earlier in 2014 resulted in near normal conditions at the 2 to 12 month time scales — except for central California, which was dry at most time scales. Dryness becomes dominant across the West at 24 months.
 |
 |
 |
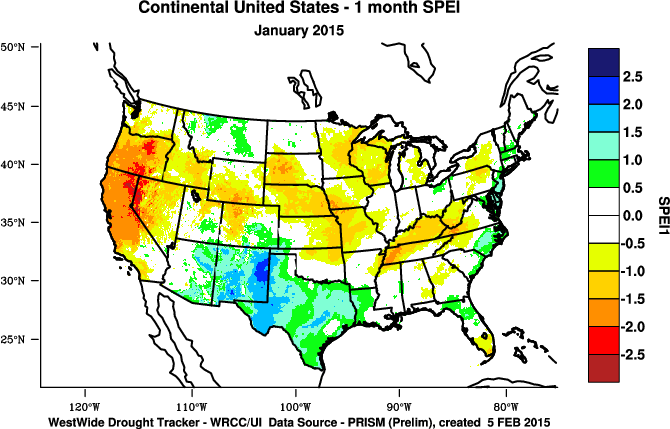
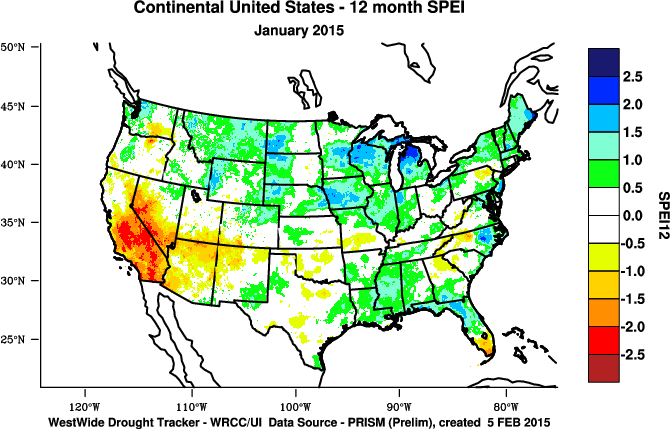
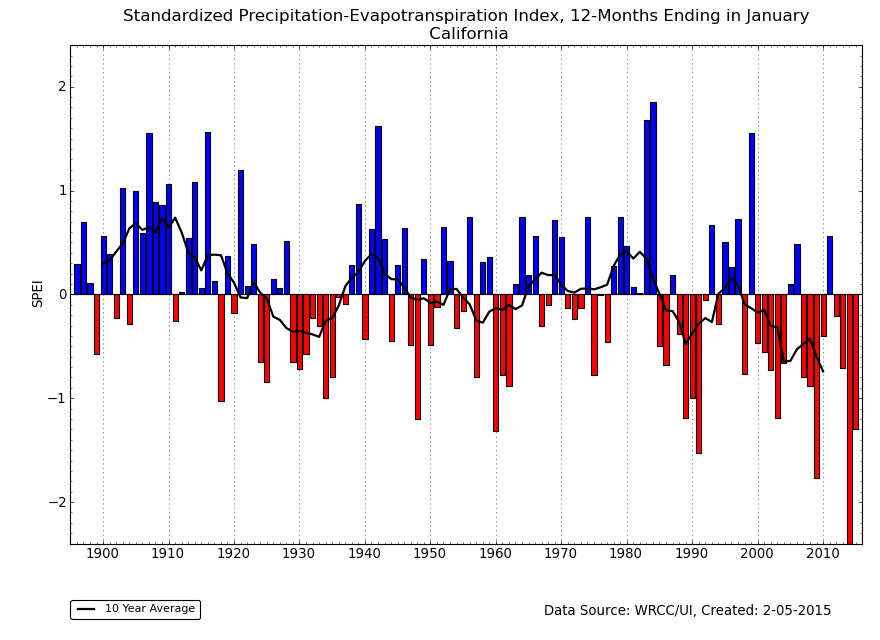
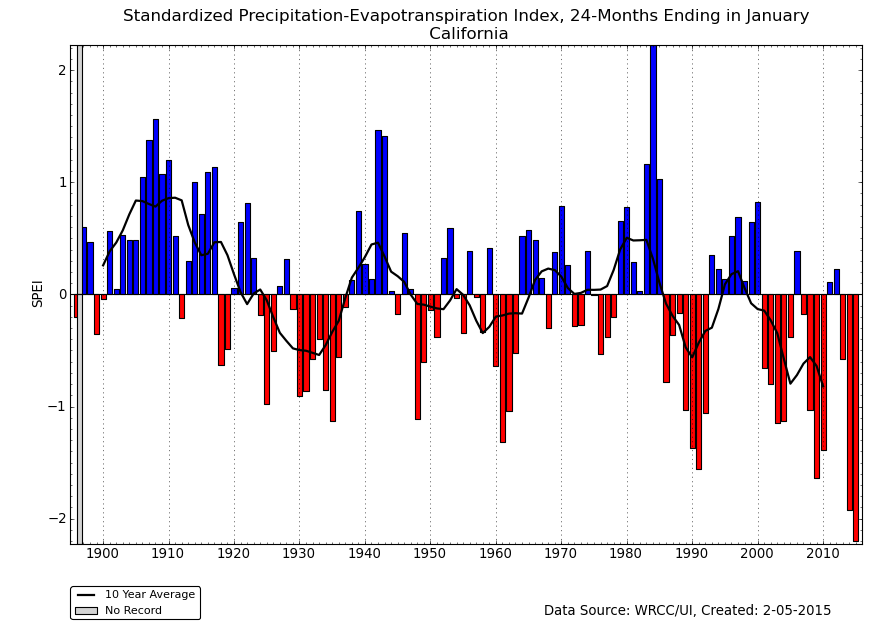
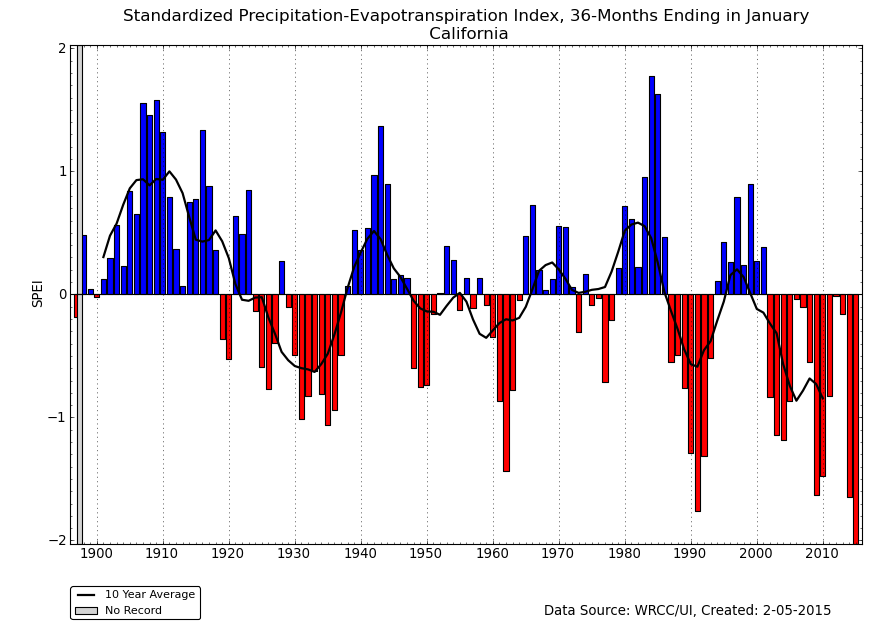
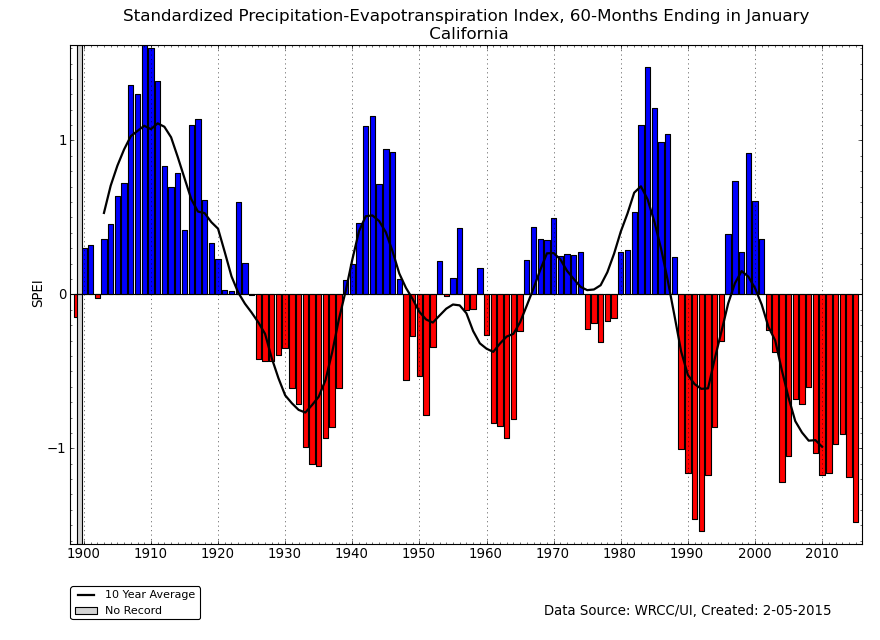
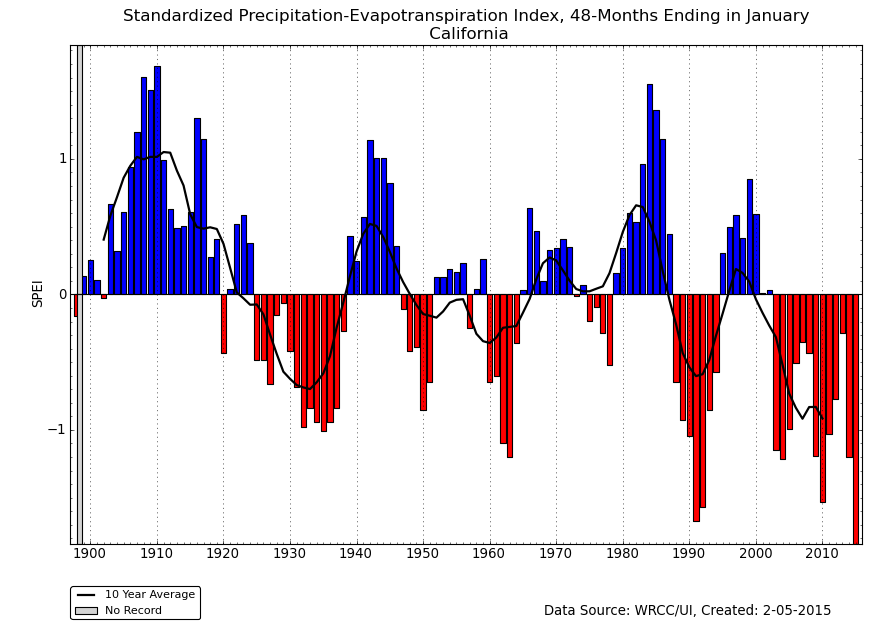
Standardized Precipitation Evapotranspiration Index
The SPI measures water supply (precipitation), while the SPEI (Standardized Precipitation Evapotranspiration Index) measures the combination of water supply (precipitation) and water demand (evapotranspiration as computed from temperature). Warmer temperatures tend to increase evapotranspiration, which generally makes droughts more intense.
 |
 |
Temperatures were unusually warm in the West during January. Normally that would increase evapotranspiration and make drought conditions worse. But since this is the winter and temperatures are normally low, the effect of the warm temperature anomalies was muted but it still made a noticeable difference in the SPEI and SPI in California, Oregon, and Nevada. When the entire year is considered, the record warm temperatures in the West significantly intensified drought conditions when the 12-month SPEI is compared to the SPI.
 |
 |
Agricultural, Hydrological, and Meteorological Indices and Impacts
 |
 |
Drought conditions were reflected in numerous agricultural, hydrological, and other meteorological indicators, both observed and modeled.
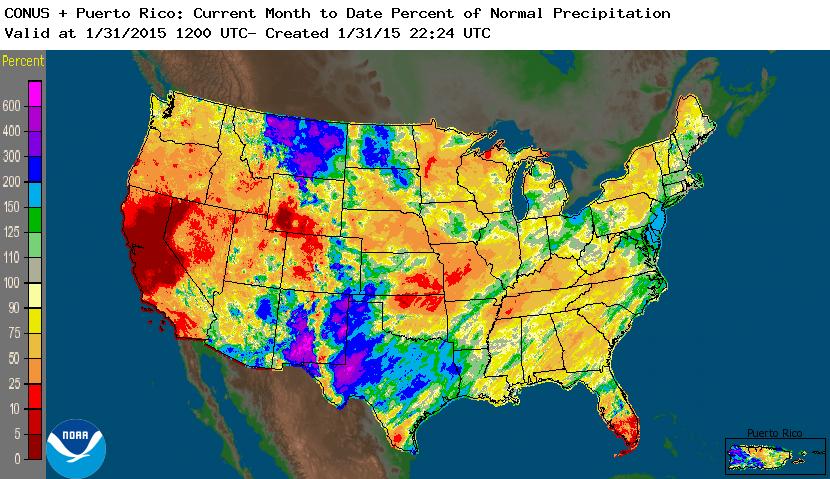
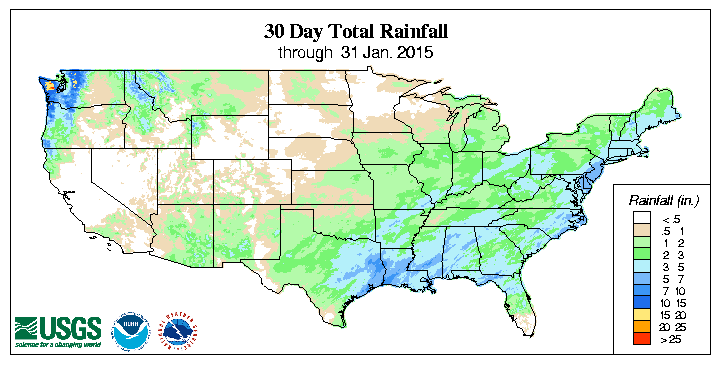
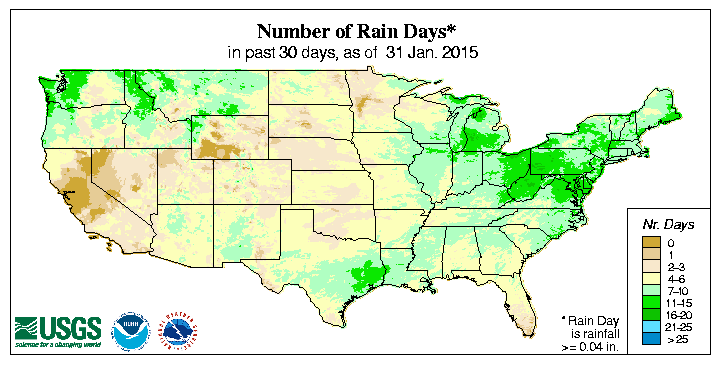
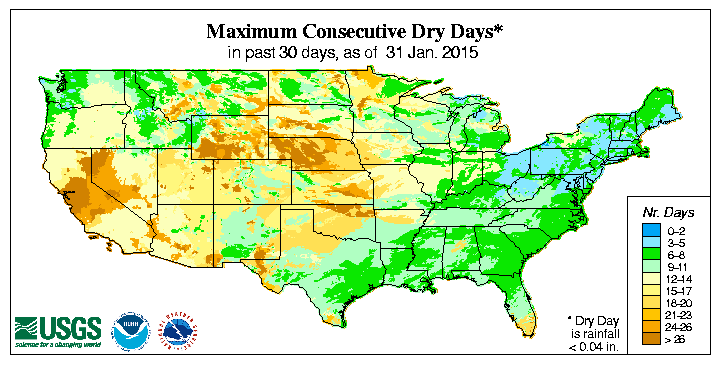
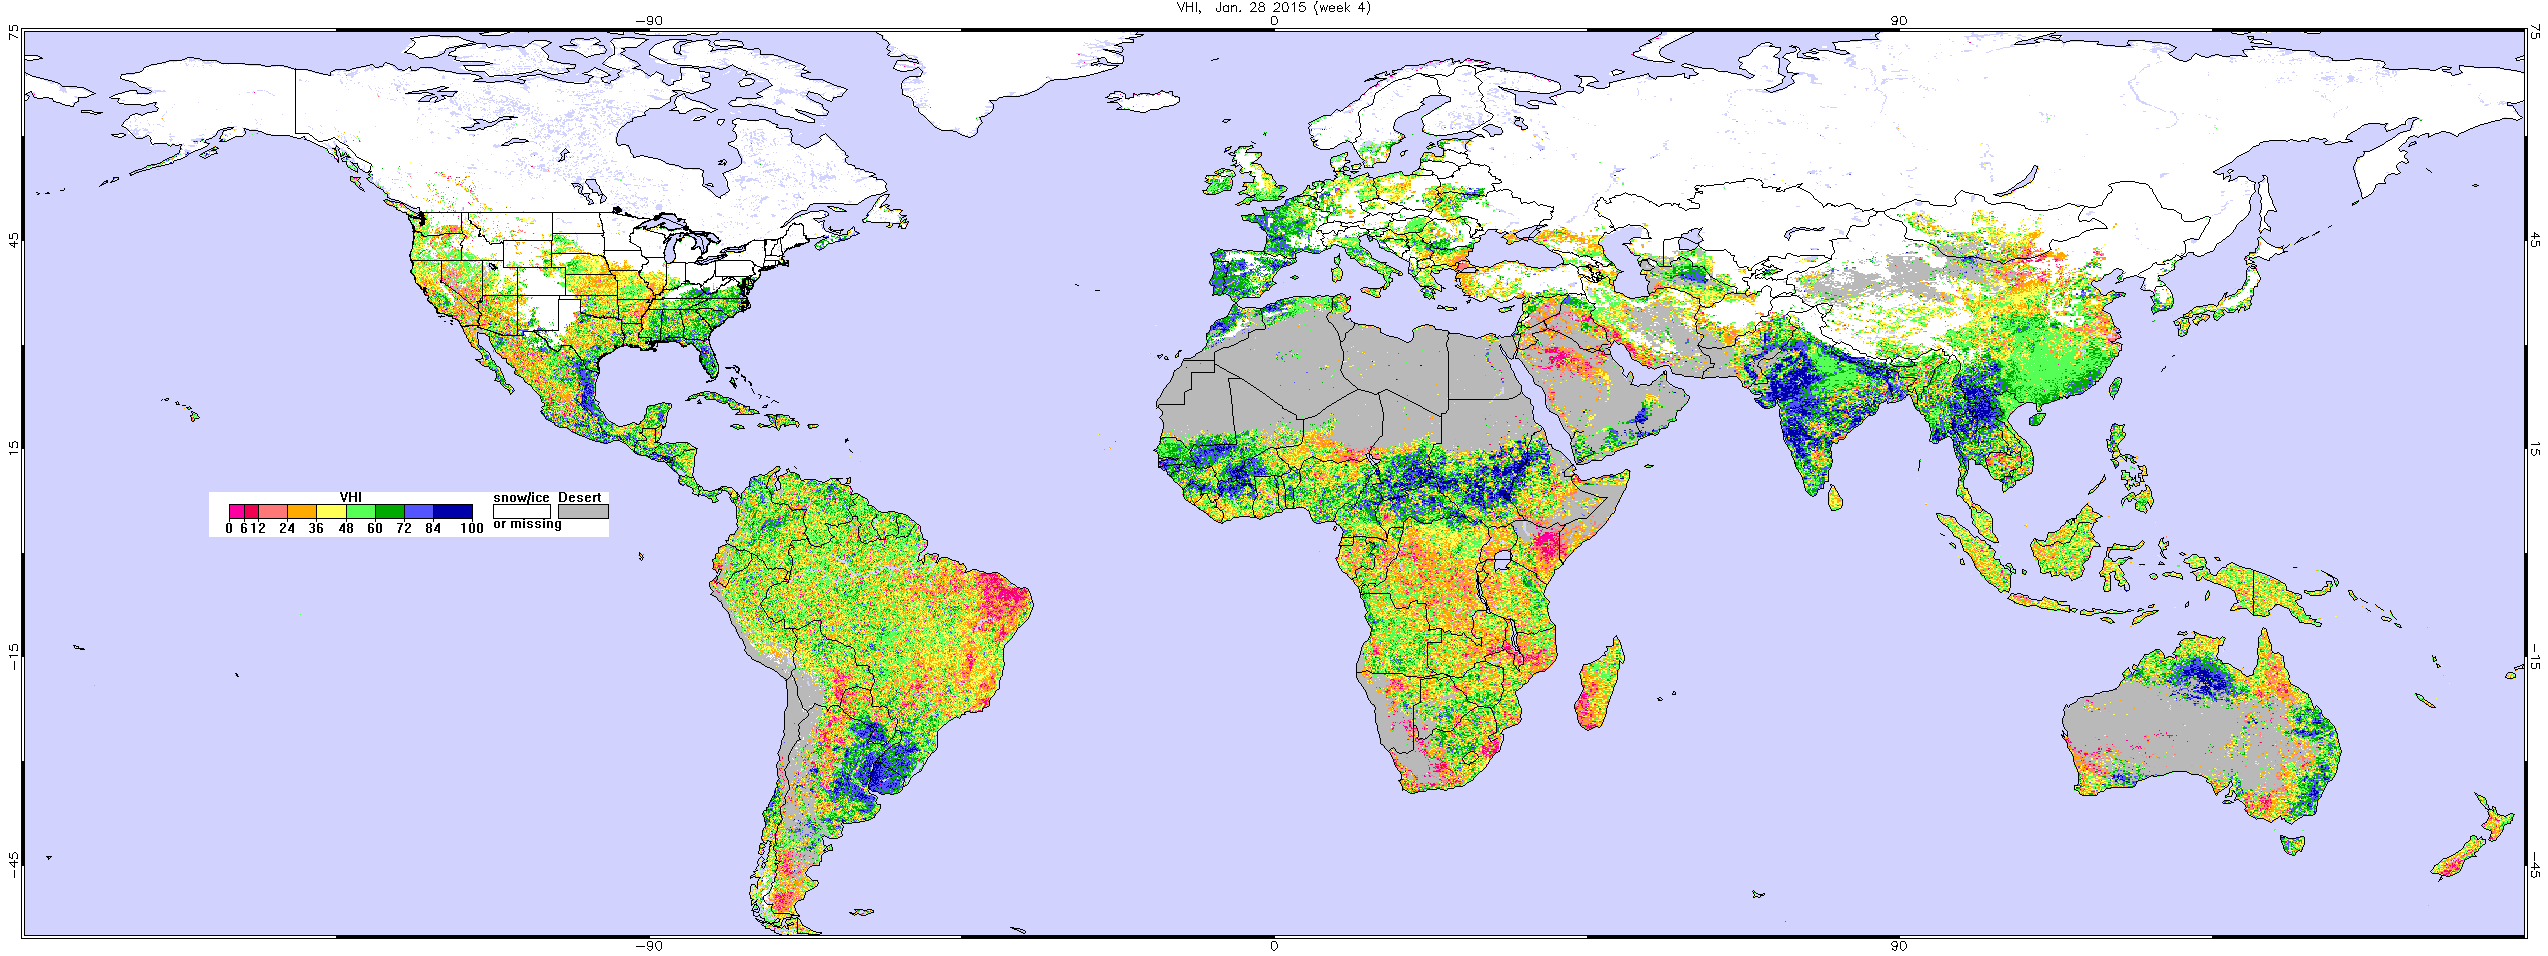
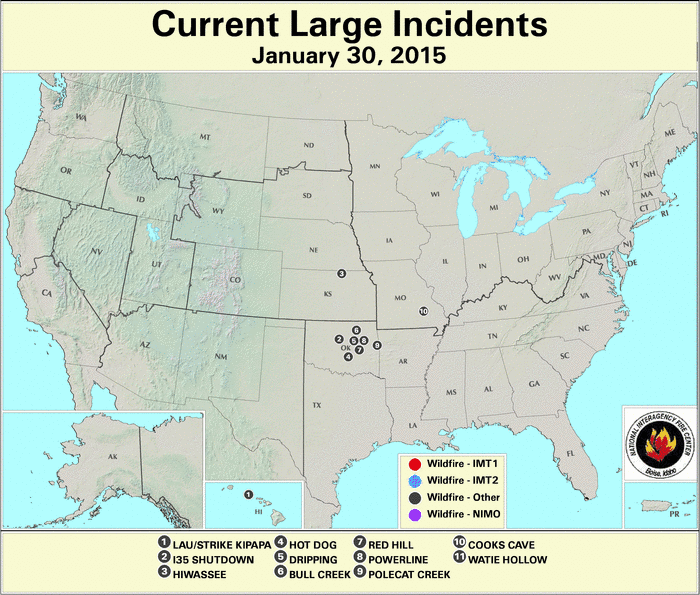
The dryness of January 2015 was reflected in below-normal precipitation totals, few days with precipitation, and long runs of dry days, especially from central California to northern Minnesota. The lack of precipitation during January, coupled with unusually warm temperatures which increased evaporation, further dried soils in the West. Soil moisture also decreased in the Plains to Midwest. According to February 2nd reports from the U.S. Department of Agriculture (USDA), topsoil moisture was rated as very short to short (very dry to dry) for 30 percent of topsoil in Texas, 36 percent in Colorado, 48 percent in Kansas, and 60 percent in Oklahoma. Subsoil moisture conditions were even drier, with short to very short ratings at 39 percent in Texas, 44 percent in Colorado, 51 percent in Kansas, and 70 percent in Oklahoma. Satellite observations of vegetative condition revealed some stress in the West and Plains to Mississippi Valley. According to the USDA, as of February 3rd, 8 percent of the nation's corn production, 9 percent of soybean production, 19 percent of hay acreage, 26 percent of cattle inventory, and 37 percent of winter wheat production were within areas experiencing drought. The USDA rated winter wheat condition as 13 percent poor to very poor in Kansas and Oklahoma, 14 percent poor to very poor in Colorado, and 16 percent in Texas. By the end of the month, several large wildfires had developed in the Southern Plains, centered in Oklahoma.
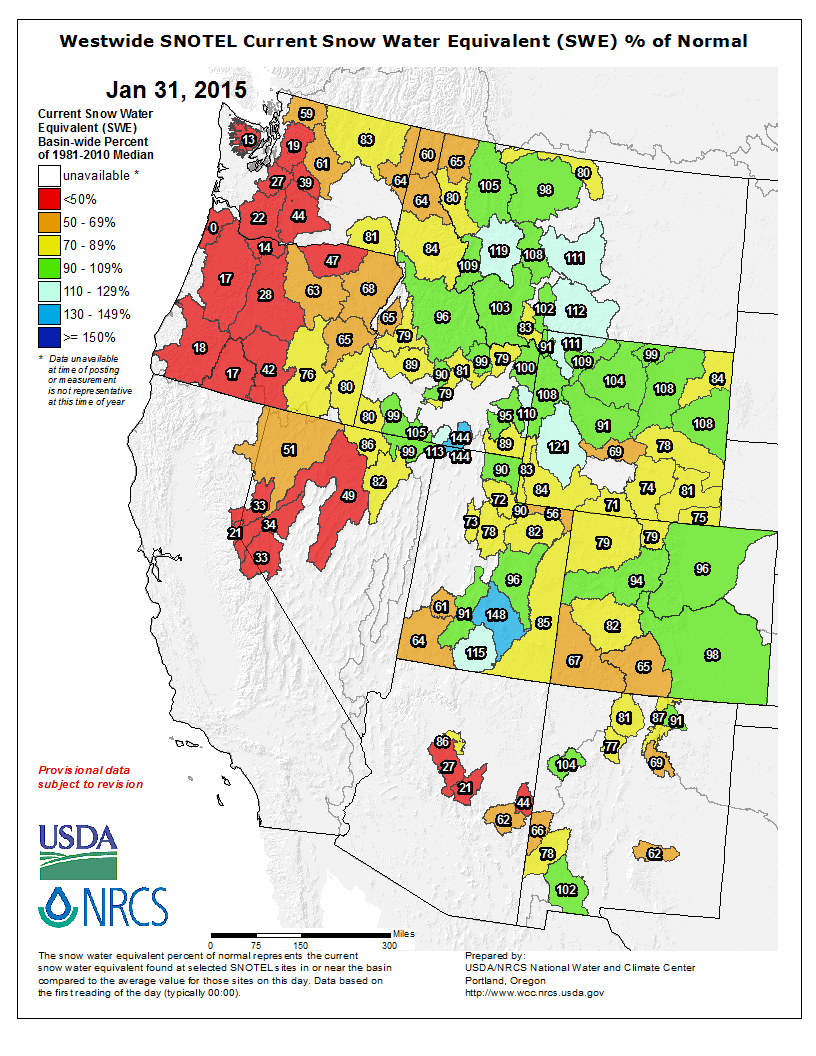
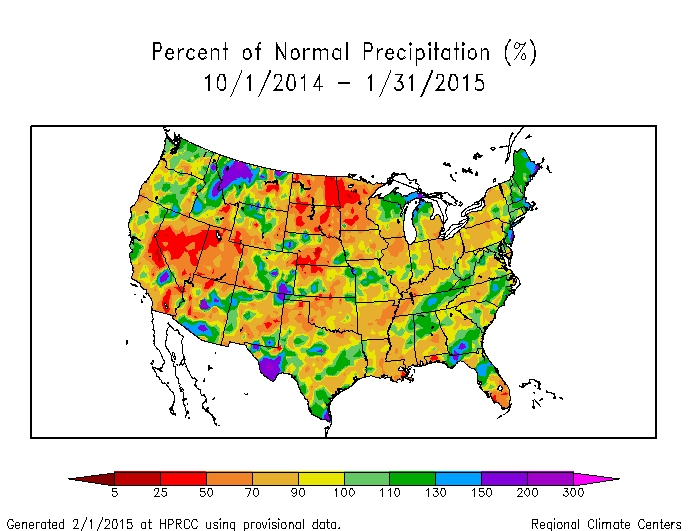
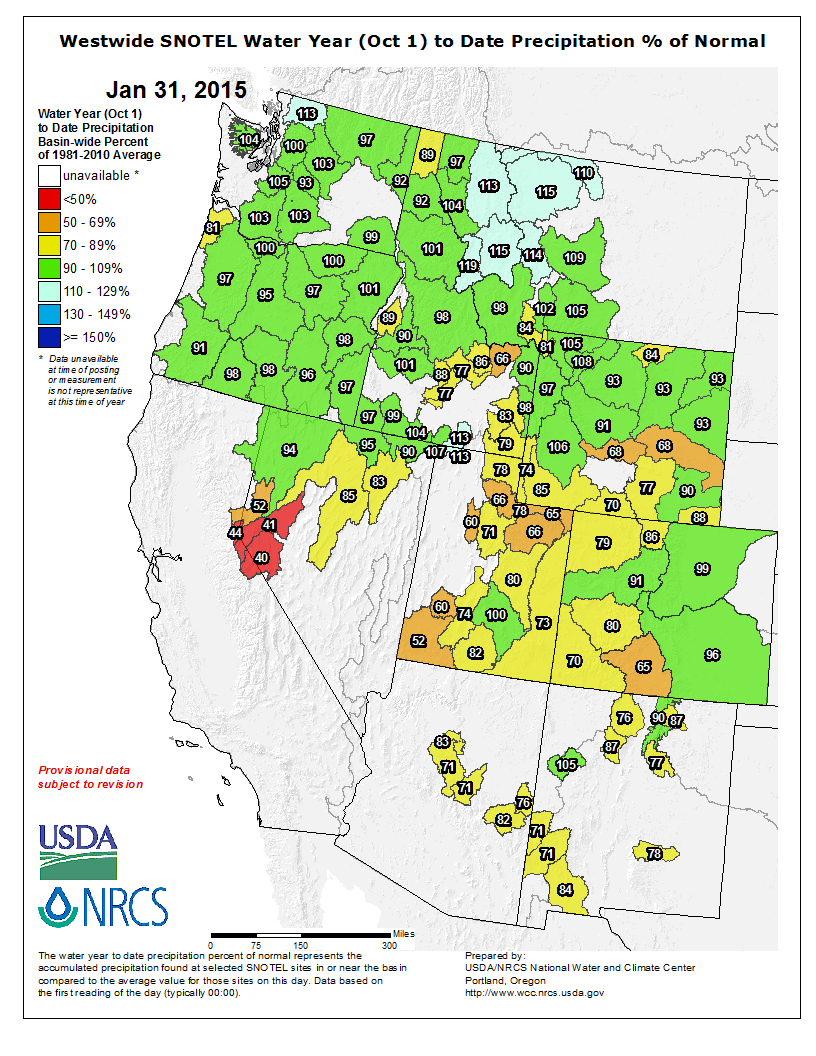
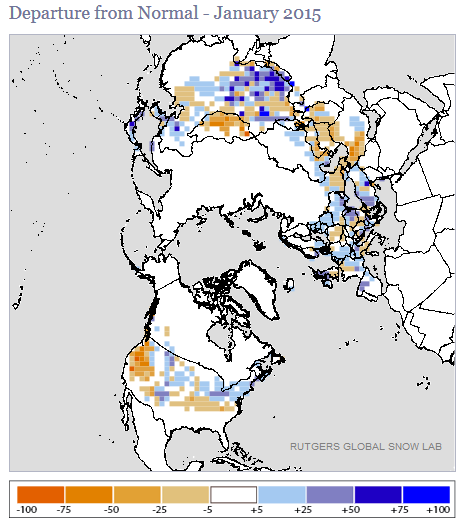
Although parts of the West have received near to above-normal total precipitation for the water year to date (October 1-present), much of the precipitation has fallen as rain instead of snow due to the well-above-normal temperatures, so the mountain snowpack and snow cover have been well below normal in many areas, especially the Far West. A thick winter snowpack is important for western hydrology as it provides a major water source when it melts during the spring and summer.
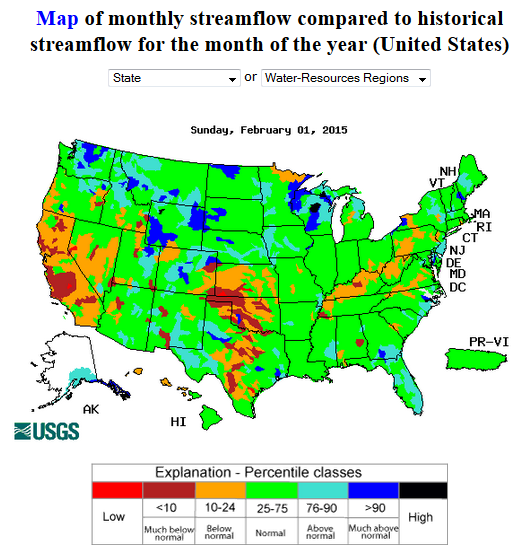
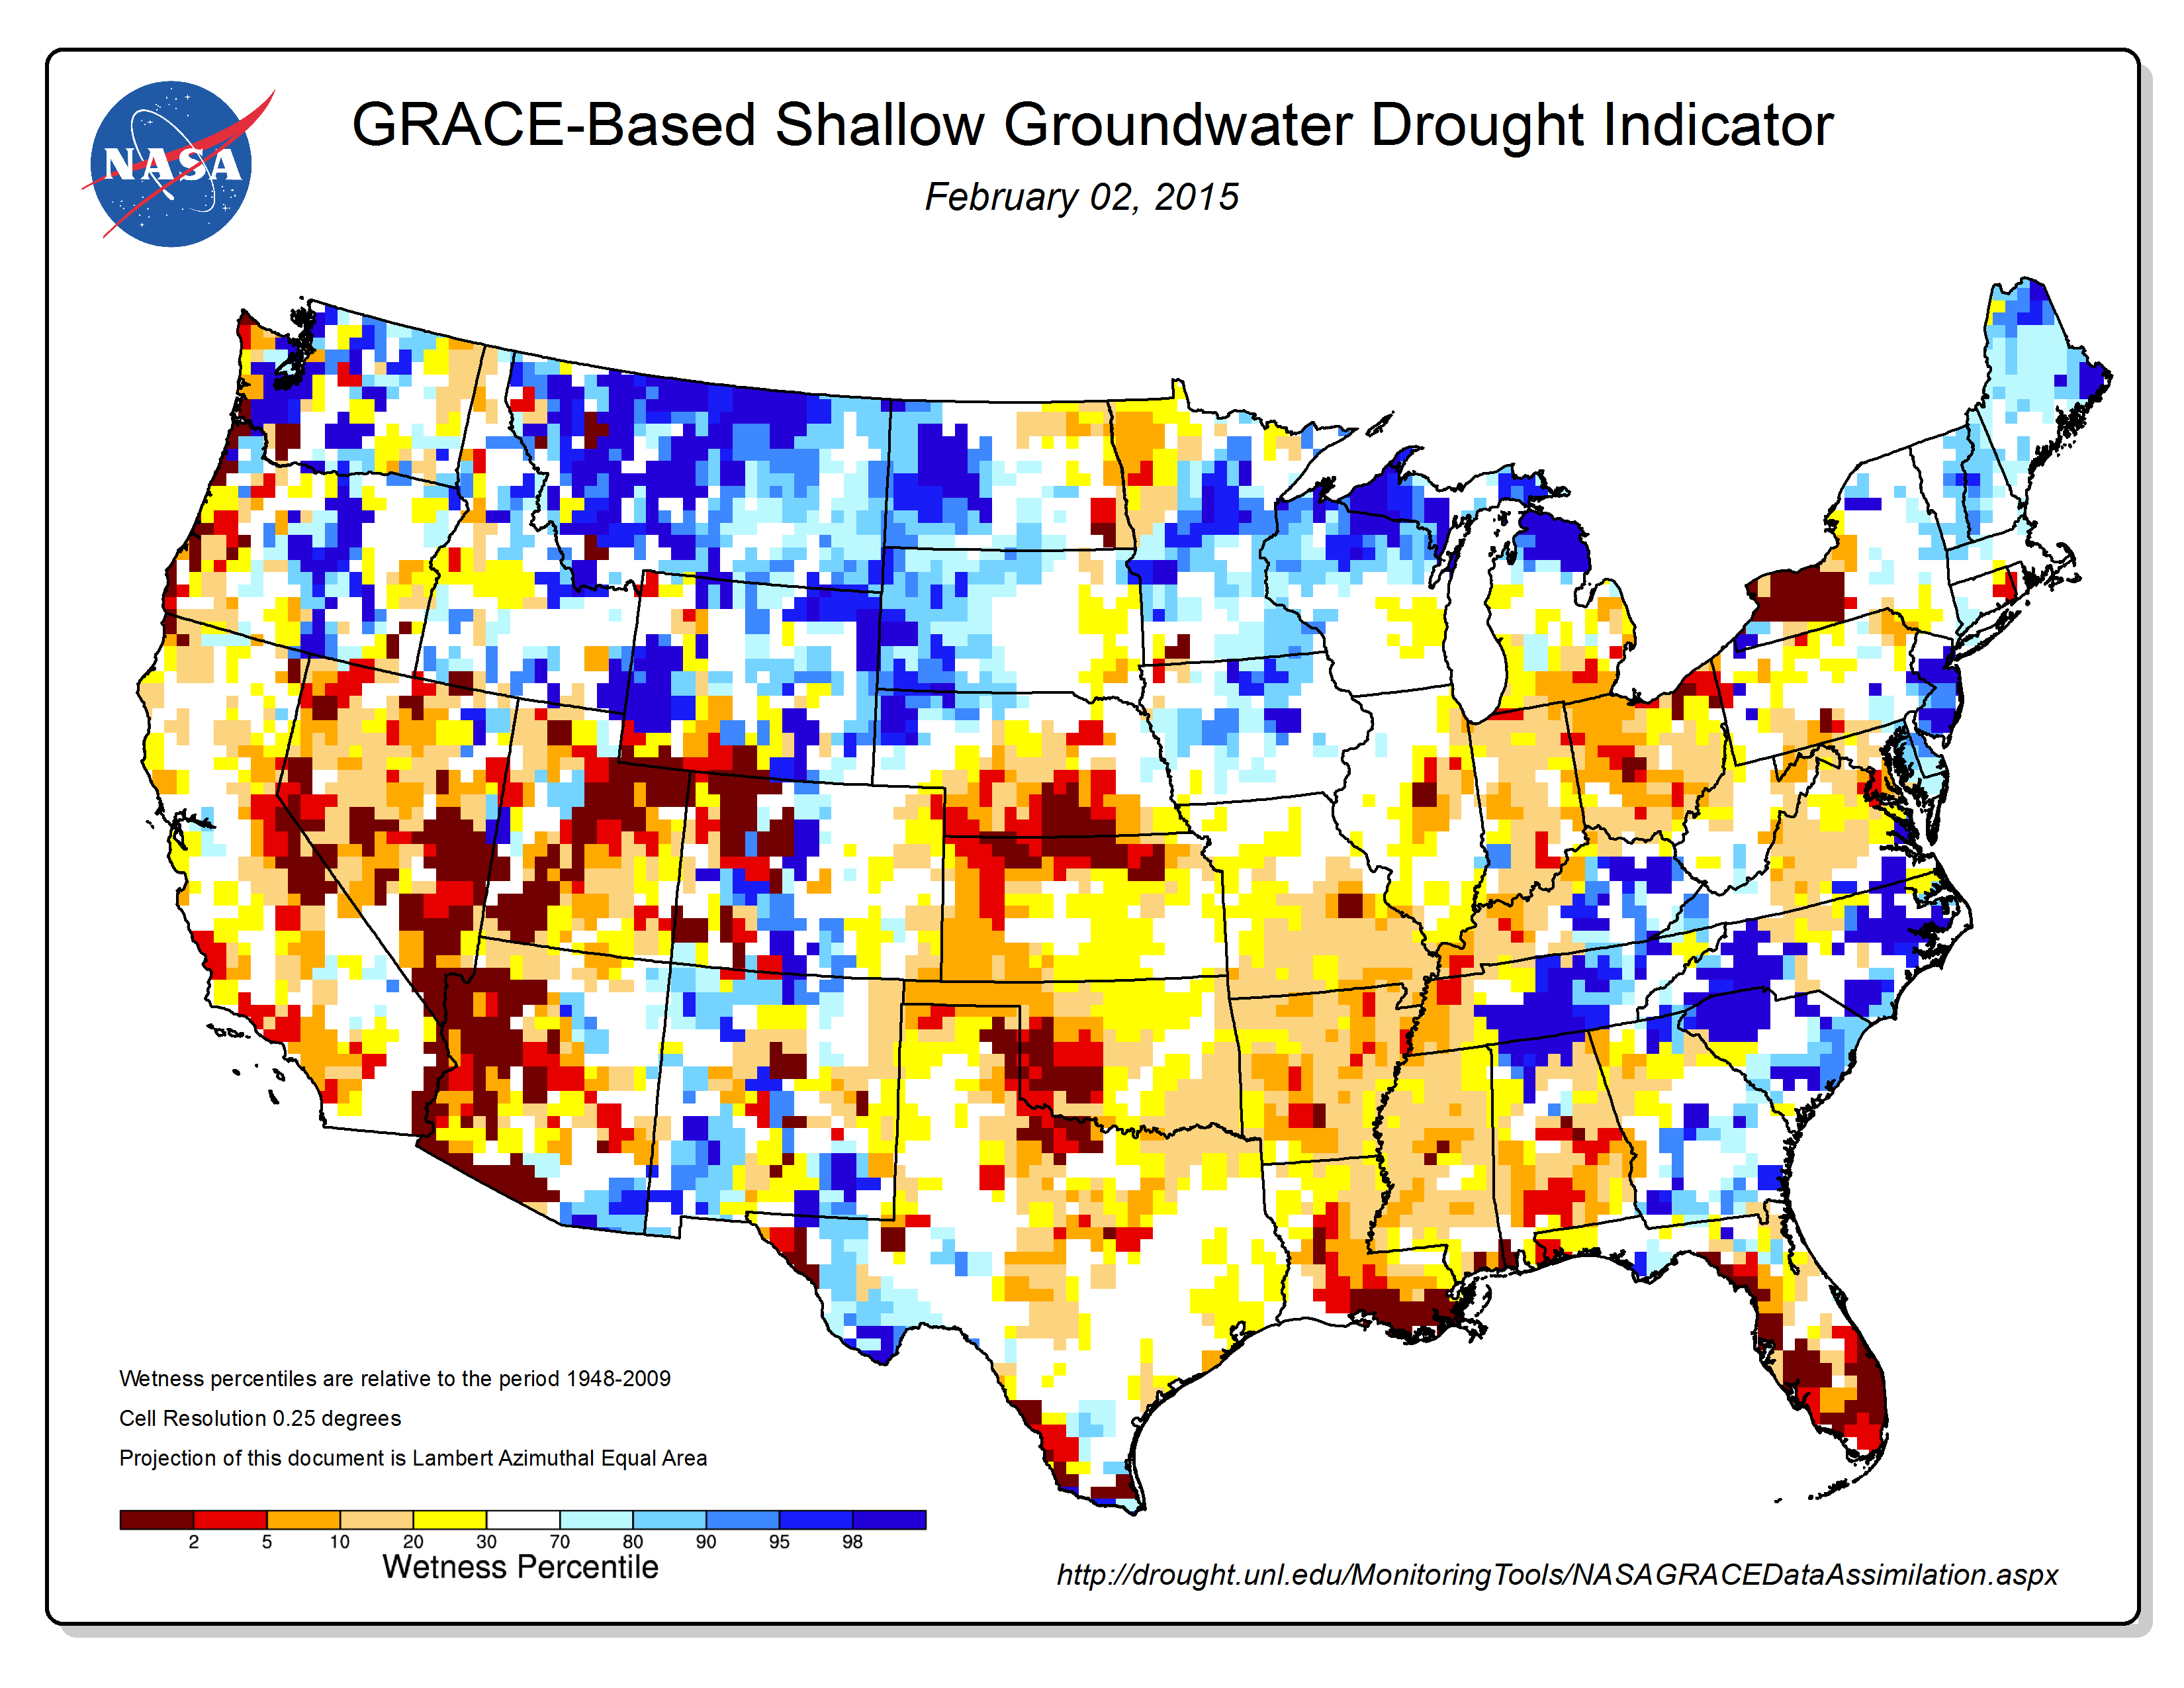
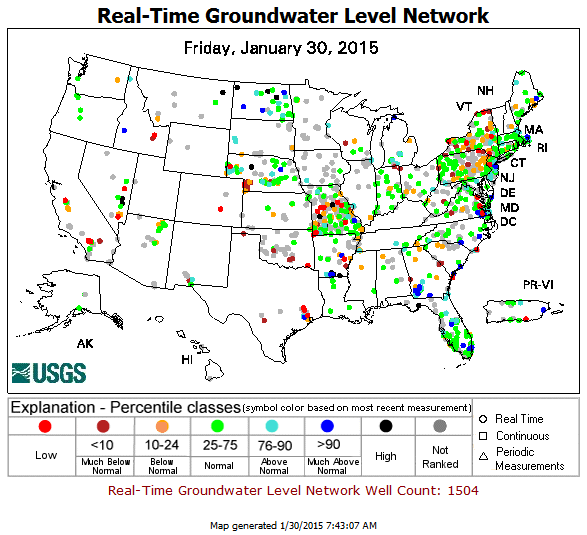
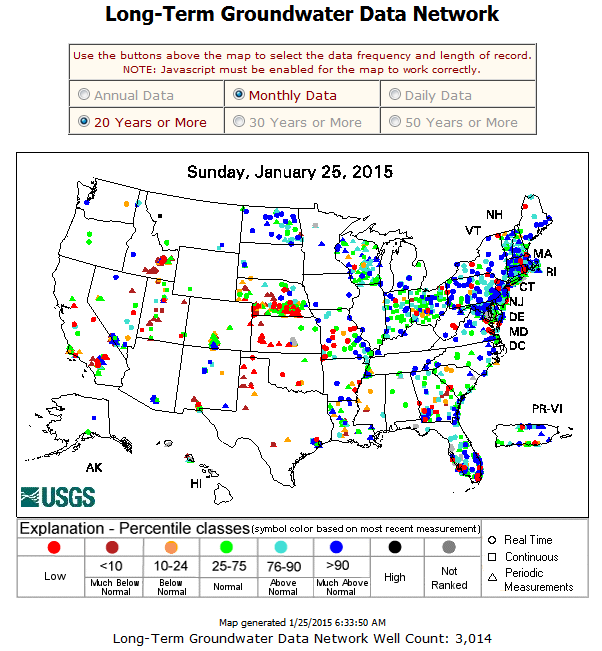
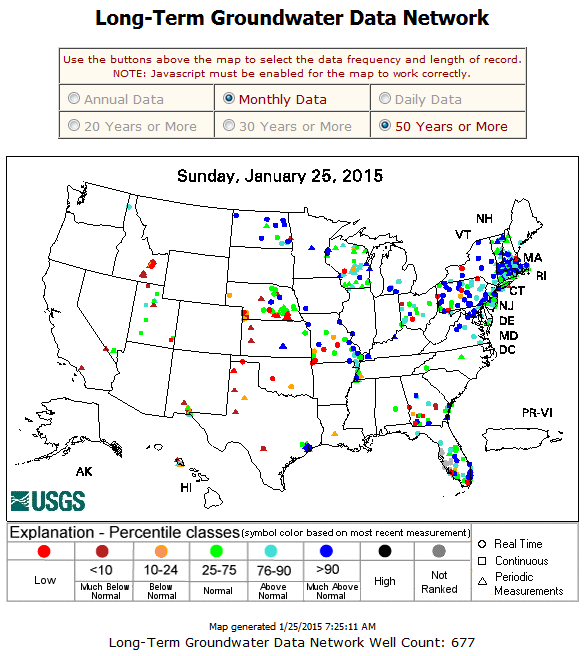
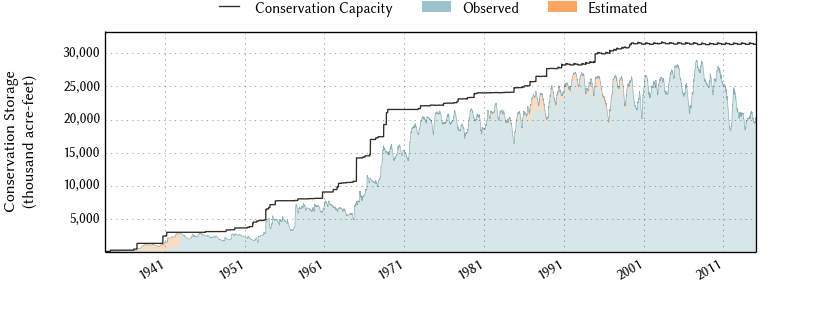
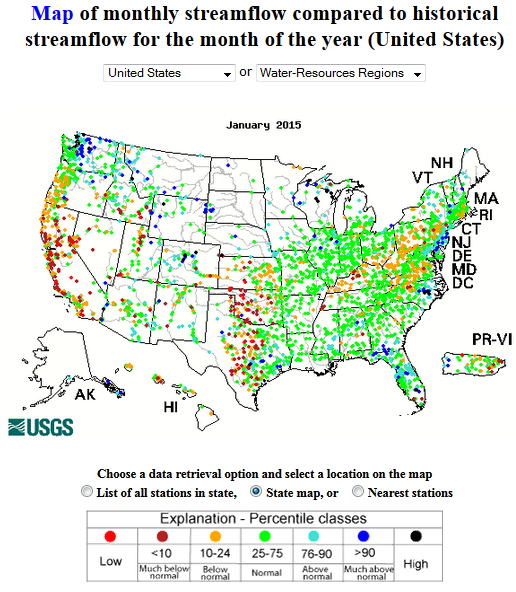
Three-plus years of drought in the West to Southern Plains have significantly depleted groundwater and reservoir levels. Some groundwater well stations have reached the lowest levels observed in the last 20 to 50 years. Groundwater feeds many streams, and the low groundwater levels are reflected in below-normal streamflow levels. Reservoirs were below average statewide in Arizona, Nevada, New Mexico, and Oregon. Reservoirs in California and western to central Texas were seriously depleted, with those in Texas, averaged across the state, stuck at the lowest levels in 30 years.
Regional Discussion
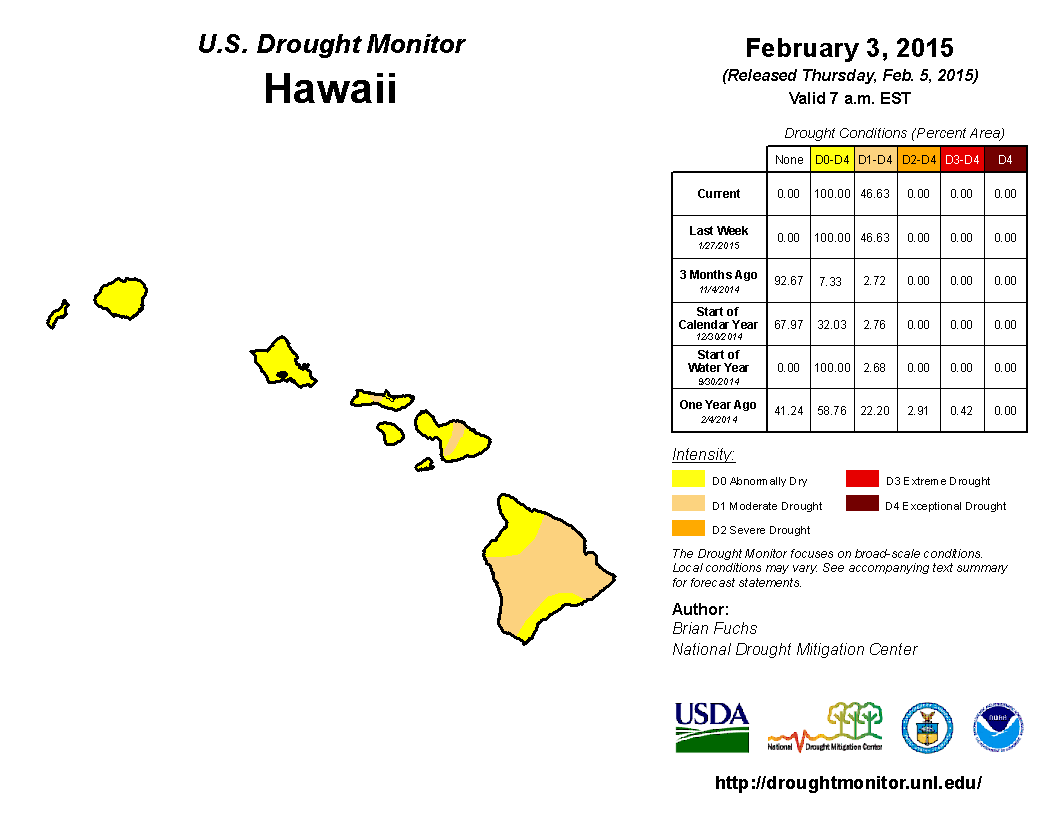
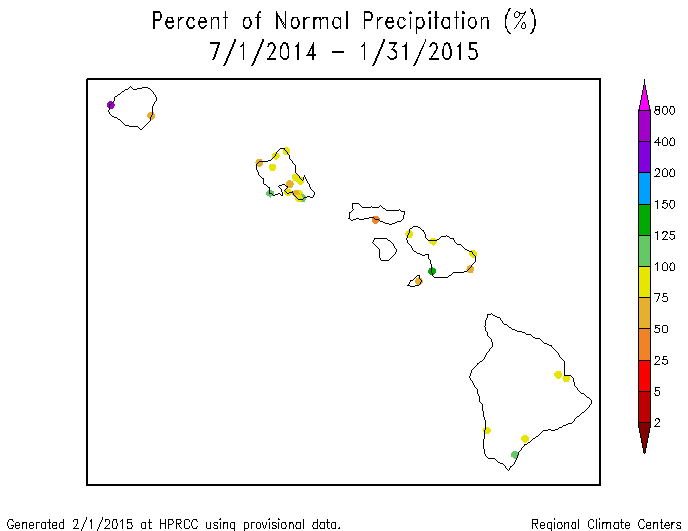
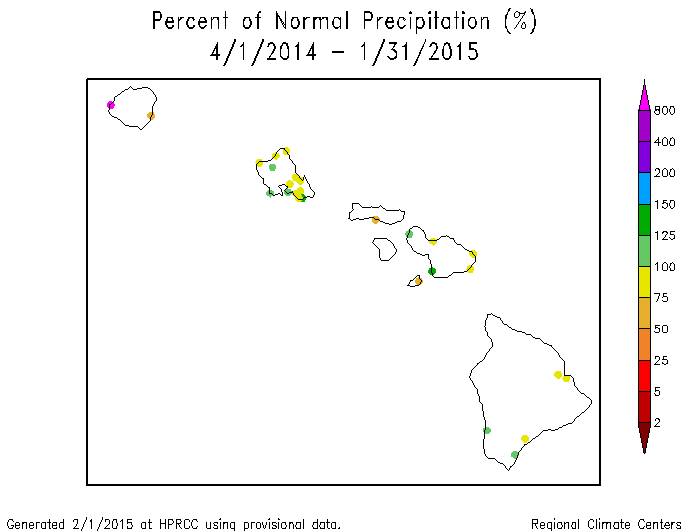
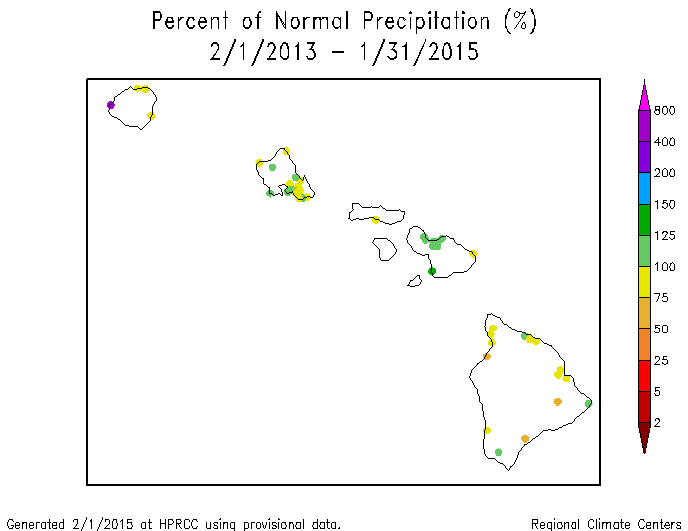
Hawaii: January 2015 was drier than normal across Hawaii. The last 2 to 3 months have been predominantly drier than normal. Even with the rainfall from October 2014 and earlier, the last 4, 6, and 7 months averaged drier than normal at most stations. The precipitation anomaly pattern was mixed at 10 to 12 and even 24 months, but dryness was dominant at 36 months. The dryness was reflected in below-normal streamflow on some of the islands. On the USDM map, moderate drought expanded to cover nearly half (46.6 percent) of the state, reflecting the persistently low precipitation as well as the continued low reservoir situation in central Molokai and the Upcountry Maui area.
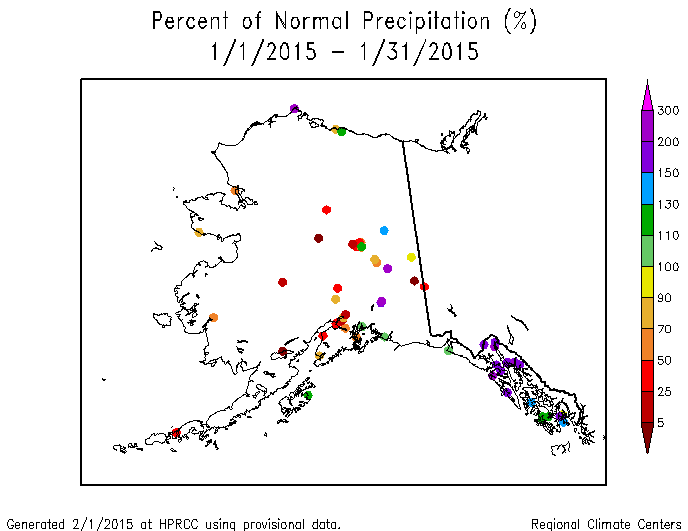
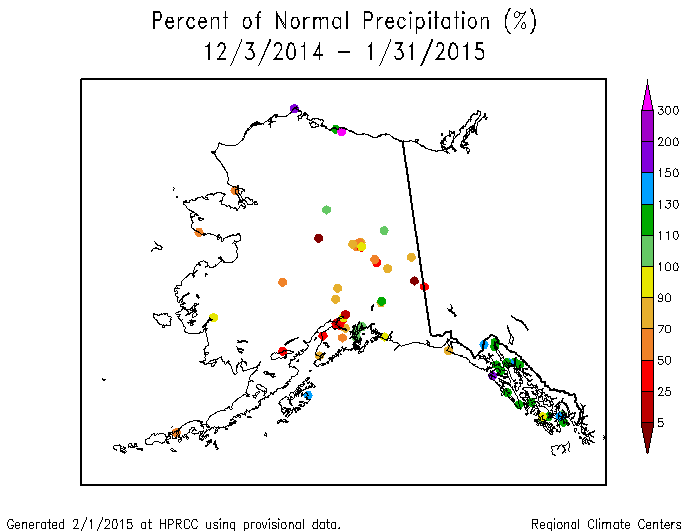
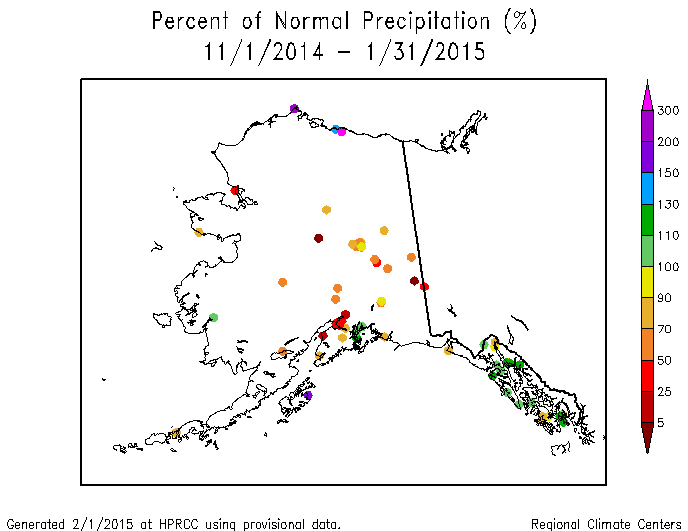
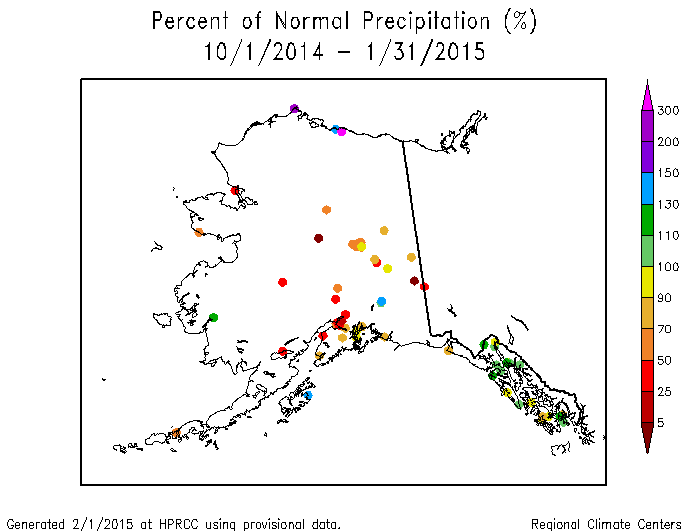
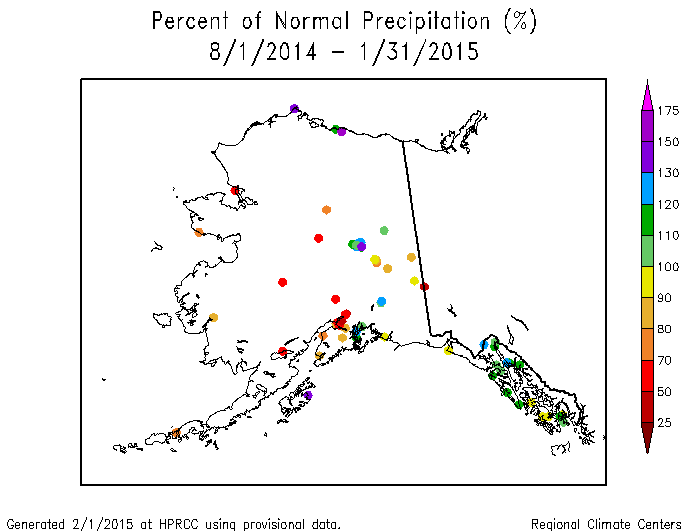
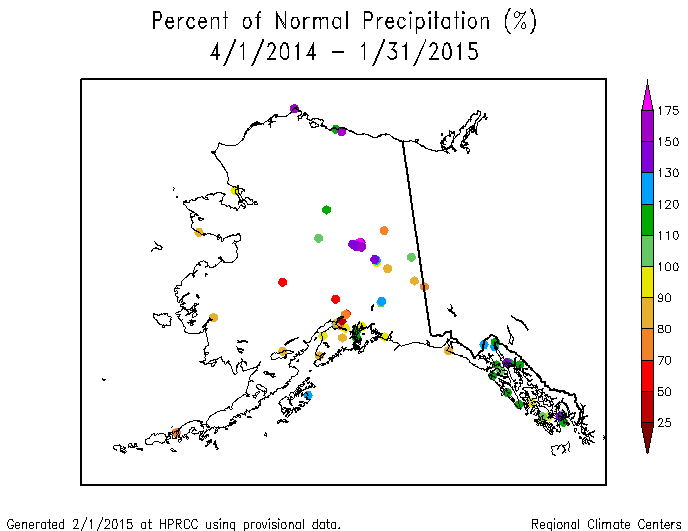
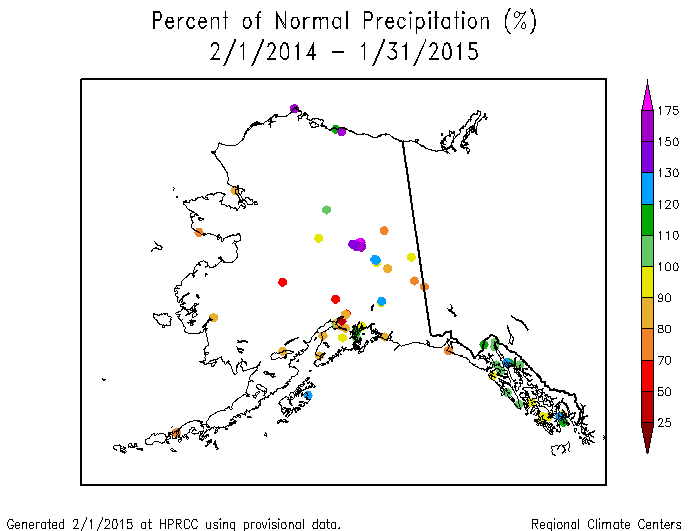
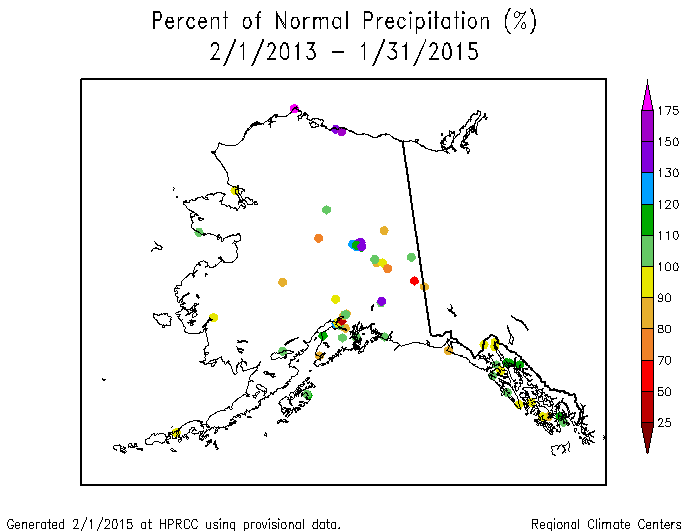
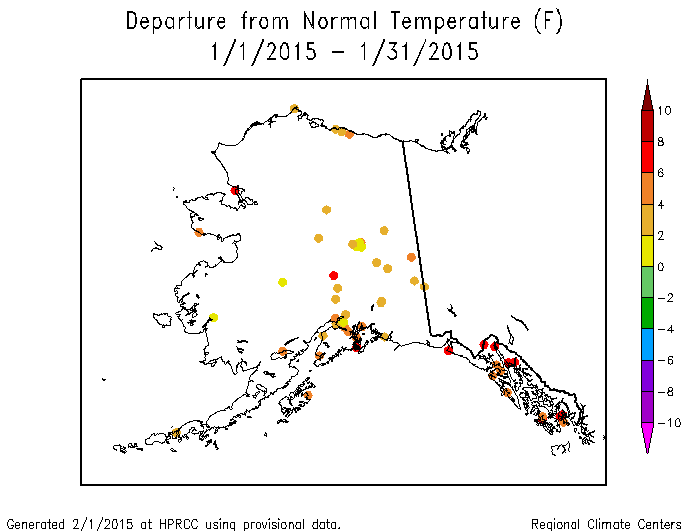
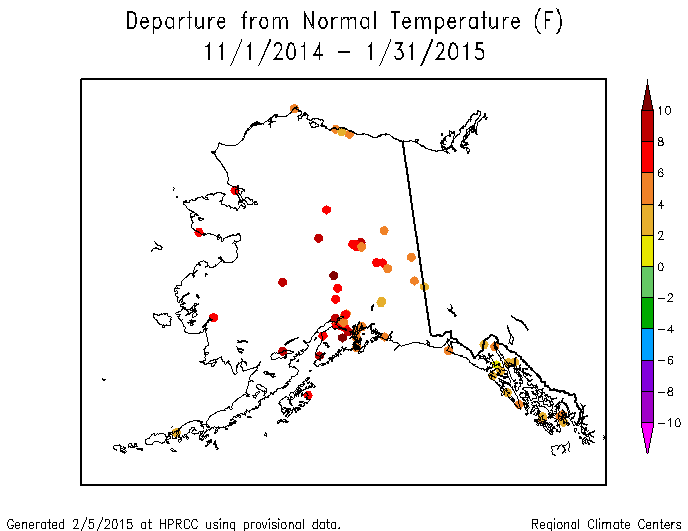
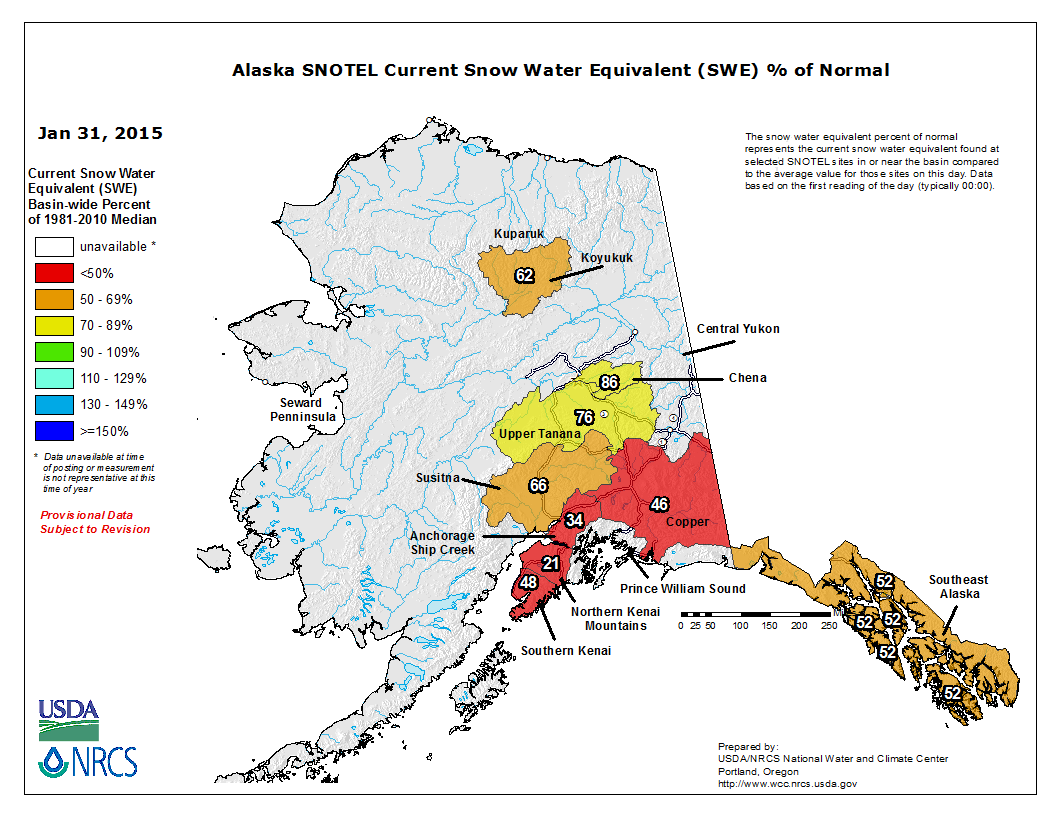
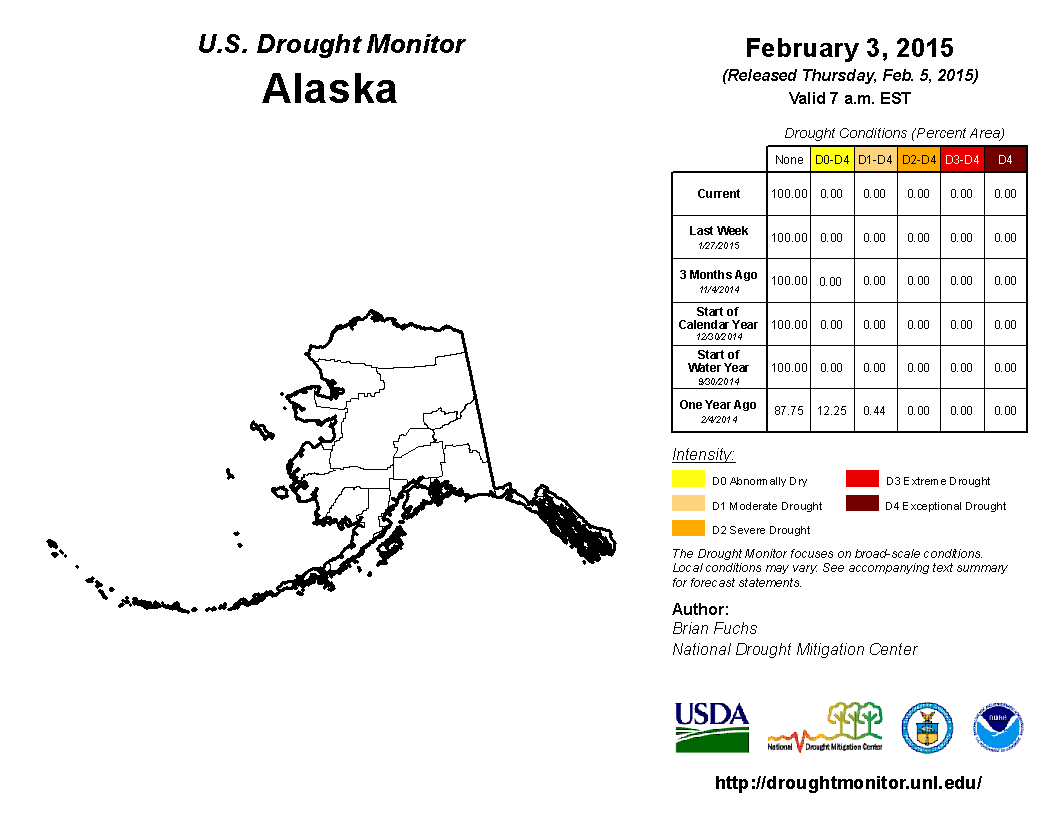
Alaska: Alaska had a mixed precipitation anomaly pattern during January, with drier-than-normal conditions in the west, south, and interior locations and wetter-than-normal conditions in the panhandle and northern locations. The pattern was consistent at both the low elevation stations and high elevation SNOTEL stations. The precipitation anomaly pattern extended back in time over the last year (last 2, 3, 4, 6, 7, 10, and 12 months), especially at the southern and interior locations. The pattern was mixed at longer time scales (last 24 to 36 months). The persistent upper-level circulation pattern (ridge), which reduced the precipitation, also brought widespread above-normal temperatures for the last one to three months. Concurrent with the below-normal precipitation and above-normal temperatures was a reduction in snowpack and increase in streamflow. Soil moisture models indicated drying soils in the south central and southwest portions of the state. The February 3rd USDM map was free of drought and abnormal dryness.
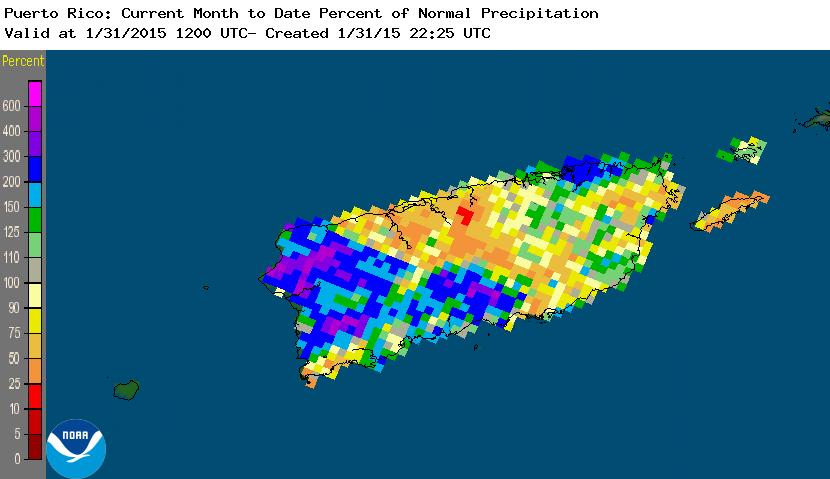
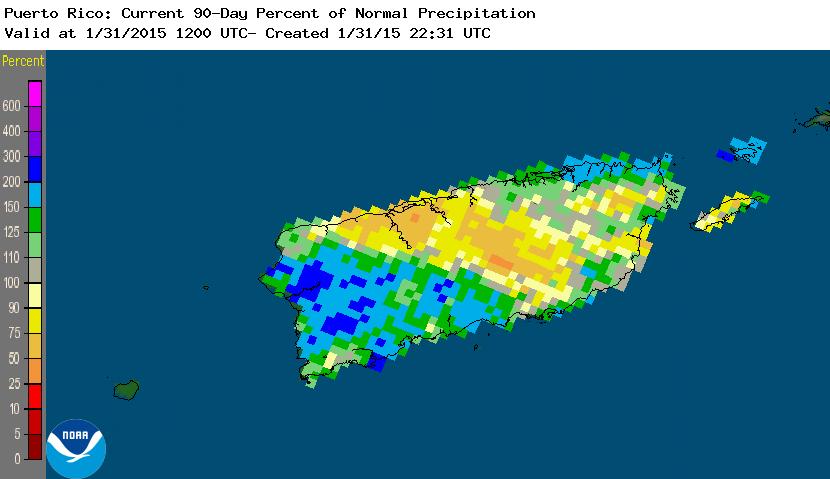
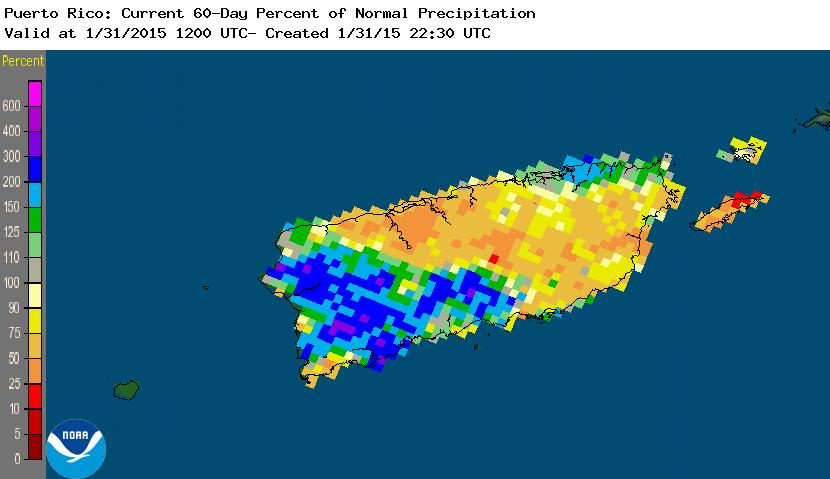
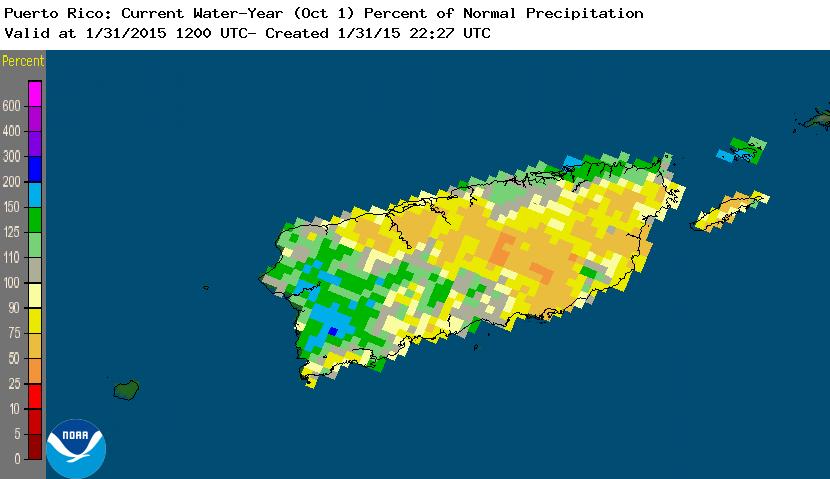
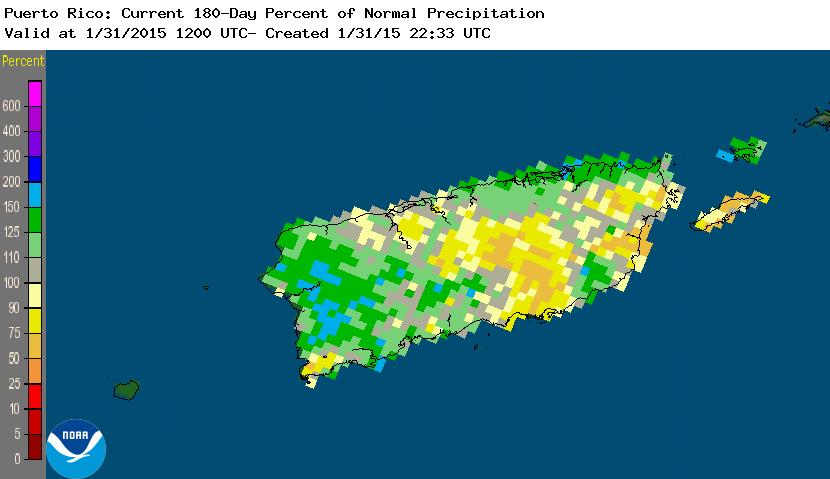
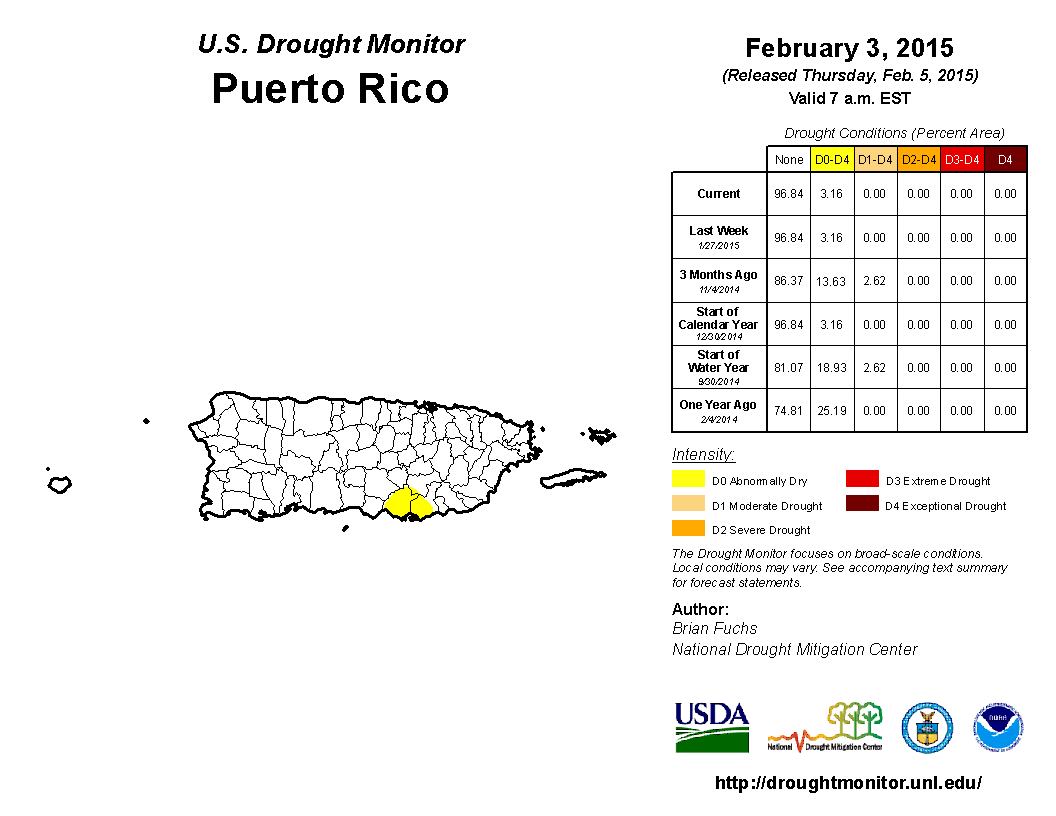
Puerto Rico: January was drier than normal for north central Puerto Rico and areas in the east and southeast, while the southwest was mostly wetter than normal. A similar pattern is evident at the 3-month time scale. Dryness is more widespread in the north, east, and southeast at the 2- and 4-month time scales and less widespread at 6 months. Streamflow is mostly near normal with some low streams in the east. On the February 3rd USDM map, abnormal dryness continued for about 3 percent of Puerto Rico.
 |
|
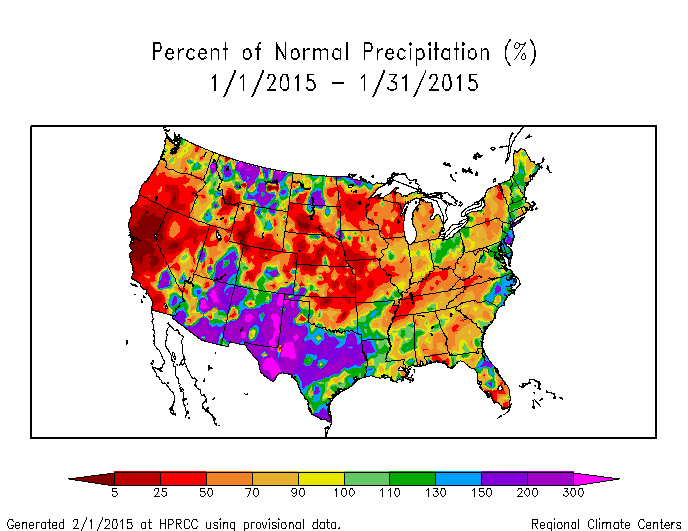
The January precipitation anomaly pattern of dryness in the West, Plains to Midwest, and interior Northeast was reflected in the state ranks, with 22 states ranking in the driest third of the historical record, including four which had the tenth driest, or drier, January. Portions of some states in the Southeast were dry, but other parts of those states were not as dry and this tempered the statewide ranks. Unusually warm temperatures accompanied the dryness in the West.
 |
|
California had the fourth driest January, with January 2015 marking the fifth consecutive January that was drier than normal. January 2015 was the fifth driest January for Oregon and marked the third consecutive drier-than-normal January. Wyoming had the tenth driest January; most of the Januaries for the last 15 years have been below to slightly below the long-term average. Winter is the dry season for the Great Plains, but January 2015 ranked as the eighth driest January for Nebraska and was the fourth consecutive drier-than-normal January.
 |
|
The November-January precipitation anomaly pattern of dryness from the Plains to Northeast was reflected in the 3-month state ranks, with 13 states ranking in the driest third of the historical record, including Kentucky which had the ninth driest January. Portions of some states in the West were dry, but other parts of those states were not as dry and this tempered the statewide ranks.
A variable pattern characterized the precipitation ranks at the longer time scales. Six states (in the Southern Plains, Mississippi Valley, and Northeast) ranked in the driest third of the historical record for August 2014-January 2015, while two states (Oklahoma and West Virginia) were that dry for the last twelve months (February 2014-January 2015). More notable for the last six to twelve months were the number of states ranking in the wet third of the historical record and those in the West having record warm temperatures.
|
|
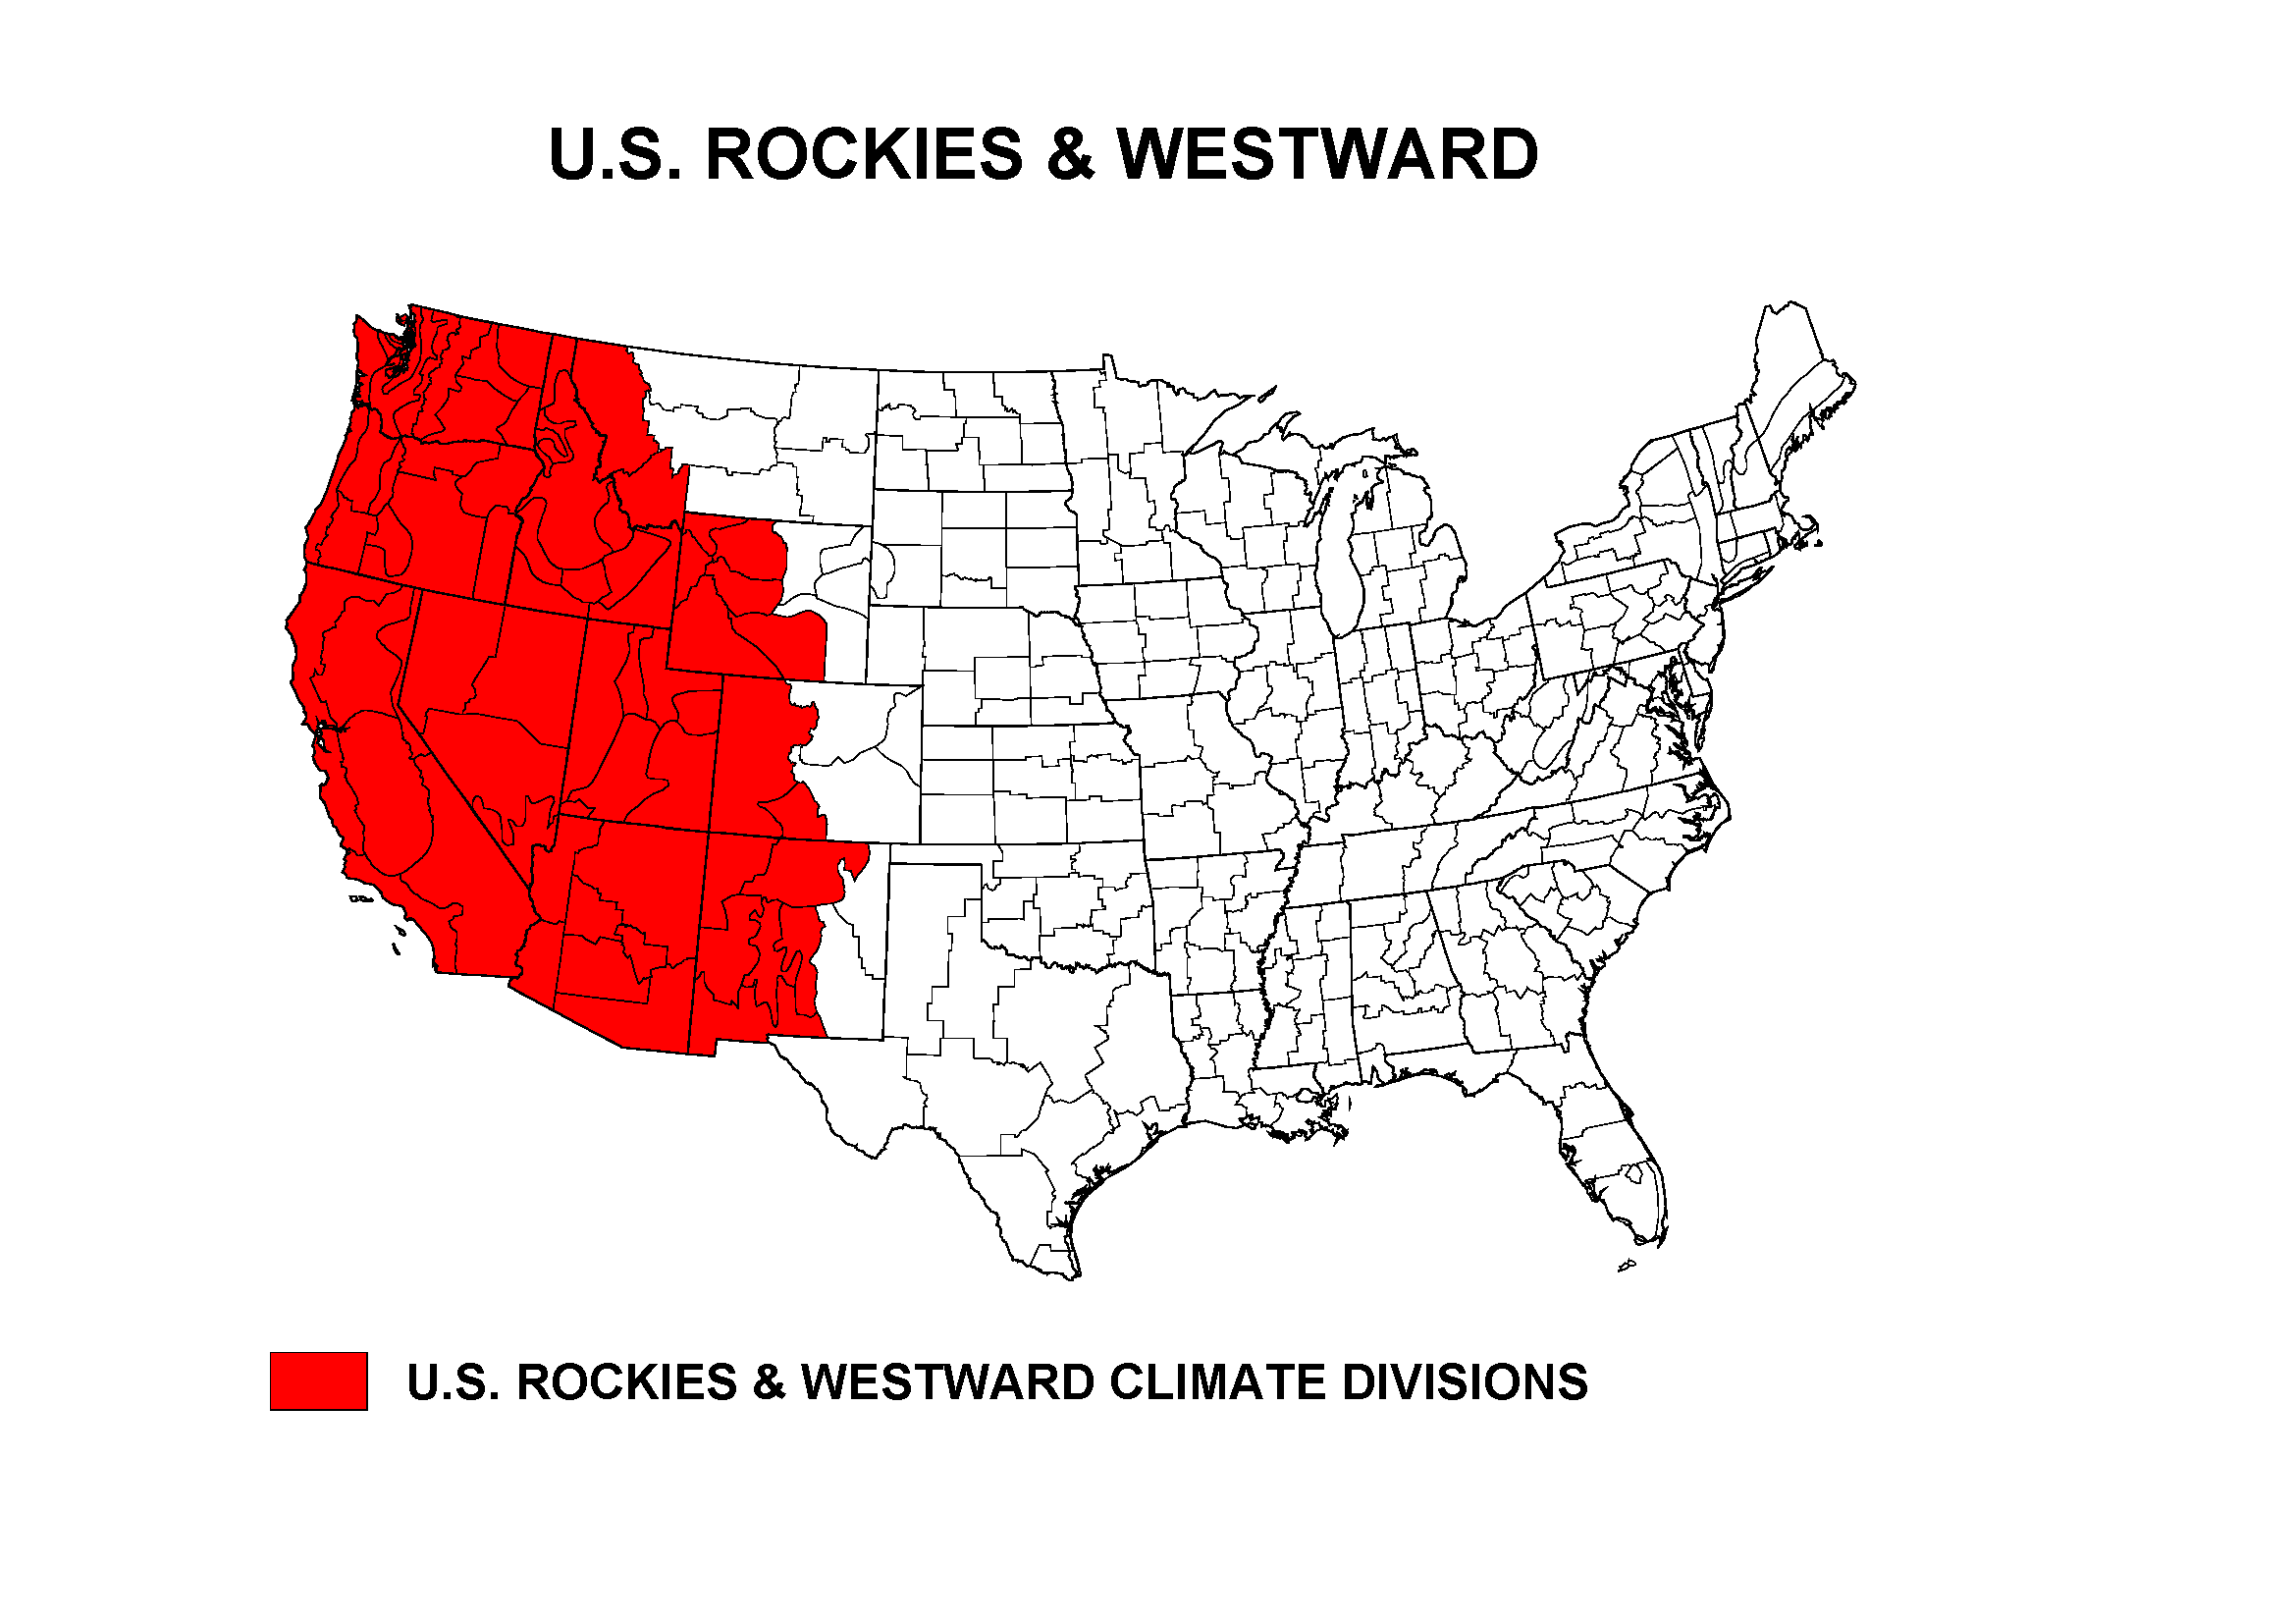
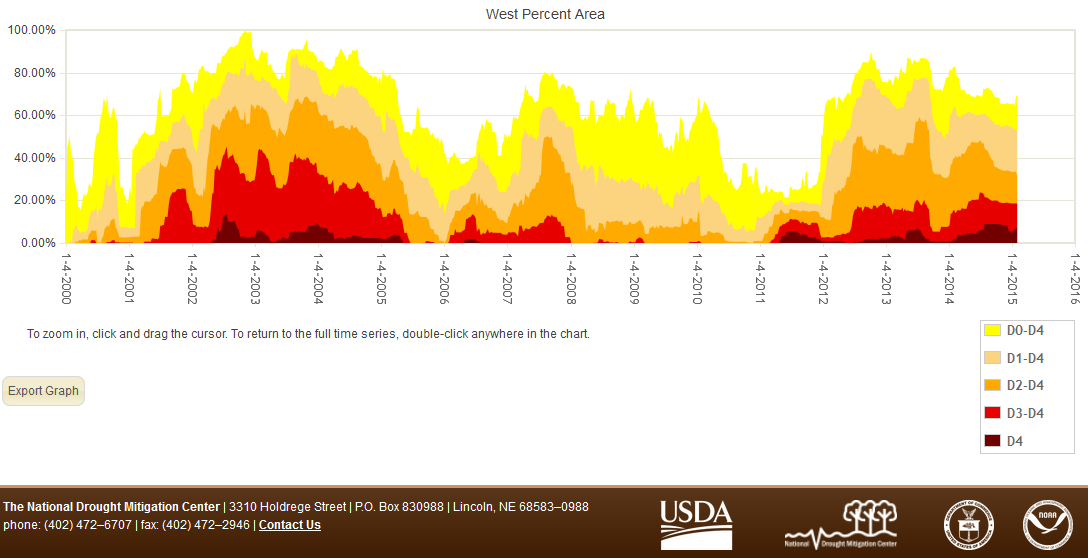
Percent area of the Western U.S. in moderate to extreme drought, January 1900 to present, based on the Palmer Drought Index.
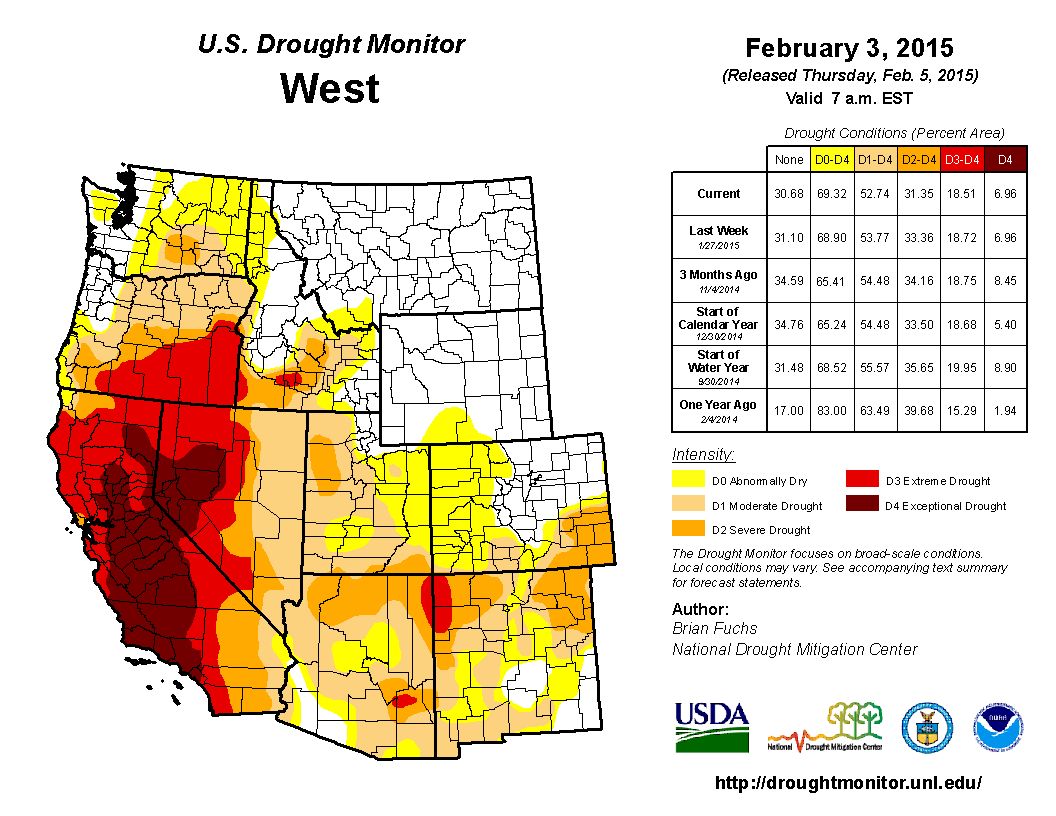
As noted above, dry weather has dominated the West for much of the last three years, resulting in significant hydrological (low lake, reservoir, and stream levels) and agricultural impacts. According to the USDM, 52.7 percent of the West was experiencing moderate to exceptional drought at the end of January, which is slightly less than the previous month. The Palmer Drought Index percent area statistic for the West was 39.0 percent, an increase of about 7 percent compared to the previous month.
The record warm temperatures in the West during the last several years have increased evaporation and exacerbated the drought conditions. This is easily seen by comparing the SPI to the SPEI for California for several time periods ending in January 2015. The lack of precipitation for the last several years has given the state an SPI rank of 37th driest for the last 12 months (February 2014-January 2015), second driest for the last 24 months (behind February 1989-January 1991), second driest for the last 36 months (behind 1988-1991), fourth driest for the last 48 months, and ninth driest for the last 60 months. When temperature-defined moisture demand is included via the SPEI, the state has a rank of fifth driest for the last 12 months; driest for the last 24, 36, and 48 months; and second driest for the last 60 months (behind 1987-1992).

|
|
 |
 |
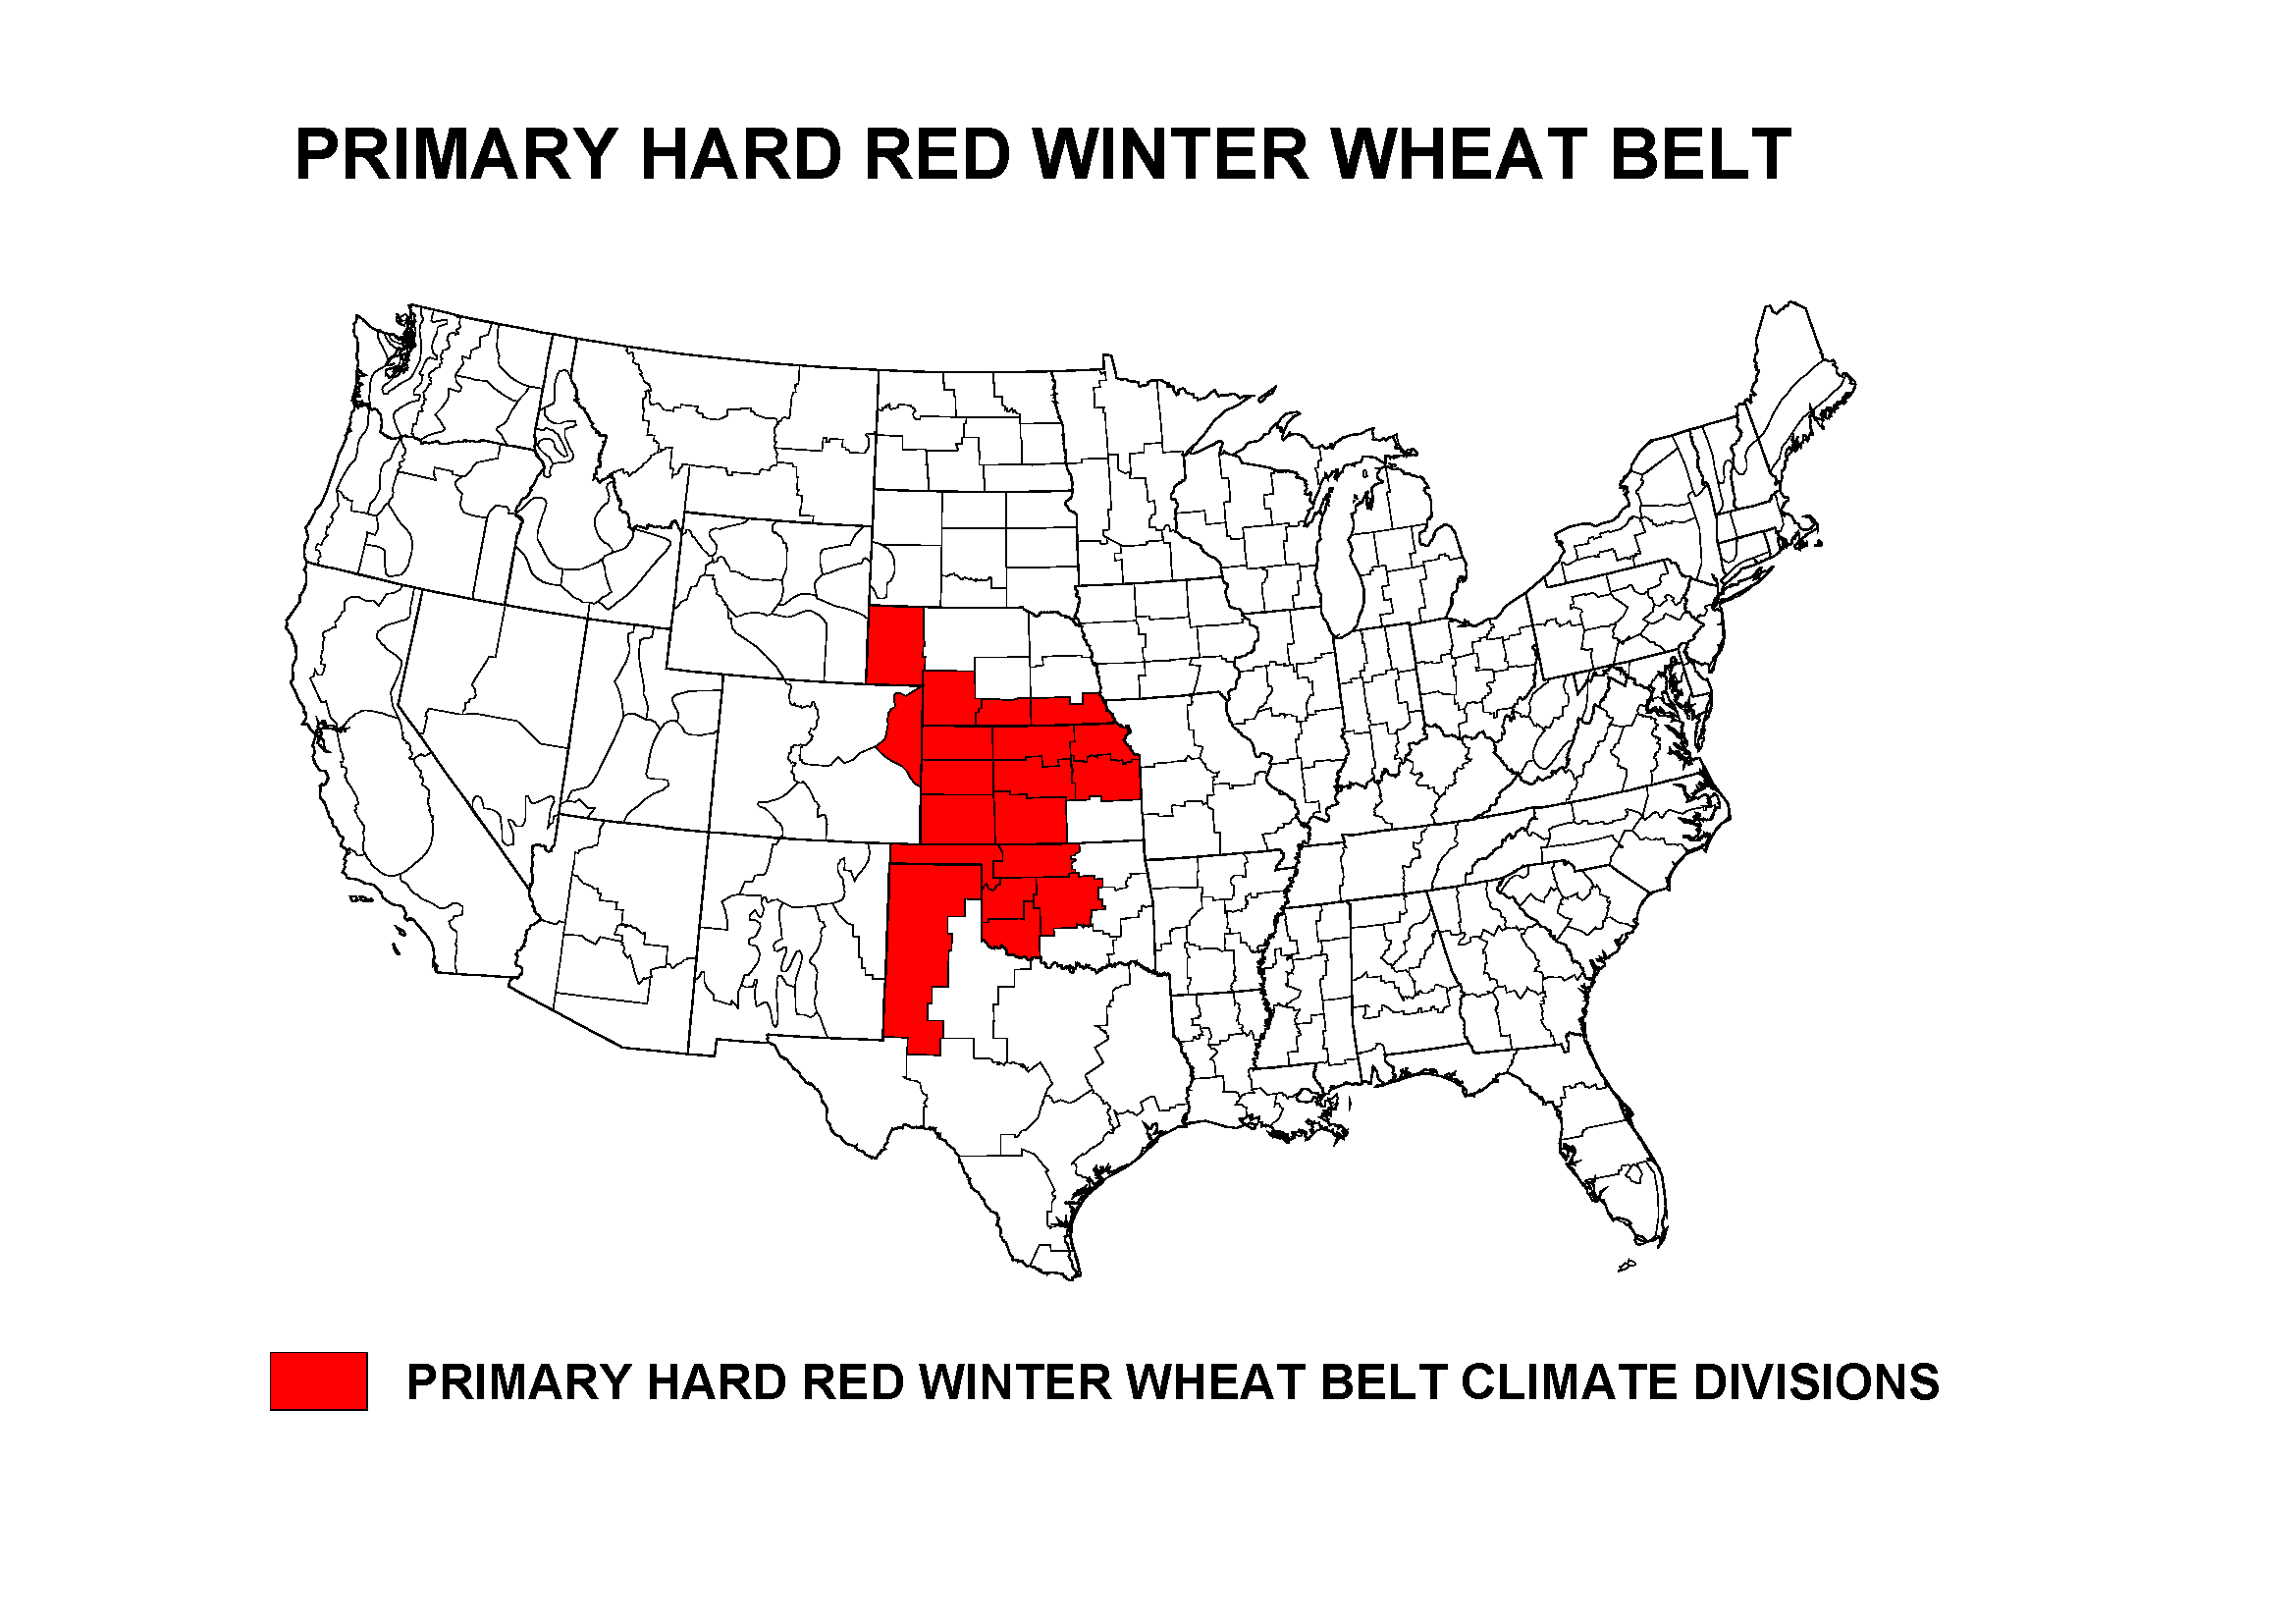
October marks the start of the growing season for the Primary Hard Red Winter Wheat agricultural belt. While portions of the region were drier than normal this month, January 2015 ranked in the middle of the 1895-2015 record for precipitation at 61st wettest/61st driest, and 34th warmest for temperature, regionwide. The growing season to date ranked as the 55th driest and 26th warmest October-January.
NOAA Regional Climate Centers:
A more detailed drought discussion, provided by the NOAA Regional Climate Centers and others, can be found below.
West
As described by the High Plains Regional Climate Center, most of the region experienced below normal temperatures the first half of the month, while the last half of the month was well above normal. Ultimately, monthly average temperatures were at or above normal for the region. Overall, it was a fairly dry month across the High Plains region as most of the region received less than 50 percent of normal precipitation and only a few isolated areas received at least 150 percent of normal precipitation. With the exception of the mountainous areas, typical liquid equivalent precipitation for the month of January is less than an inch across the region. With this in mind, even with little to no precipitation, deficits do not build quickly over the winter months. Conversely, precipitation totals at the higher end of the spectrum typically only contribute a small amount to the annual totals.
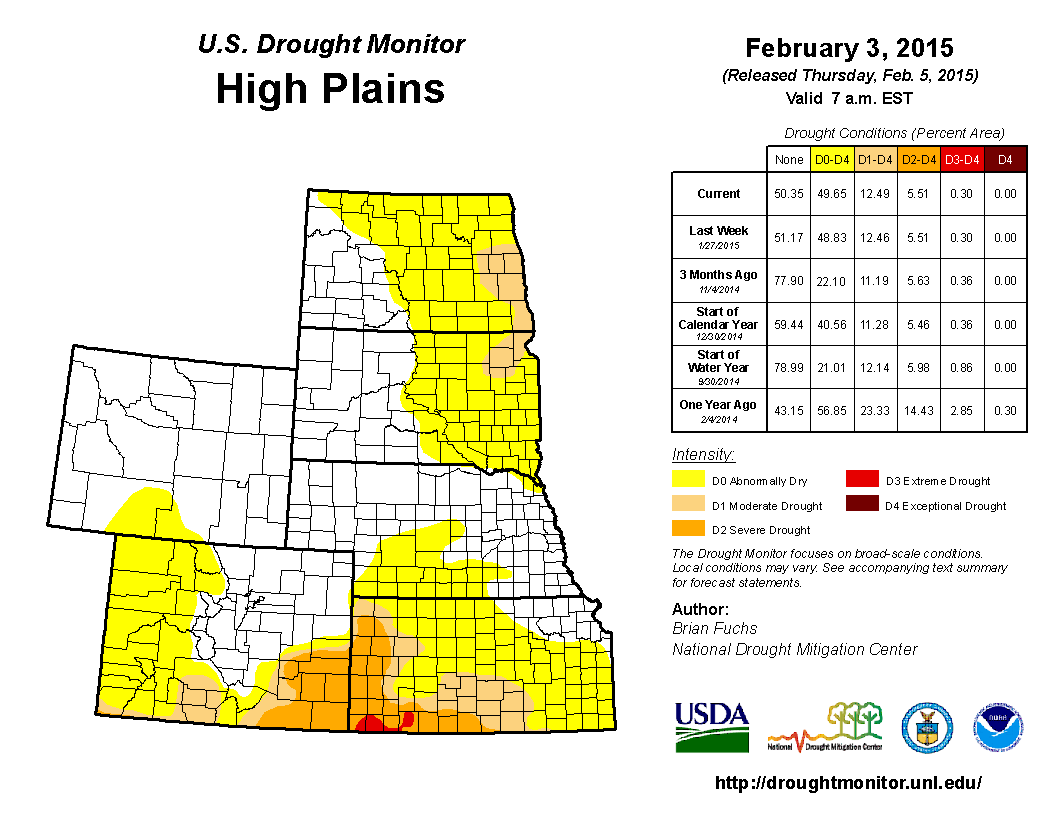
According to the USDM, there were only slight changes to drought conditions over the past month. For much of the High Plains region, drought improvements or developments are not usually expected as this is typically the driest season of the year. Over the past month, the total area in drought (D1-D4) increased to just over 12 percent with moderate drought conditions (D1) expanding across eastern North Dakota. Drought conditions in South Dakota and across the southern part of the region, in Colorado and Kansas, remained largely unchanged. However, abnormally dry conditions (D0) expanded eastward in Kansas and Nebraska, and also across western Colorado and into southern Wyoming. A major winter storm at the end of the month brought rain and snow to portions of Nebraska and Kansas, so a contraction of abnormally dry conditions may occur there. Although drought conditions have eased or have been completely eliminated over much of the High Plains region, impacts can still be felt. In the spring of 2014, enrollment for Livestock Forage Disaster Assistance began under the 2014 Farm Bill. This allows for the retroactive coverage of losses from 2012 and 2013, and also 2014. According to the USDA, over $2.7 billion in payments have already gone out. The states with the most payments included Oklahoma, Texas, Nebraska, Kansas, and Missouri. Nebraska producers received payments of $512.89 million, while Kansas producers received payments of $461.26 million. These figures cover the time period of October 2011 to December 2014.
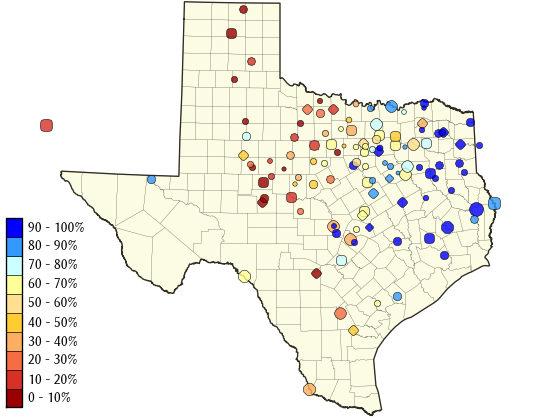
As explained by the Southern Regional Climate Center, with the exception of northern and central Oklahoma, January was a slightly cooler than normal month across the Southern region. It was a drier than normal month for all states in the Southern region except for Texas, and Louisiana. Counties in western Tennessee and eastern Arkansas received only between 25 to 50 percent of normal, while surrounding counties faired only slightly better with totals ranging between 50-75 percent of normal. Similar anomalies were also observed throughout most of Oklahoma. Precipitation totals were near to slightly above normal across much of Louisiana and central Arkansas. Conversely, conditions were quite wet in Texas, with a bulk of the stations in the state reporting over 150 percent of normal. Many stations in the Trans Pecos climate division reported over twice the monthly expectation.
Drought conditions did not change much over the past month. Areas of northern Texas and southern Oklahoma are still experiencing extreme and exceptional drought. Similarly, counties in south central Texas are still categorized as moderate to extreme drought. Dry conditions along the Arkansas and Tennessee border resulted in some expansion of moderate drought. In a positive turn of events with respect to the ongoing lingering drought in Texas, The Houston Chronicle reported that Texas cattle herds are starting to rebound. The article reported that bovine inventories in the state had hit a 48-year low in 2014, but a report by the USDA has numbers increasing by as much 6 percent as of January, 2015. In Texas, the cold weather and winter storms created some havoc with the harvesting of cotton. Frozen precipitation and high humidity have kept the cotton yields idle which could cause problematic delays in harvesting. Soil moisture remained good in the Lower Valley due to their wetter-than-normal season but in the northern parts of Texas, soil moisture is declining (Information provided by the Texas Office of State Climatology).
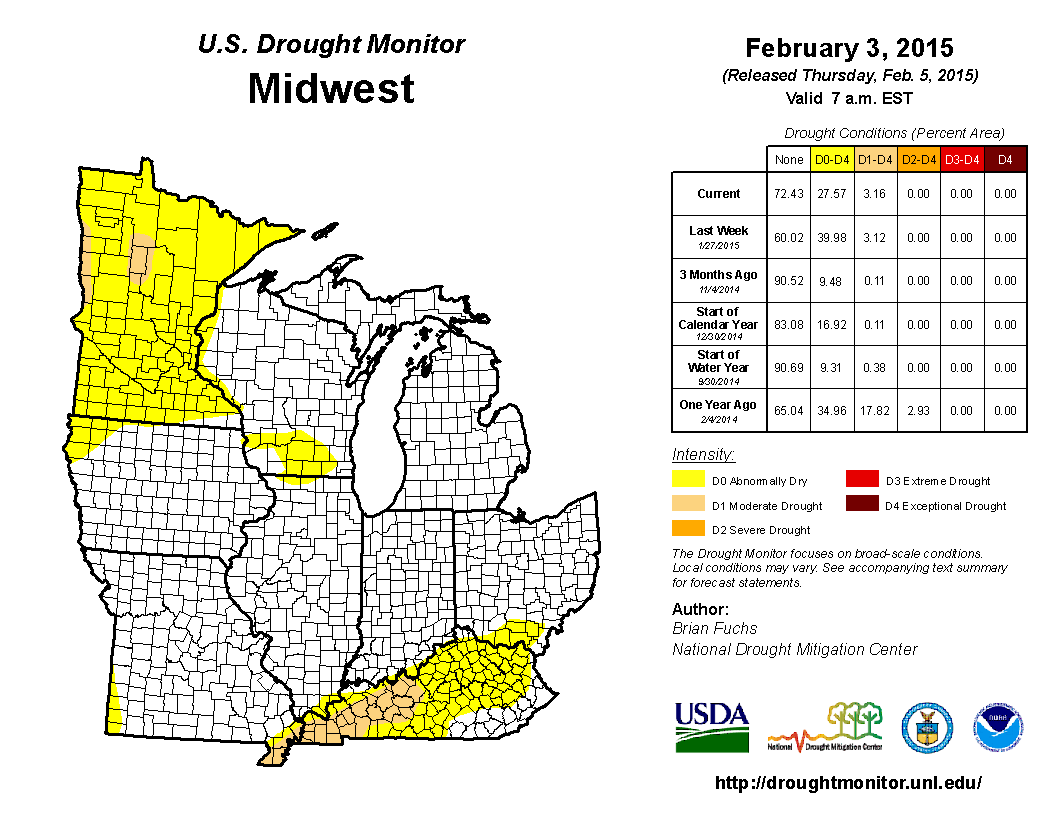
As summarized by the Midwest Regional Climate Center, January precipitation was below normal for nearly the entire region, while temperatures ranged from 5 degrees F (3 C) above normal in the northwest corner of the Midwest to 5 degrees F (3 C) below normal in the northeast corner of the region. Small areas of southeast Missouri, northern Ohio, and northwest Minnesota were slightly above normal, while the remaining areas were below normal with deficits of 1 inch (25 mm) or more in much of the southern third of the Midwest. Precipitation totals were less than half of normal in parts of Missouri, Iowa, Minnesota, Wisconsin, Illinois, Kentucky, and Michigan. The dry conditions in the region caused the USDM to expand Abnormally Dry conditions across large swaths of the Midwest in January. The storm that began on the 31st reversed much of this expansion. Despite Abnormally Dry conditions expanding from 17 percent to 40 percent of the region during the month, only about 3 percent of the Midwest was rated in drought as of the January 27th release of the USDM.
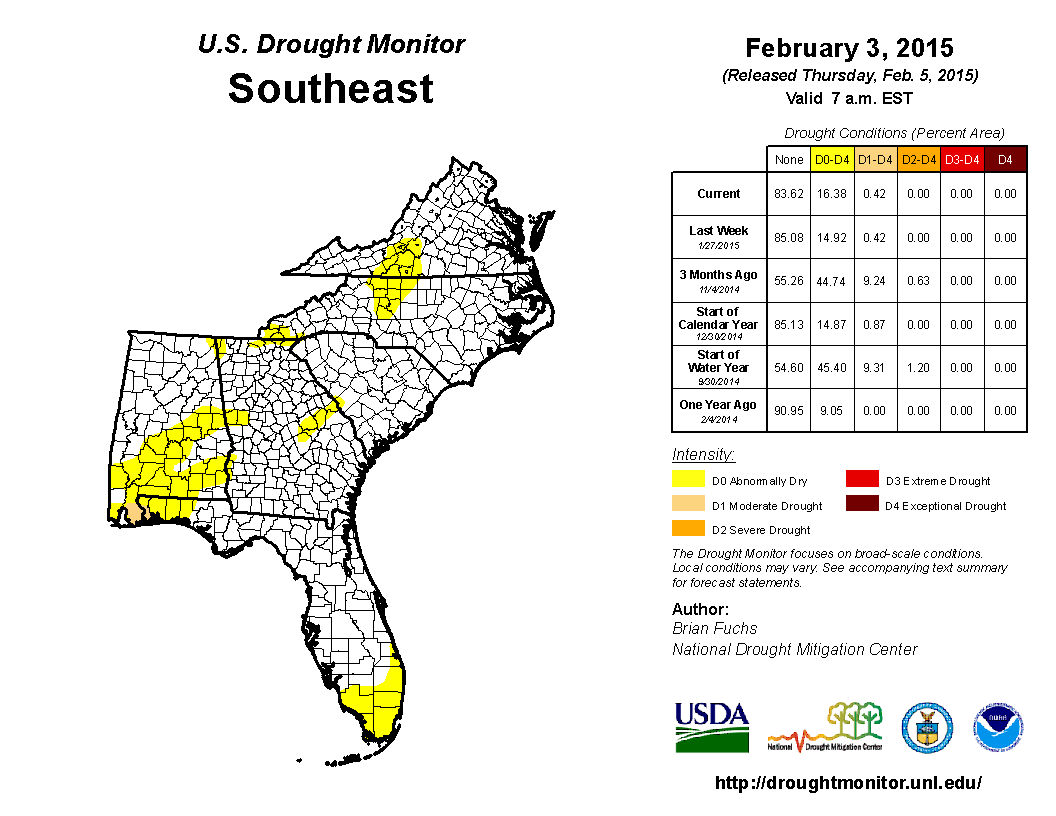
As noted by the Southeast Regional Climate Center, mean temperatures in January were near average across much of the Southeast region and precipitation was slightly below normal. The wettest locations were found across portions of central Florida, eastern North Carolina, and Tidewater Virginia, where monthly precipitation departures exceeded 1 to 3 inches (25.4 to 76.2 mm) above normal. The driest locations were found across southwestern Virginia and southern Florida, where monthly precipitation ranged between 5 and 50 percent of normal. Mean temperatures were above average in Puerto Rico and the U.S. Virgin Islands during January, and precipitation was near average for most of the islands.
Little change in drought conditions was noted for the Southeast region during January. The percentage of the region under drought-free conditions (less than D1) remained just above 99 percent from December 30th through January 27th. Moderate (D1) drought conditions persisted across a small portion of coastal Alabama centered on Mobile Bay as well as the extreme western tip of the Florida Panhandle. Agricultural impacts were relatively minimal across the region. Higher yields on winter cabbage were aided by slightly warmer-than-average temperatures across the Florida Panhandle during January. However, canola and carinata (oilseed) fields in southwestern Georgia sustained considerable damage due to unusually cold temperatures at the beginning of the month.
As explained by the Northeast Regional Climate Center, 2015 got off to a cold start in the Northeast. January's average temperature of 20.0 degrees F (-6.7 degrees C) was 3.2 degrees F (1.8 degrees C) colder than normal. All twelve states experienced colder-than-normal temperatures. January ended on the dry side of normal for the Northeast. The region picked up 2.72 inches (69.09 mm) of precipitation, 87 percent of normal. Seven states had a drier-than-normal January, with departures ranging from 72 percent of normal in West Virginia to 93 percent of normal in Connecticut and Maine. For the five wet states, departures ranged from 102 percent of normal in New Hampshire to 145 percent of normal in Delaware (the state's 18th wettest January on record). According to the USDM released on January 8, 11 percent of the Northeast was abnormally dry. Conditions deteriorated in parts of Pennsylvania and New York during the month. By the end of the month, 18 percent of the region was abnormally dry.
As summarized by the Western Regional Climate Center, January was warmer than normal for a majority of the West, with the greatest departures from normal observed in the Great Basin and along the borders between Utah, Colorado, and Wyoming. Persistent high pressure over the West Coast kept California, Oregon, and Nevada drier than normal. Several storms skirted the ridge, delivering above normal precipitation to the Desert Southwest and the northern tier of the West.
Areas that do not typically receive a large portion of their annual precipitation in January saw above normal totals this month. In northeastern New Mexico, Clayton, reported its wettest January in a 118-year record at 1.56 in (40 mm) for the month, 457% of normal. January is typically the driest month of the year at Clayton. Further west, Winslow, Arizona, observed 1.63 in (41mm) this month. This is 1.11 in (28 mm) above normal and the 4th wettest January in a 123-year record, and also roughly 21% of Winslow's annual rainfall. Winslow typically receives only 6% of its annual rainfall in January. In southern Arizona, Tucson observed its 4th wettest January in a 69-year record with 2.54 in (65 mm), 270% of normal. On January 30th, an upper level low-pressure system combined with a warm sub-tropical air mass led to Tucson recording its wettest January day on record at 1.39 in (35 mm). To the north, in Montana, January is typically one of the drier months of the year with normal precipitation totals less than 1 in (25 mm). In the north-central part of the state, Havre receive 1.3 in (33 mm) precipitation, 394% of normal and the 3rd wettest January since records began in 1961. In the southern part of the state, Billings received 227% normal precipitation and also recorded its 8th snowiest January (18.7 in/48 cm) since records began in 1934. The far northern Cascades as well as the northern Rockies accumulated snow this month and reported snow water equivalent (SWE) values slightly below to slightly above normal. The central and southern Rockies saw SWE values in the 75-90% of normal range at the end of the month.
Following a wet December, drier to much drier than normal conditions returned to California, Nevada, and Oregon this month, with precipitation less than 50% of normal across large portions of these states. SWE values in the Sierra Nevada and Cascades were only 20-40% of normal at the end of the month. In California, San Francisco recorded no January precipitation for the first time in its long 167-year record; normal is 4.5 in (114 mm). The previous record for driest January was set last year, 0.06 in (2 mm) in 2014. Sacramento also experienced its driest January on record with a total of 0.01 in (0.3 mm). Records for Sacramento began in 1877. In far northern California, only 1.73 in (44 mm) fell in the gauge at Crescent City. This is 8.66 in (220 mm) below normal and the driest January at Crescent City since records began in 1949. Across the border in Oregon, Klamath Falls recorded 0.4 in (10 mm) in January, 22% of normal and the 5th driest since records began in 1948. Further east, 0.2 in (5 mm) of precipitation were recorded in Elko, Nevada, 18% of normal. Elko typically observes 10.5 in (27 cm) snowfall in January, though only trace snowfall was reported this month. Only 5 other Januaries in Elko's 128-year record have had no measurable snowfall. Southwest Wyoming and northwest Colorado also saw a large area of below normal precipitation this month. Precipitation at Rock Springs, Wyoming, totaled 0.01 in (0.3 mm). This was 2% of normal and the driest January since records began in 1948.
Pacific Islands: According to reports from National Weather Service offices, the Pacific ENSO Applications Climate Center (PEAC), and partners, conditions varied across the Pacific Islands.
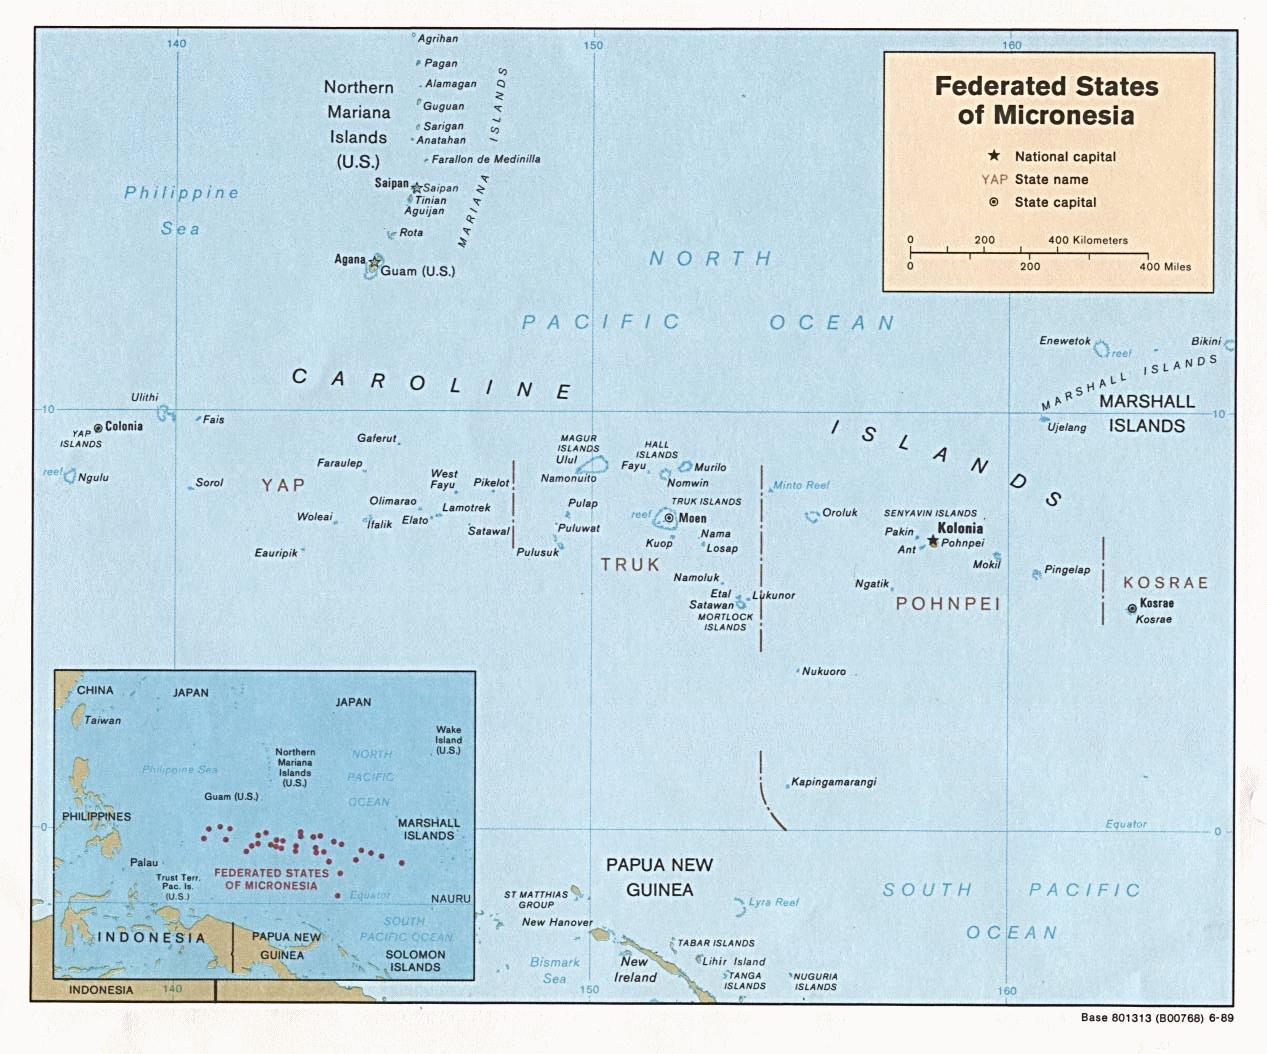
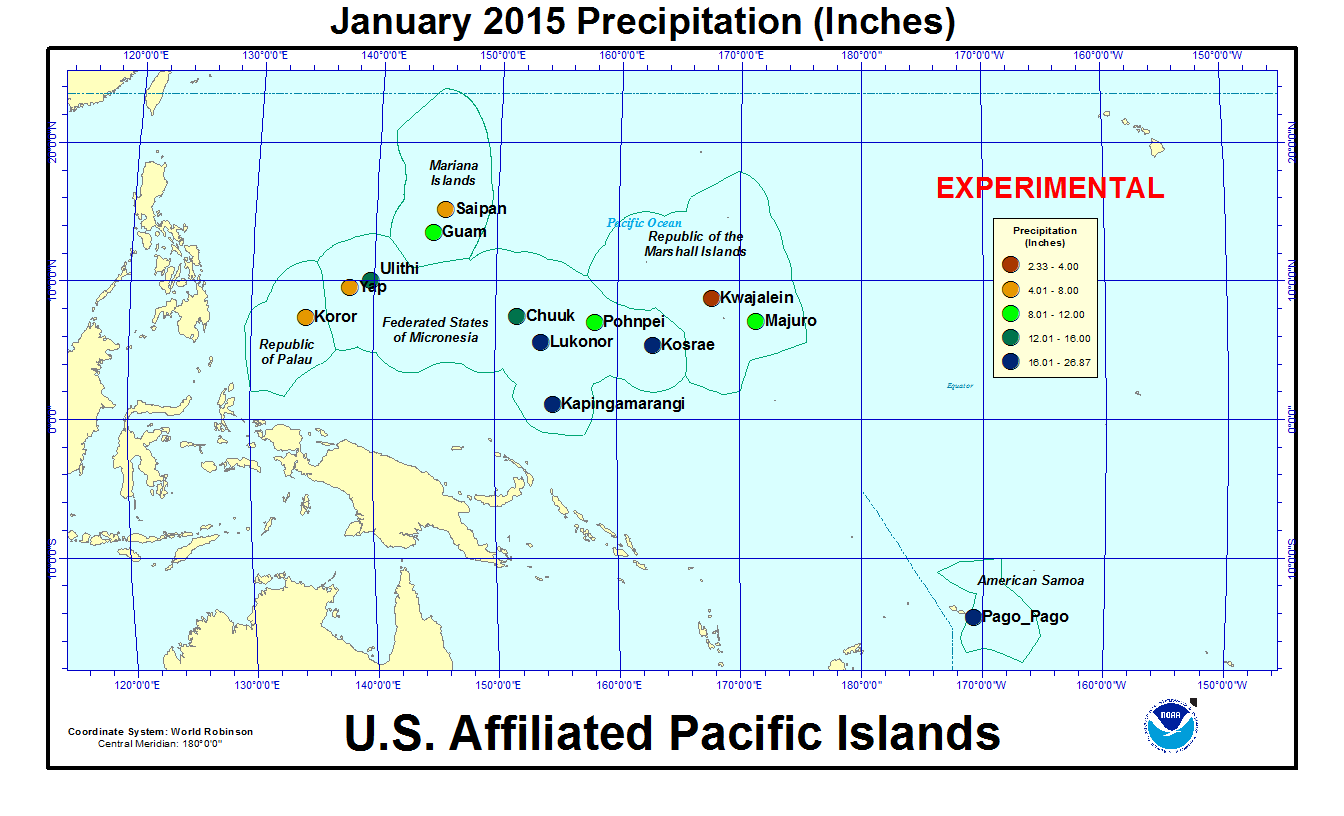
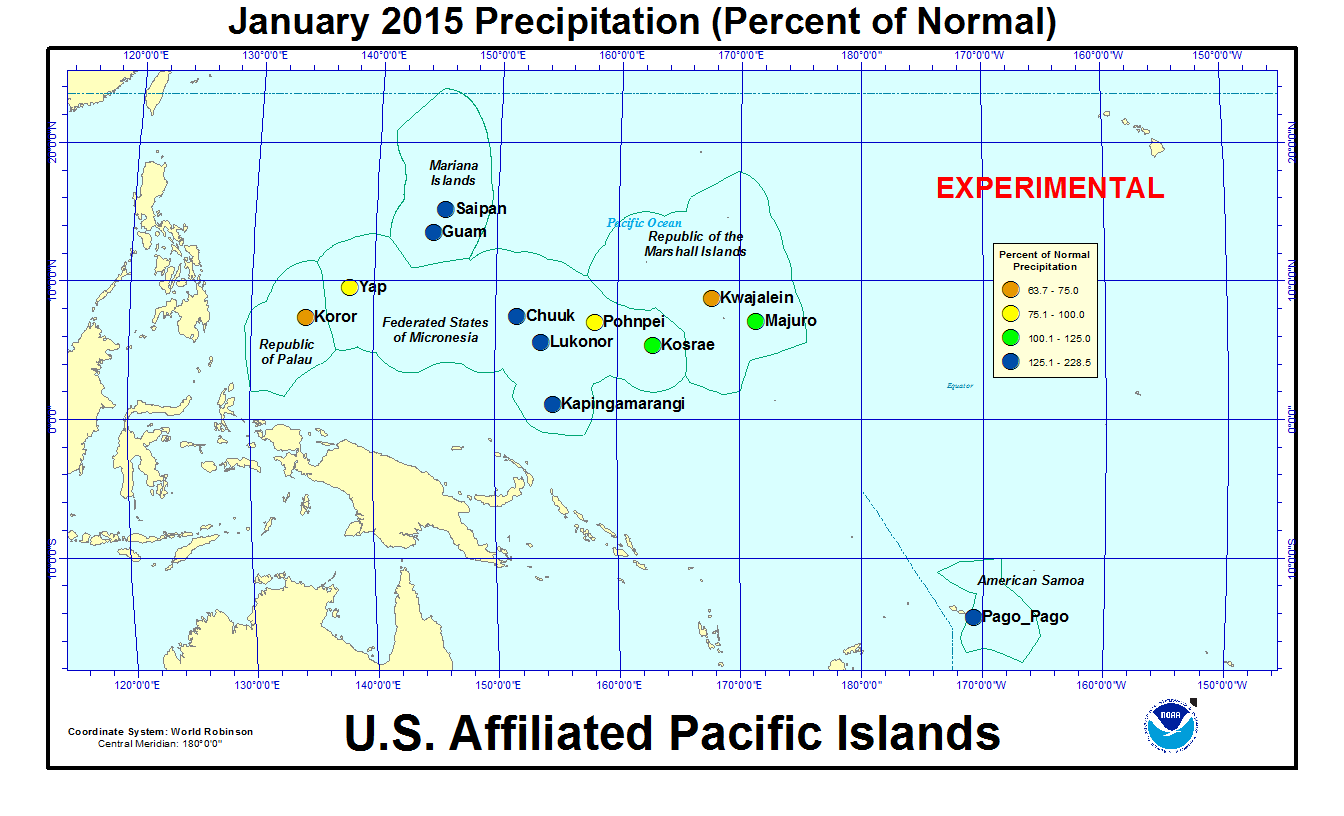
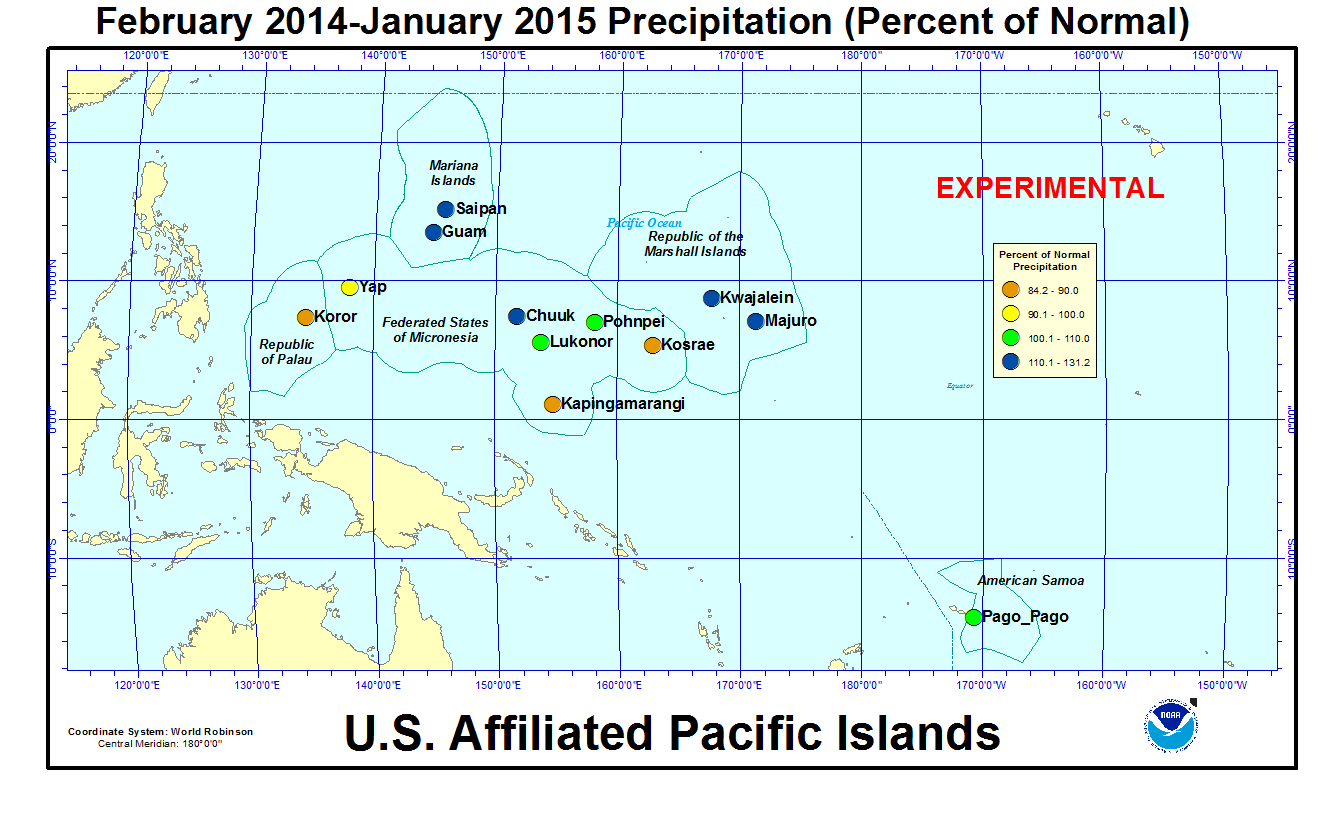
In the U.S. Affiliated Pacific Islands (maps — Micronesia, Marshall Islands, basinwide), January 2015 was generally wetter than normal at most of the primary stations. Kwajalein, Pohnpei, Koror, and Yap were drier than normal.
The rainfall amounts at most of the primary stations were above the minimum thresholds (4 or 8 inches) required to meet most monthly water needs. The 4- and 8-inch thresholds are important because, if monthly precipitation falls below the threshold, then drought becomes a concern. Koror (with 6.48 inches), Kwajalein (2.33 inches), and Yap (5.86 inches) were below the 8-inch threshold. January marks the second consecutive month that Kwajalein was drier than the 8-inch threshold, while the other two stations were wetter than the 8-inch threshold in December. Other stations in Micronesia that reported precipitation totals for January include Ulithi (which was wetter than the 8-inch threshold), Rumung (which was at the 8-inch threshold with 7.99 inches of rain), and North Fanif (which received 7.18 inches of rain). Ulithi was drier than the 8-inch threshold in December and November, while North Fanif and Rumung were wetter than the 8-inch threshold in December.
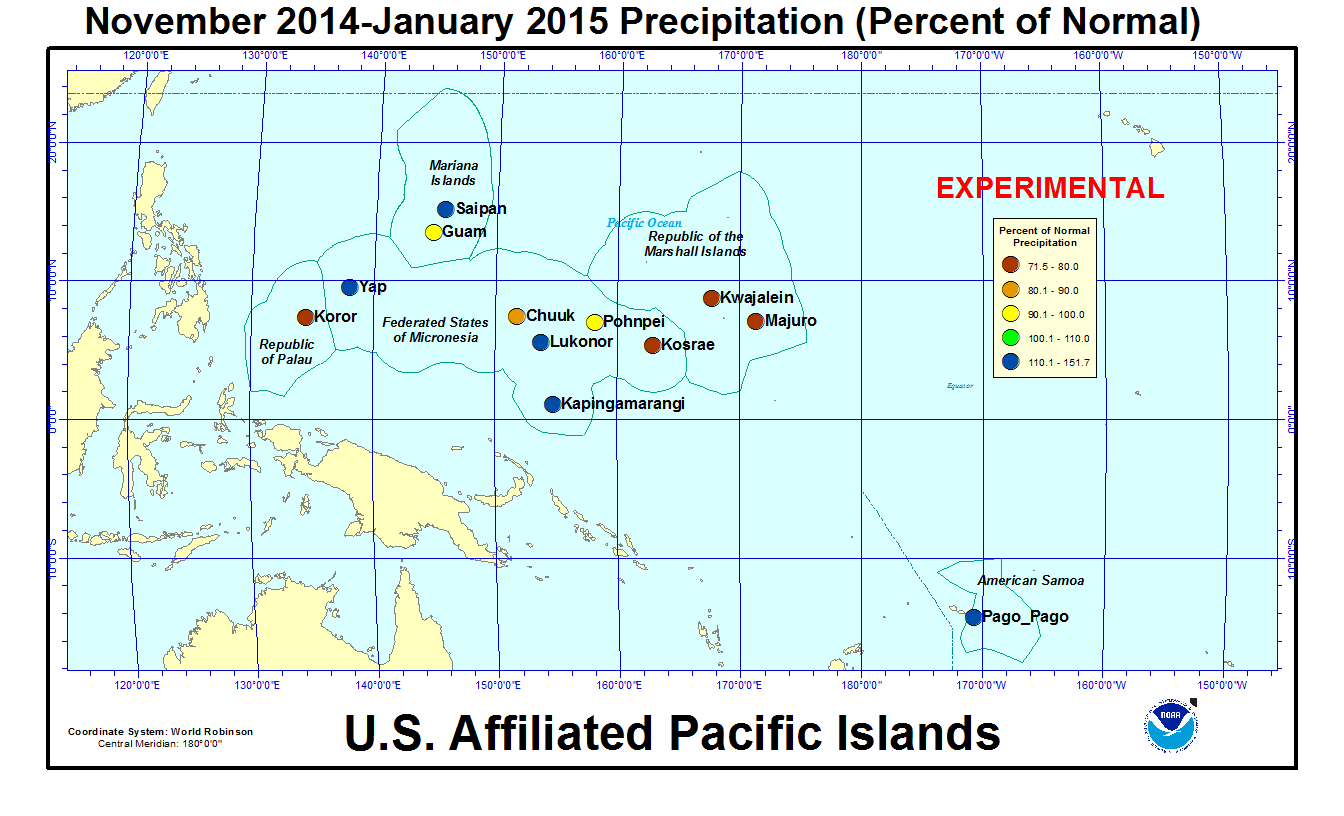
As measured by percent of normal precipitation, Koror and Kosrae were drier than normal in both the short term (three-month time scale, November 2014-January 2015) and long term (12-month time scale, February 2014-January 2015). Guam, Chuuk, Pohnpei, Kwajalein, and Majuro were dry in the short term but wet in the long term. Kapingamarangi and Yap were wet in the short term but dry in the long term. Saipan, Lukonor, and Pago Pago were wetter than normal at both the short and long term time scales.
| Station Name | Feb 2014 | Mar 2014 | Apr 2014 | May 2014 | Jun 2014 | Jul 2014 | Aug 2014 | Sep 2014 | Oct 2014 | Nov 2014 | Dec 2014 | Jan 2015 | Feb- Jan |
|---|---|---|---|---|---|---|---|---|---|---|---|---|---|
| Chuuk | 492% | 89% | 111% | 116% | 76% | 125% | 121% | 166% | 120% | 66% | 57% | 142% | 125% |
| Guam NAS | 170% | 141% | 108% | 99% | 98% | 290% | 62% | 108% | 164% | 75% | 76% | 213% | 110% |
| Kapingamarangi | 112% | 81% | 43% | 83% | 56% | 86% | 96% | 109% | 130% | 140% | 116% | 229% | 89% |
| Koror | 91% | 68% | 224% | 63% | 57% | 121% | 77% | 137% | 63% | 54% | 118% | 64% | 84% |
| Kosrae | 104% | 82% | 150% | 93% | 117% | 175% | 59% | 77% | 114% | 68% | 86% | 116% | 87% |
| Kwajalein | 523% | 475% | 366% | 80% | 104% | 120% | 58% | 88% | 154% | 96% | 68% | 74% | 131% |
| Lukonor | 206% | 138% | 72% | 116% | 110% | 78% | 77% | 146% | 138% | 70% | 86% | 228% | 102% |
| Majuro | 177% | 91% | 246% | 75% | 90% | 201% | 82% | 134% | 88% | 66% | 67% | 106% | 113% |
| Pago Pago | 97% | 65% | 152% | 81% | 154% | 333% | 60% | 40% | 29% | 136% | 141% | 201% | 107% |
| Pohnpei | 225% | 112% | 87% | 87% | 121% | 108% | 74% | 128% | 100% | 108% | 104% | 78% | 104% |
| Saipan | 55% | 167% | 168% | 205% | 92% | 113% | 71% | 191% | 105% | 265% | 47% | 184% | 126% |
| Yap | 91% | 153% | 226% | 39% | 83% | 110% | 65% | 125% | 77% | 84% | 197% | 92% | 100% |
| Station Name | Feb 2014 | Mar 2014 | Apr 2014 | May 2014 | Jun 2014 | Jul 2014 | Aug 2014 | Sep 2014 | Oct 2014 | Nov 2014 | Dec 2014 | Jan 2015 | Feb- Jan |
|---|---|---|---|---|---|---|---|---|---|---|---|---|---|
| Chuuk | 35.70" | 7.43" | 13.80" | 13.06" | 8.91" | 14.92" | 15.55" | 19.44" | 13.78" | 6.99" | 6.46" | 14.32" | 170.36" |
| Guam NAS | 5.14" | 2.91" | 2.74" | 3.36" | 6.08" | 29.39" | 9.08" | 13.66" | 18.77" | 5.51" | 3.87" | 8.56" | 109.07" |
| Kapingamarangi | 10.36" | 9.26" | 5.83" | 9.97" | 7.77" | 12.16" | 7.84" | 10.86" | 10.64" | 13.02" | 11.37" | 20.91" | 129.99" |
| Koror | 7.79" | 5.08" | 16.38" | 7.45" | 9.91" | 22.45" | 10.40" | 16.10" | 7.45" | 6.12" | 13.14" | 6.48" | 128.75" |
| Kosrae | 13.47" | 13.12" | 26.29" | 16.59" | 17.08" | 26.06" | 8.32" | 11.00" | 12.51" | 9.38" | 13.80" | 19.28" | 186.9" |
| Kwajalein | 13.82" | 11.17" | 19.24" | 5.36" | 7.22" | 11.88" | 5.61" | 9.49" | 17.17" | 10.80" | 4.54" | 2.33" | 118.63" |
| Lukonor | 18.42" | 12.76" | 8.18" | 13.58" | 12.85" | 12.50" | 10.80" | 14.79" | 15.57" | 6.37" | 9.65" | 19.16" | 154.63" |
| Majuro | 12.19" | 5.96" | 23.20" | 7.58" | 9.86" | 22.49" | 9.64" | 14.93" | 11.14" | 8.85" | 7.68" | 8.24" | 141.76" |
| Pago Pago | 11.65" | 6.95" | 14.29" | 7.84" | 8.22" | 18.48" | 3.22" | 2.60" | 2.68" | 13.76" | 18.13" | 26.87" | 134.69" |
| Pohnpei | 21.50" | 14.70" | 15.96" | 17.33" | 17.95" | 16.74" | 10.52" | 16.06" | 15.32" | 15.97" | 16.67" | 10.24" | 188.96" |
| Saipan | 1.43" | 3.16" | 4.41" | 4.87" | 3.32" | 10.04" | 9.33" | 19.31" | 11.15" | 14.87" | 1.80" | 4.66" | 88.35" |
| Yap | 4.72" | 6.99" | 12.72" | 3.07" | 9.95" | 16.62" | 9.58" | 16.89" | 9.34" | 7.40" | 16.77" | 5.86" | 119.91" |
| Station Name | Feb 2014 | Mar 2014 | Apr 2014 | May 2014 | Jun 2014 | Jul 2014 | Aug 2014 | Sep 2014 | Oct 2014 | Nov 2014 | Dec 2014 | Jan 2015 | Feb- Jan |
|---|---|---|---|---|---|---|---|---|---|---|---|---|---|
| Chuuk | 7.25" | 8.32" | 12.47" | 11.30" | 11.66" | 11.98" | 12.86" | 11.71" | 11.51" | 10.61" | 11.25" | 10.10" | 136.77" |
| Guam NAS | 3.03" | 2.07" | 2.53" | 3.40" | 6.18" | 10.14" | 14.74" | 12.66" | 11.44" | 7.38" | 5.11" | 4.01" | 99.09" |
| Kapingamarangi | 9.27" | 11.43" | 13.64" | 12.08" | 13.78" | 14.15" | 8.13" | 9.93" | 8.19" | 9.27" | 9.84" | 9.15" | 145.85" |
| Koror | 8.56" | 7.44" | 7.32" | 11.83" | 17.48" | 18.53" | 13.50" | 11.77" | 11.84" | 11.39" | 11.16" | 10.18" | 152.90" |
| Kosrae | 12.93" | 16.06" | 17.51" | 17.75" | 14.64" | 14.91" | 14.22" | 14.22" | 10.94" | 13.83" | 16.11" | 16.67" | 213.87" |
| Kwajalein | 2.64" | 2.35" | 5.26" | 6.72" | 6.93" | 9.87" | 9.74" | 10.74" | 11.18" | 11.28" | 6.66" | 3.16" | 90.41" |
| Lukonor | 8.93" | 9.26" | 11.31" | 11.69" | 11.65" | 15.93" | 14.04" | 10.15" | 11.32" | 9.08" | 11.27" | 8.41" | 151.36" |
| Majuro | 6.88" | 6.58" | 9.42" | 10.11" | 11.01" | 11.17" | 11.69" | 11.17" | 12.73" | 13.44" | 11.39" | 7.74" | 125.25" |
| Pago Pago | 12.00" | 10.68" | 9.39" | 9.66" | 5.33" | 5.55" | 5.38" | 6.53" | 9.26" | 10.14" | 12.84" | 13.34" | 125.57" |
| Pohnpei | 9.55" | 13.17" | 18.41" | 19.96" | 14.81" | 15.43" | 14.26" | 12.55" | 15.27" | 14.83" | 16.08" | 13.18" | 182.36" |
| Saipan | 2.59" | 1.89" | 2.63" | 2.38" | 3.62" | 8.91" | 13.13" | 10.09" | 10.62" | 5.61" | 3.85" | 2.53" | 70.25" |
| Yap | 5.19" | 4.56" | 5.63" | 7.85" | 12.04" | 15.08" | 14.82" | 13.50" | 12.18" | 8.83" | 8.51" | 6.39" | 120.31" |
[top]
State/Regional/National Moisture Status
A detailed review of drought and moisture conditions is available for all contiguous U.S. states, the nine standard regions, and the nation (contiguous U.S.):
| northeast u. s. | east north central u. s. | central u. s. |
| southeast u. s. | west north central u. s. | south u. s. |
| southwest u. s. | northwest u. s. | west u. s. |
| Contiguous United States |
[top]
Contacts & Questions