|
Contents Of This Report: |

|
Please note that the values presented in this report are based on preliminary data. They will change when the final data are processed, but will not be replaced on these pages.
National Drought Overview
|
|
[top]
Detailed Drought Discussion
Overview
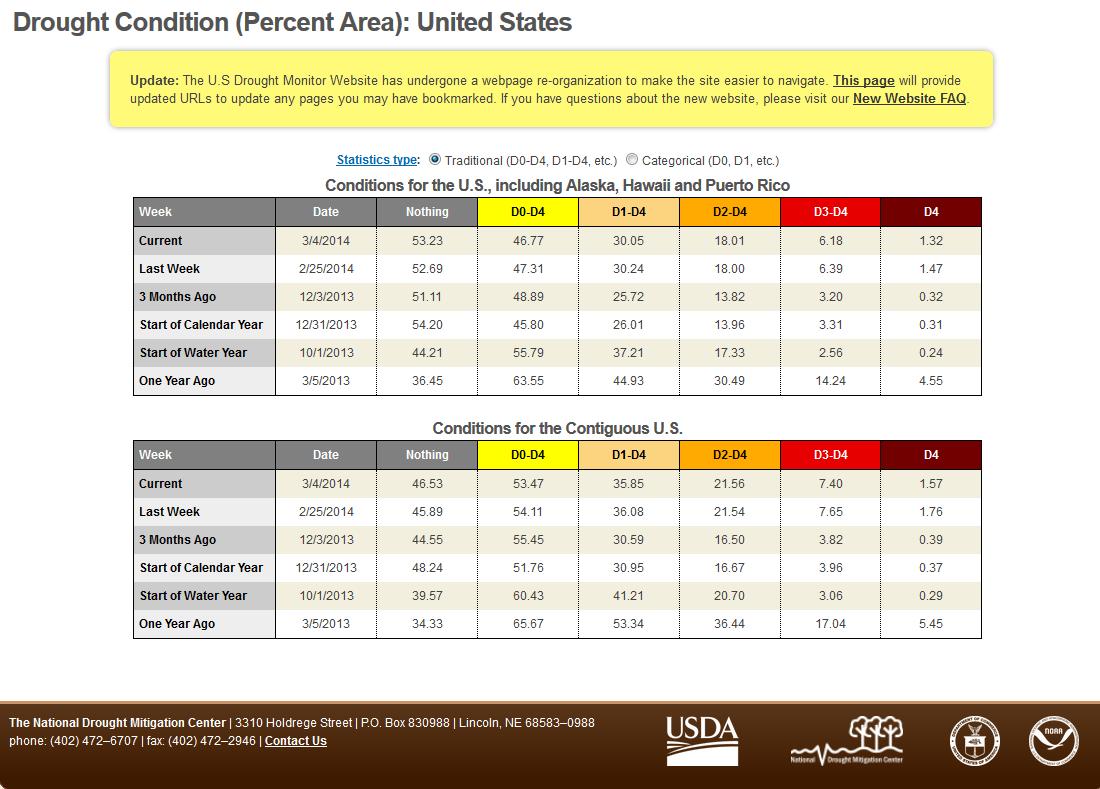
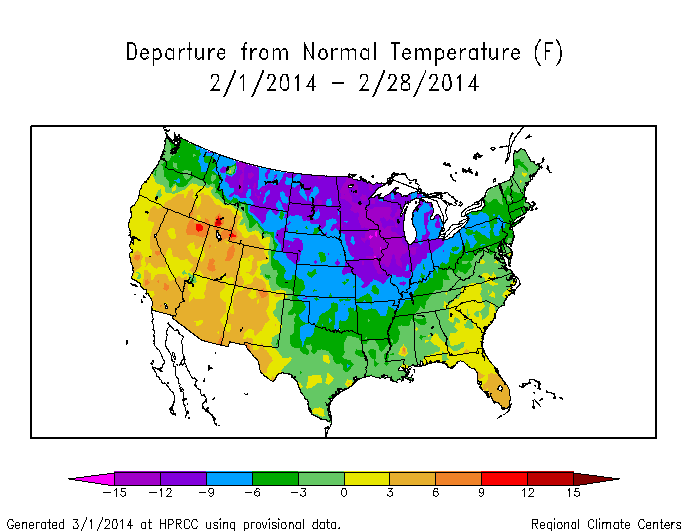
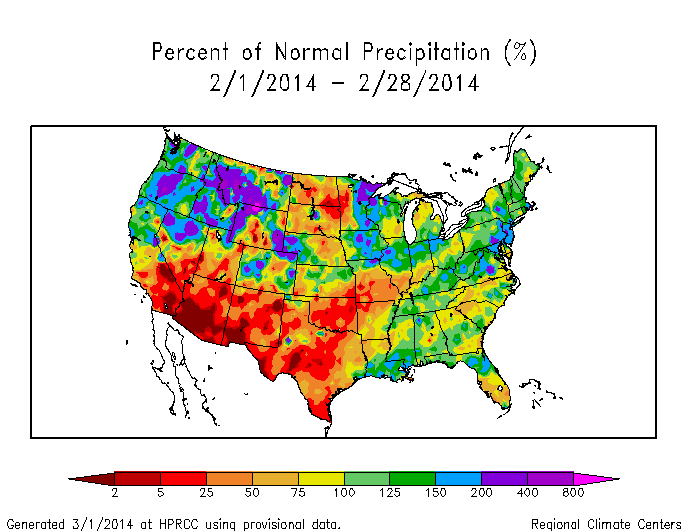
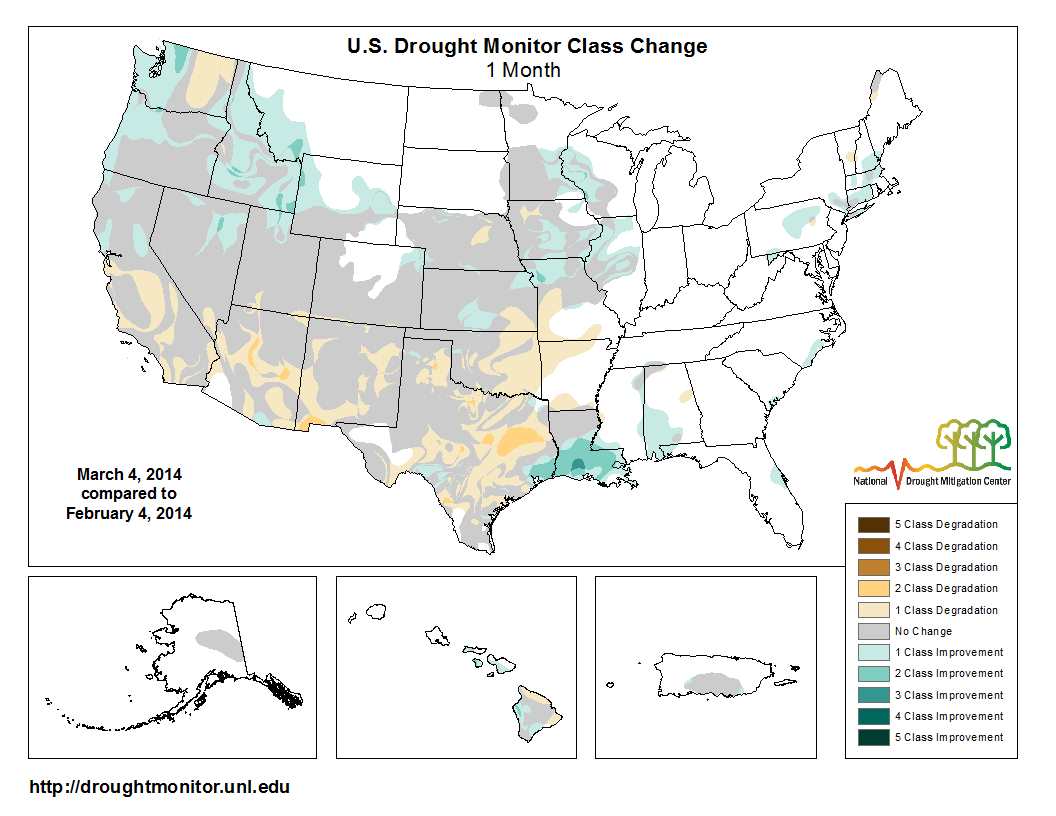
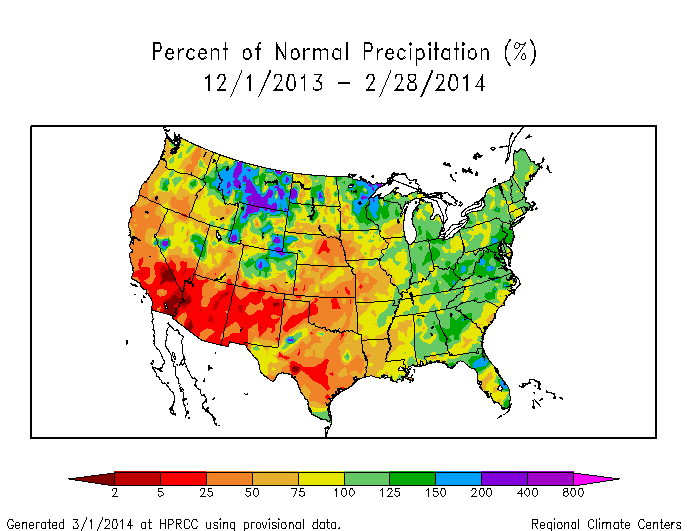
The long-wave circulation pattern for February 2014 over North America was a continuation of the overall pattern seen throughout the winter, but with some changes. It consisted of a dominant upper-level ridge over the eastern North Pacific and western North America with a trough over eastern North America, but short-wave troughs undercut the western ridge, allowing Pacific weather systems to penetrate into the West. Most of the weather systems made landfall in the Pacific Northwest and moved across the Northern Rockies before drying out over the Northern Plains, with the Southwest to Southern Plains well south of the storm track. Temperatures averaged above normal beneath the upper-level ridge in the West, and below normal beneath the upper-level trough east of the Rockies. Storm tracks in the eastern CONUS ran from the Upper Midwest to Northeast, and from the Gulf Coast and Tennessee Valley to Mid-Atlantic Coast. These storm tracks produced a pattern of above-normal precipitation in the Pacific Northwest to Northern and Central Rockies, and across parts of the Midwest, Northeast, and Southeast. Drier-than-normal weather dominated the Southwest, most of the Great Plains, and parts of the Mid-Mississippi Valley. Coastal Alaska was drier than normal with the eastern interior regions wetter than normal. The precipitation pattern across Hawaii was mixed. When integrated across the CONUS, February 2014 ranked as the 65th driest (56th wettest) February in the 1895-2014 record. The precipitation reduced drought in the Midwest, Northwest, and Gulf Coast, but February's dryness expanded drought in the Southern Plains and Southwest. On balance, the national drought footprint shrank to 30.1 percent of the U.S. as a whole, according to USDM statistics. According to the Palmer Drought Index, which goes back to the beginning of the 20th century, 30.3 percent of the CONUS was in moderate to extreme drought at the end of February, an increase of about 4 percent compared to last month.
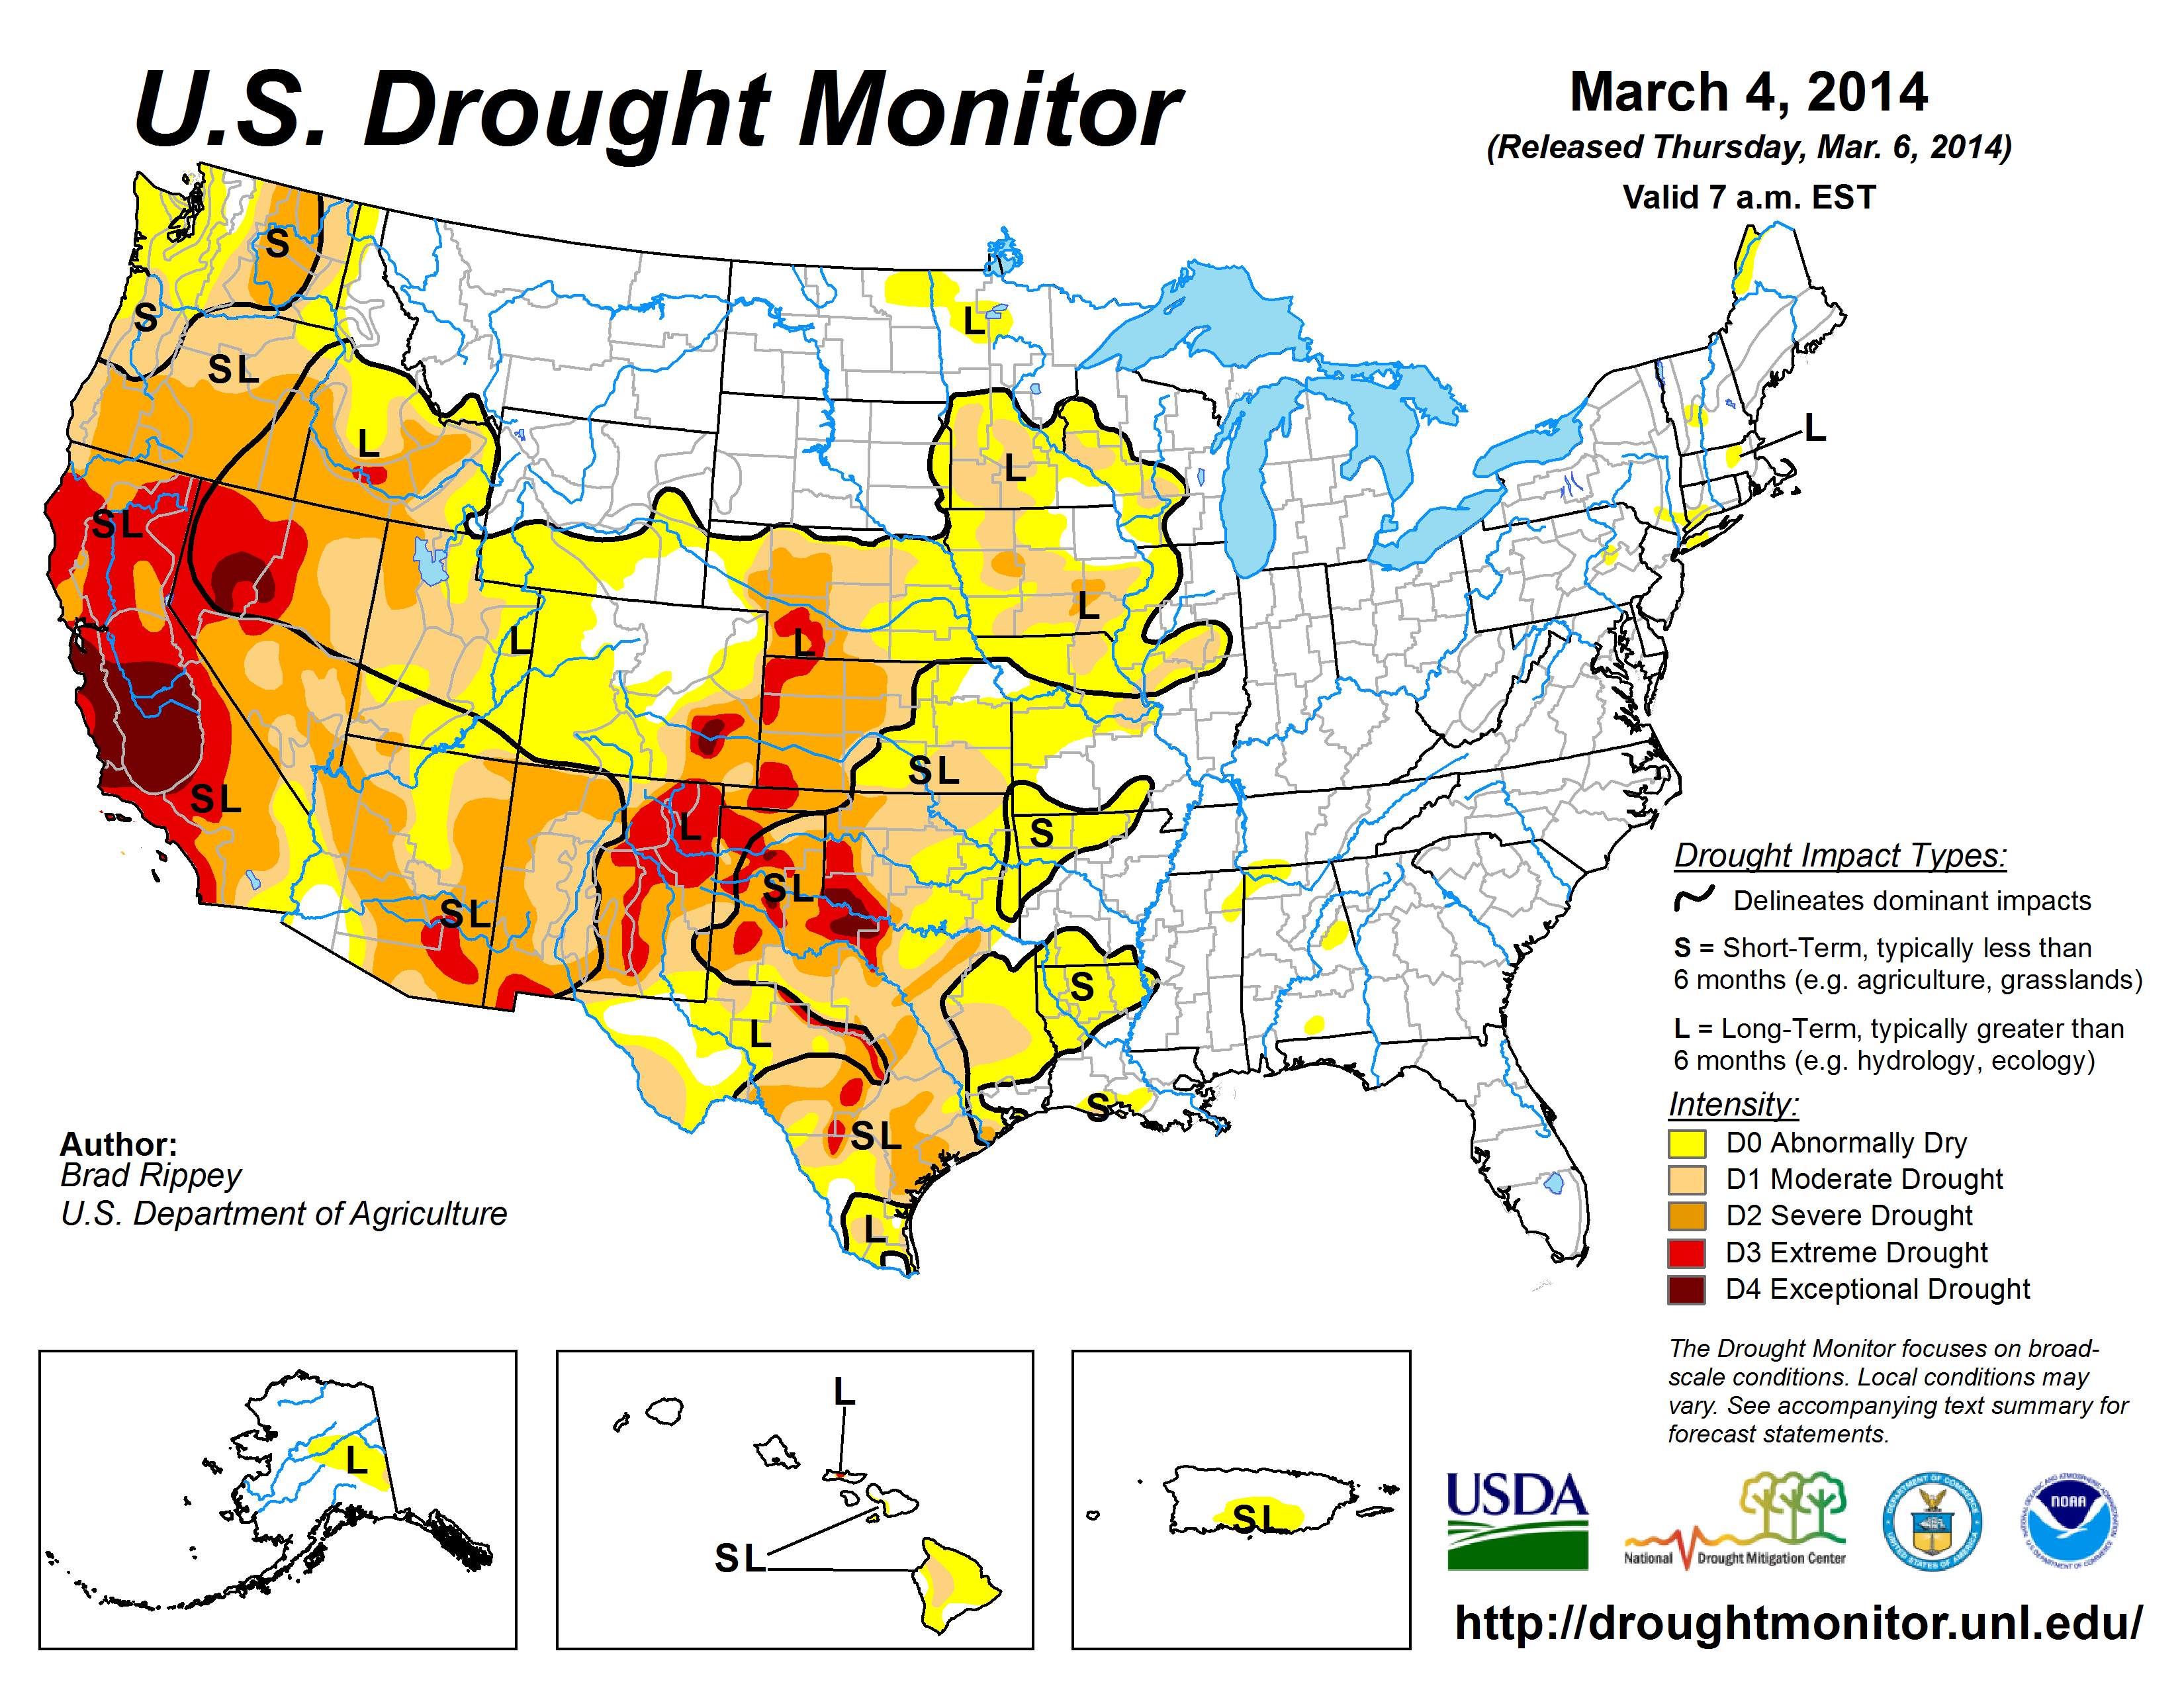
The U.S. Drought Monitor drought map valid March 4, 2014.
By the end of the month, the core drought areas in the U.S. included:
- a large area of drought in the West consisting of moderate (D1) to extreme (D3) drought with pockets of exceptional (D4) drought;
- areas of moderate to severe (D2) drought, with pockets of extreme to exceptional drought, from the Southern Plains to Central Plains, connected to the western drought by a bridge of moderate to severe drought across the Southwest;
- moderate to severe drought in the Midwest, connected to the Plains drought by a bridge of abnormally dry (D0) conditions; and
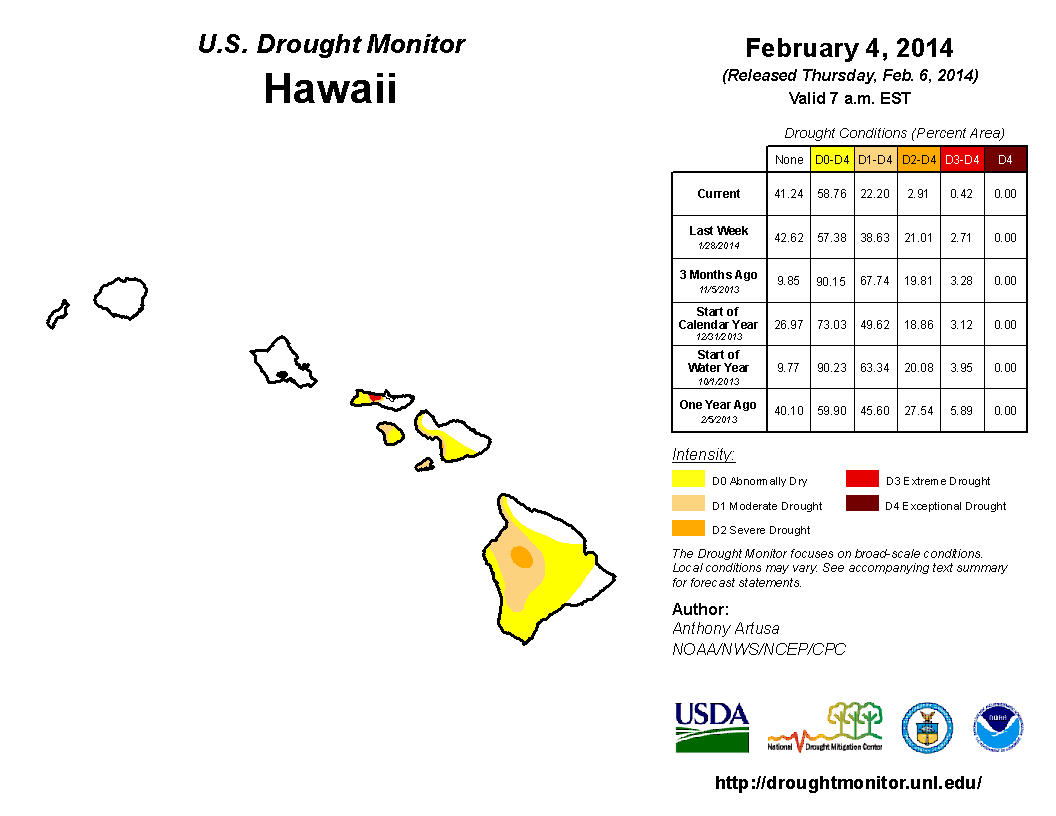
- Hawaii, where moderate to extreme drought persisted.
Palmer Drought Index
The Palmer drought indices measure the balance between moisture demand (evapotranspiration driven by temperature) and moisture supply (precipitation). The Palmer Z Index depicts moisture conditions for the current month, while the Palmer Hydrological Drought Index (PHDI) and Palmer Drought Severity Index (PDSI) depict the current month's cumulative moisture conditions integrated over the last several months. While both the PDSI and PHDI indices show long-term moisture conditions, the PDSI depicts meteorological drought while the PHDI depicts hydrological drought. The PDSI map shows less severe drought in the West than the PHDI map because the meteorological conditions that produce drought are not as long-lasting over much of the West as the hydrological impacts.
|
 |
Used together, the Palmer Z Index and PHDI maps show that short-term dry conditions occurred during February over the Southern Plains and the southern parts of the West which had areas in long-term drought or neutral conditions during January, resulting in an intensification and expansion of drought by the end of February. Near normal to wet short-term conditions occurred during February over much of the long-term drought areas of the Pacific Northwest to Northern Rockies, and parts of the Upper Midwest, thereby contracting drought and reducing drought intensity there. Near normal to slightly wet short-term conditions occurred during February over the long-term wet spell areas of the Midwest and Northeast, resulting in little change in PHDI status there.
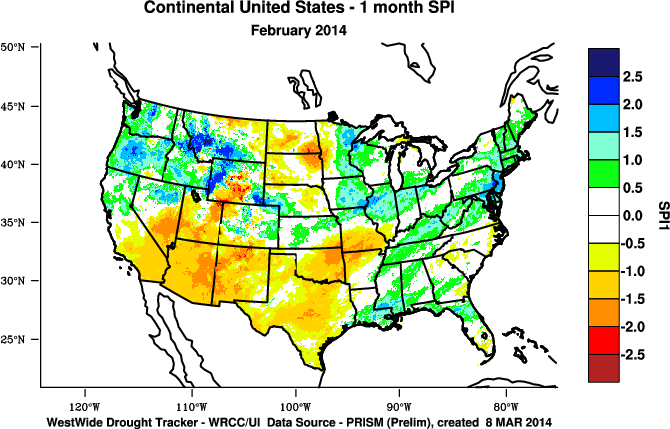
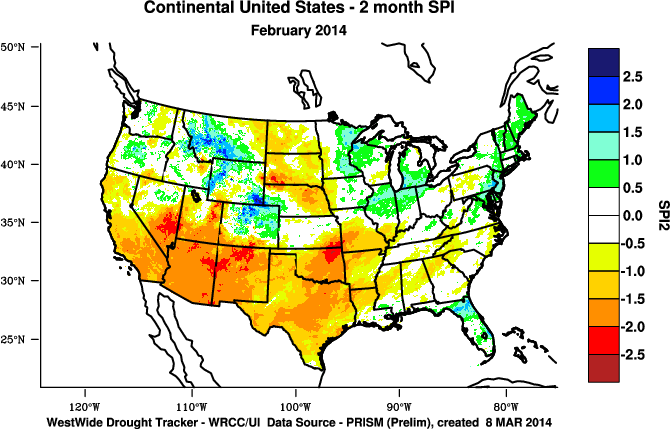
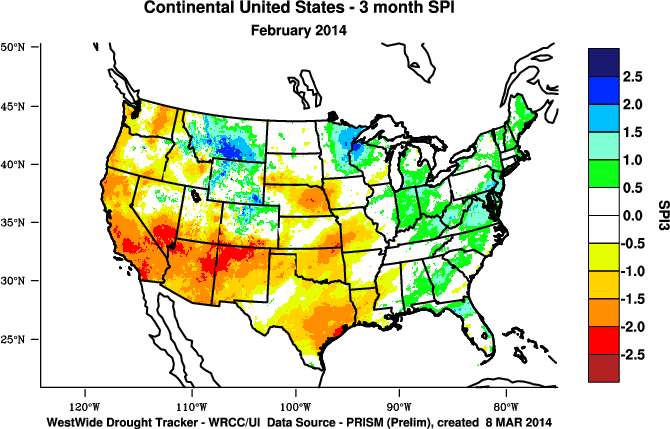
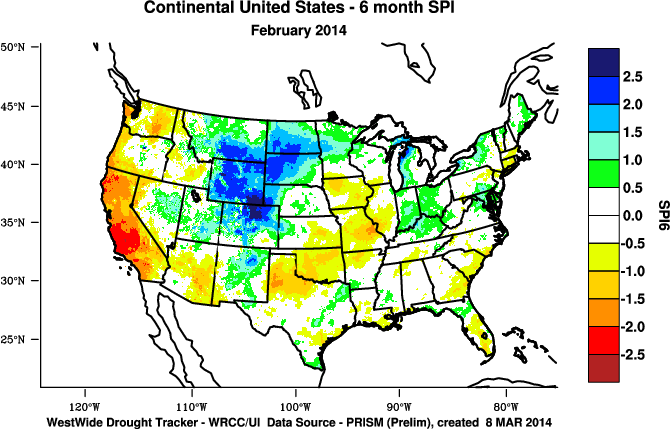
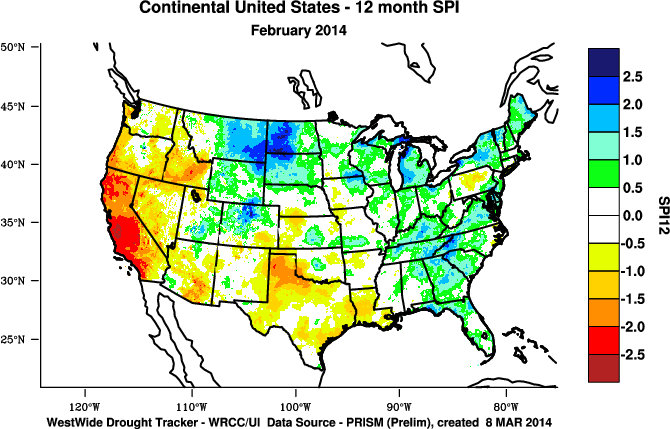
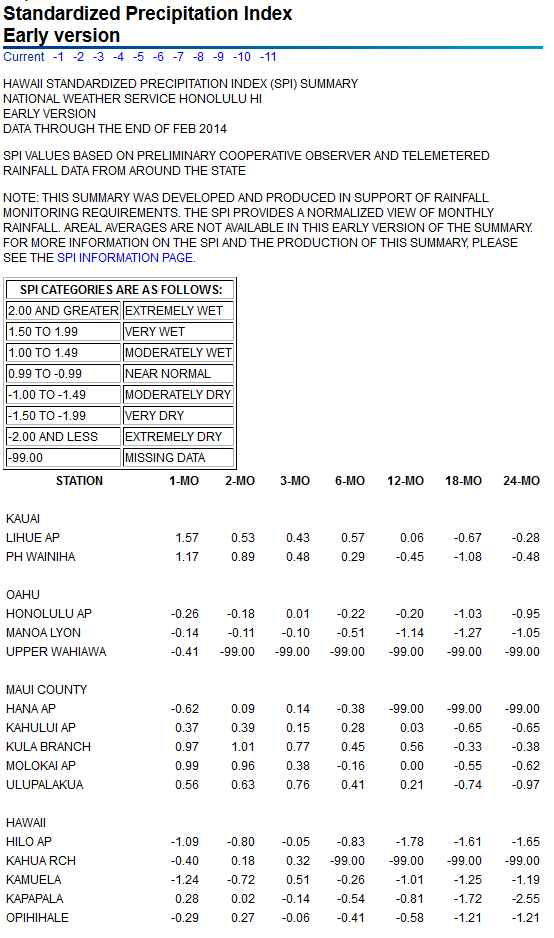
Standardized Precipitation Index
The Standardized Precipitation Index (SPI) measures moisture supply. The SPI maps here show the spatial extent of anomalously wet and dry areas at time scales ranging from 1 month to 24 months.
 |
 |
 |
The SPI maps illustrate how moisture conditions have varied considerably through time and space over the last two years. The wet conditions during February 2014 in the Pacific Northwest have been enough to neutralize the dryness at the 1- and 2-month time scales, but not at longer time scales. The Northern Plains have been dry at the 1- and 2-month time scales, but are wet at 6-month and longer time scales. The near-normal precipitation during February in northern and central California was not enough to remove the longer-term dryness, even at two months. Dryness in the Southwest is strongly evident at 1- to 3-months, but the monsoon rains of last year are evident at 6 to 12 months. The Mid-Mississippi Valley shows dryness at 1 to 9 months, while the 2013 dryness in the Midwest (Iowa) is strongly evident at 9 months. The Southern Plains have been particularly dry at the 1- to 3-month time scales, but appear mostly near normal at 9 months, then dry again at longer time scales. There is some hint of dryness in parts of the Northeast and Southeast at 2 to 6 months, although wetness dominates in the Southeast at 9 to 24 months. But the extreme dryness of 2012 is still evident at 24 months across much of the West to Great Plains, in spite of precipitation that has fallen since then.
 |
 |
 |
Agricultural, Hydrological, and Meteorological Indices and Impacts
 |
 |
Drought conditions were reflected in numerous agricultural, hydrological, and other meteorological indicators, both observed and modeled.
Total column soil moisture percentiles from the NLDAS ensemble model.
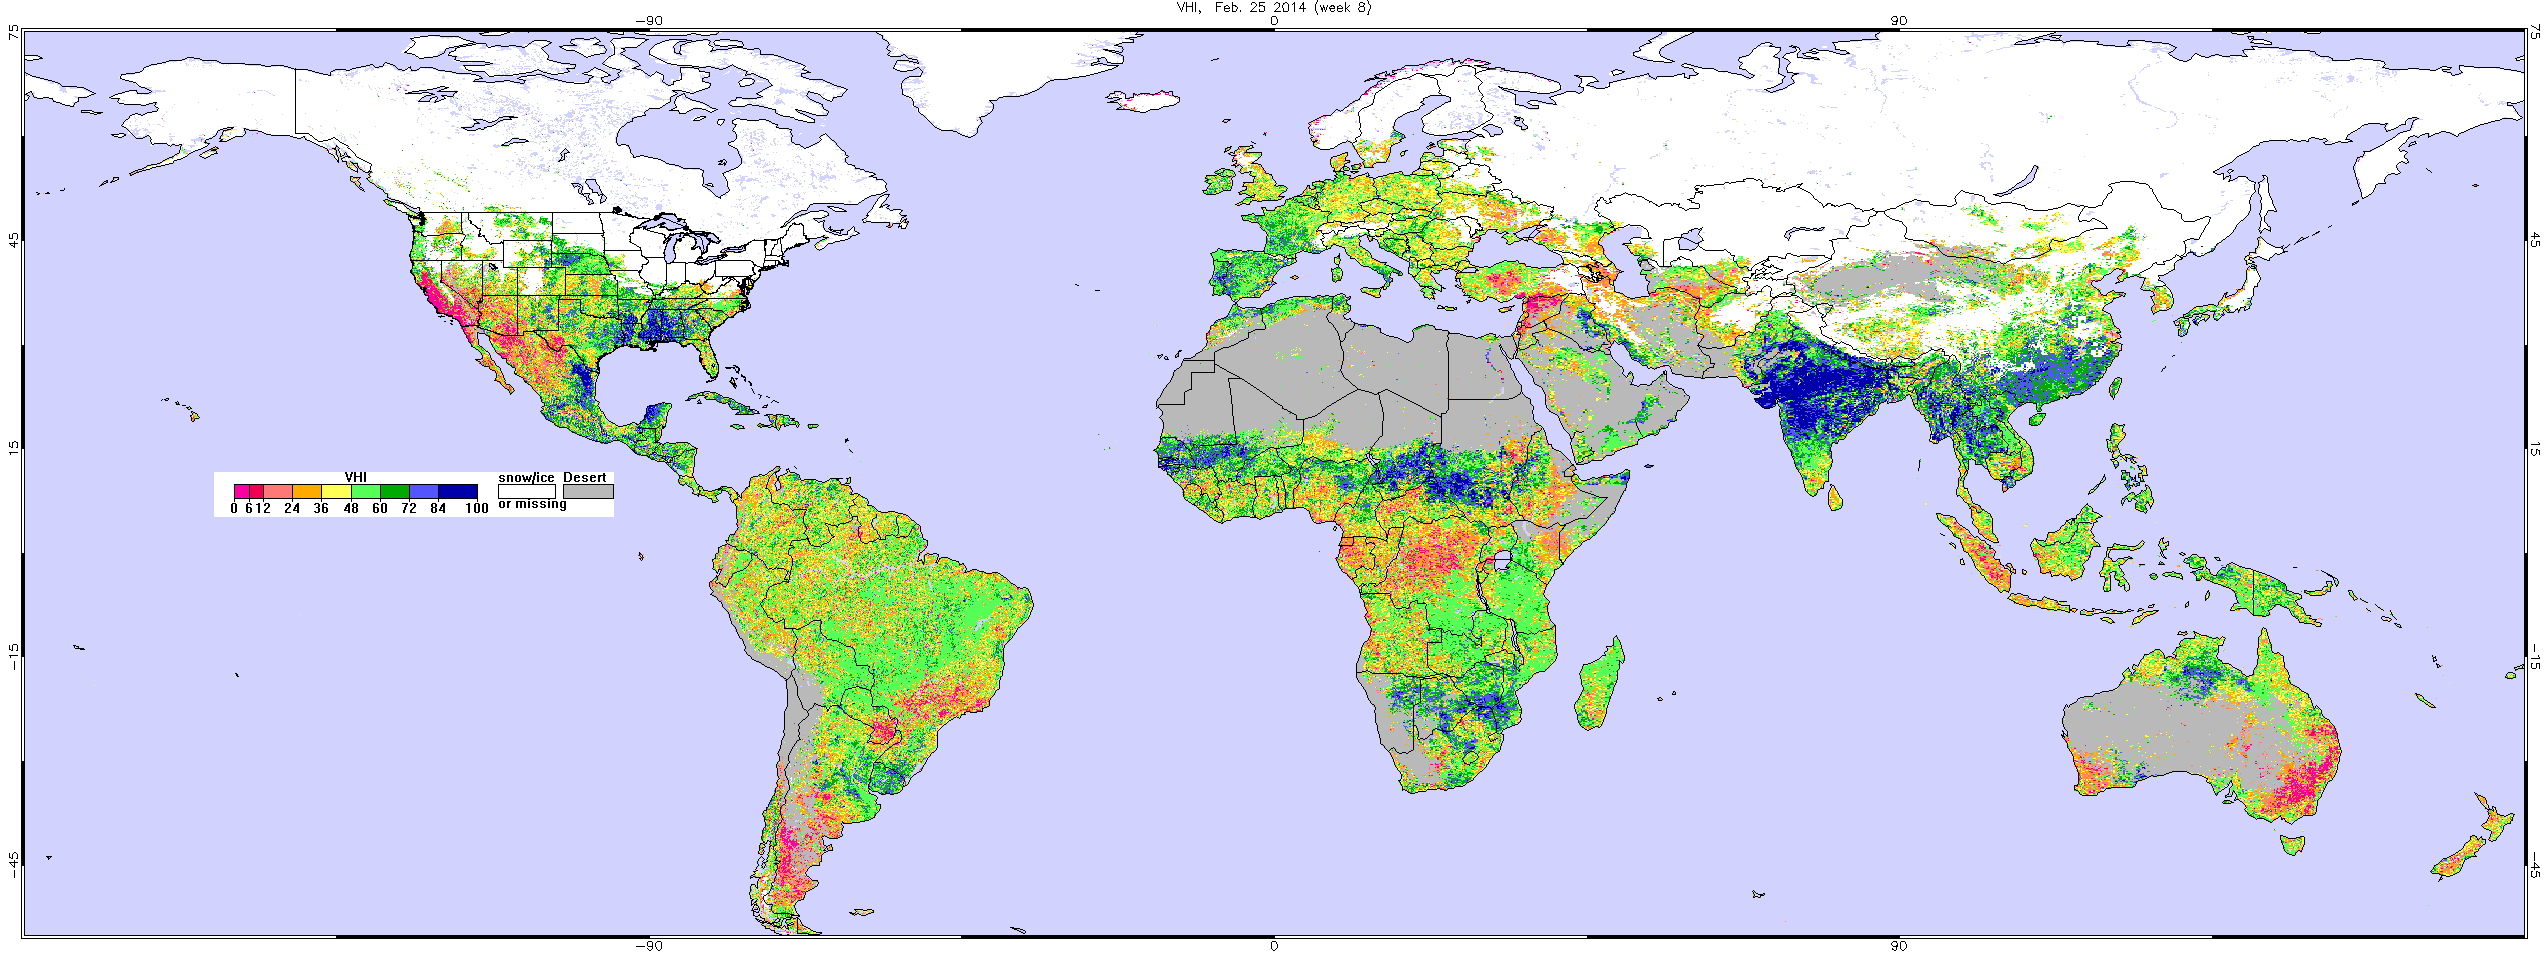
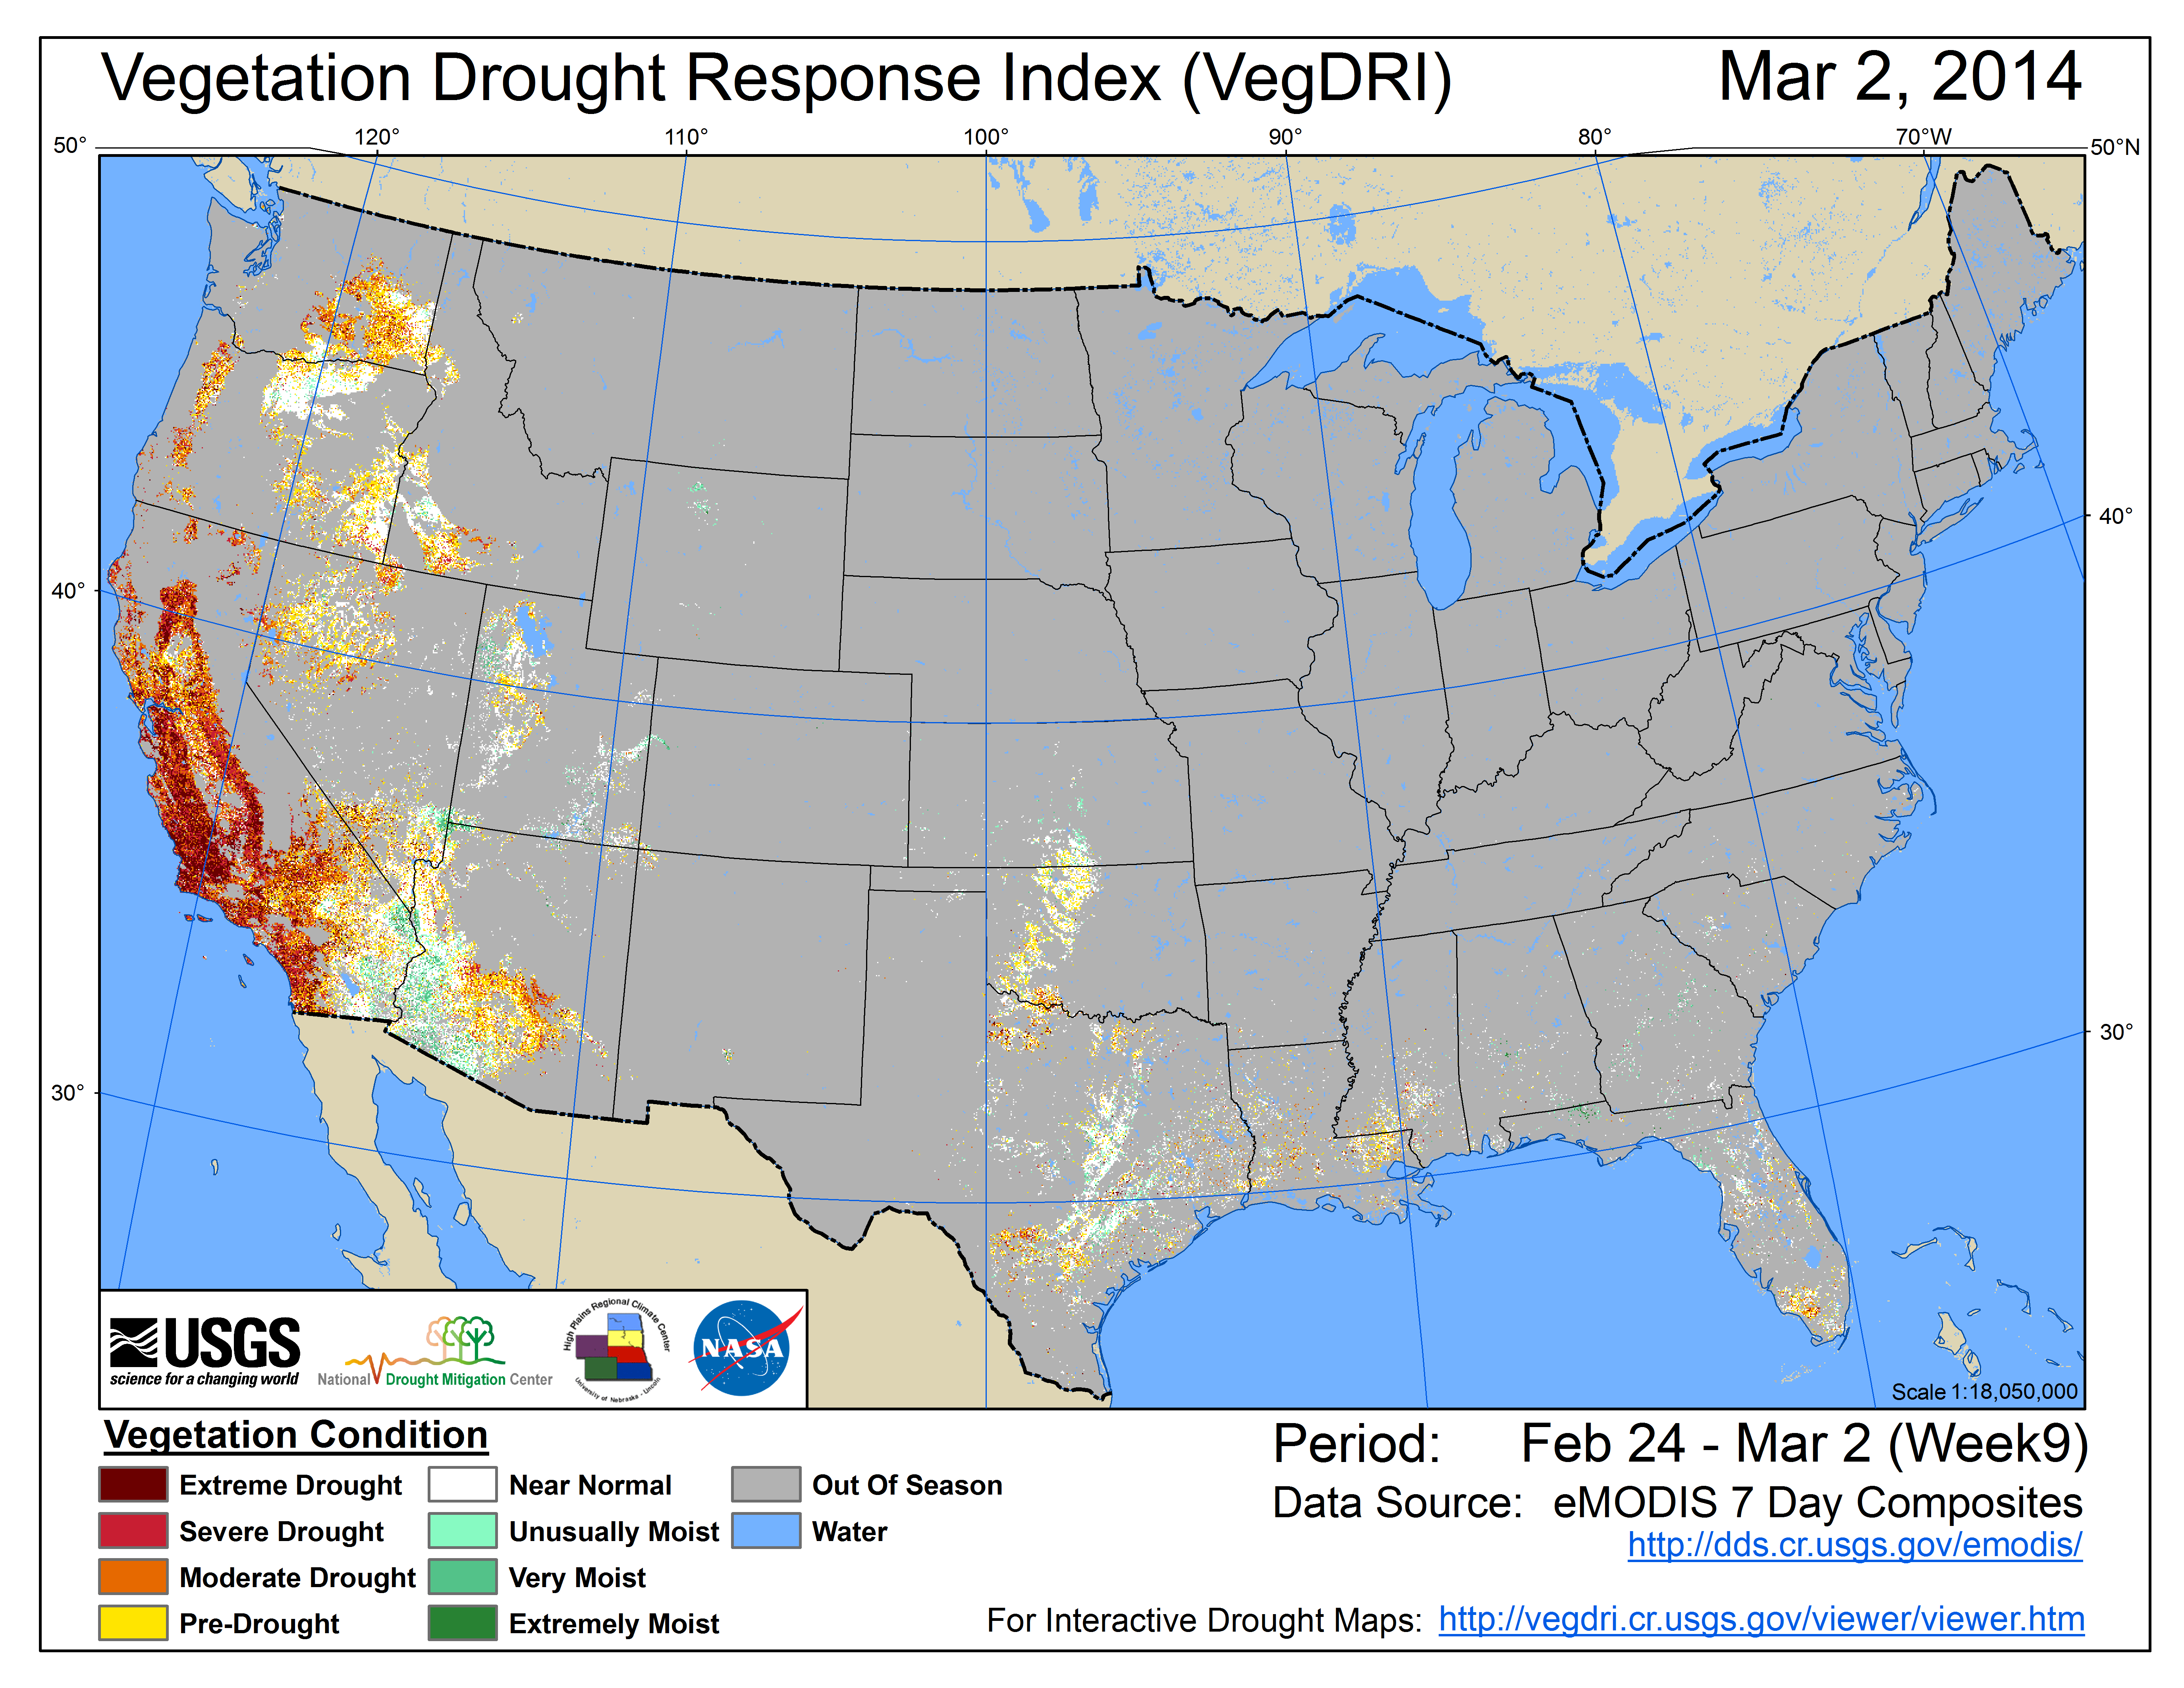
Satellite observations showed vegetative stress continuing in parts of the West, especially California, but also in the Southern Plains, and this was confirmed by reports of non-irrigated crops suffering and lack of forage causing ranchers to cull their herds. According to the U.S. Department of Agriculture (USDA), as of March 4th, 45 percent of winter wheat, 41 percent of the domestic cattle inventory, 25 percent of corn acreage, 26 percent of hay acreage, and 17 percent of soybean acreage were in drought. These percentages are decreases compared to a month ago for winter wheat, corn, and soybeans, a slight increase for cattle, and no change for hay. Early March reports from the USDA indicated that, in Texas, 52 percent of the pastures and rangeland were rated in poor to very poor condition, while 46 percent were so rated in Oklahoma. Significant portions of the winter wheat crop were rated in poor to very poor condition in Texas (46 percent), Oklahoma (31 percent), Kansas (22 percent), and Nebraska (18 percent). These were all (except for Nebraska) increases from earlier in the season. Some of the harm may be due to the cumulative effects of a harsh winter featuring wild temperature swings, occasional high winds, and exposure to extreme cold without the benefit of a protective snow cover. But drought was still a concern, with soil moisture depleted from the Midwest to Southern Plains as well as the Pacific Northwest to California and the Southwest states. Most of the topsoil moisture was rated short to very short (dry to very dry) by the USDA in Oklahoma (87 percent), Texas (78 percent), Nebraska (57 percent), Kansas (55 percent), and Iowa (53 percent). Dry weather continued to deplete soil moisture in the Southwest and Southern Plains to Mid-Mississippi Valley, but February precipitation improved soil moisture conditions from northern California to the Pacific Northwest, although soils were still drier than normal.
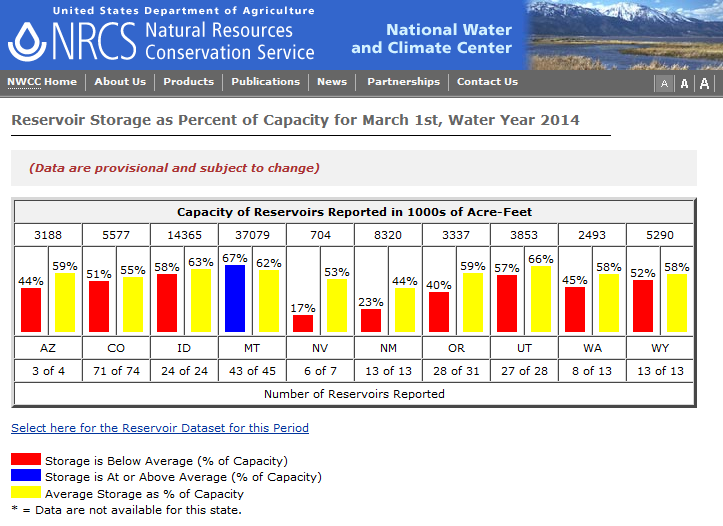
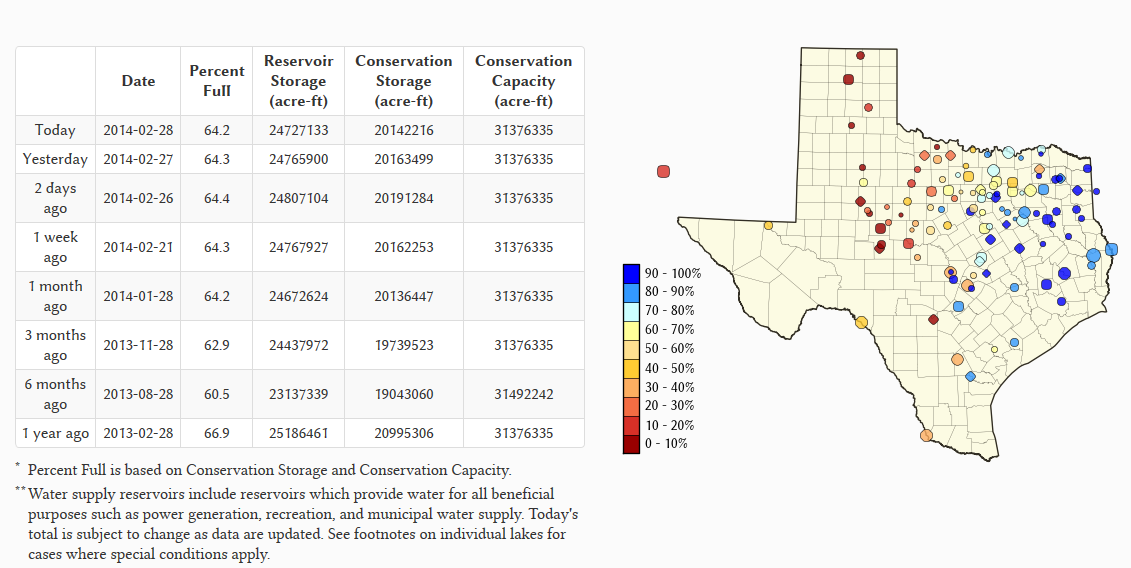
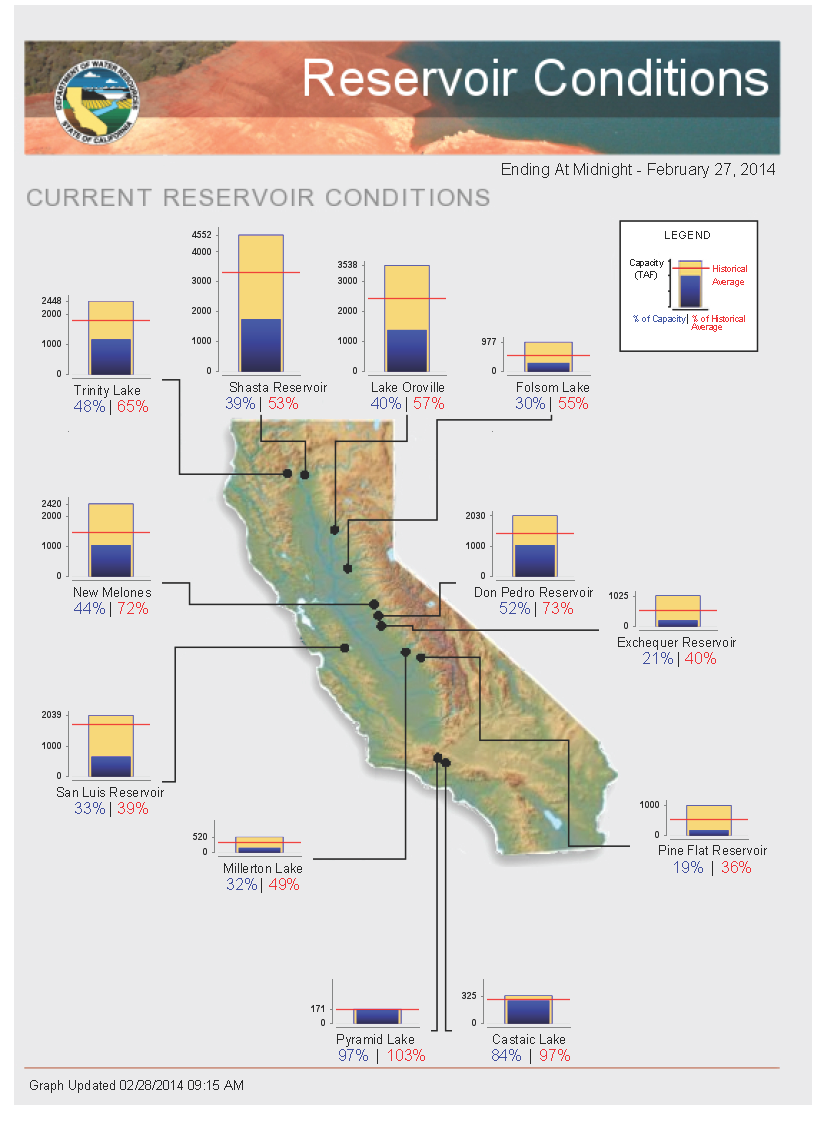
USDA West statewide reservoir status.
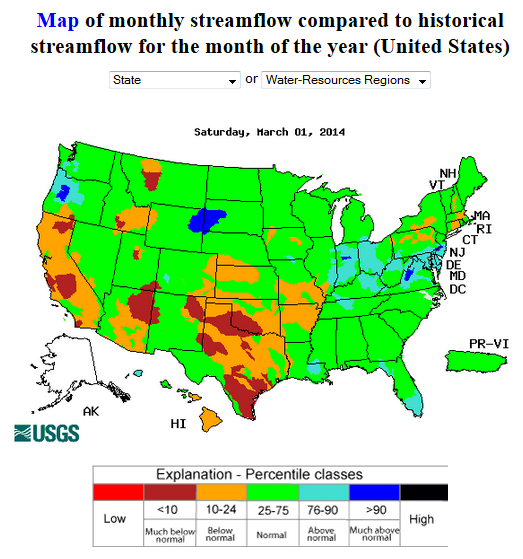
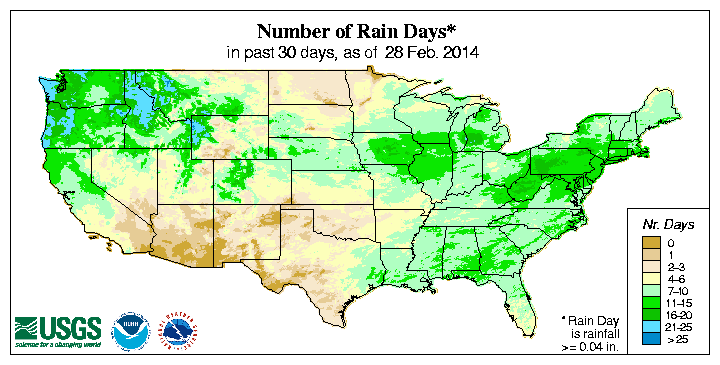
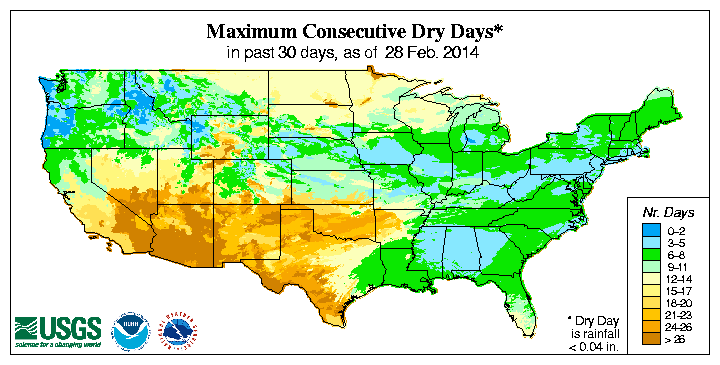
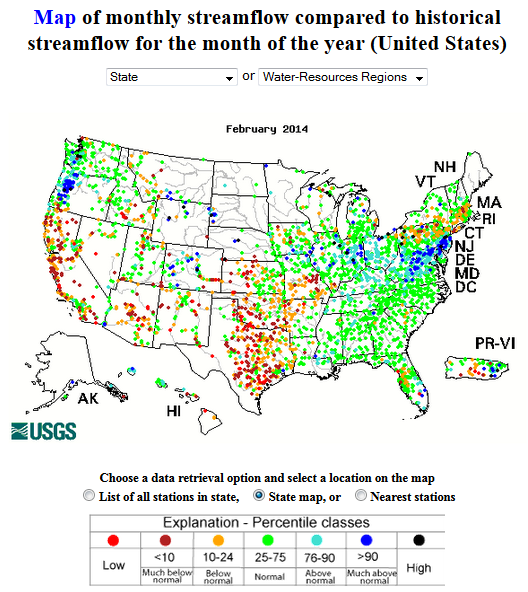
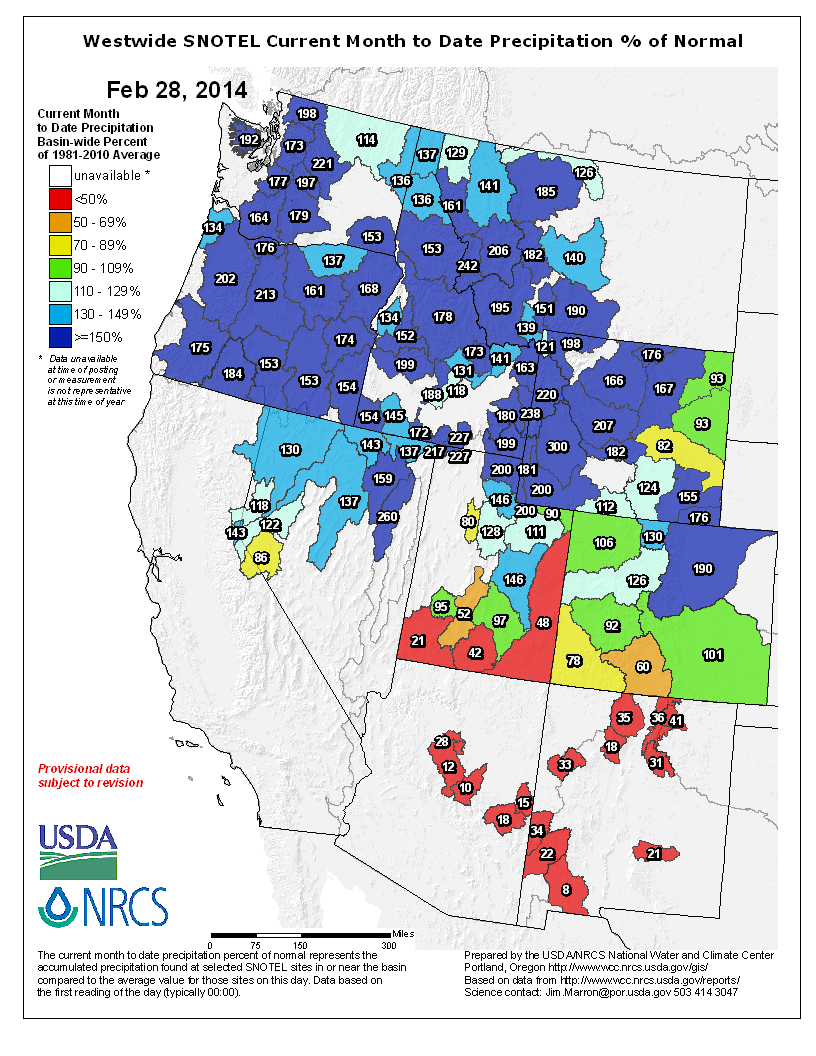
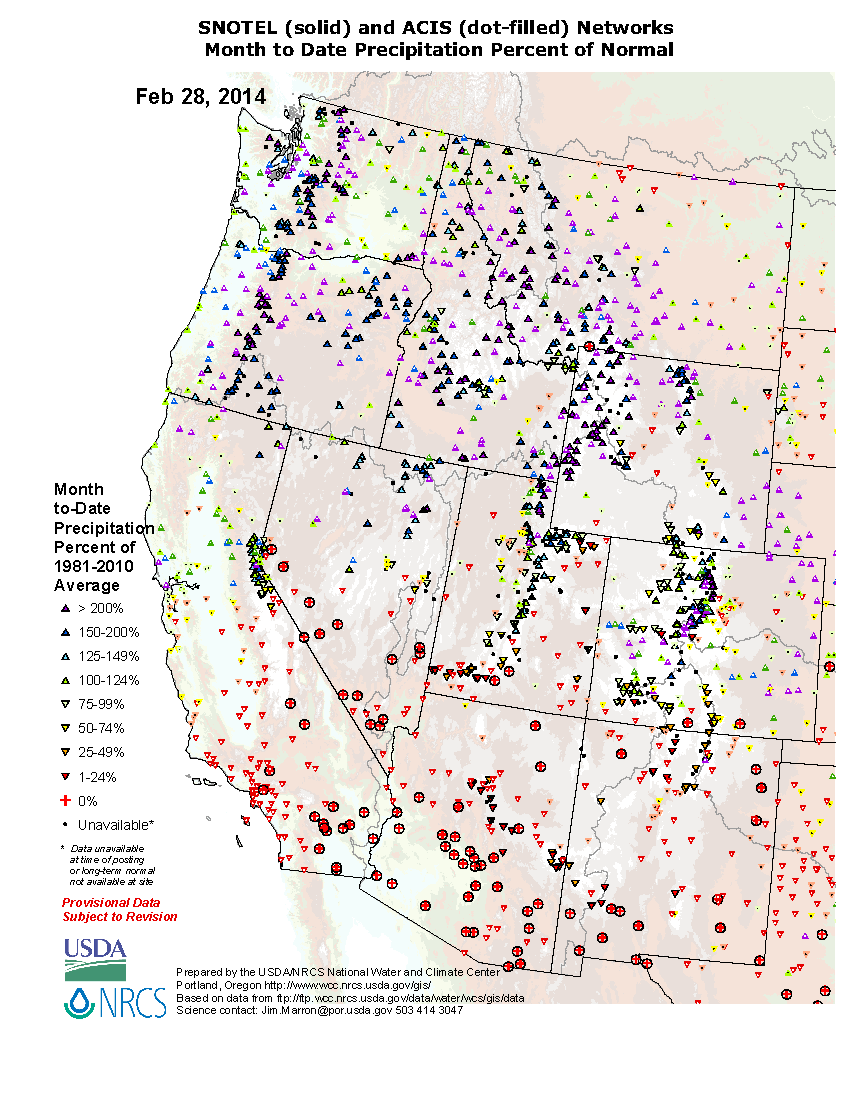
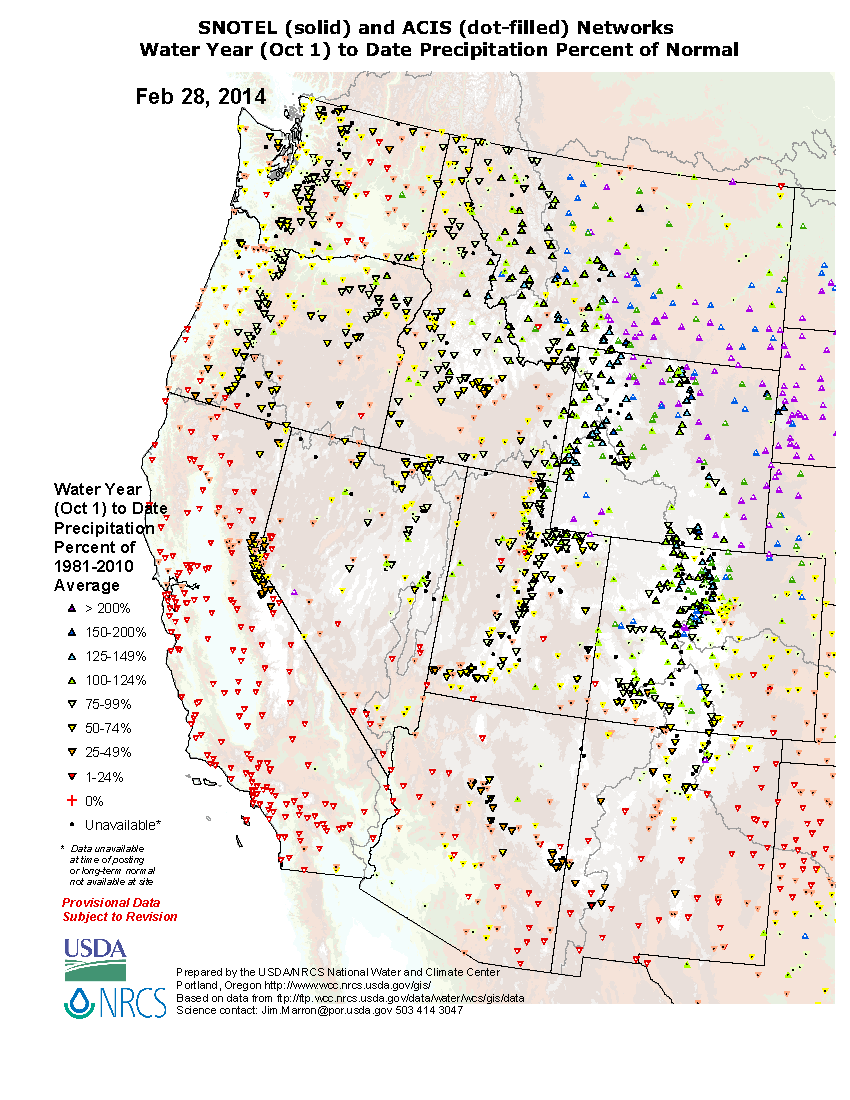
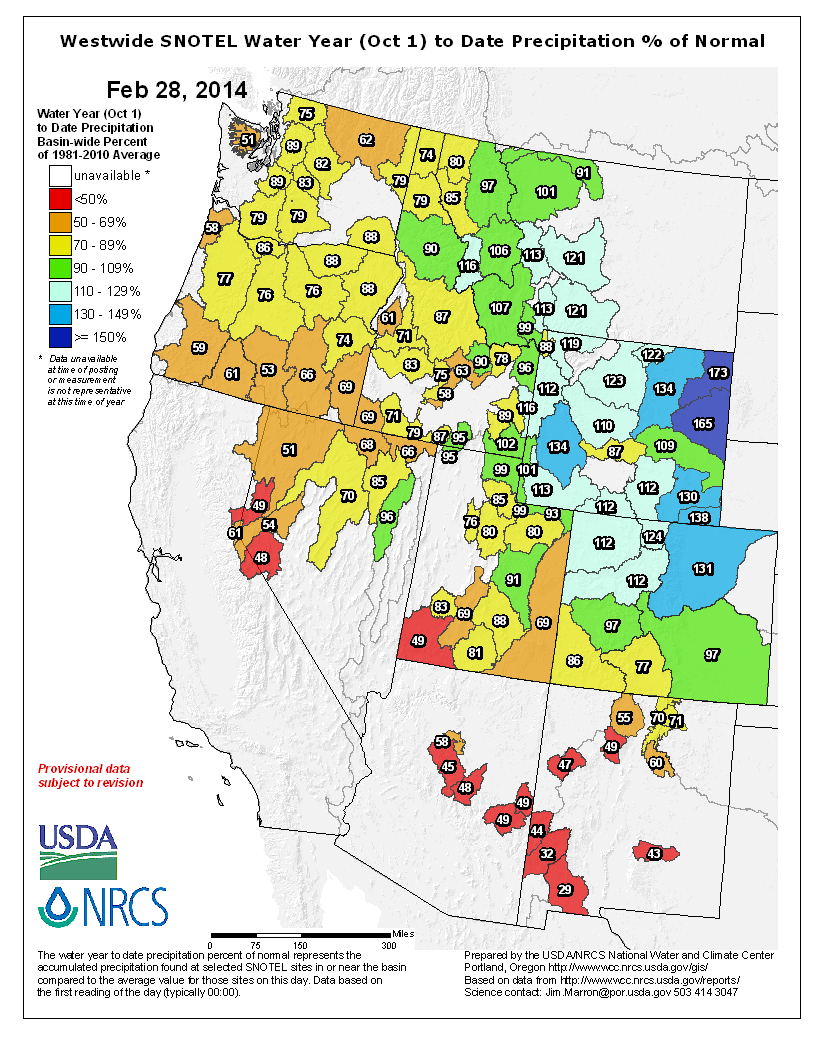
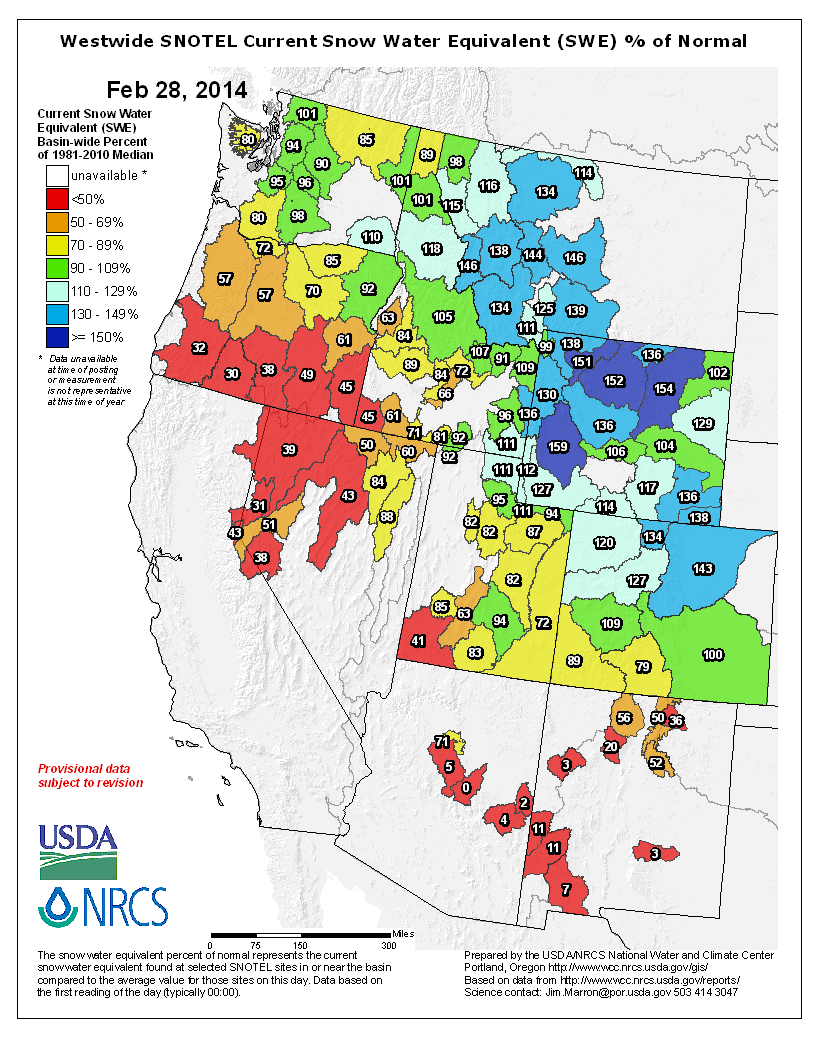
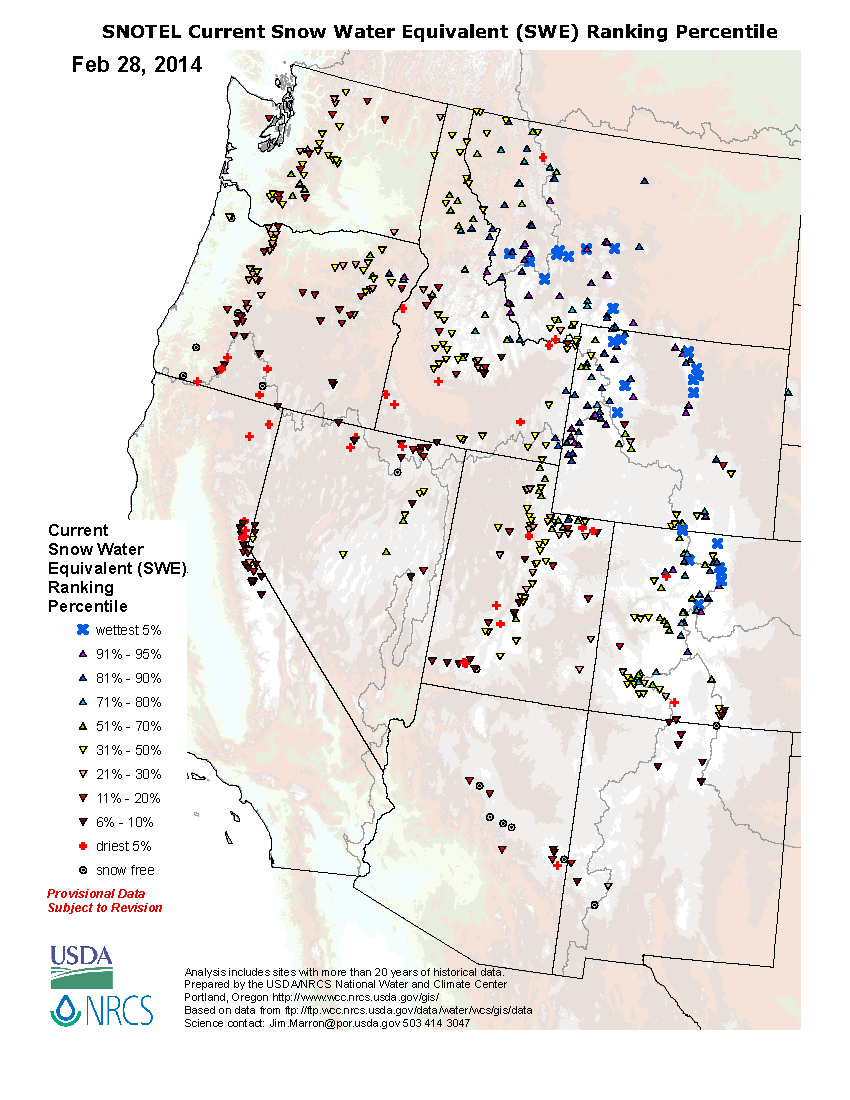
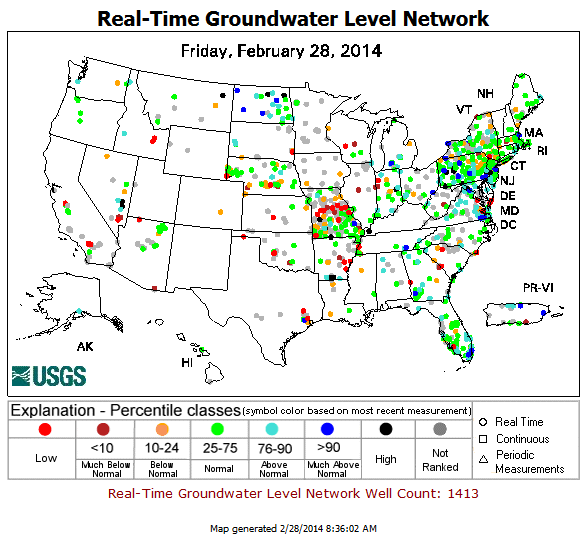
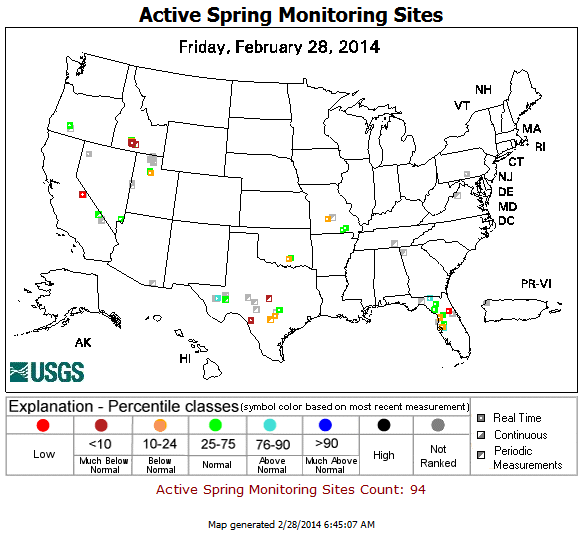
The subnormal precipitation was reflected in below-normal monthly precipitation totals as well as lack of rain days and long runs of consecutive dry days, especially in the Southwest and Plains. Streamflow in parts of the West and Plains averaged much below normal, with some stream gauges measuring record low monthly values for February. Frequent snow storms dropped an above-normal snow cover east of the Rockies, but the snow cover, snow water content, and snow pack in the Southwest remained below normal. Even though the Pacific Northwest had above-normal precipitation during February, the water year-to-date (October 1 to present) precipitation has been below normal, and the February precipitation fell mostly as rain instead of snow, resulting in a continued below-normal mountain snow pack and snow water content at most locations. The persistent dryness — for the water year-to-date and longer — was reflected in below-normal groundwater and springwater observations, and, for Texas, California, and most of the western states, below-normal reservoir levels.
Regional Discussion
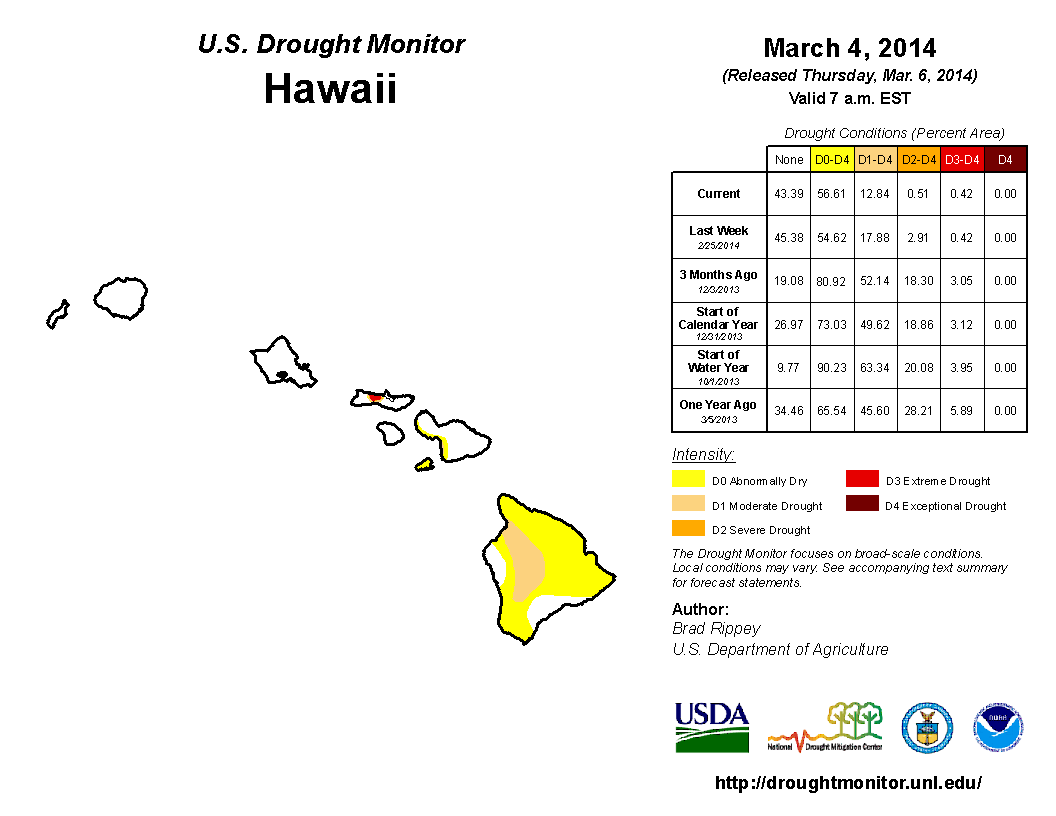
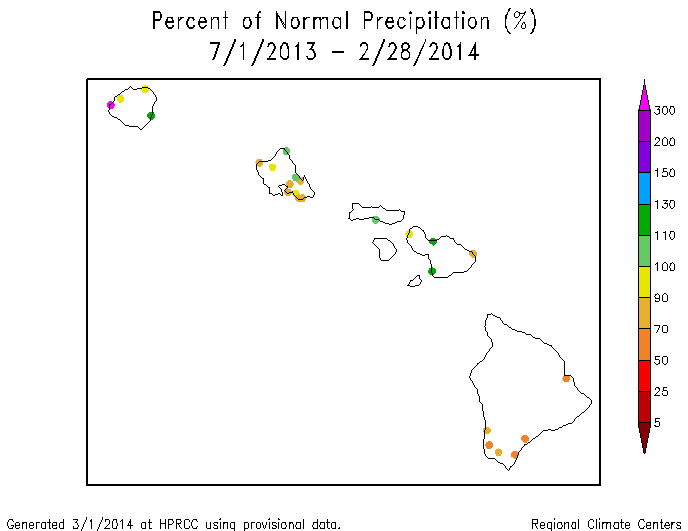
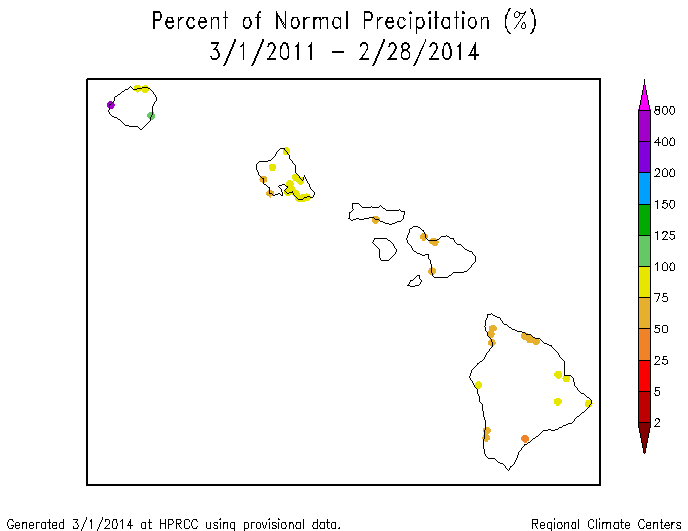
Hawaii: The precipitation pattern for February 2014 and the last two months was mixed across Hawaii. The pattern in the near term (last 3, 5, 6, 8, and 11 months) generally consisted of drier-than-normal weather on Oahu and The Big Island and mixed to wet conditions on the others. Drier-than-normal conditions tended to dominate on most of the islands at the longer time scales (last 12, 24, and 36 months). The rain that fell this month helped to shrink the moderate to extreme drought area from 22.2 percent last month to 12.8 percent this month, although February streamflow continued below normal on Maui and The Big Island.
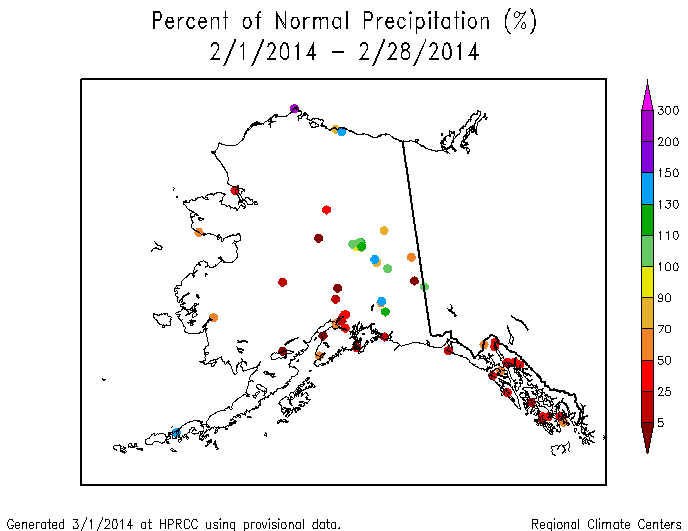
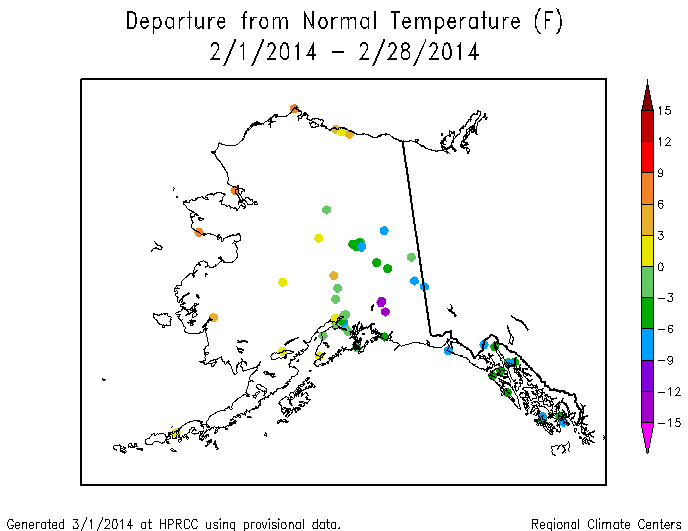
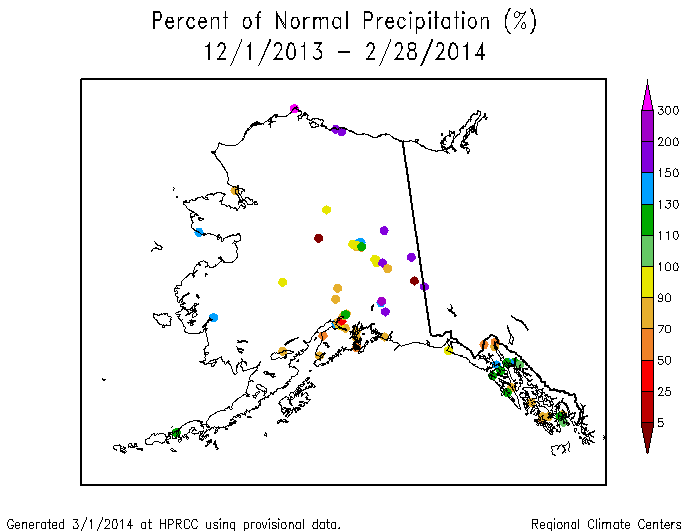
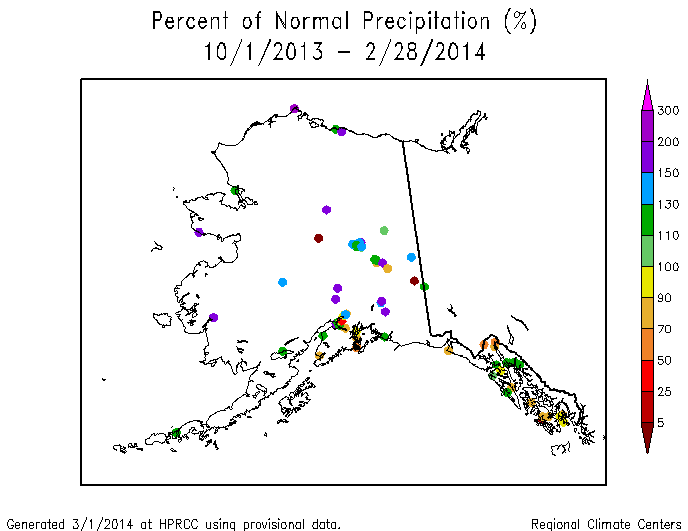
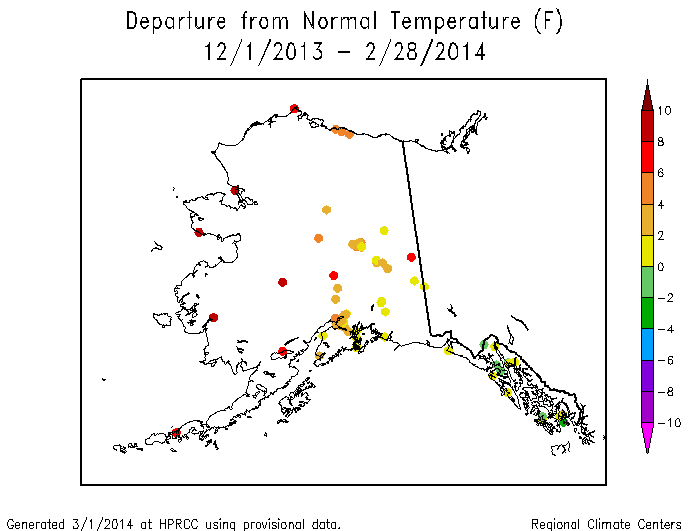
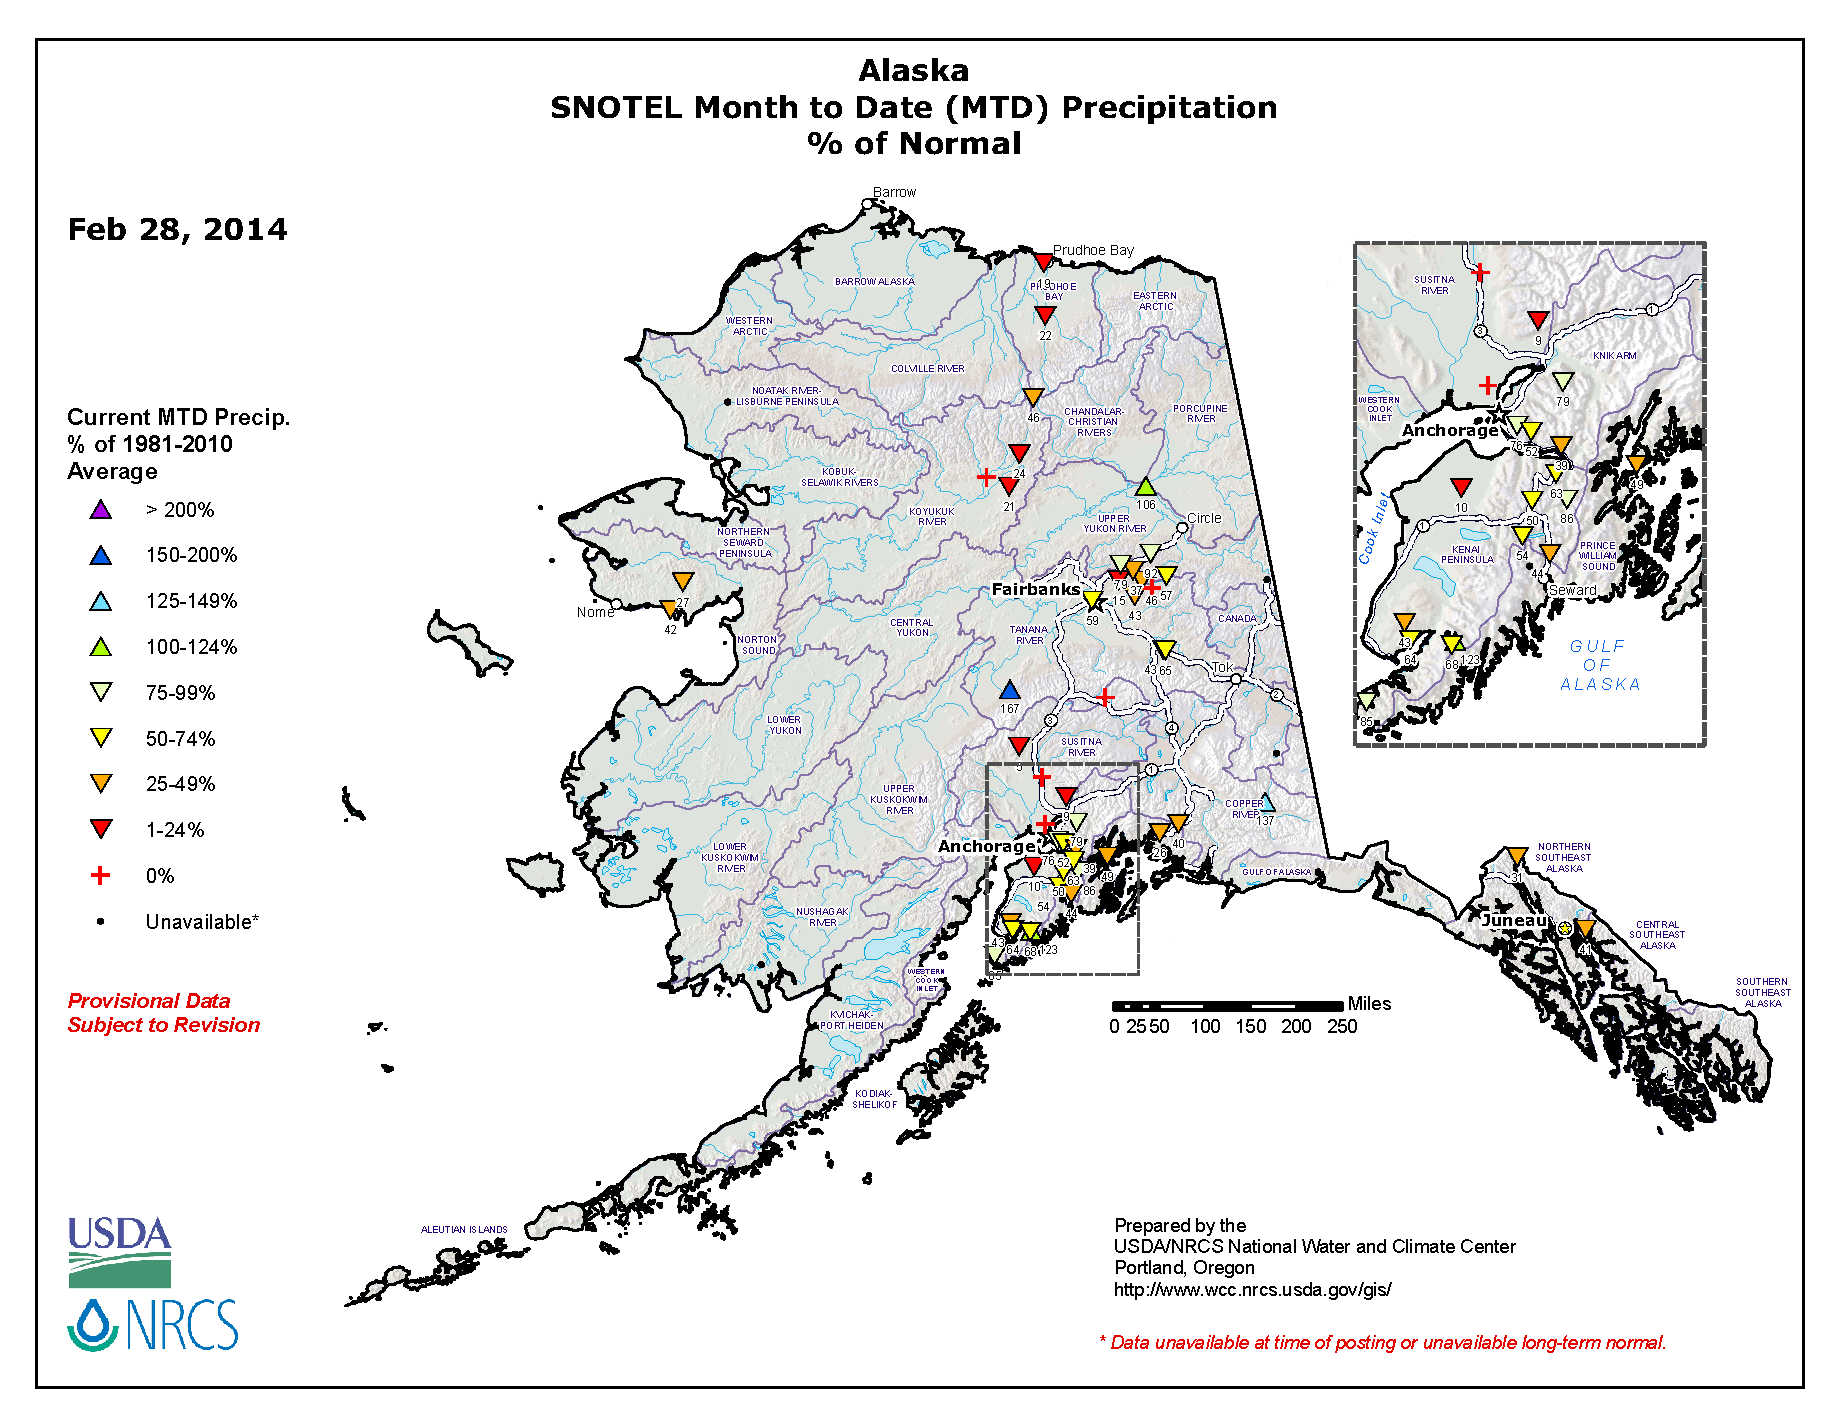
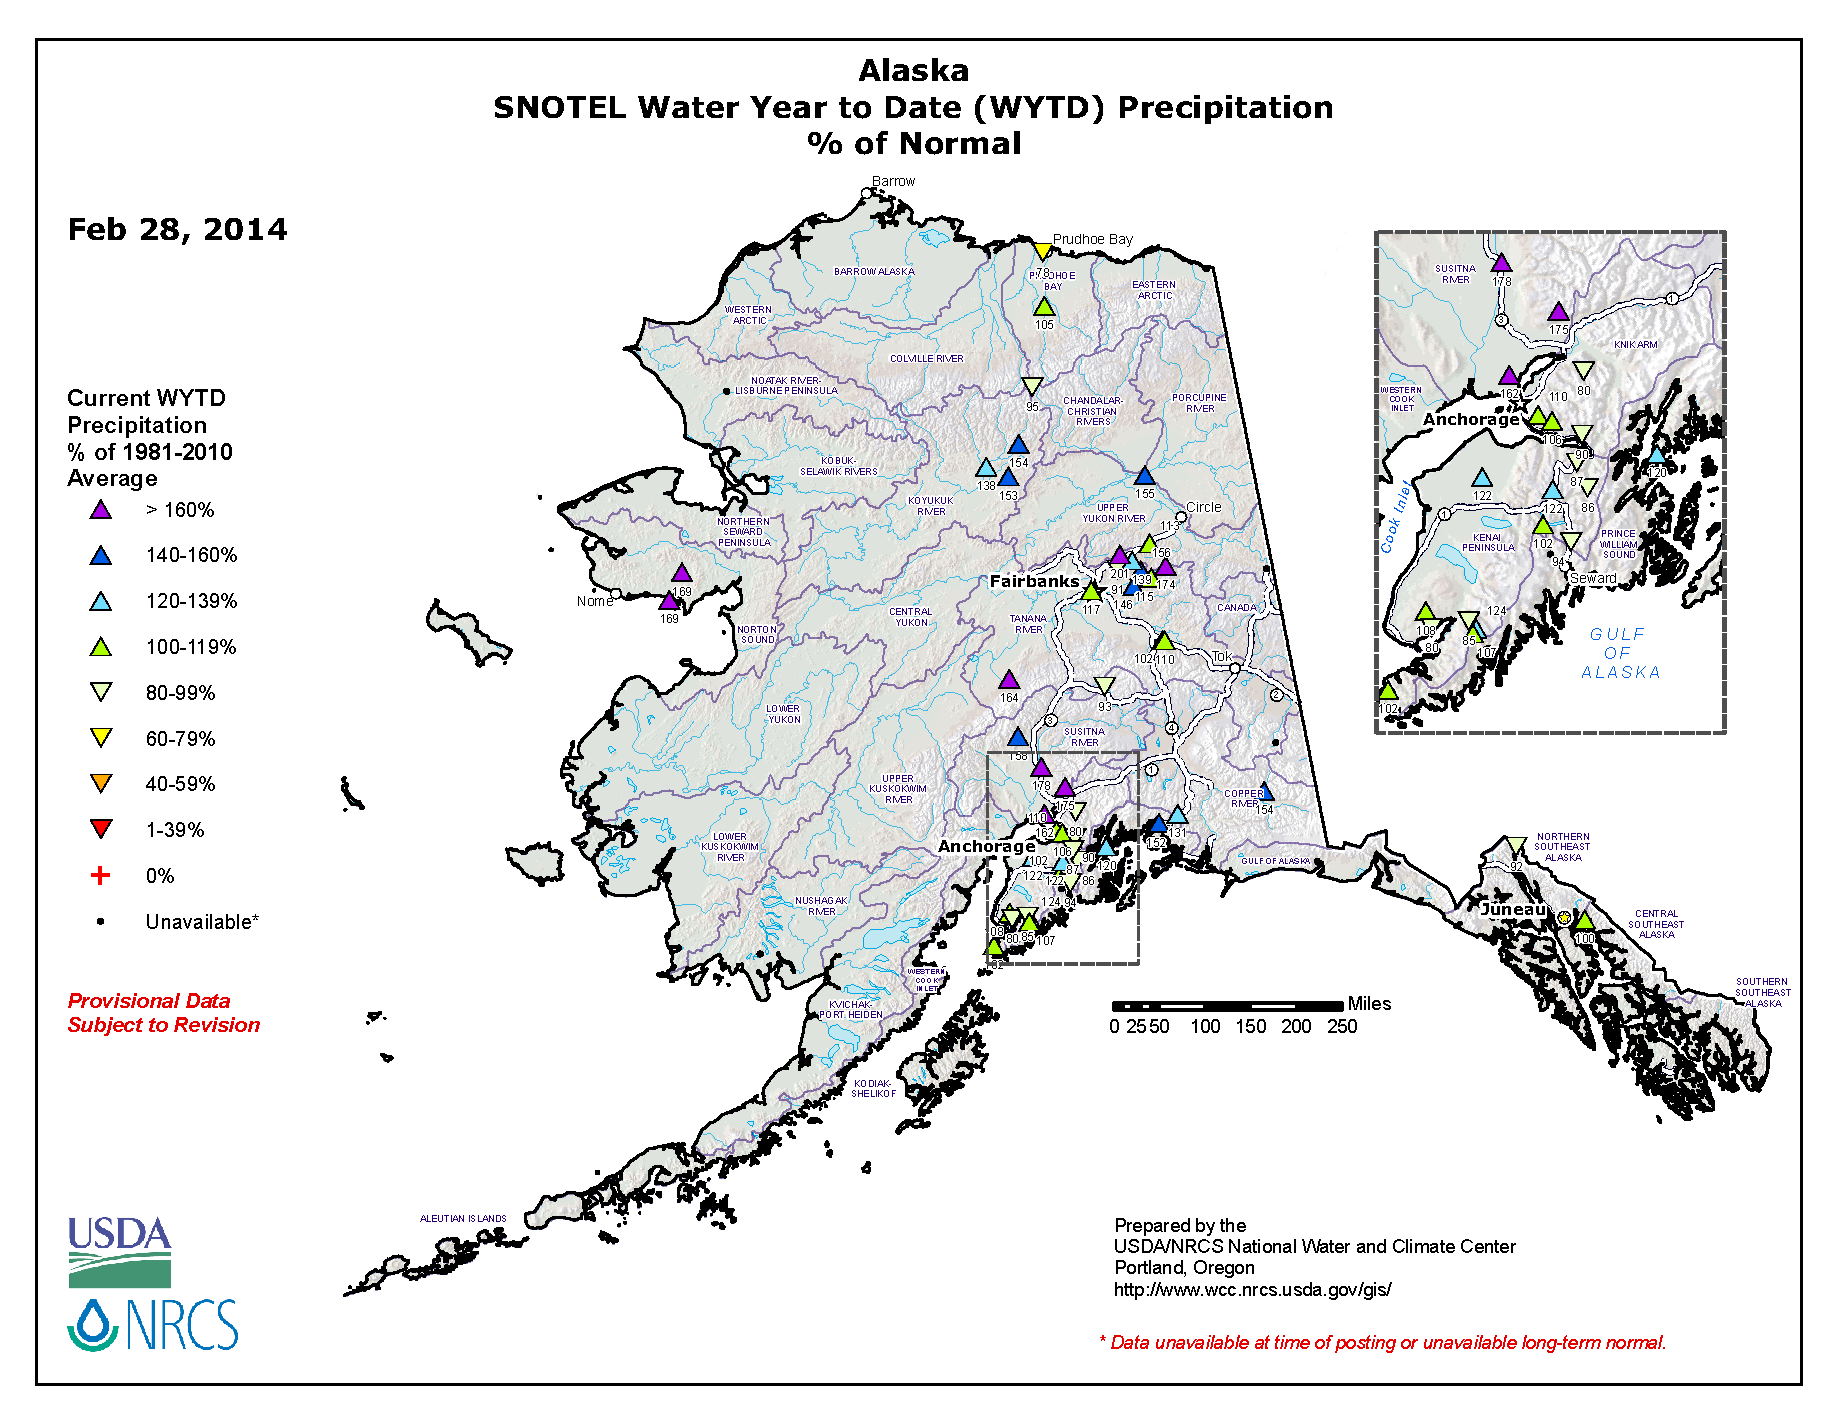
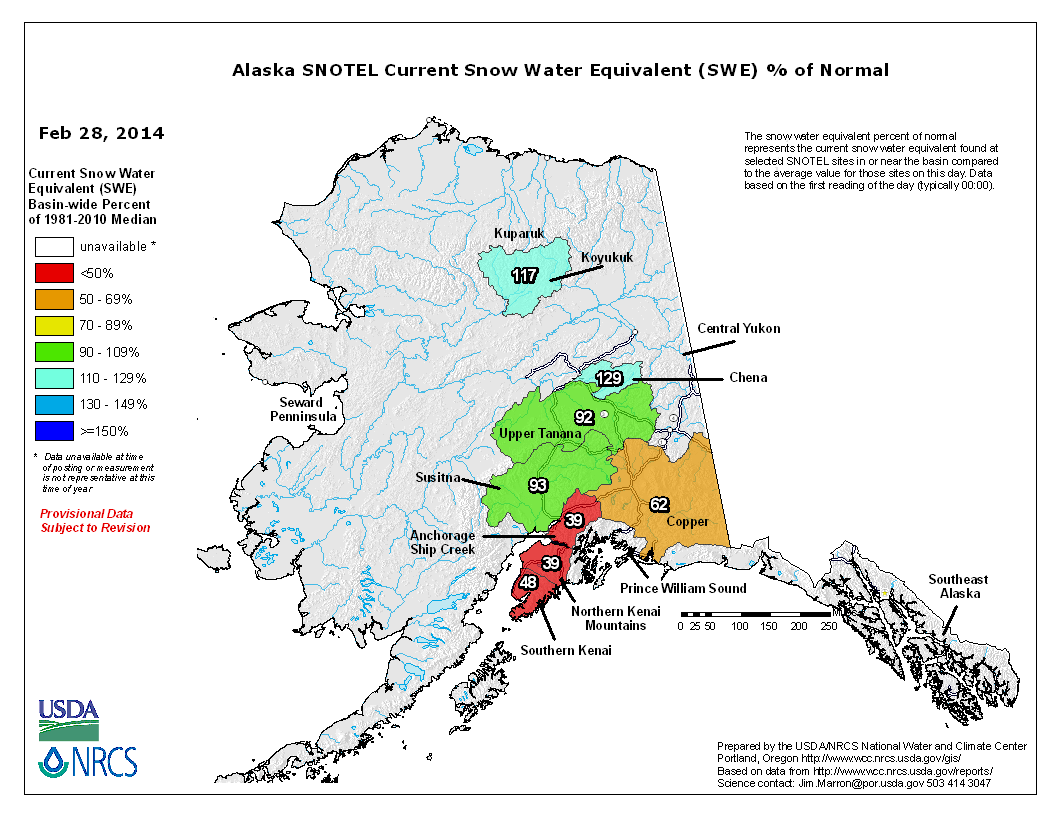
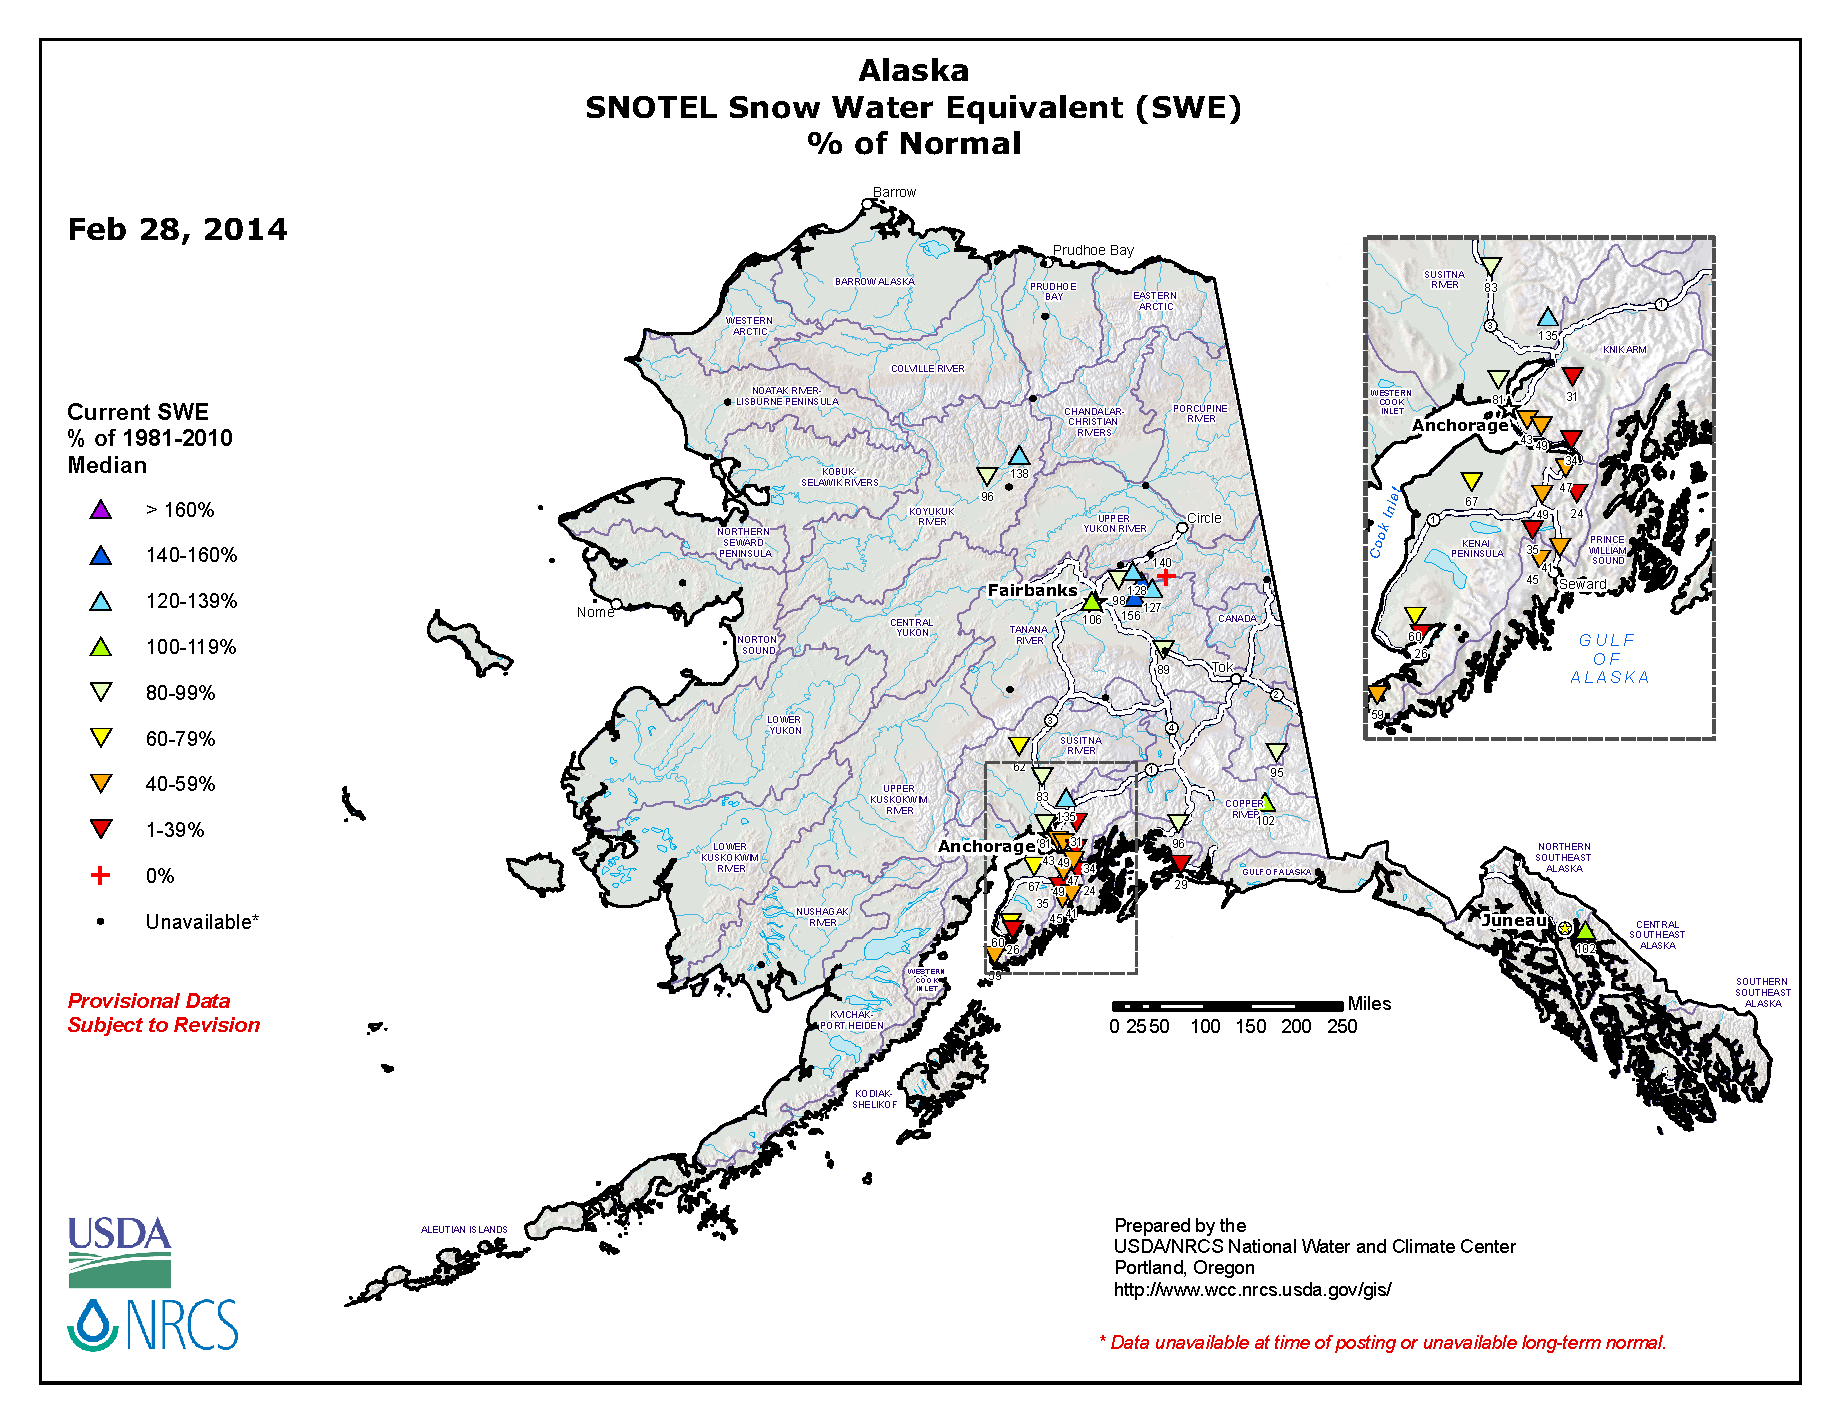
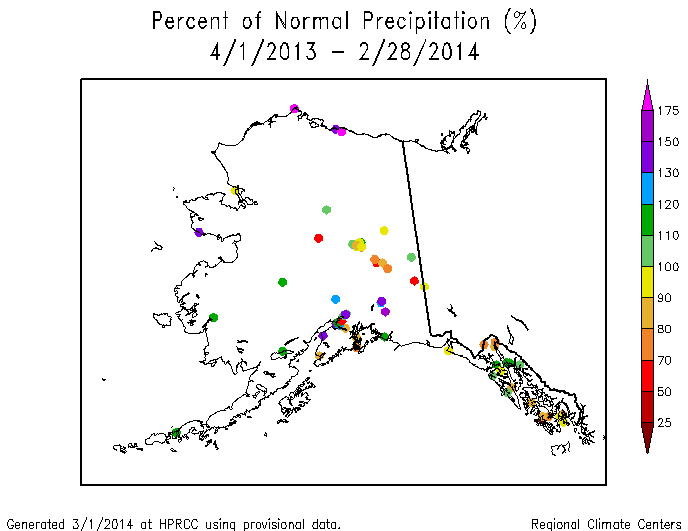
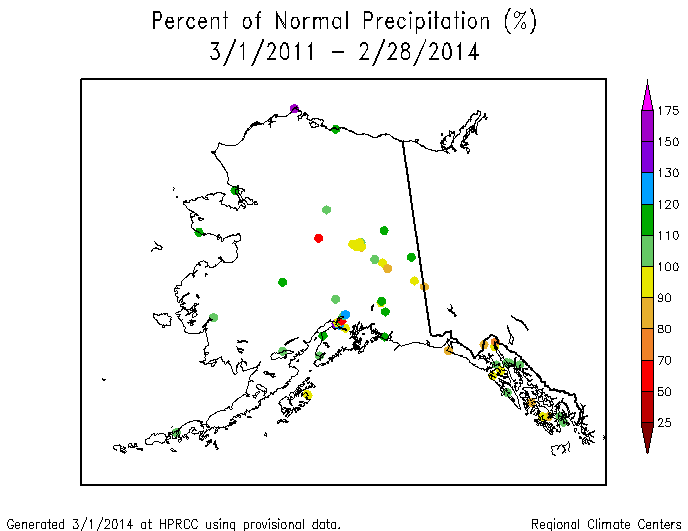
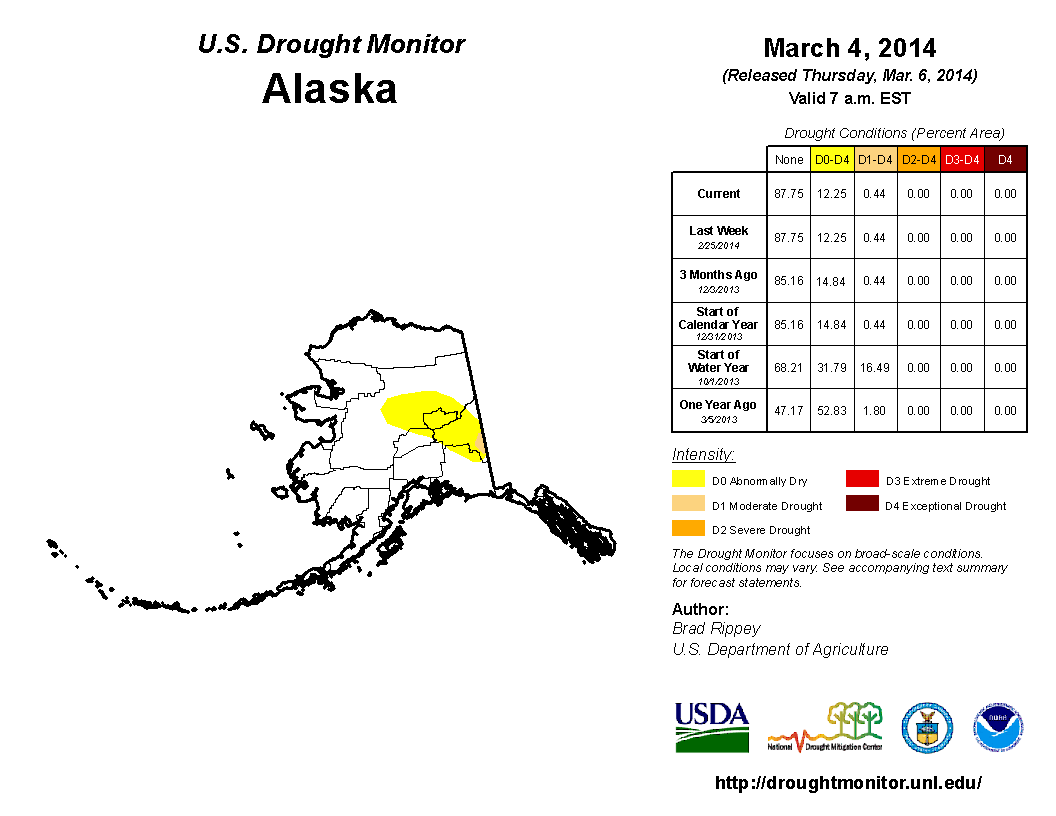
Alaska: The precipitation pattern during February reflected a disruption of the long-wave upper-level ridge which has been affecting Alaska this winter. February 2014 precipitation was below normal across much of the state, with above-normal precipitation concentrated in the eastern interior regions, and temperatures were below normal from the eastern interior to southeast panhandle but above normal along the west and north coasts. This represents a change from the near term (last 2, 3, 5, 6, and 8 months) when wetter-than-normal conditions tended to dominate, and from the unusual warmth of the winter. The dryness of February is evident in the high elevation (SNOTEL) as well as the low elevation stations, and a similar relationship is evident for the wetter-than-normal water year to date (October 1 to present). The February snow water content continued below normal in the southern basins and stations but near to above normal in the interior. Dryness at interior stations and some panhandle stations is evident at 11 to 12 months, with the pattern becoming mixed at longer time periods (last 24 to 36 months). There was no change in the depiction on the USDM map, with 12.3 percent of Alaska continuing to experience abnormal dry conditions to moderate drought, and less than one percent of that amount being moderate drought.
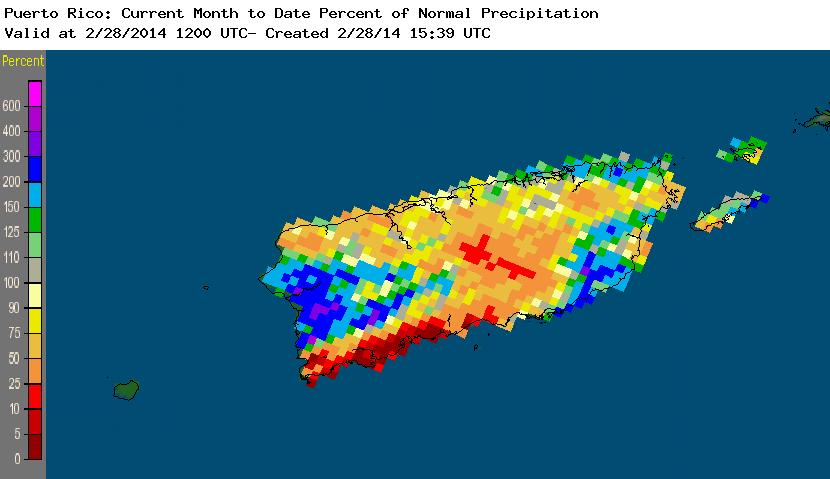
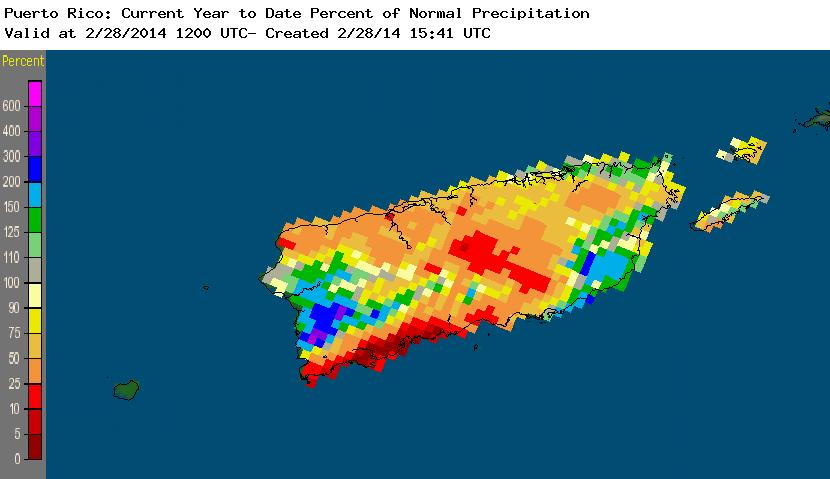
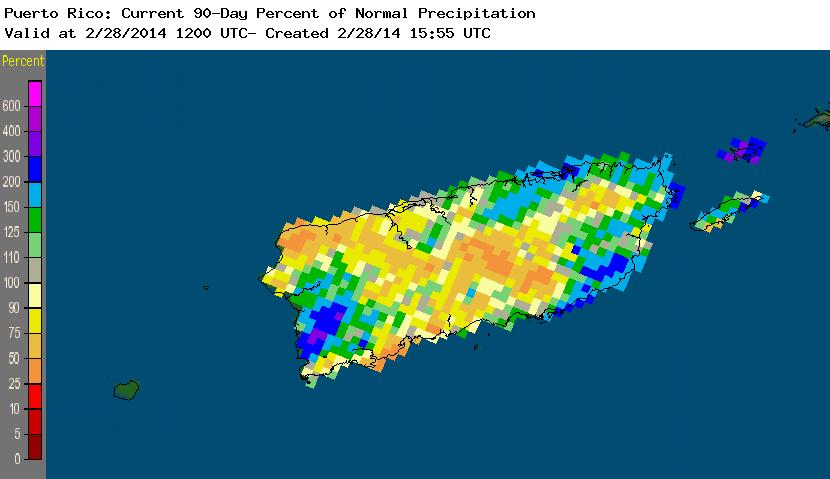
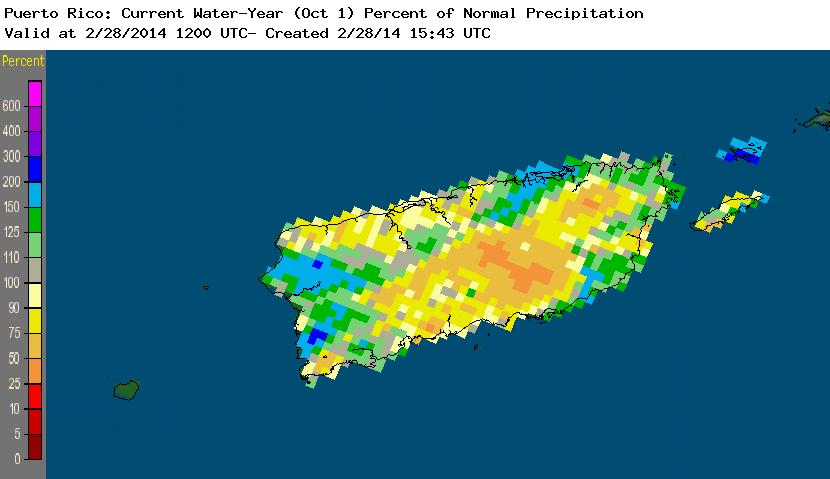
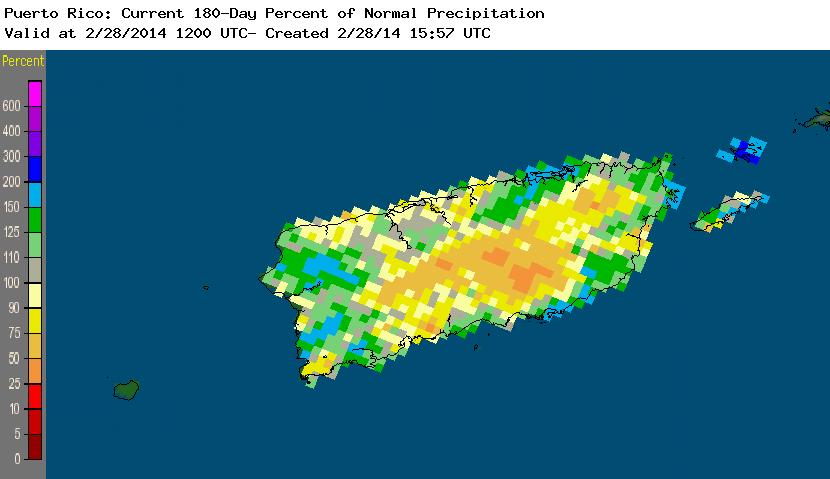
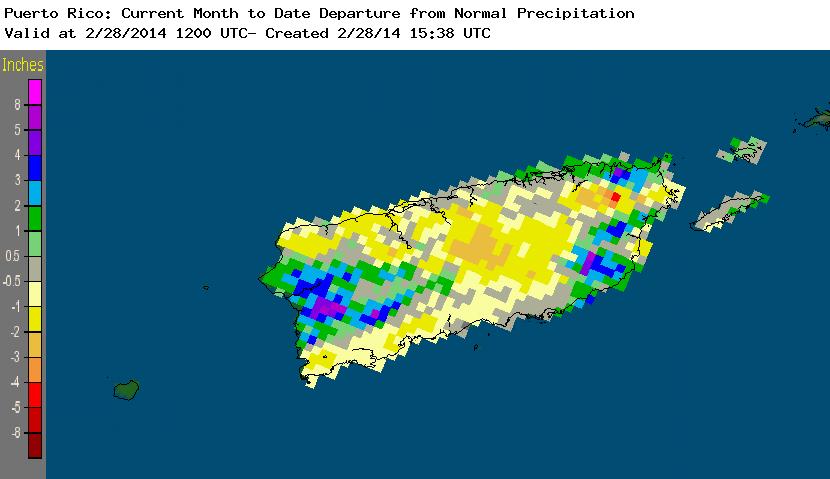
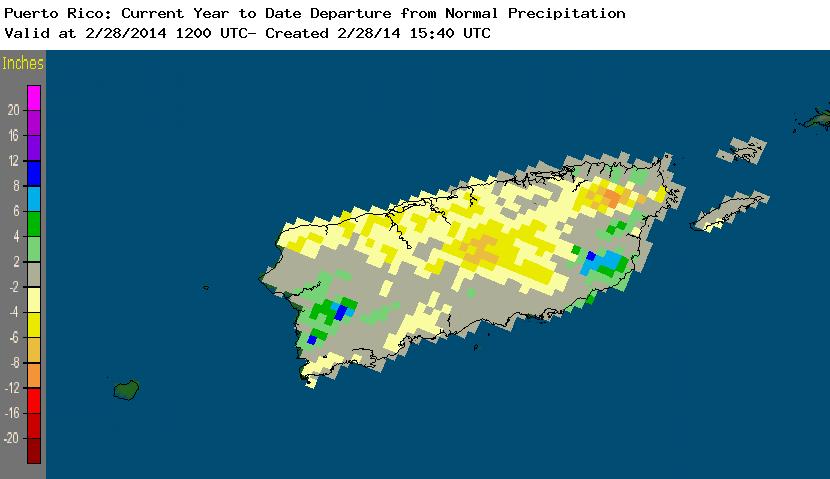
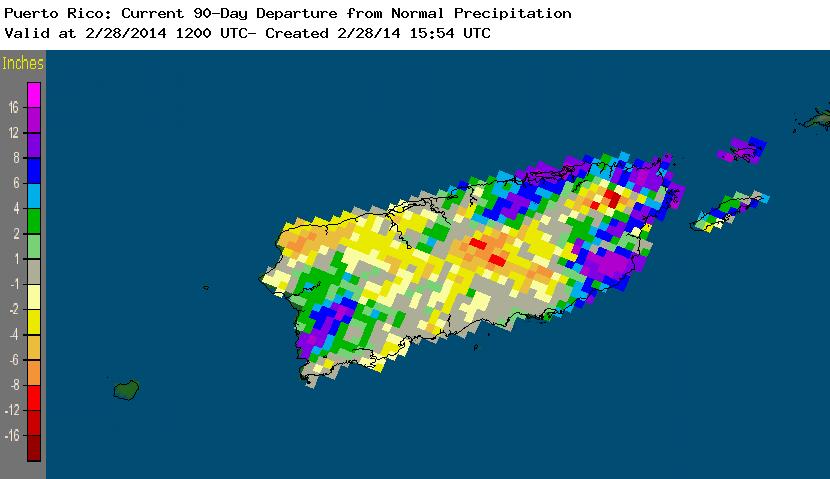
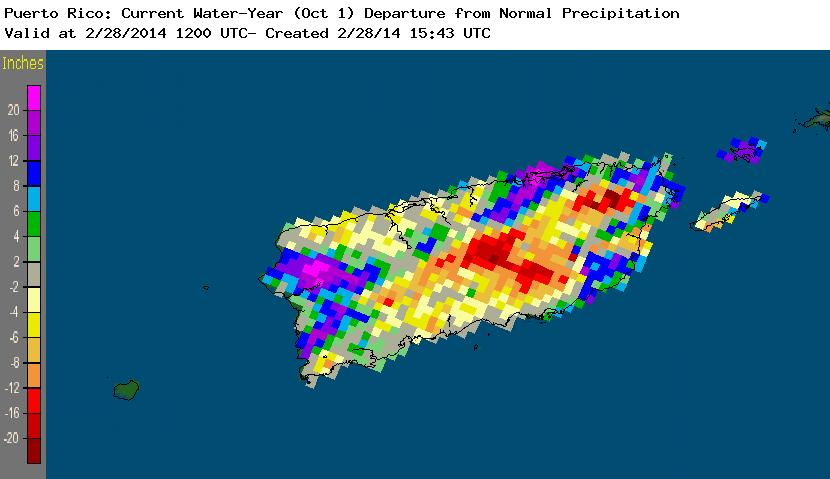
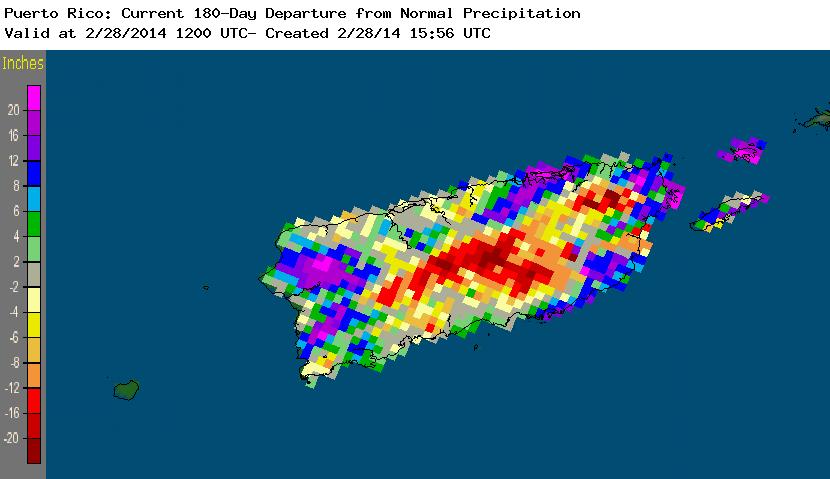
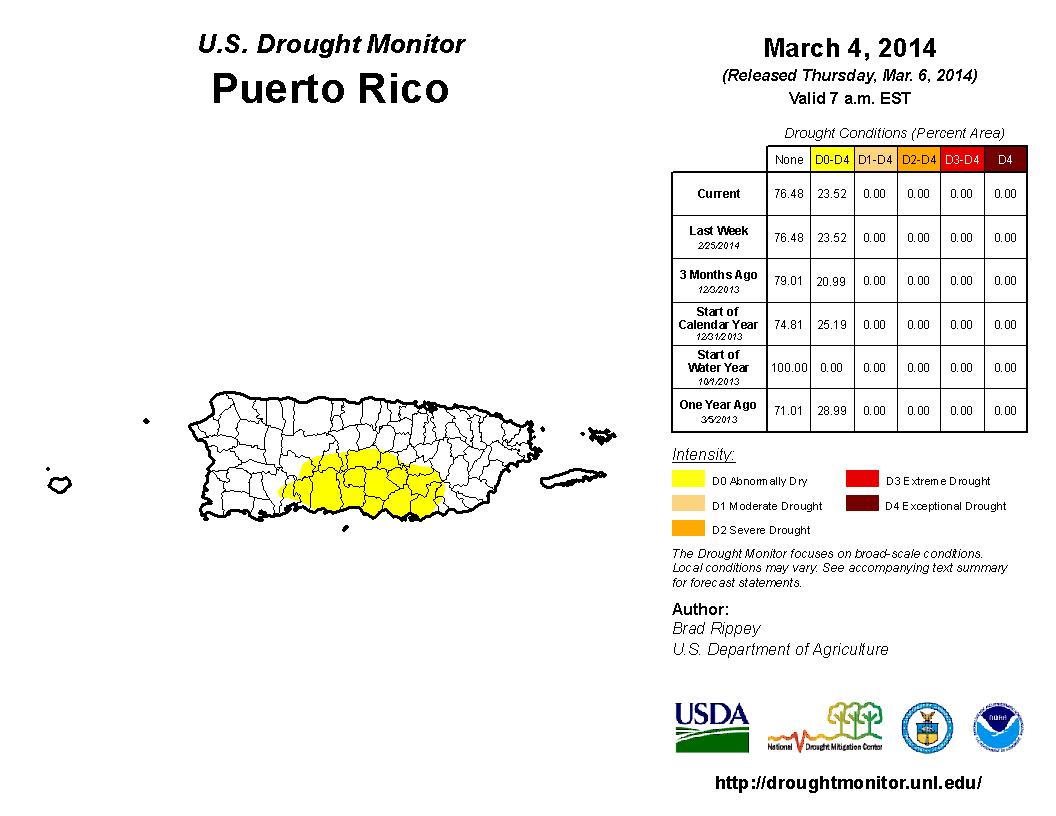
Puerto Rico: February 2014 was drier than normal in interior Puerto Rico and along the southwest and northwest coasts. This pattern was evident at two and three months, but became centered from the interior to south central regions at five and six months. The greatest precipitation departures were at interior locations (last 1, 2, 3, 5, and 6 months), with departures of -12 to -20 inches common at five and six months. February streamflows were below normal at interior and south central stations. There was no change in the depiction on the USDM map, with about a quarter (23.5 percent) of the island rated abnormally dry.
|
|
|
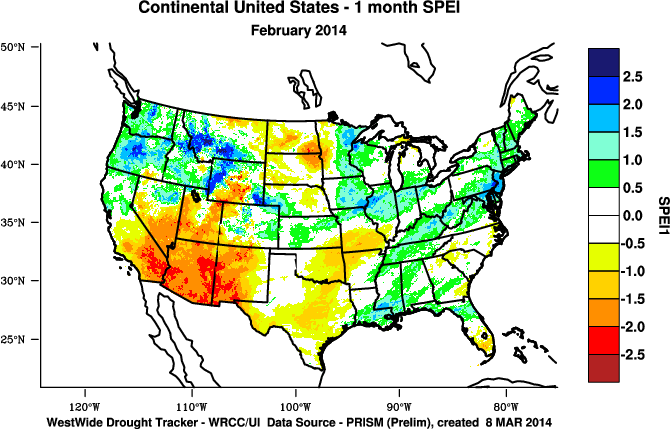
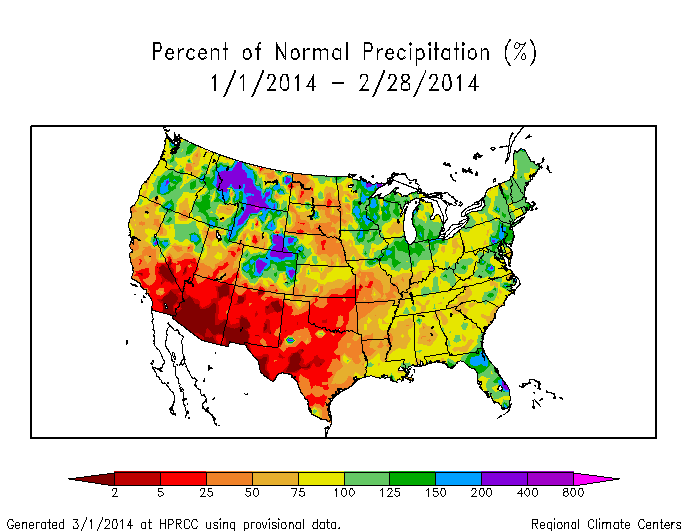
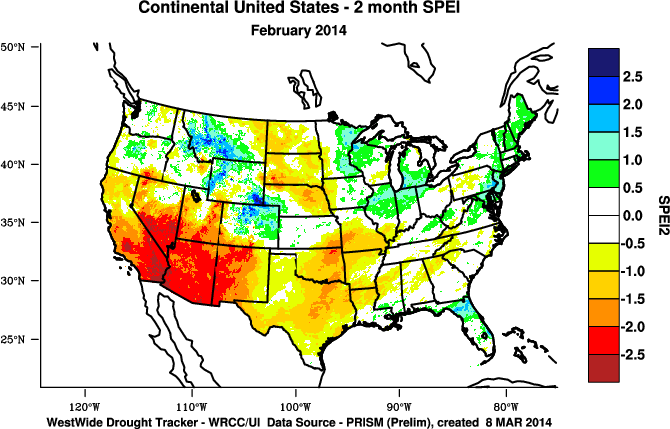
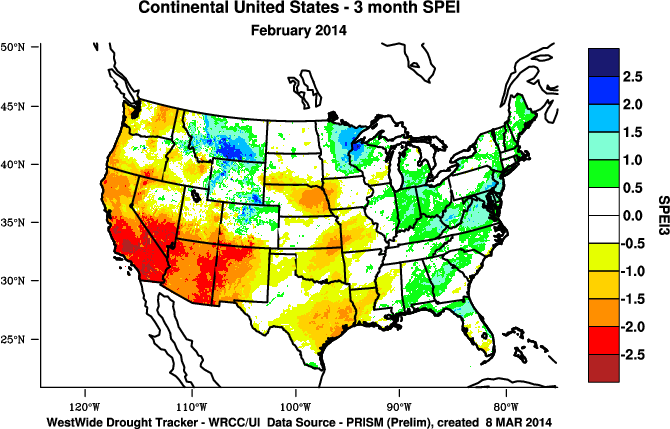
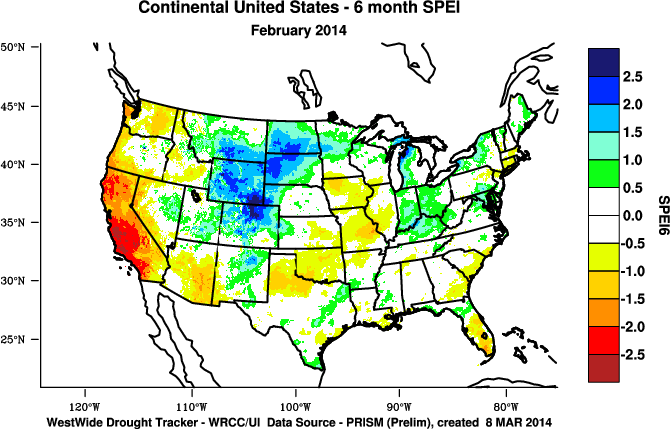
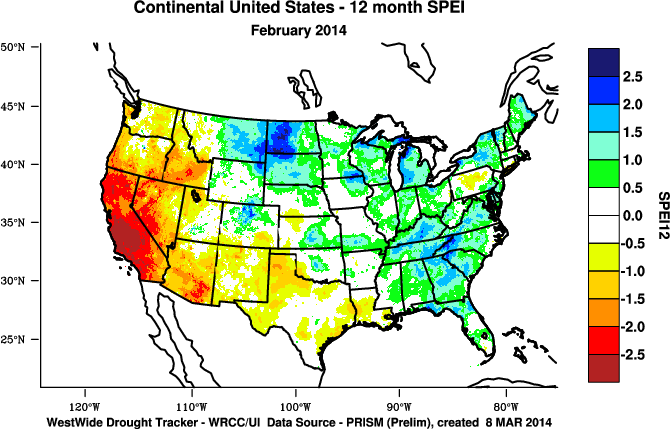
The February precipitation anomaly pattern of dryness in the Southwest, Great Plains, and Mid-Mississippi Valley was reflected in the state ranks, with eleven states having February precipitation ranks in the dry third of the historical record, three of which ranked in the top ten driest category. Arizona had the eighth driest February in the 1895-2014 record, and New Mexico and Oklahoma ranked ninth driest. The SPI measures water supply (precipitation), while the SPEI (Standardized Precipitation Evapotranspiration Index) measures the combination of water supply (precipitation) and water demand (evapotranspiration as computed from temperature). The unusual warmth in the Southwest exacerbated the drought conditions as seen by more severe SPEI drought values when compared to the SPI values.
 |
|
The year-to-date (January-February) precipitation anomaly pattern of dryness was similar to that for February, but also included the Southeast and parts of the Northeast. It was reflected in the state ranks, with 21 states having January-February precipitation ranks in the dry third of the historical record, five of which ranked in the top ten driest category. New Mexico had the driest January-February in the 1895-2014 record, Arizona and Oklahoma ranked fourth driest, Texas fifth driest, and Missouri tenth driest. In fact, five of the last six years have had a drier-than-average start of the year for New Mexico. The Southwest has been persistently warm, for January-February and longer time periods, with Arizona and California having the warmest January-February on record. As with February, this year-to-date warmth exacerbated the drought conditions as seen by more severe SPEI drought values when compared to the SPI values.
|
|
|
The winter 2013-2014 (December-February) precipitation anomaly pattern of dryness in the West, Central to Southern Great Plains, and adjacent Mississippi Valley was generally reflected in the state ranks. Eighteen states ranked in the driest third of the historical record, with California, Arizona, and New Mexico having the third driest winter on record and Texas the tenth driest. The unusual warmth in the Southwest persisted through the winter, with California having the warmest winter on record and Arizona the fourth warmest. As with February and the year-to-date, this winter warmth exacerbated the drought conditions as seen by more severe SPEI drought values when compared to the SPI values.
|
|
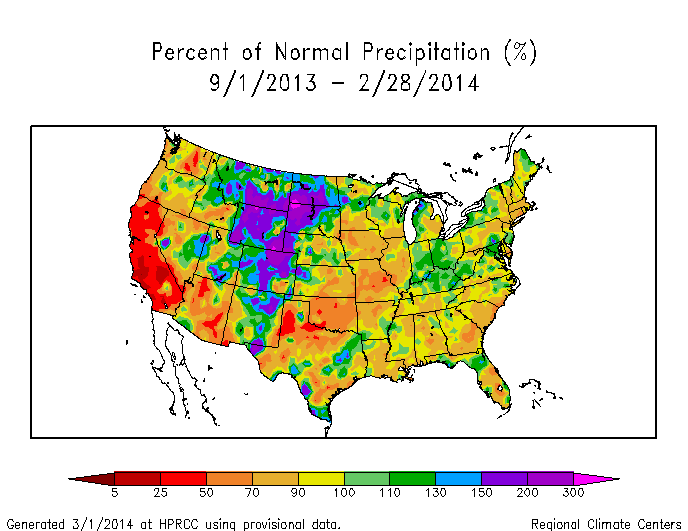
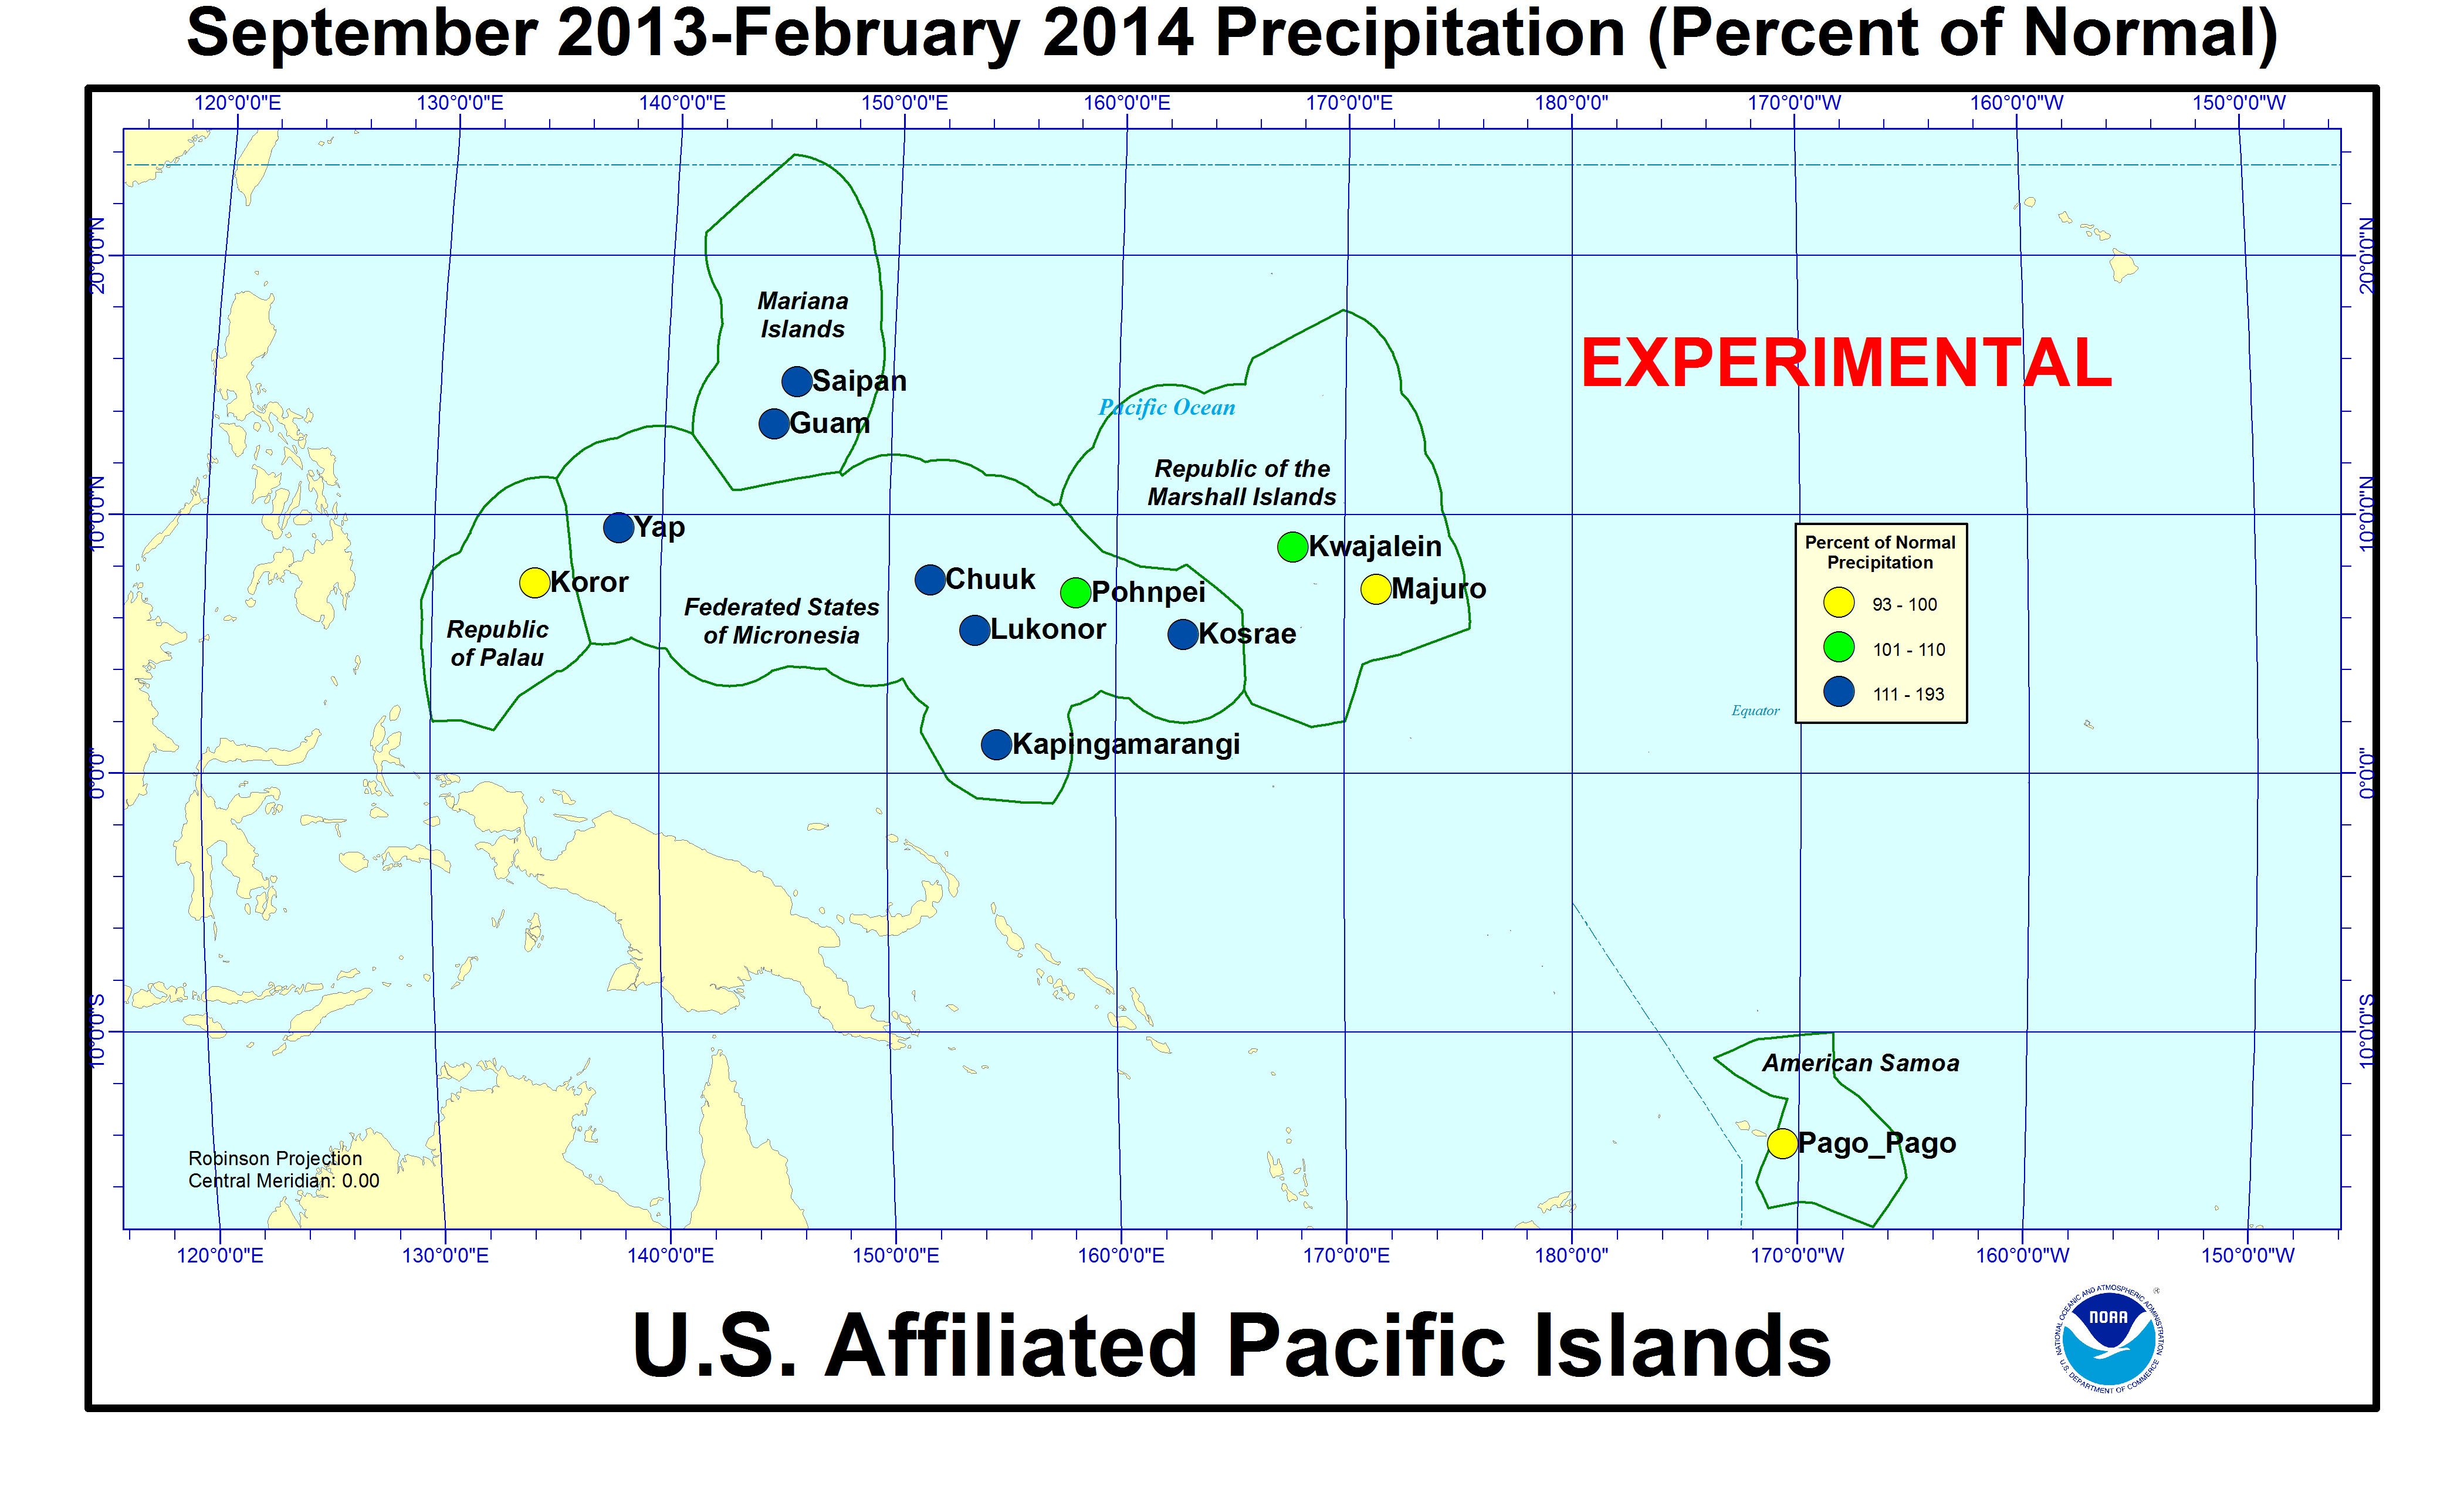
The primary dry areas during September 2013-February 2014 were the West Coast, Southwest, Southern Plains to Midwest, and parts of the Southeast and Northeast. California had its third driest September-February and Connecticut its seventh driest, while eleven other states ranked in their driest third of the historical record. While the Southwest was warmer than normal for September 2013-February 2014, the SPEI drought values were similar to the SPI values.
|
|
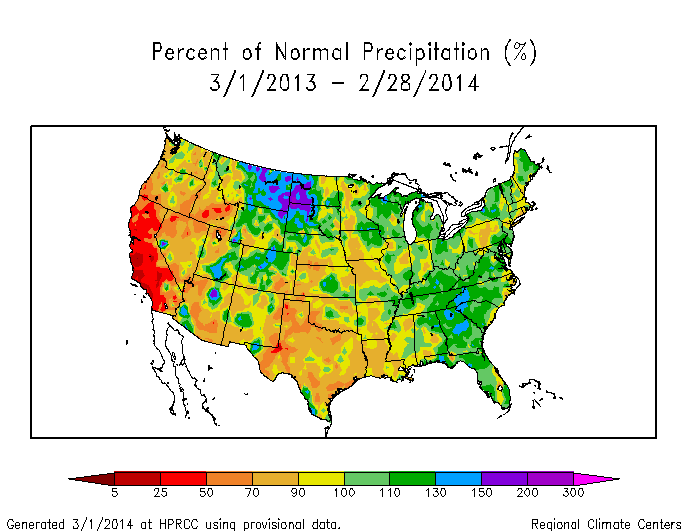
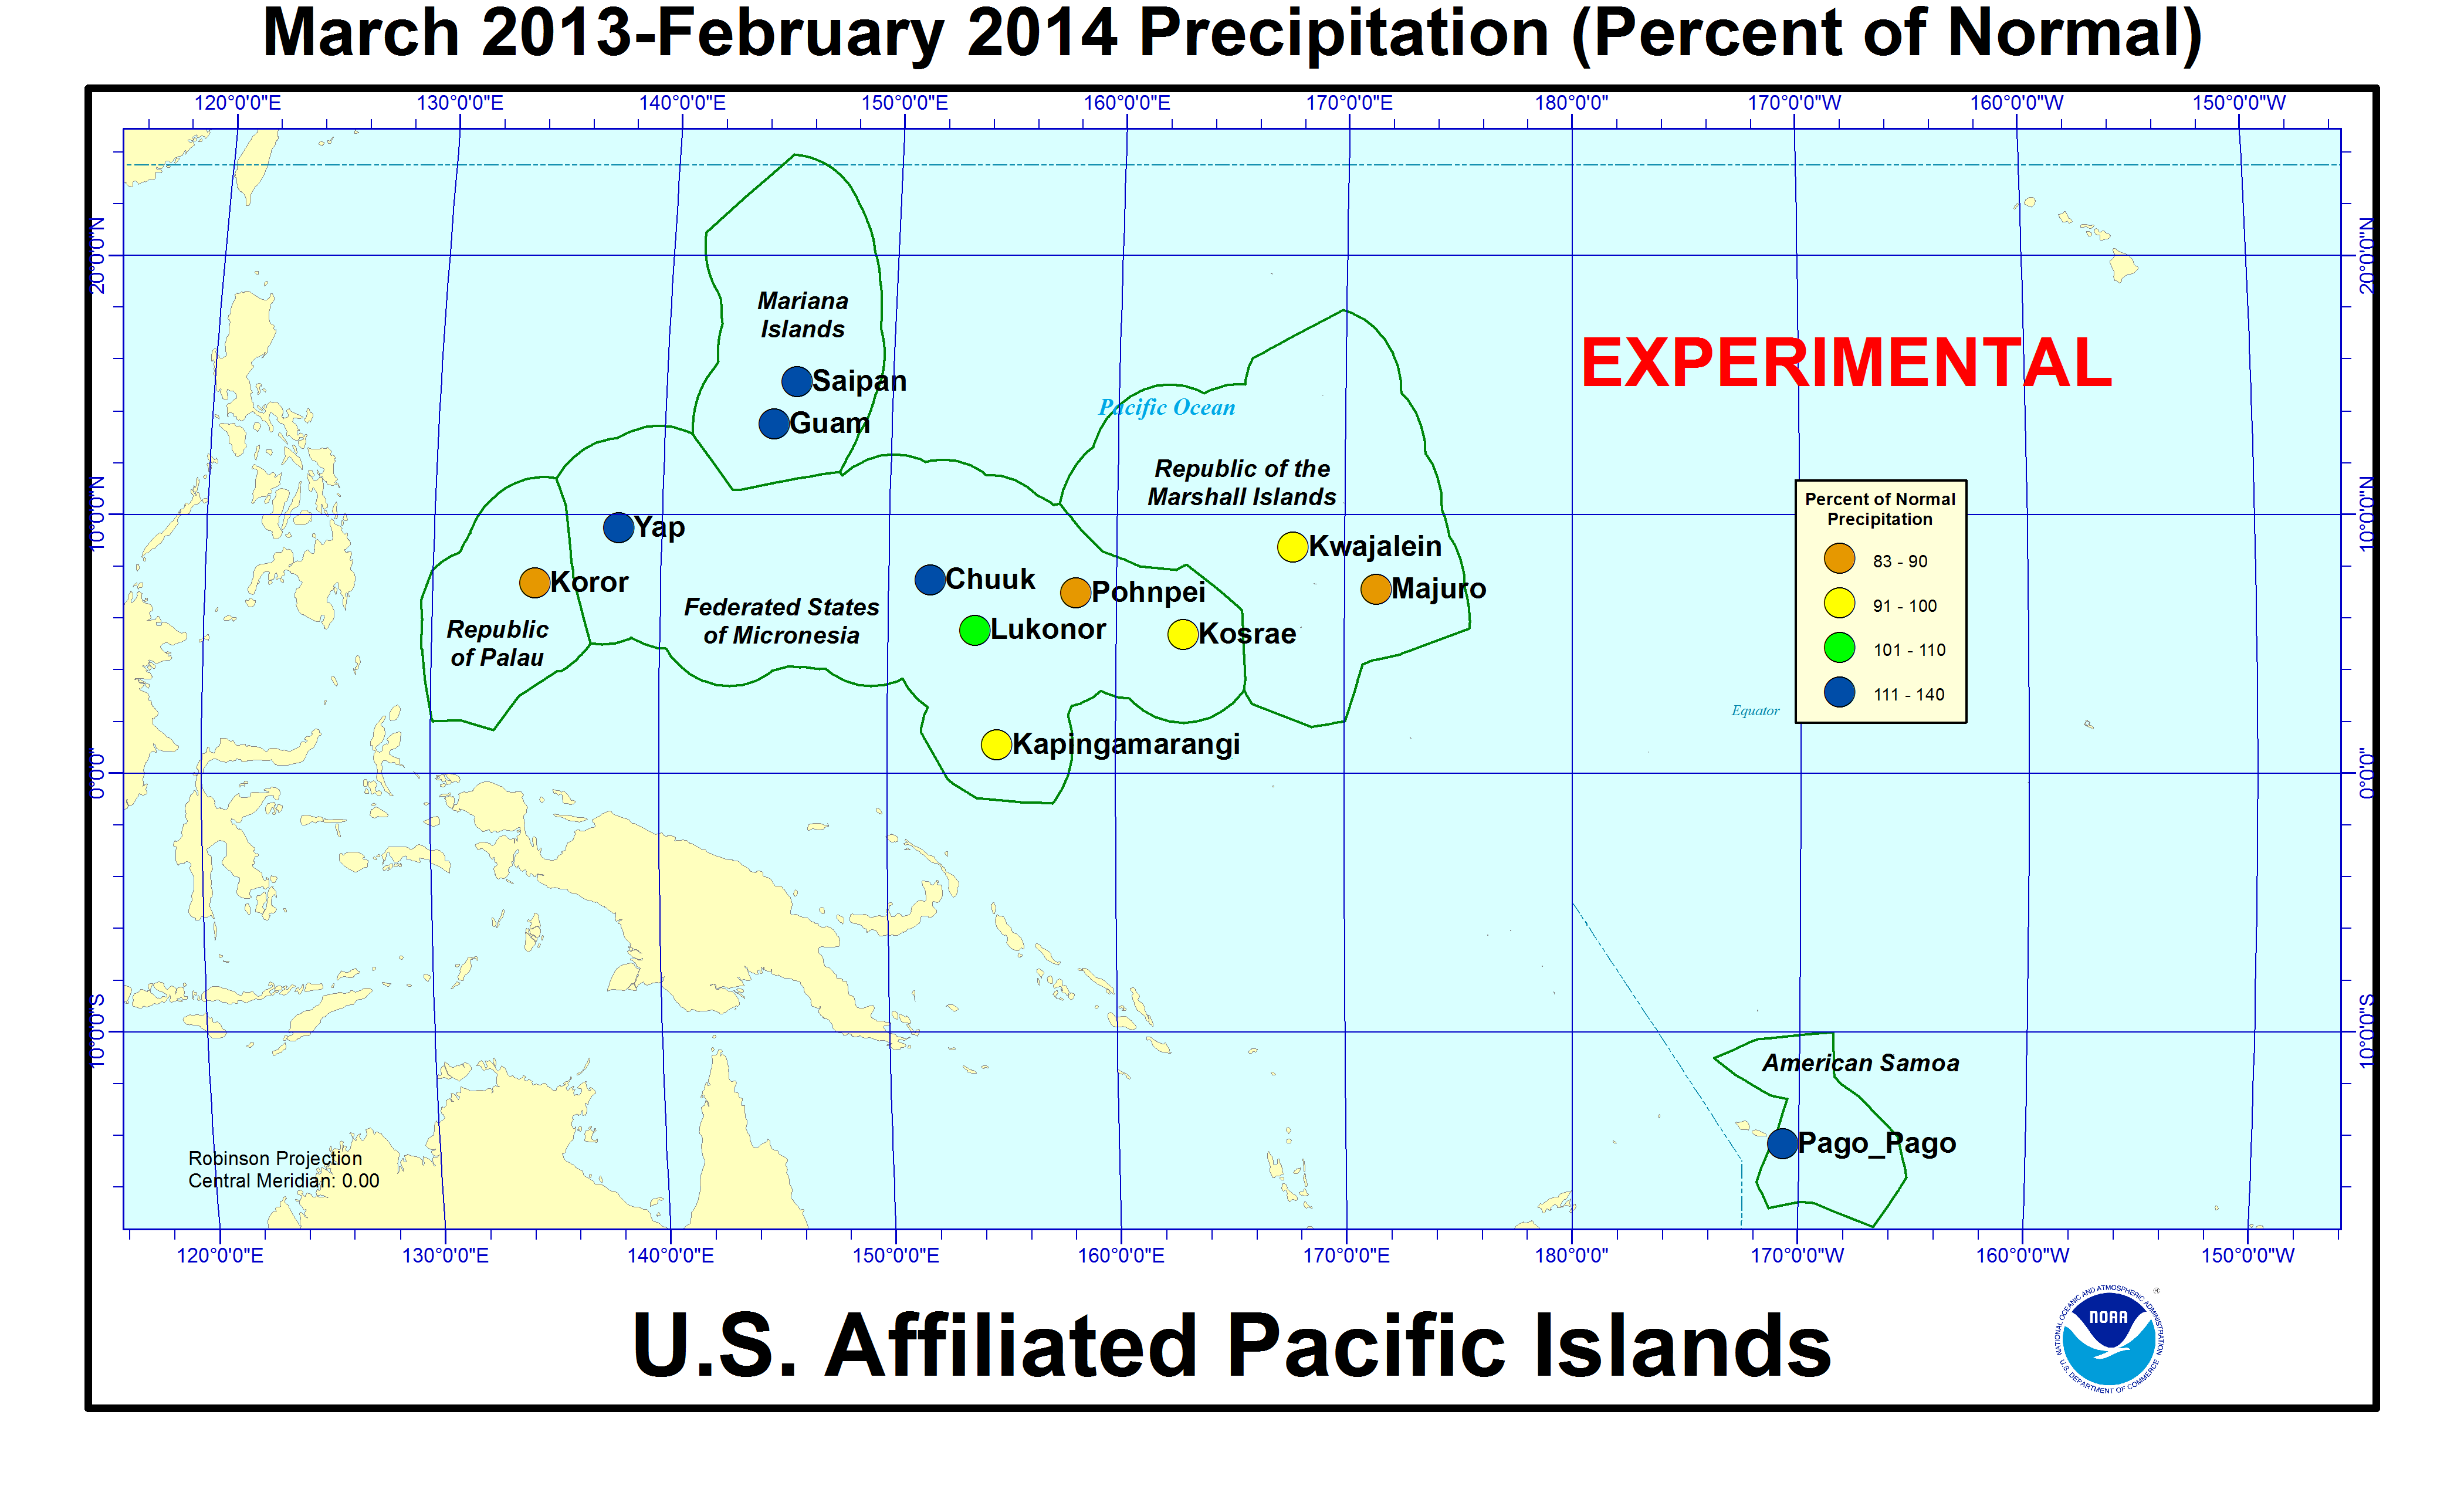
For the last twelve months (March 2013-February 2014), dryness dominated the West Coast and Pacific Northwest, and Central to Southern Plains, with patchy dry areas in the Southwest, Midwest, and Northeast. California was especially hard hit, having the driest March-February on record, in spite of the February 2014 precipitation. Seven other states ranked in the driest third of the historical record. States in the Southwest, Central Plains, Midwest, and Northeast (except Connecticut) ranked near- to above-normal because of pockets of wetter-than-average weather which influenced the statewide ranks. The West has experienced unusual warmth for most of the last twelve months. California and Arizona had the warmest March-February in the 1895-2014 record, with 2014 capping a remarkable warming trend for each. Nevada had the second warmest, and Idaho and Oregon the tenth warmest, March-February, with 14 other states (in the West and along the East Coast) ranking in the warmest third of the historical record. The record warmth in California exacerbated the drought conditions as seen by more severe SPEI drought values when compared to the SPI values.
|
|
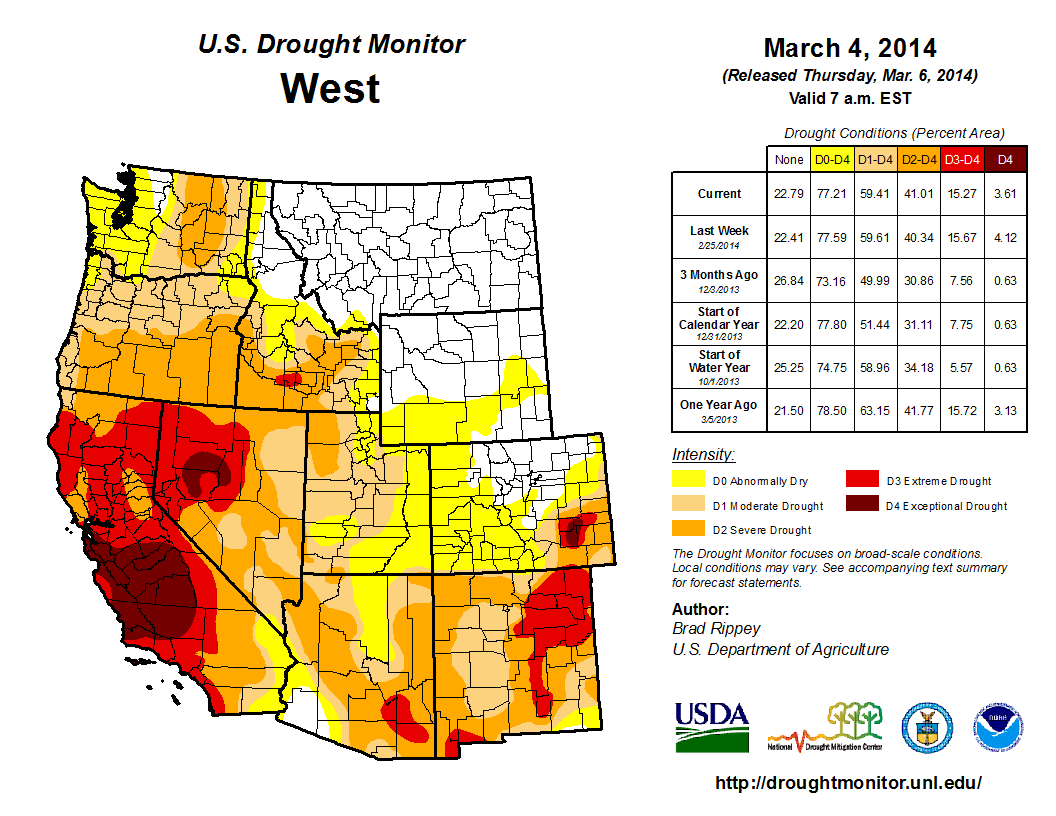
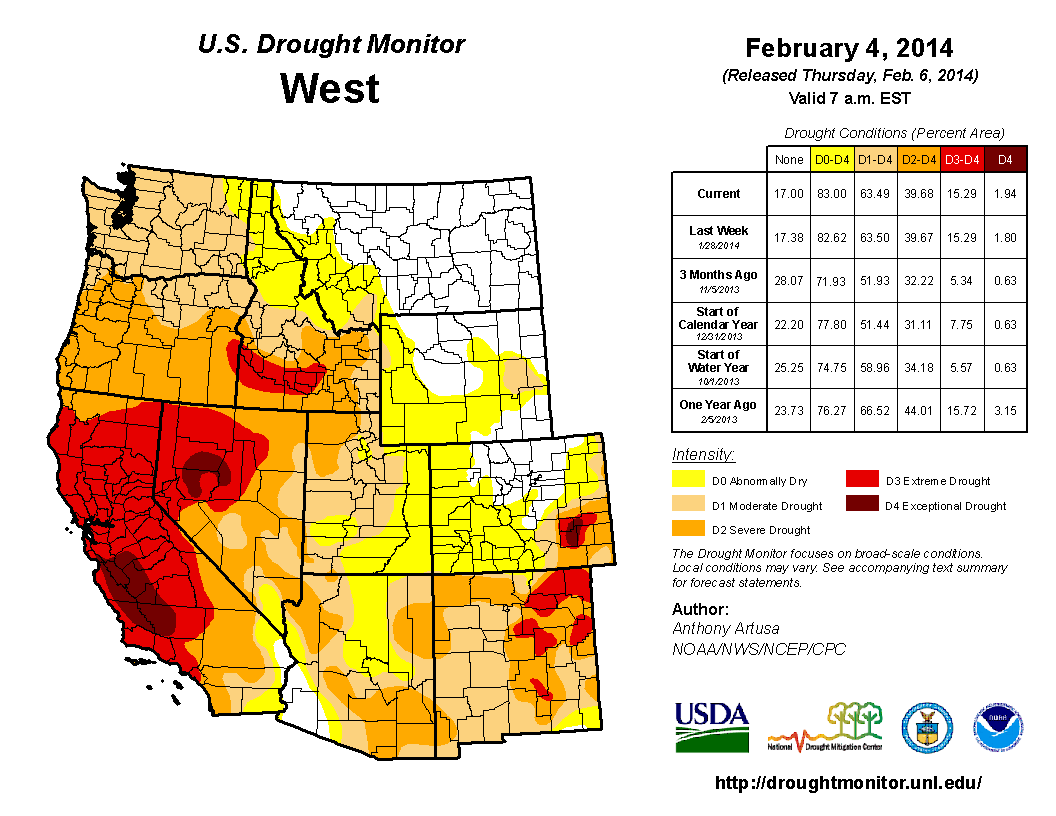
 Percent area of the Western U.S. in moderate to extreme drought, January 1900 to present, based on the Palmer Drought Index. As noted above, dry weather has dominated the West for the last several months, resulting in reduced mountain snowpack and lake, reservoir, and stream levels. According to the USDM, 59.4 percent of the West was experiencing moderate to exceptional drought at the end of February, a decrease of about 4.1 percent compared to the previous month. The Palmer Drought Index percent area statistic was 59.8 percent, a decrease of about 1.4 percentage points from the previous month. This reflected contraction of drought in the Pacific Northwest and expansion in the Southwest (PDSI for February vs. January). |
|
|
California climate division 6 (South Coastal Drainage) PDSI, January 1900-February 2014.
The dryness has been so severe in parts of southern California, and the temperatures (evapotranspiration) so hot, that locally the drought has reached record levels. The PDSI for the South Coastal Drainage region of California (climate division 6) has exceeded the driest value previously set in 2007 and again just last summer. The Central Coastal Drainage region of California (climate division 4) is in a virtual tie with the driest PDSI set during the summer of 1977, and the San Joaquin Valley region of California (climate division 5) has a PDSI value approaching the record value also set during the summer of 1977.
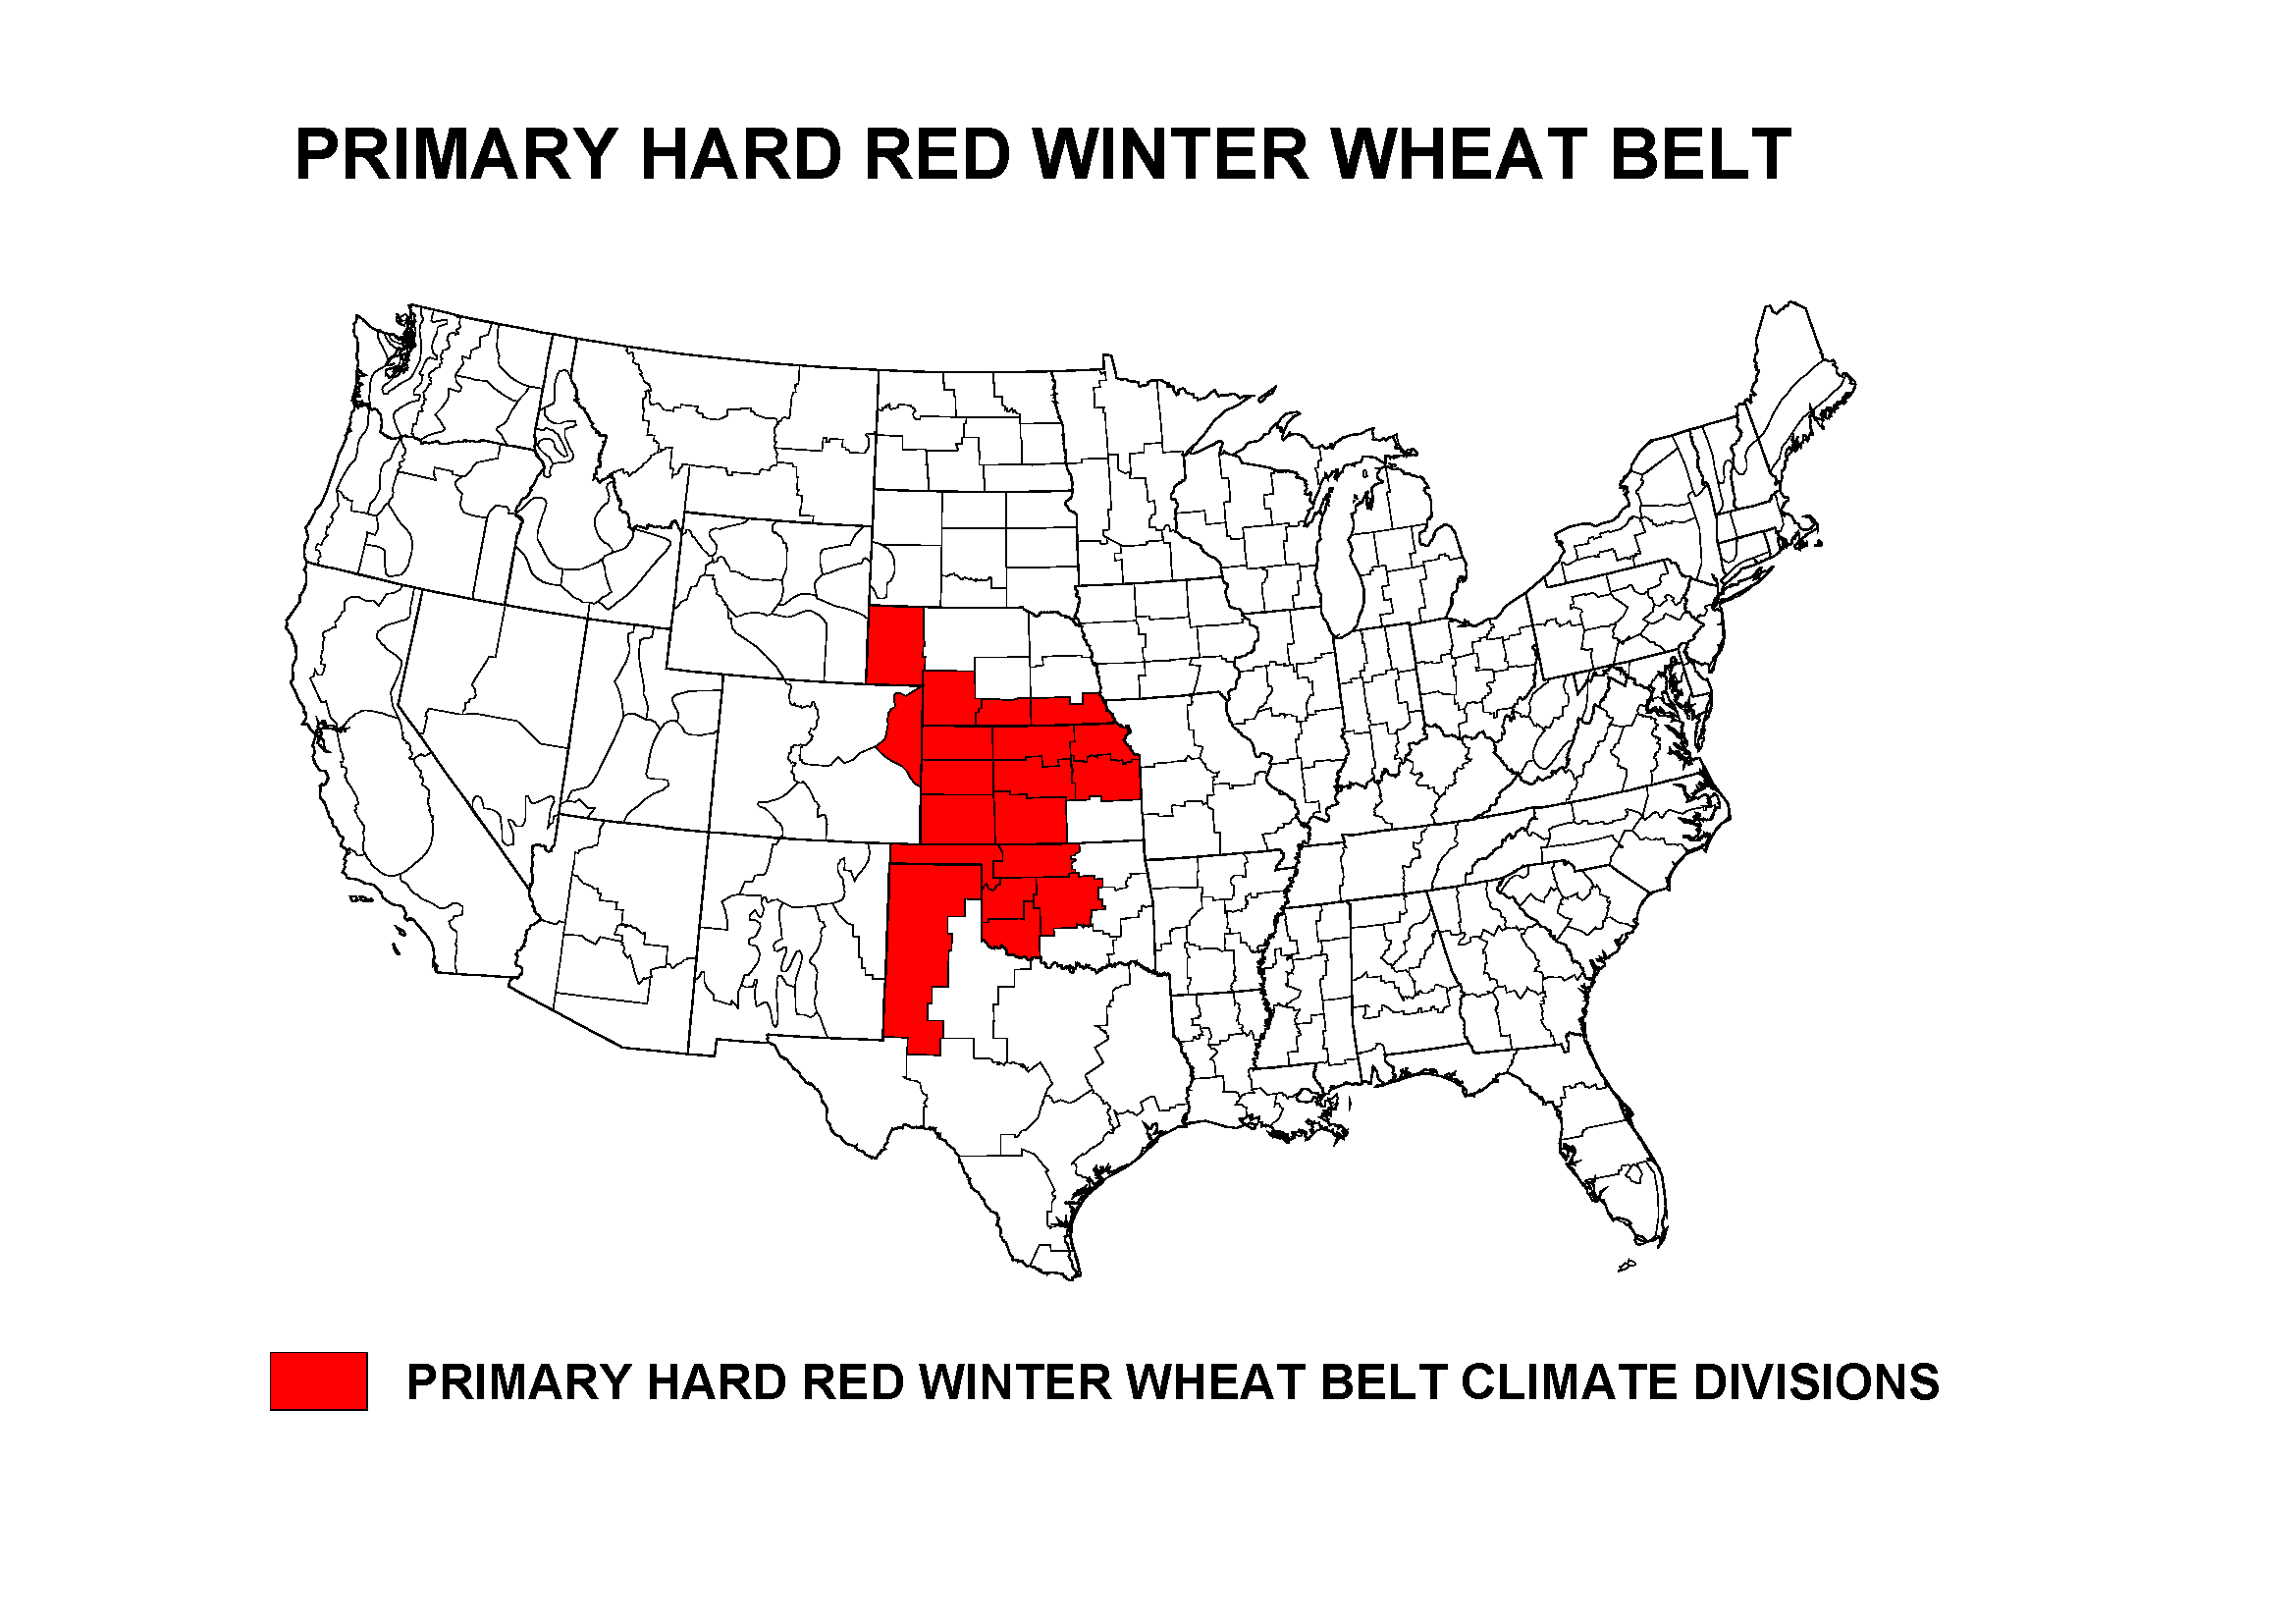
Primary Hard Red Winter Wheat Agricultural Belt
|
 |
The February precipitation pattern for the Primary Hard Red Winter Wheat agricultural belt was much drier than normal, especially in the southern regions, with February 2014 ranking as the 41st driest and 15th coolest region-wide. The growing season to date (October 1-present) also ranked as the 41st driest but 27th coolest October-February.
|
 |
The February precipitation pattern reveals dry conditions over several river basins, especially in the south. The Rio Grande river basin had the tenth driest February in the 1895-2014 record. In fact, seven of the last nine Februaries have been much drier than the long-term average. The hydrologic year (which starts October 1) was also dry, ranking as the 28th driest October-February, and marks several years when the precipitation has been consistently below average. The Arkansas-White-Red river basin, the western portion of which overlaps the southern portion of the Primary Hard Red Winter Wheat Belt, had the 14th driest February and 29th driest October-February on record. The Lower Colorado river basin has been consistently dry in recent months, with the eighth driest February, 14th driest October-February, and 41st driest March-February.
NOAA Regional Climate Centers:
A more detailed drought discussion, provided by the NOAA Regional Climate Centers and others, can be found below.
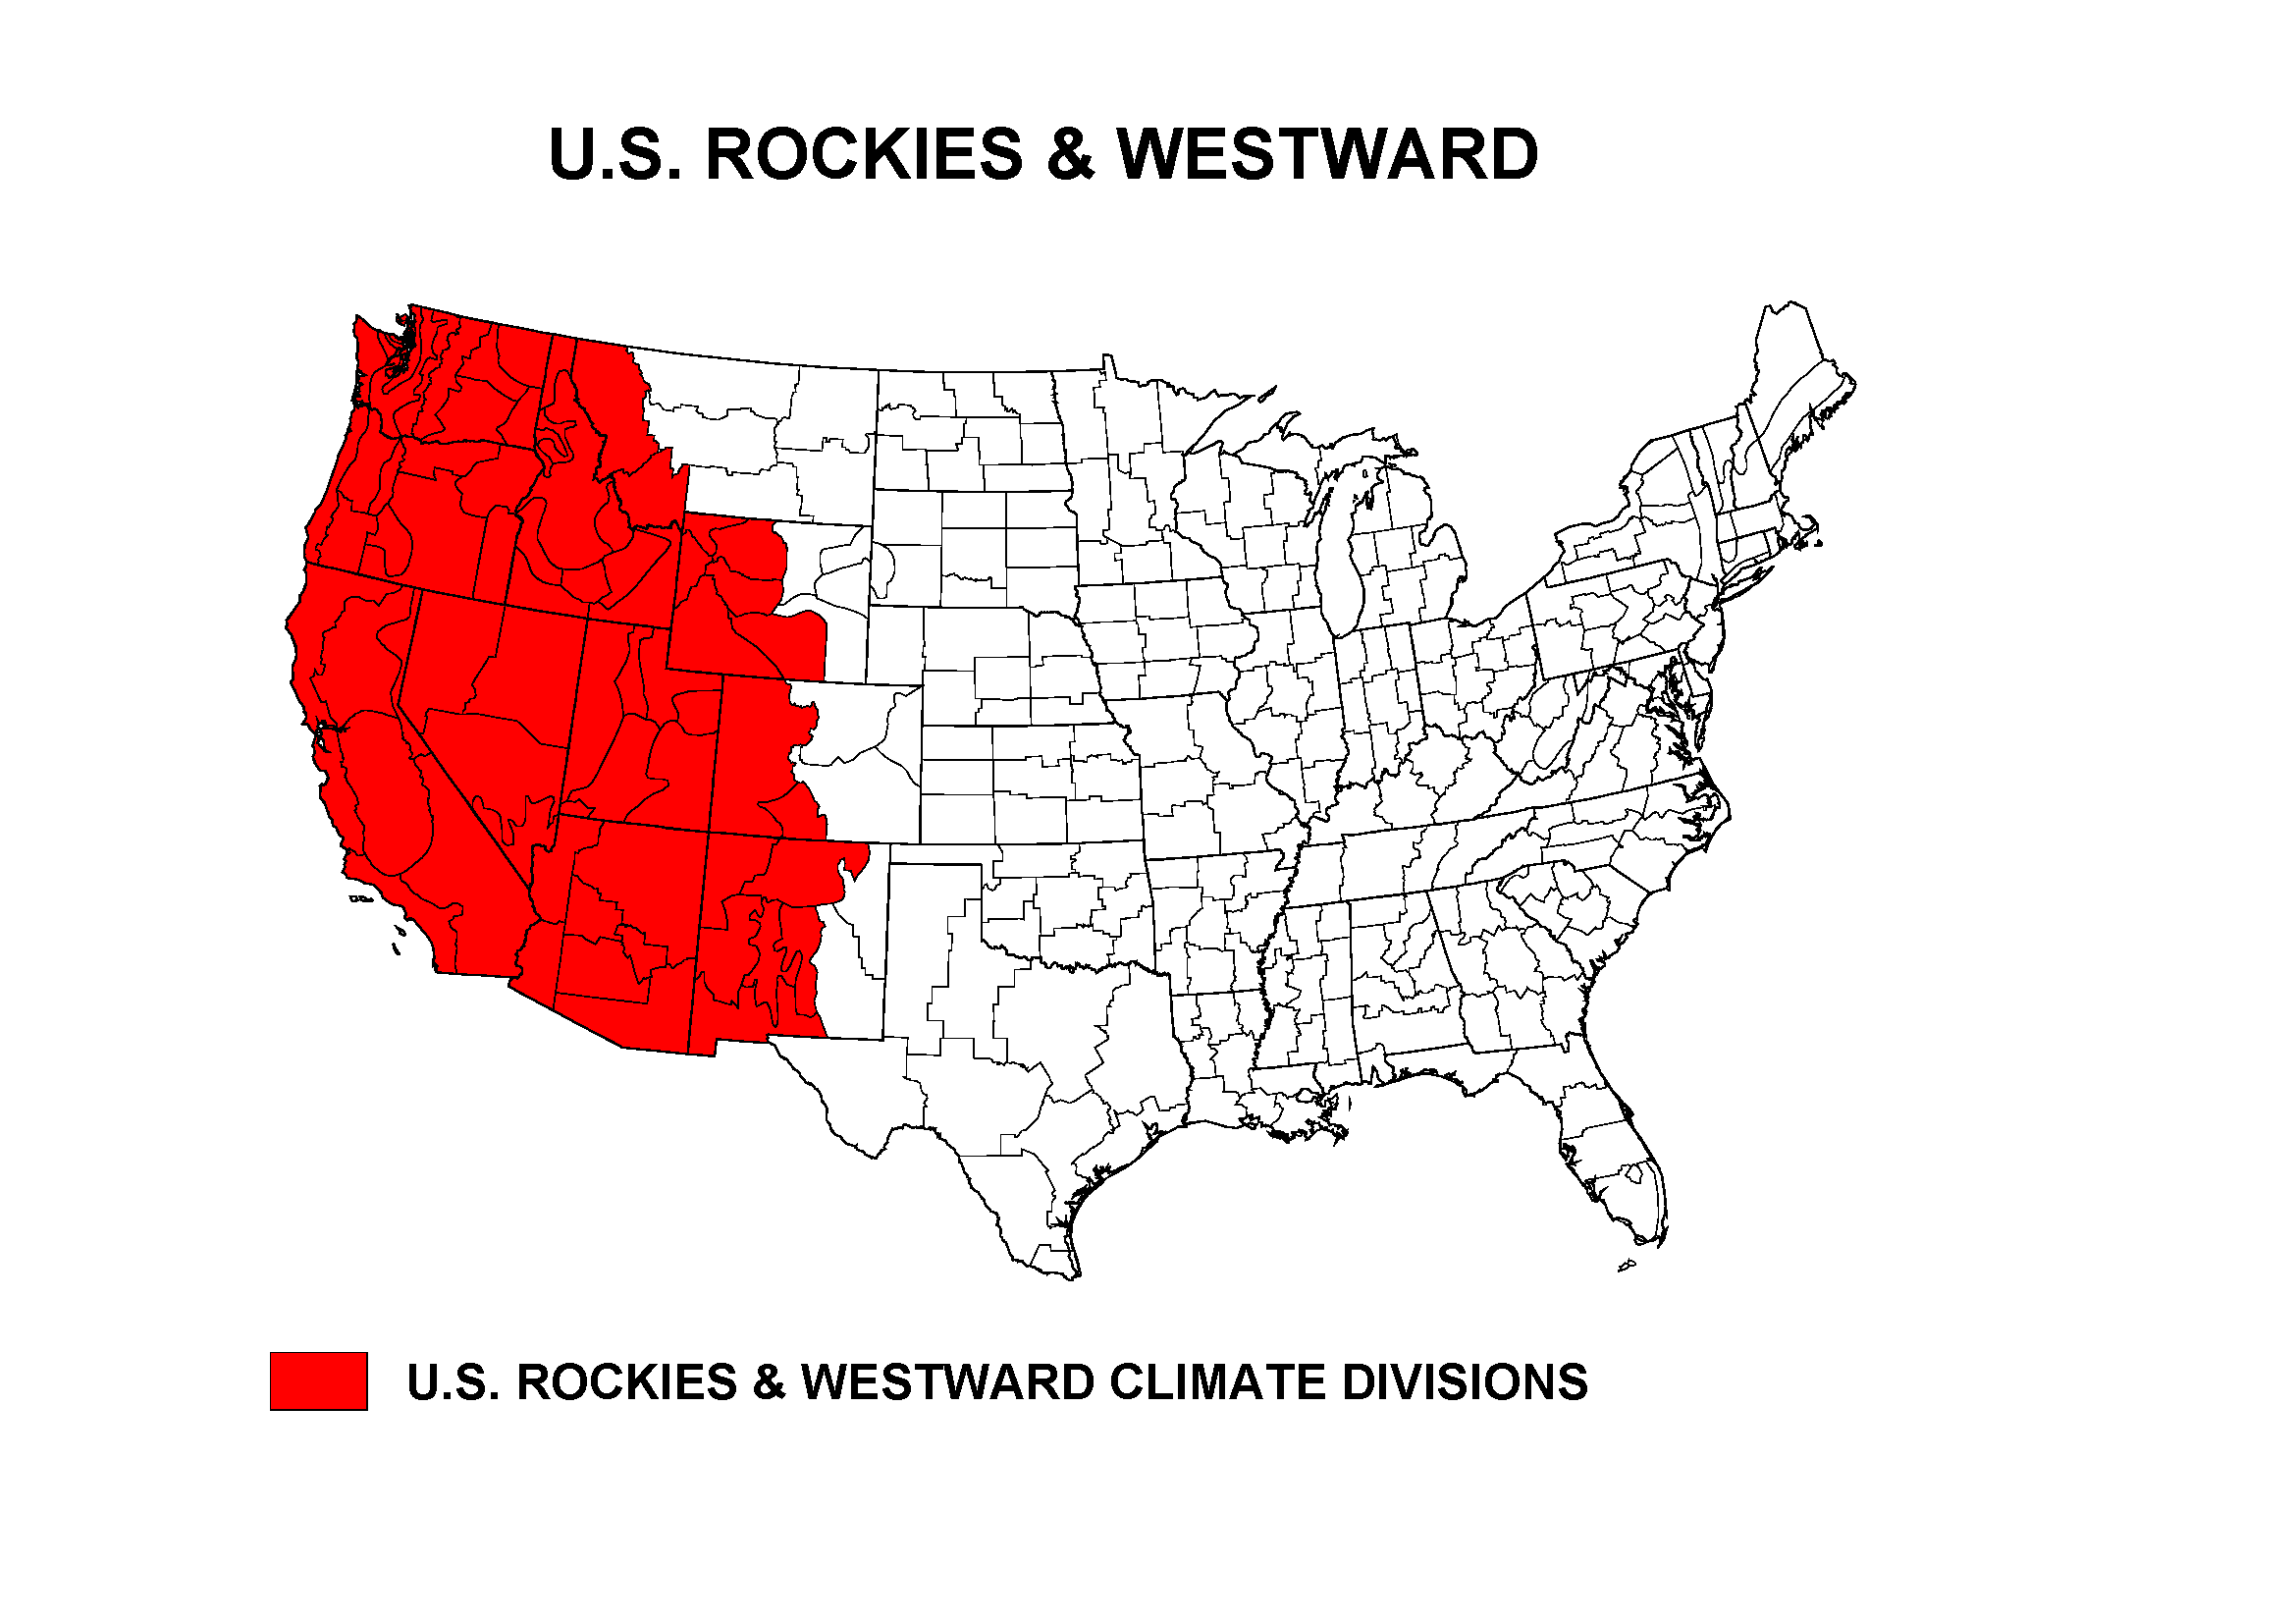
West — Pacific Islands
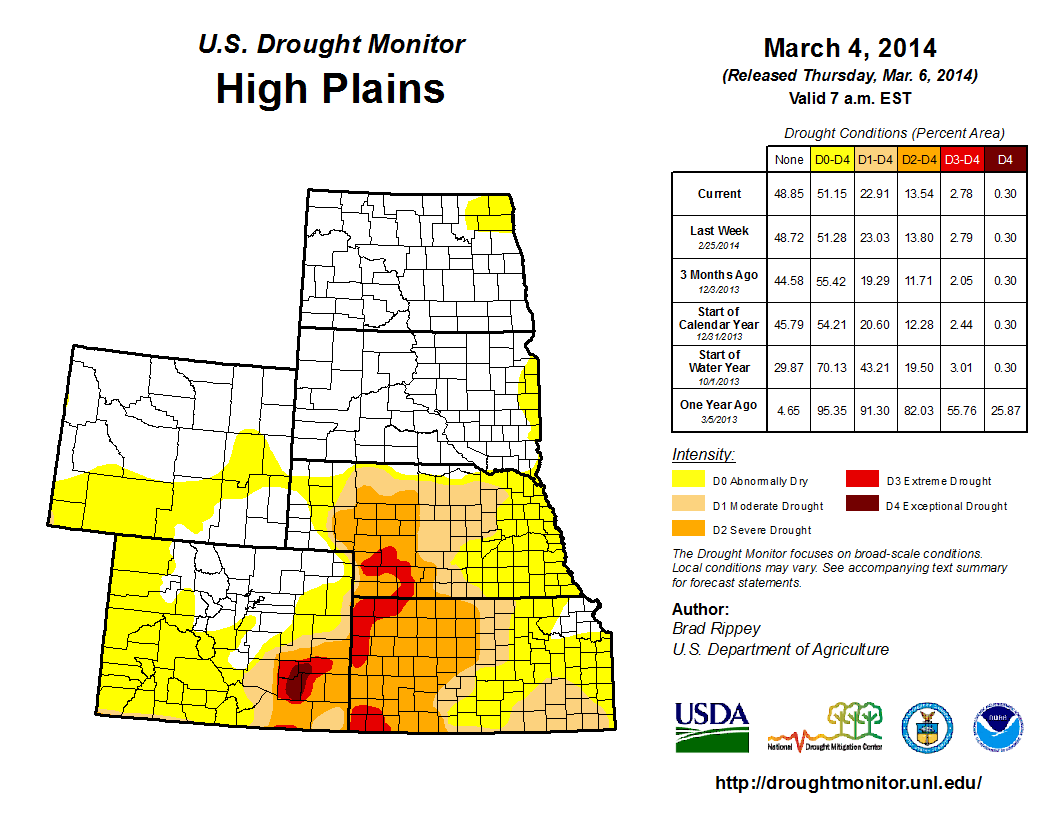
As described by the High Plains Regional Climate Center, February 2014 was a cold month and precipitation was quite varied across the High Plains region. Most areas of the region had below normal precipitation with southeastern North Dakota, northeastern South Dakota, and southeastern Kansas being the driest. These areas picked up liquid equivalent precipitation totals that were only at most 25 percent of normal. Luckily, winter is a dry time of year for the plains, so these precipitation deficits were not too troublesome. Meanwhile, areas receiving above normal precipitation included western and northern Wyoming, western Colorado, and an area encompassing eastern Wyoming, northeastern Colorado, and the panhandle of Nebraska. These wetter areas all received liquid equivalent precipitation totals of at least 150 percent of normal. February snowfall rankings indicate that some locations throughout the region ranked in both the top 10 snowiest and least snowiest on record. Even though much of the region had below normal precipitation, several weather systems brought snow to the Rockies and improved the snowpack in both Colorado and Wyoming. While southern basins in Colorado were running 15-23 percent below average, other basins were near to above normal which brought Colorado's statewide average at the end of February to 111 percent — up considerably from last month's 94 percent. Meanwhile in Wyoming, the statewide snowpack at the end of the month was 132 percent of average, also up from last month's 113 percent.
Typical for this time of year, there were only small changes to the USDM in the High Plains region this month. Approximately 23 percent of the region was in moderate (D1) to exceptional (D4) drought at the end of February, which was unchanged from January. While the percentage of area in drought remained about equal, some small areas had improvements and others had degradations. For instance, Wyoming's last remaining D1 areas were eliminated, but D1 in eastern Kansas expanded. The extreme (D3) and exceptional (D4) drought conditions across western Nebraska, western Kansas, and eastern Colorado remained unchanged.
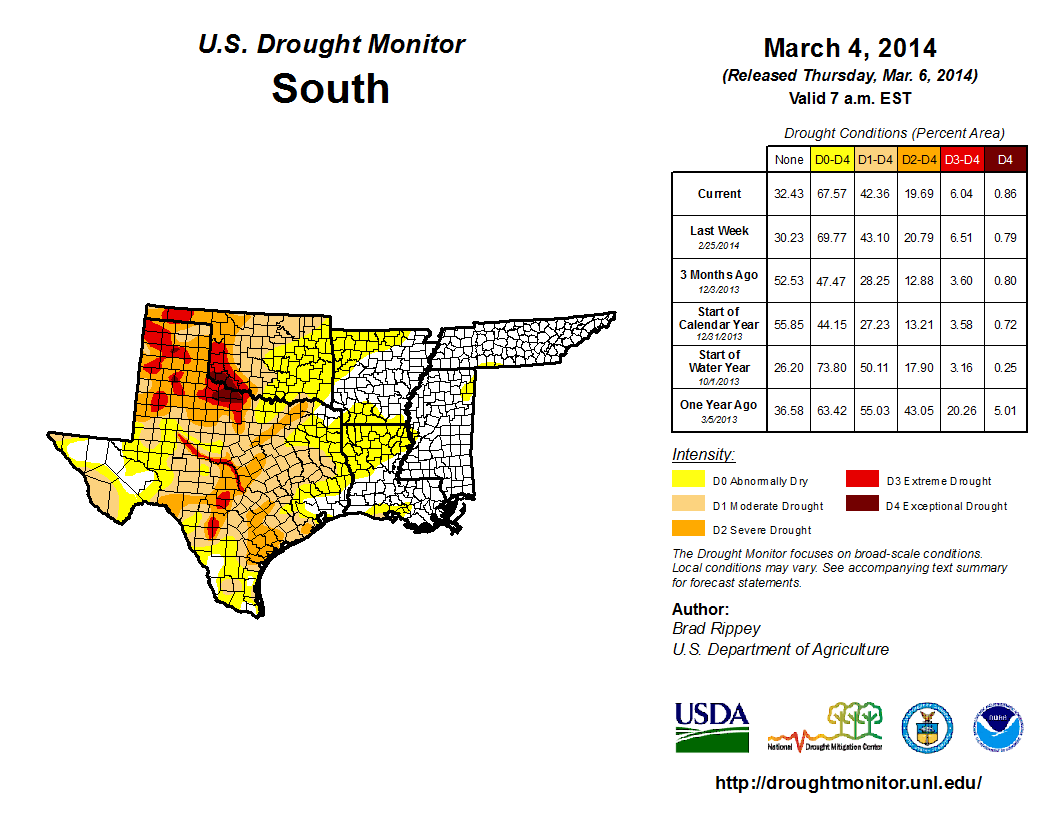
As explained by the Southern Regional Climate Center, February was generally a colder than normal month for the Southern region, and precipitation varied spatially with extreme dryness in the western half, and wetter than normal conditions along the south central Gulf coast. In the western half of the region, precipitation totals varied from under 5 percent of normal to 70 percent of normal, with most of Texas and Oklahoma receiving less than half the expected precipitation. This was also the case in northern and northwestern Arkansas. Most stations in the central portion of the region, (including southeastern Texas, northern Louisiana and southern Arkansas) reported precipitation totals that varied from 50 to 70 percent of normal. In Tennessee and northern Mississippi, precipitation totals were generally near normal to slightly below normal. Conversely, conditions were quite wet in southern Louisiana and southern Mississippi. Precipitation totals there varied from near normal to 200 percent of normal, however, most stations reported between 130 to 150 percent of normal.
Drought conditions over the month of February remained relatively unchanged in most states of the Southern region, although some abnormally dry areas (D0) were added (e.g., north western Arkansas, northern Louisiana, eastern Oklahoma), while others areas saw a reduction in abnormally dry conditions (e.g., northern Mississippi and southern Louisiana, east of the Mississippi River). In Texas, the relatively dry conditions that persisted throughout the month led to the introduction of moderate drought in the central counties, and the lack of rainfall helped drought conditions spread rapidly after the last 2 months' dry conditions, causing a slew of new fire risks across central Texas. Water, as usual, remains a problem, holding at 64%, a record low for this time of year. The city of Wichita Falls is nearing the 25% water supply levels that will require the initiation of stage 5 water restrictions preventing any nonessential water usage. A cloud seeding proposal set out last month was approved, allotting $300,000 of the city's budget to the project. Several other cities, including San Antonio, El Paso, and Leander are looking at possible upgrades to their water restrictions as well. A total of 163 counties across the state now qualify for up to $2 million in federal disaster loans due to continuing short and long term drought conditions (Information provided by the Texas Office of State Climatology).
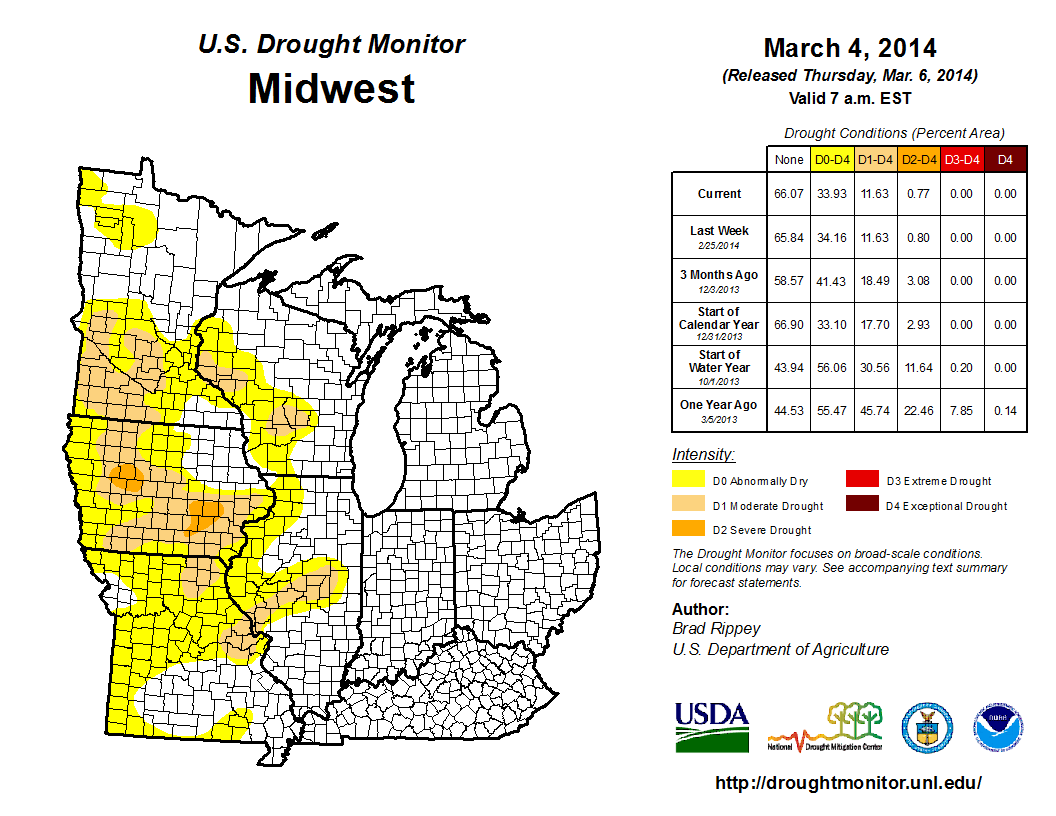
As summarized by the Midwest Regional Climate Center, February temperatures were below normal across the Midwest, while precipitation ranged from less than a quarter inch (6 mm) in western Minnesota to more than 5 inches (127 mm) in southern Kentucky. Monthly temperatures were the coldest in decades for six of the nine states in the region and the coldest since 1979 region-wide, and winter temperatures were also below normal across the Midwest and the coldest since the winter of 1978-79.
Compared to normal, the wettest location was in northeast Minnesota where totals of more than double the normal were reported. The driest areas were in western Minnesota and southwest Missouri were precipitation totals were less than 25% of normal. Snowfall in February was above normal for most of the region with just small areas in western Minnesota, southern Kentucky, and Upper Michigan below normal. Winter precipitation ranged from less than 50% of normal in parts of western Iowa and western Missouri to more than 200% of normal in northern Minnesota. Totals were generally above normal in the northern and eastern parts of the Midwest and below normal in the southwest.
As noted by the Southeast Regional Climate Center, the Southeast remained drought-free in February, with only small pockets of abnormally-dry (D0) conditions reported across extreme southern and extreme northern Alabama by the end of the month. Precipitation and mean temperatures were variable across the Southeast in February. The wettest locations were found across parts of Virginia, Alabama, and northern Florida, where monthly totals were as much as 4 inches (102 mm) above average. In contrast, the driest locations were found across South Florida and coastal sections of Georgia and South Carolina, where less than 2 inches (51 mm) of precipitation was recorded for the month.
Precipitation was variable across Puerto Rico and near average across the U.S. Virgin Islands. Mean temperatures were generally above average across Puerto Rico and the U.S. Virgin Islands in February. San Juan, PR tied its third warmest February in a record extending back to 1898. The end of February also marked the second warmest meteorological winter (December-February) in San Juan, falling just short of the record set back in 1980-1981. In addition, Miami, FL tied its third warmest meteorological winter on record.
As explained by the Northeast Regional Climate Center, based on preliminary data, the Northeast was cooler than normal during February and precipitation totals were mixed across the region. Western Pennsylvania, northern New York, and midcoast Maine were the driest spots. Those areas received 70-90 percent of normal precipitation. West Virginia, the Mid-Atlantic, eastern parts of New York and Pennsylvania, and coastal Massachusetts were the wettest areas. Those spots received 150-300 percent of normal precipitation. Scranton, Pennsylvania, had their snowiest February on record. The site received 29.3 inches (74.4 cm) of snow during the month, beating the old record of 27.9 inches (70.9 cm) set in 1914. According to the USDM released on February 6, parts of ten of the twelve Northeast states were experiencing abnormal dryness (D0). By mid-month, some areas of D0 had expanded, but the overall coverage of dryness in the Northeast decreased. Small areas of D0 were present in seven states at the end of the month. Overall, the coverage of D0 went from 13 percent of the Northeast at the start of February down to 4 percent by month's end.
As summarized by the Western Regional Climate Center, persistent ridging over the West Coast this winter weakened at times in February, allowing much-needed precipitation to reach the coastal states. Nevertheless, ridging prevailed over the West Coast this month, keeping temperatures warmer than normal over the Southwest and driving moisture into the Rocky Mountain region.
The coastal states and northern Great Basin finally saw significant precipitation this month after dry conditions dominated for much of the winter season. A tap into subtropical moisture called an atmospheric river provided abundant rain and snow to northern California and southern Oregon between the 7th and 9th. A second atmospheric river pushed moisture into Washington and Oregon from the 12th-16th. A third atmospheric river favored central and southern California over the last few days of the month with storm totals of 3-4 in (75-100 mm) observed at low elevations and totals in excess of 10 in (254 mm) in the coastal ranges. These storms allowed snow water equivalent in the Sierra Nevada to increase from 15-20% of normal at the end of January to 30-50% of normal by the end of the February. Snowpack in the northern Cascades reached over 100% of normal at month's end, a significant improvement on the 45-75% of normal observed at the end of January. Drought conditions improved in the Pacific Northwest and northern Great Basin, though expanded in California. This winter's wetter than normal conditions continued for the Rocky Mountain region. With the exception of their extreme southern extent, snow water equivalent is above average throughout the Rocky Mountains. In contrast, the dry conditions seen in January continued this month in the Southwest, and ridging over the Southwest this month resulted in warmer than normal temperatures. Phoenix, Arizona recorded no measurable precipitation this month, tied for driest February with four other years since 1933. Areas of drought expanded and increased in severity in southern Arizona and eastern New Mexico.
Drought conditions persisted in California. By February 25, 26% of the state was categorized as D4, 'exceptional drought', according the USDM. At the beginning of 2014, no portion of the state qualified for this category. Most of this D4 region lies in the central part of the state, which received significant precipitation over the last few days of the month. Rangelands are in very poor condition and hundreds of thousands of acres of agricultural land will likely be fallowed this growing season.
Much of Alaska received less than 70% of normal precipitation this month. McGrath tied for 8th driest February in a 74-year record with 0.09 in (2 mm). The eastern Interior and North Slope saw totals slightly above normal. In Hawaii, the greatest positive departures from normal precipitation were observed in the northwestern part of the state. Lihue, Kauai recorded 8.69 in (221 mm) of rainfall this month, 5.53 in (140 mm) above normal and the 5th wettest February since records began in 1950.
Pacific Islands: According to reports from National Weather Service offices, the Pacific ENSO Applications Climate Center (PEAC), and partners, conditions varied across the Pacific Islands.
As noted by the National Weather Service office in Honolulu, large-scale weather systems during February have produced enough rainfall to build on previous improvements in drought conditions. These rain events managed to reach the leeward areas of Maui and the Big Island which have been hit the hardest by drought. On the island of Maui, severe drought, or the D2 category on the USDM map, was finally eliminated, ending a continuous stretch of D2 conditions which started in August 2011. Severe drought also ended on the Big Island, which has seen the D2 classification in various locations continuously since July 2008. Extreme drought, or the D3 category, remains in western Molokai in the area serviced by the Kualapuu reservoir and is solely due to long term irrigation water use restrictions. The reduction in the area of moderate drought, or the D1 category, has continued over the past month. The D1 area is now limited to the lower leeward slopes of Maui from Maalaea to Makena, and from the lower leeward south Kohala slopes to the Humuula Saddle and the upper slopes of Mauna Loa on the Big Island. Kauai county and Oahu remain drought-free.
Some drought impacts impacts in Hawaii include the following:
KAUAI.
THERE ARE NO DROUGHT IMPACTS TO REPORT.

OAHU.
THERE ARE NO DROUGHT IMPACTS TO REPORT.

MOLOKAI.
THE WATER LEVEL IN THE KUALAPUU RESERVOIR HAS CONTINUED TO INCREASE
SLOWLY IN RECENT WEEKS BUT REMAINS AT LESS THAN HALF OF CAPACITY.
AS A RESULT...THE STATE OF HAWAII DEPARTMENT OF AGRICULTURE HAS
CONTINUED ITS MANDATORY 30 PERCENT REDUCTION IN IRRIGATION WATER USE.

LANAI.
THERE ARE NO DROUGHT IMPACTS TO REPORT.

MAUI.
PASTURE AND GENERAL VEGETATION CONDITIONS HAVE CONTINUED TO IMPROVE
OVER THE PAST MONTH.  WATER LEVELS IN RESERVOIRS SUPPLYING RESIDENTS
IN THE UPCOUNTRY AREA OF THE ISLAND HAVE REMAINED AT ADEQUATE
LEVELS.  THE MAUI COUNTY DEPARTMENT OF WATER SUPPLY HAS CONTINUED
ITS LONG STANDING REQUEST FOR CENTRAL AND SOUTH MAUI RESIDENTS TO
VOLUNTARILY REDUCE CONSUMPTION BY 10 PERCENT.

BIG ISLAND.
PASTURE CONDITIONS HAVE BEEN IMPROVING OVER THE PAST MONTH THOUGH
THE RECOVERY IS TENUOUS SINCE SOIL MOISTURE REMAINS SUB-OPTIMAL.
FOLLOW-UP RAINFALL IS NEEDED TO PREVENT A QUICK RETURN TO DROUGHT
CONDITIONS ONCE THE DRY SEASON STARTS IN A COUPLE OF MONTHS.
REPORTS FROM THE POHAKULOA REGION OF THE ISLAND INDICATED THAT TREES
AND SHRUBS WERE GREEN BUT DRY... AND FEED FOR LIVESTOCK WAS STILL A
PROBLEM.
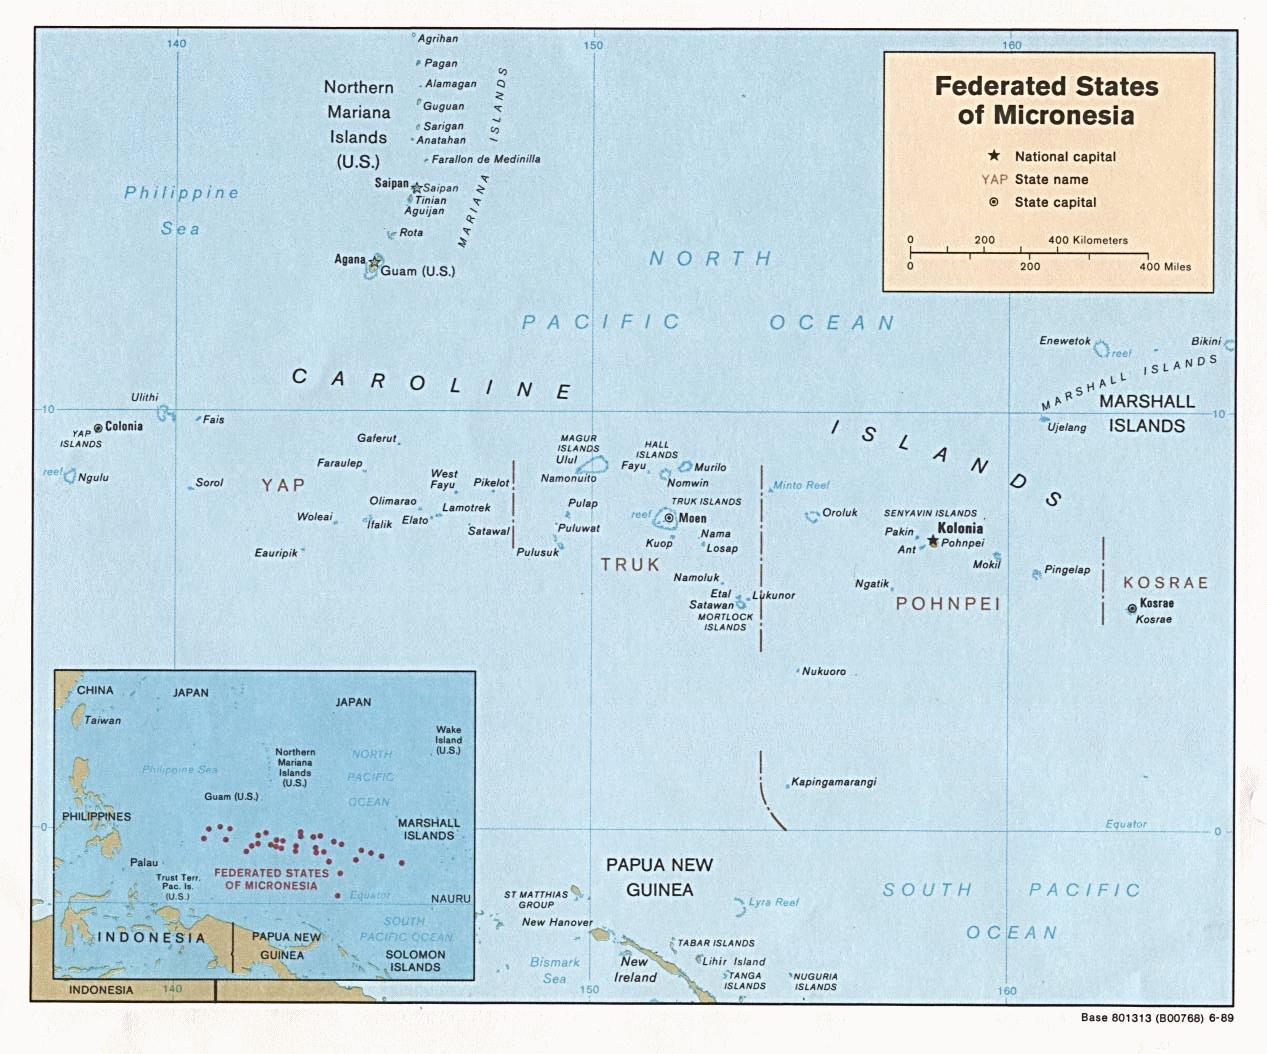
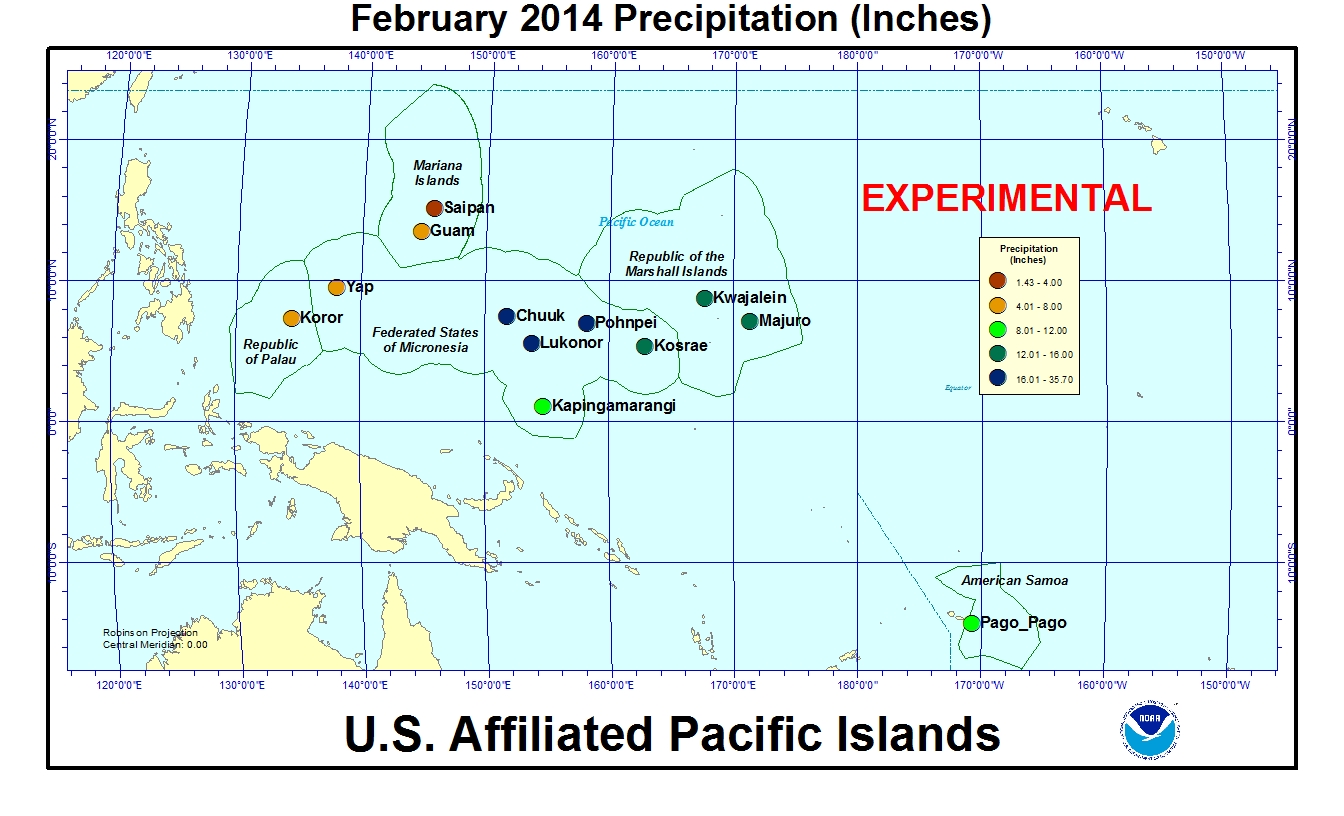
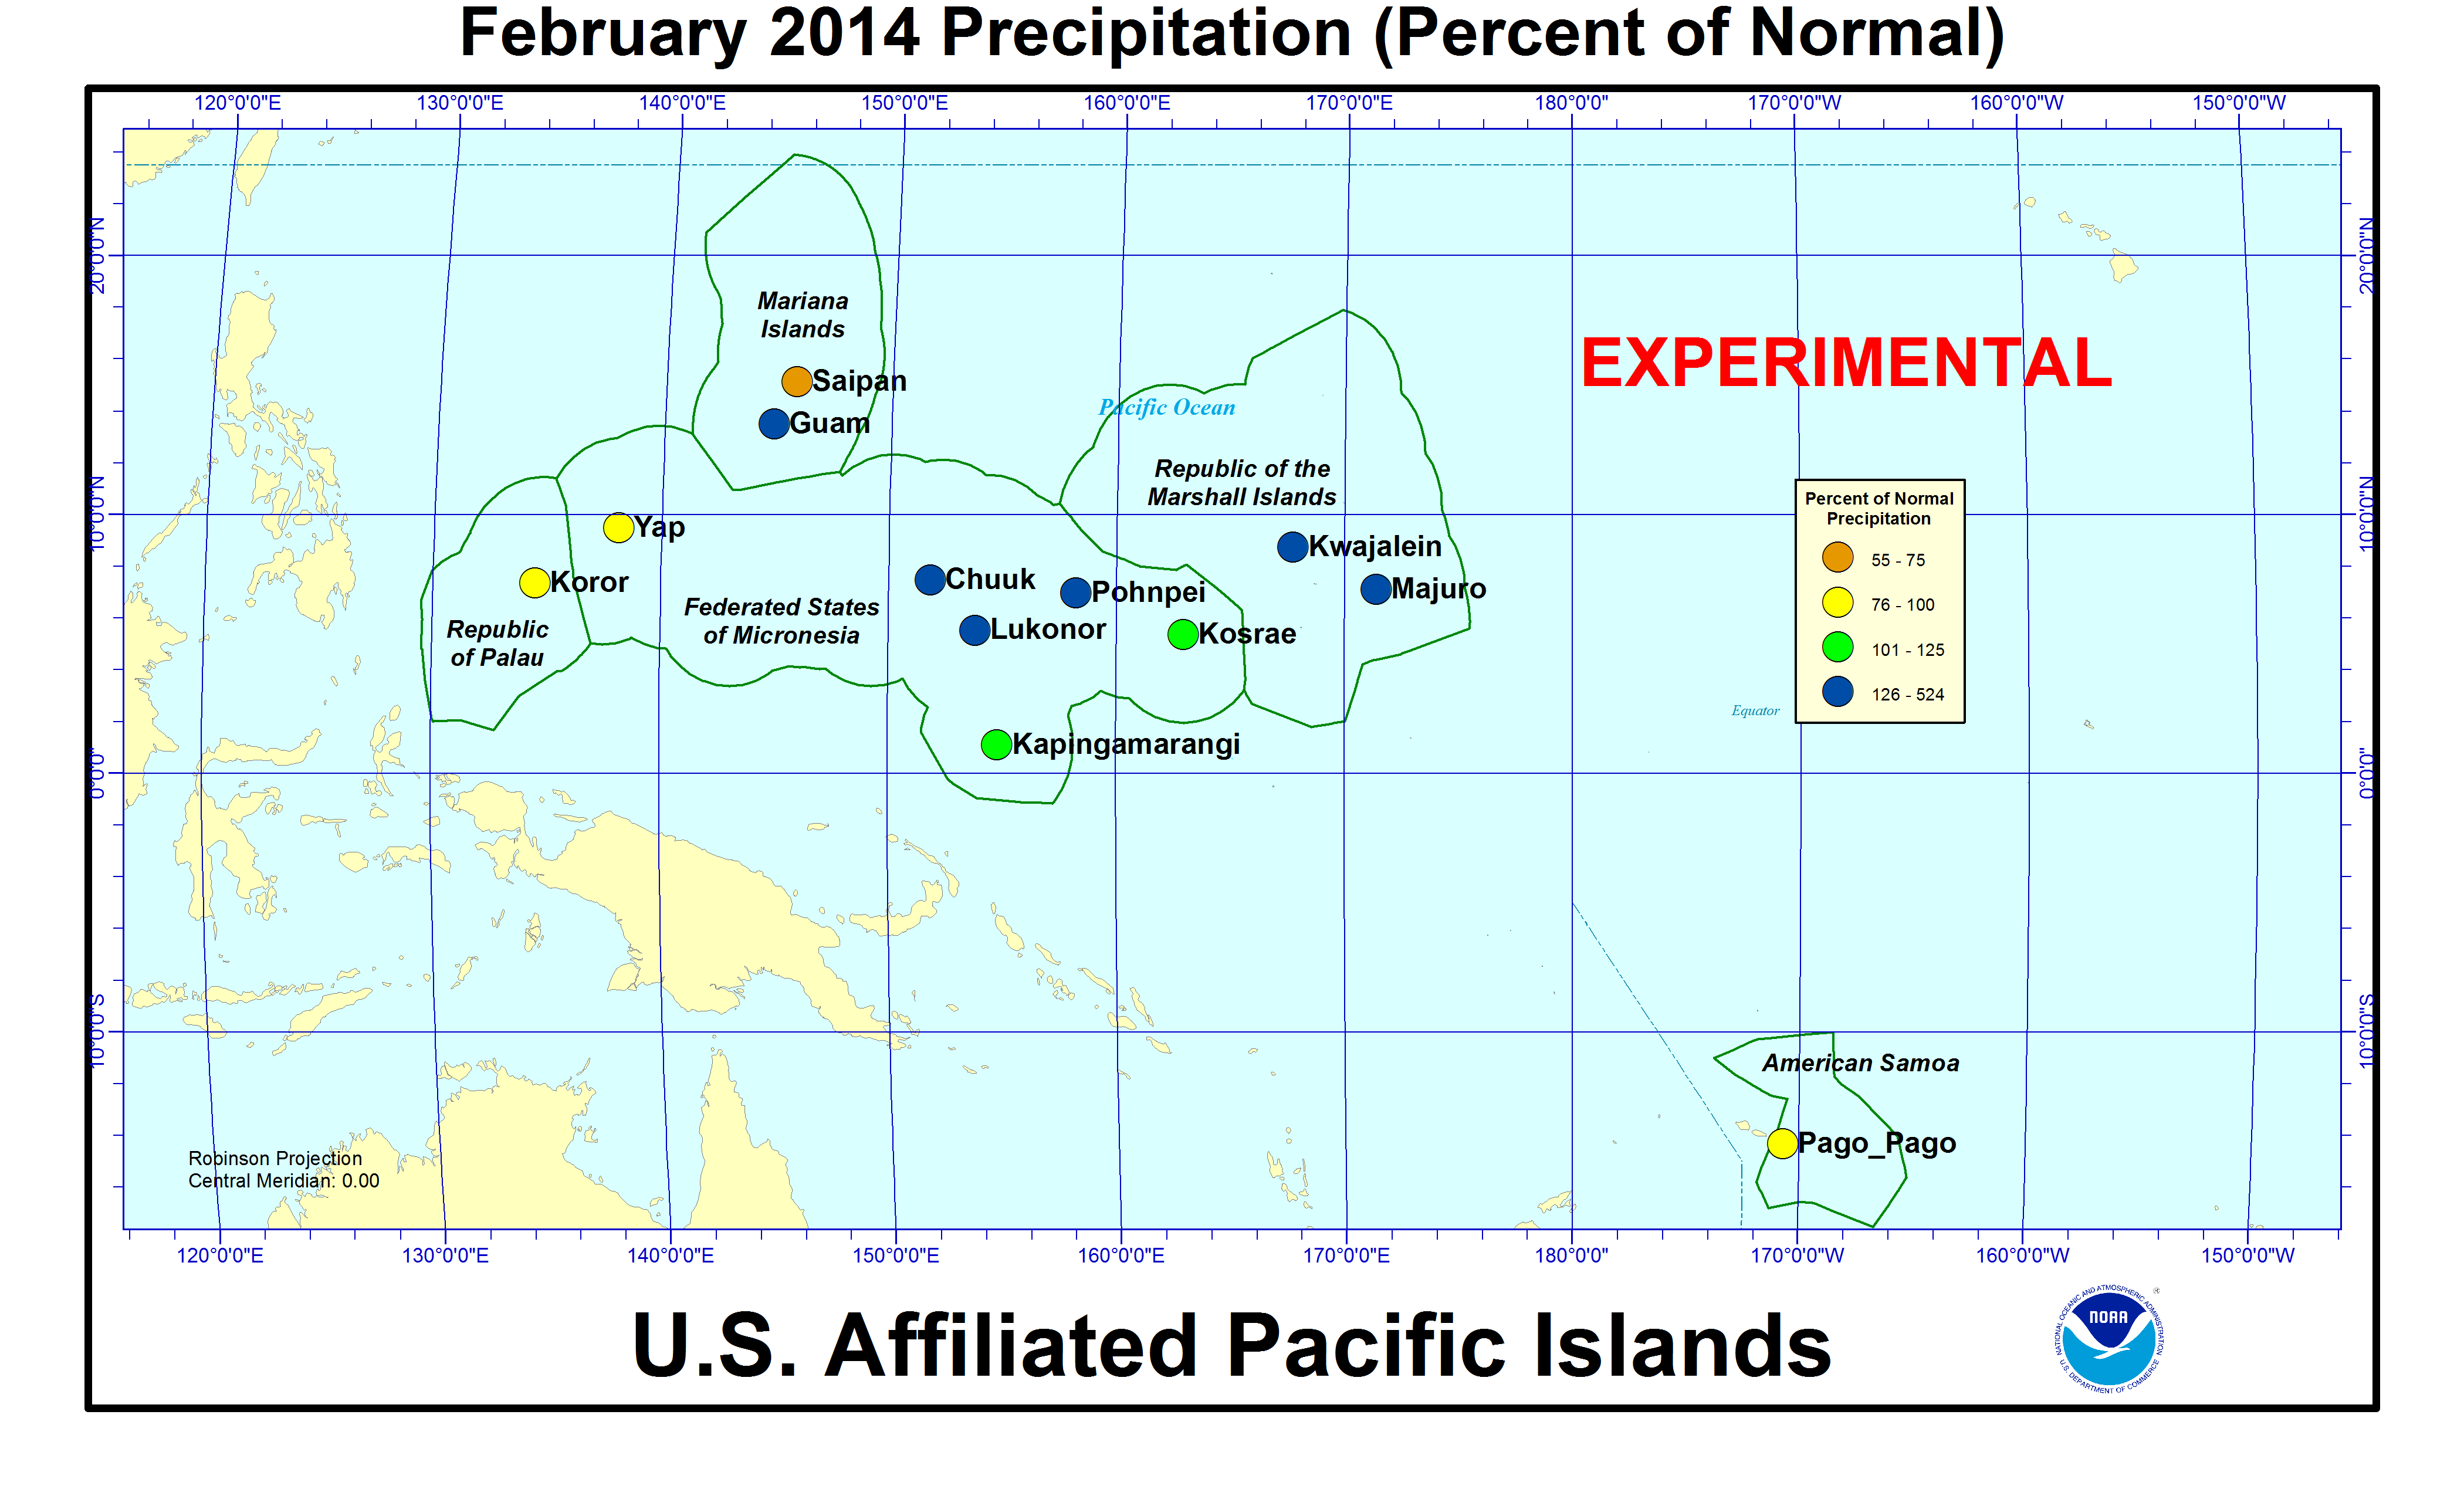
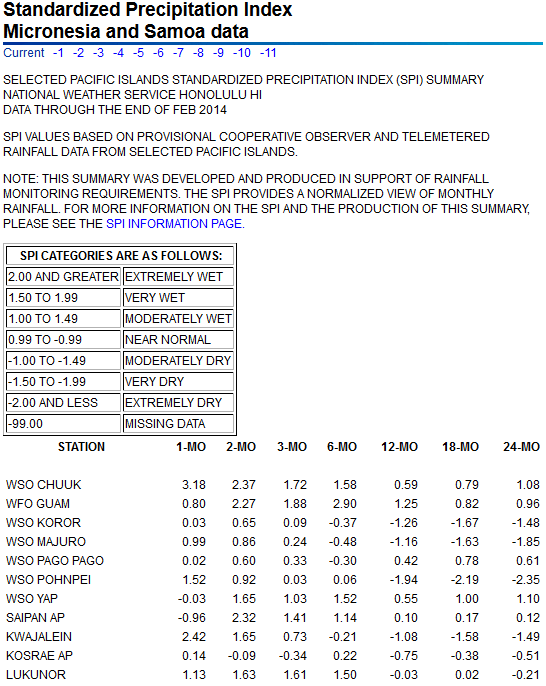
On other Pacific Islands (maps — Micronesia, Marshall Islands, basinwide), February 2014 was drier than normal at Saipan, Koror, and Yap, near normal at Pago Pago (97%), and wetter than normal at the other reporting stations. The February rainfall amounts were below 4 inches (a critical threshold amount) at Saipan, below 8 inches (another critical threshold amount) at Guam, Koror, and Yap, and above 8 inches at the other stations. Drought conditions persisted in the northern Marshall Islands. While beneficial rain fell during February at Kwajalein and Majuro and other southern islands, the northern islands continued dry with Utirik receiving 0.67 inch of rain and Wotje an estimated 1.50 inches for February (through the 26th). For January, Utirik received 0.68 inch and Wotje 0.69 inch, while December totals were 0.49 inch at Utirik and 1.28 inches at Wotje. The drought is threatening wells, water catchments, and crops in the northern Marshalls, and conservation measures were encouraged.
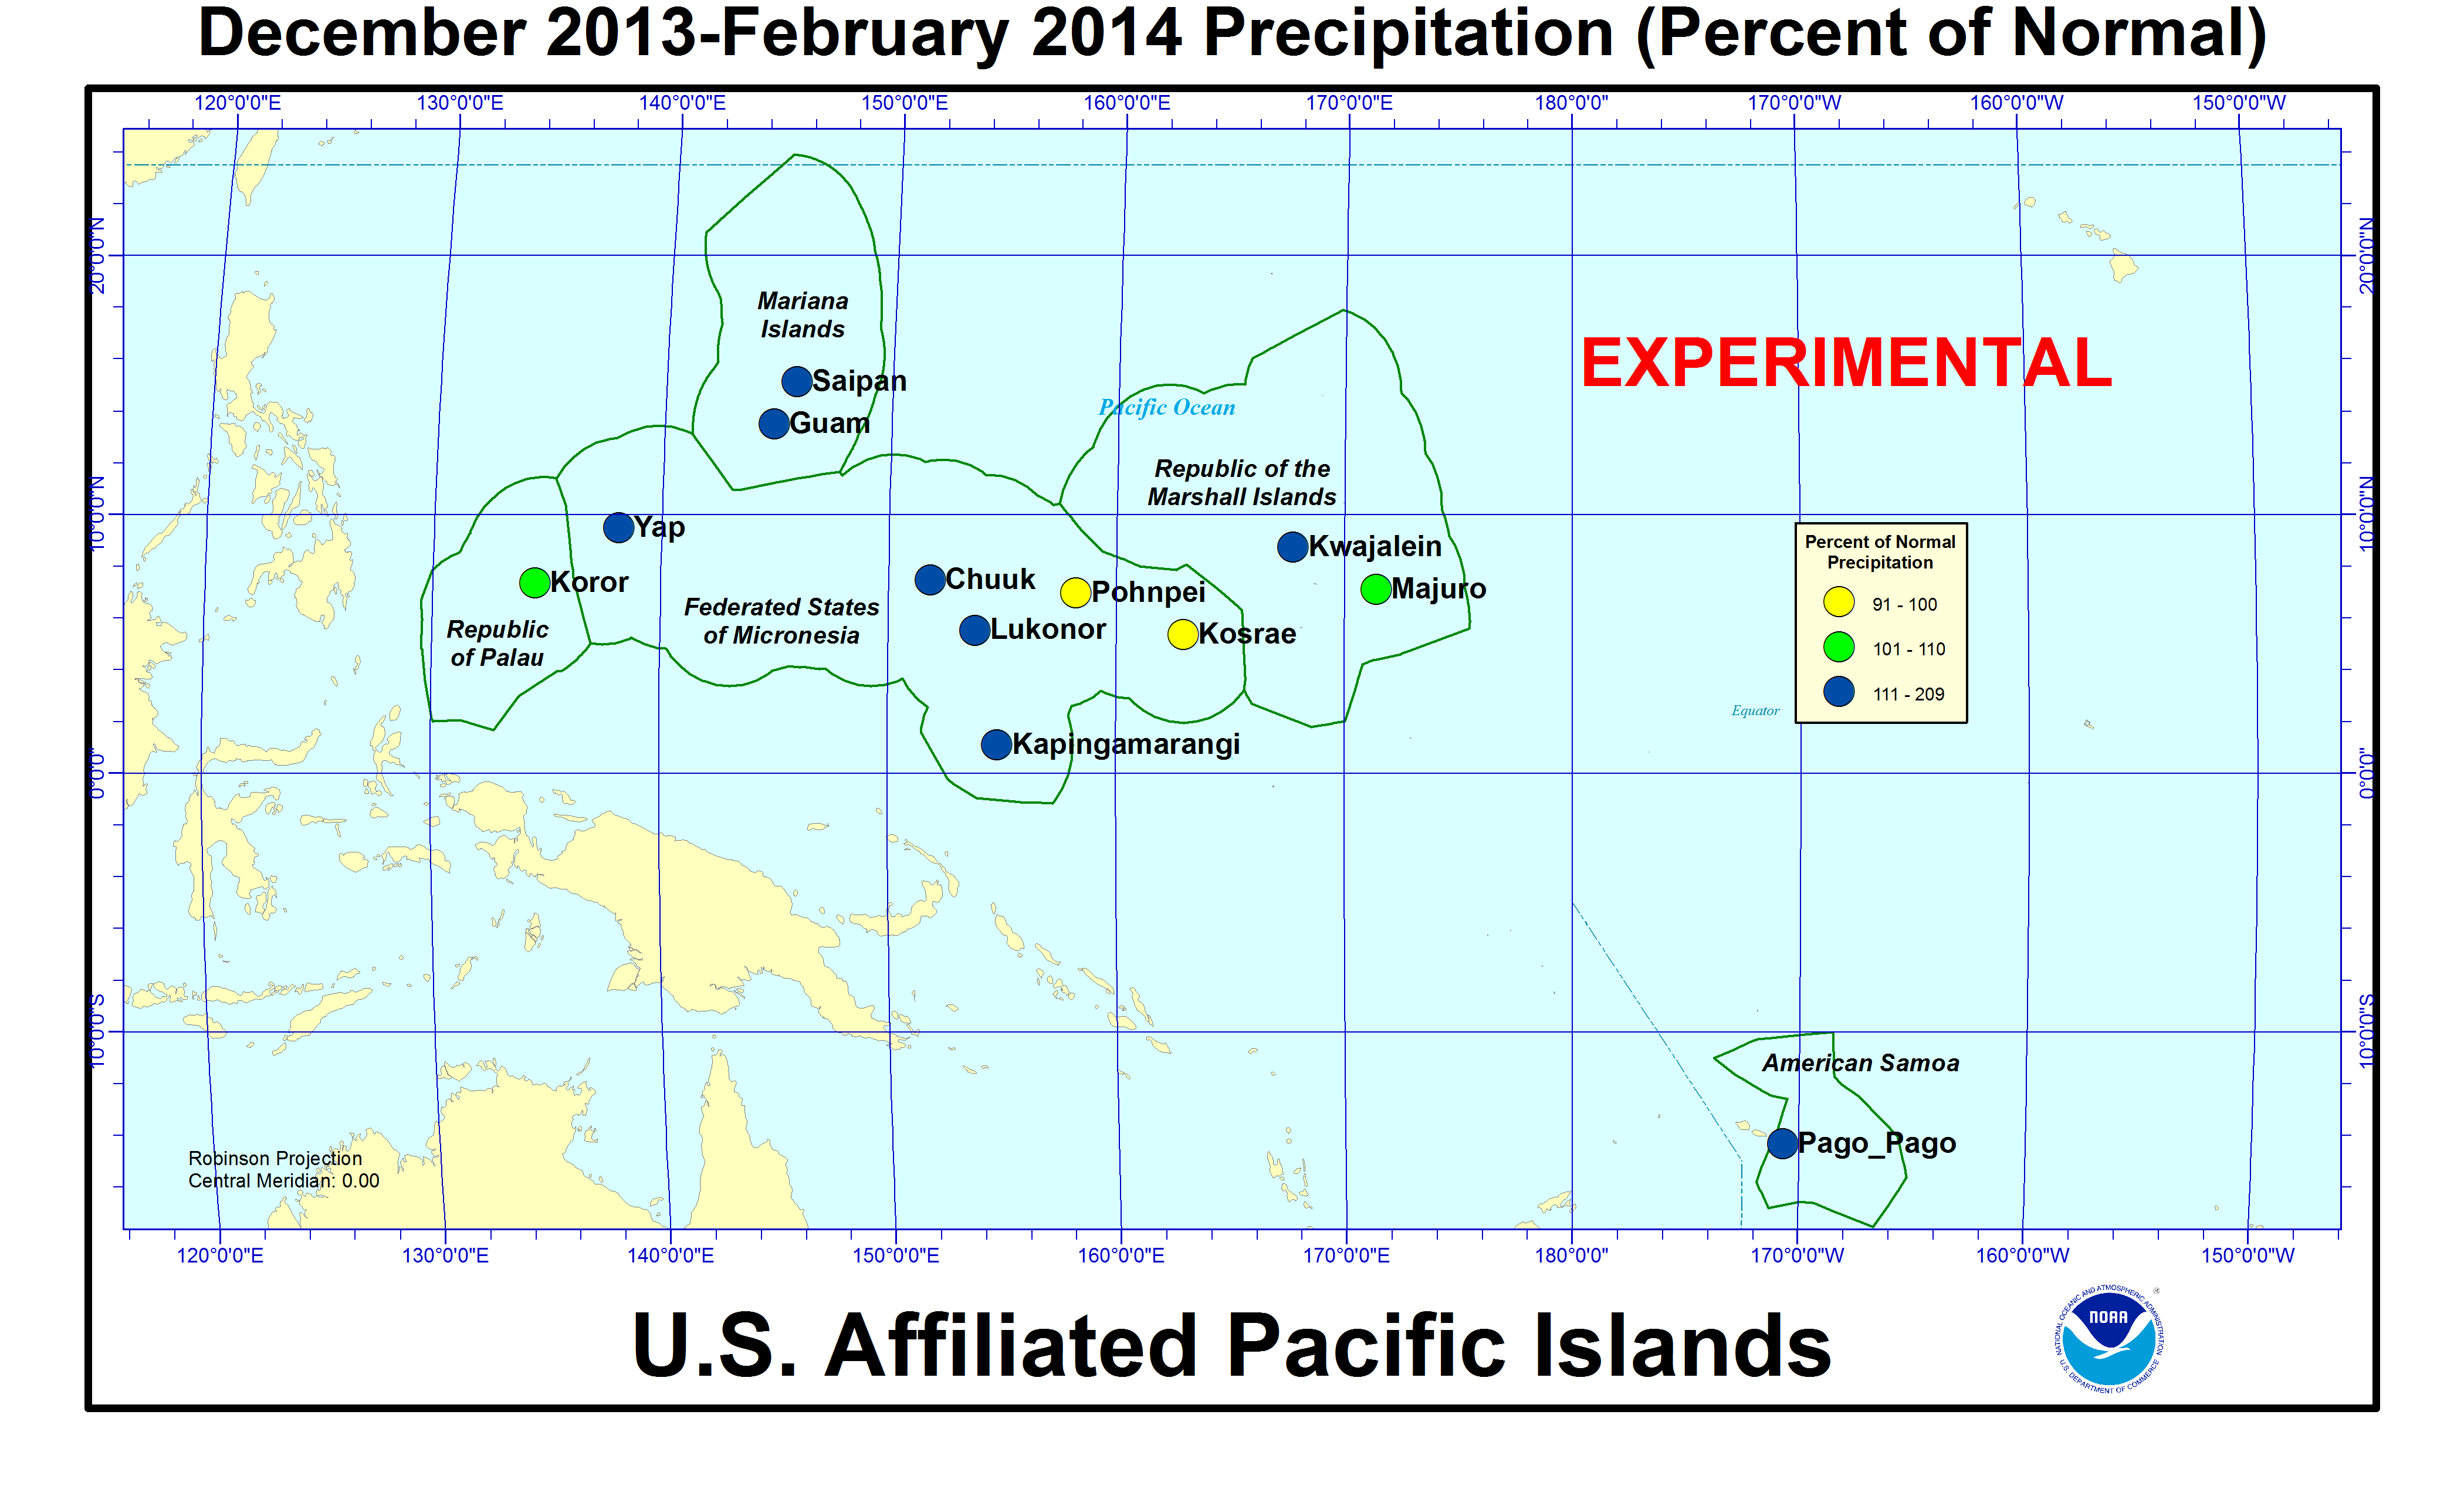
Several stations in the region experienced persistent dryness at some point in the last twelve months. Pohnpei and Kosrae were drier than normal for the last three (December 2013-February 2014) and twelve (March 2013-February 2014) months, while Majuro and Koror were drier than normal for the last six (September 2013-February 2014) and twelve (March 2013-February 2014) months, Kwajalein and Kapingamarangi were drier than normal for the last twelve (March 2013-February 2014) months, and Pago Pago was drier than normal for the last six (September 2013-February 2014) months.
| Station Name | Mar 2013 | Apr 2013 | May 2013 | Jun 2013 | Jul 2013 | Aug 2013 | Sep 2013 | Oct 2013 | Nov 2013 | Dec 2013 | Jan 2014 | Feb 2014 | Mar- Feb |
|---|---|---|---|---|---|---|---|---|---|---|---|---|---|
| Chuuk | 192% | 49% | 79% | 84% | 84% | 80% | 141% | 103% | 111% | 75% | 59% | 492% | 111% |
| Guam NAS | 191% | 45% | 103% | 102% | 53% | 74% | 255% | 198% | 56% | 65% | 421% | 170% | 117% |
| Kapingamarangi | 199% | 77% | 48% | 47% | 50% | 83% | 55% | 85% | 38% | 254% | 168% | 112% | 86% |
| Koror | 56% | 103% | 109% | 67% | 64% | 99% | 64% | 86% | 115% | 64% | 170% | 91% | 82% |
| Kosrae | 64% | 95% | 76% | 122% | 69% | 62% | 104% | 201% | 112% | 87% | 86% | 104% | 80% |
| Kwajalein | 74% | 178% | 29% | 67% | 98% | 57% | 82% | 37% | 121% | 39% | 121% | 523% | 88% |
| Lukonor | 122% | 71% | 92% | 64% | 37% | 62% | 117% | 118% | 125% | 90% | 257% | 206% | 92% |
| Majuro | 78% | 69% | 65% | 96% | 103% | 65% | 87% | 71% | 96% | 51% | 125% | 177% | 85% |
| Pago Pago | 93% | 144% | 66% | 220% | 153% | 337% | 125% | 62% | 58% | 99% | 146% | 97% | 105% |
| Pohnpei | 67% | 59% | 52% | 113% | 61% | 38% | 121% | 81% | 142% | 36% | 78% | 225% | 81% |
| Saipan | 127% | 63% | 203% | 157% | 50% | 53% | 167% | 109% | 52% | 71% | 546% | 55% | 107% |
| Yap | 130% | 50% | 69% | 134% | 53% | 86% | 181% | 144% | 74% | 65% | 340% | 91% | 109% |
| Station Name | Mar 2013 | Apr 2013 | May 2013 | Jun 2013 | Jul 2013 | Aug 2013 | Sep 2013 | Oct 2013 | Nov 2013 | Dec 2013 | Jan 2014 | Feb 2014 | Mar- Feb |
|---|---|---|---|---|---|---|---|---|---|---|---|---|---|
| Chuuk | 16.00" | 6.11" | 8.93" | 9.85" | 10.04" | 10.25" | 16.49" | 11.82" | 11.82" | 8.44" | 5.98" | 35.70" | 151.43" |
| Guam NAS | 3.95" | 1.14" | 3.51" | 6.32" | 5.39" | 10.84" | 32.25" | 22.66" | 4.13" | 3.33" | 16.89" | 5.14" | 115.55" |
| Kapingamarangi | 22.79" | 10.51" | 5.84" | 6.45" | 7.11" | 6.72" | 5.42" | 6.99" | 3.49" | 25.02" | 15.38" | 10.36" | 126.08" |
| Koror | 4.13" | 7.57" | 12.87" | 11.70" | 11.94" | 13.35" | 7.53" | 10.19" | 13.11" | 7.19" | 17.27" | 7.79" | 124.64" |
| Kosrae | 10.20" | 16.71" | 13.41" | 17.89" | 10.33" | 8.80" | 14.82" | 22.03" | 15.54" | 13.94" | 14.39" | 13.47" | 171.53" |
| Kwajalein | 1.73" | 9.34" | 1.97" | 4.66" | 9.71" | 5.51" | 8.81" | 4.17" | 13.63" | 2.62" | 3.81" | 13.82" | 79.78" |
| Lukonor | 11.34" | 8.06" | 10.77" | 7.51" | 5.88" | 8.64" | 11.92" | 13.34" | 11.38" | 10.11" | 21.65" | 18.42" | 139.02" |
| Majuro | 5.13" | 6.46" | 6.60" | 10.55" | 11.51" | 7.62" | 9.70" | 9.01" | 12.84" | 5.76" | 9.66" | 12.19" | 107.03" |
| Pago Pago | 9.97" | 13.52" | 6.35" | 11.75" | 8.48" | 18.14" | 8.14" | 5.71" | 5.91" | 12.71" | 19.54" | 11.65" | 131.87" |
| Pohnpei | 8.78" | 10.92" | 10.44" | 16.79" | 9.42" | 5.41" | 15.23" | 12.37" | 20.99" | 5.79" | 10.27" | 21.50" | 147.91" |
| Saipan | 2.40" | 1.65" | 4.82" | 5.68" | 4.42" | 6.99" | 16.87" | 11.60" | 2.91" | 2.74" | 13.81" | 1.43" | 75.32" |
| Yap | 5.95" | 2.81" | 5.41" | 16.16" | 8.01" | 12.69" | 24.39" | 17.60" | 6.56" | 5.56" | 21.74" | 4.72" | 131.6" |
| Station Name | Mar 2013 | Apr 2013 | May 2013 | Jun 2013 | Jul 2013 | Aug 2013 | Sep 2013 | Oct 2013 | Nov 2013 | Dec 2013 | Jan 2014 | Feb 2014 | Mar- Feb |
|---|---|---|---|---|---|---|---|---|---|---|---|---|---|
| Chuuk | 8.32" | 12.47" | 11.30" | 11.66" | 11.98" | 12.86" | 11.71" | 11.51" | 10.61" | 11.25" | 10.10" | 7.25" | 136.77" |
| Guam NAS | 2.07" | 2.53" | 3.40" | 6.18" | 10.14" | 14.74" | 12.66" | 11.44" | 7.38" | 5.11" | 4.01" | 3.03" | 99.09" |
| Kapingamarangi | 11.43" | 13.64" | 12.08" | 13.78" | 14.15" | 8.13" | 9.93" | 8.19" | 9.27" | 9.84" | 9.15" | 9.27" | 145.85" |
| Koror | 7.44" | 7.32" | 11.83" | 17.48" | 18.53" | 13.50" | 11.77" | 11.84" | 11.39" | 11.16" | 10.18" | 8.56" | 152.90" |
| Kosrae | 16.06" | 17.51" | 17.75" | 14.64" | 14.91" | 14.22" | 14.22" | 10.94" | 13.83" | 16.11" | 16.67" | 12.93" | 213.87" |
| Kwajalein | 2.35" | 5.26" | 6.72" | 6.93" | 9.87" | 9.74" | 10.74" | 11.18" | 11.28" | 6.66" | 3.16" | 2.64" | 90.41" |
| Lukonor | 9.26" | 11.31" | 11.69" | 11.65" | 15.93" | 14.04" | 10.15" | 11.32" | 9.08" | 11.27" | 8.41" | 8.93" | 151.36" |
| Majuro | 6.58" | 9.42" | 10.11" | 11.01" | 11.17" | 11.69" | 11.17" | 12.73" | 13.44" | 11.39" | 7.74" | 6.88" | 125.25" |
| Pago Pago | 10.68" | 9.39" | 9.66" | 5.33" | 5.55" | 5.38" | 6.53" | 9.26" | 10.14" | 12.84" | 13.34" | 12.00" | 125.57" |
| Pohnpei | 13.17" | 18.41" | 19.96" | 14.81" | 15.43" | 14.26" | 12.55" | 15.27" | 14.83" | 16.08" | 13.18" | 9.55" | 182.36" |
| Saipan | 1.89" | 2.63" | 2.38" | 3.62" | 8.91" | 13.13" | 10.09" | 10.62" | 5.61" | 3.85" | 2.53" | 2.59" | 70.25" |
| Yap | 4.56" | 5.63" | 7.85" | 12.04" | 15.08" | 14.82" | 13.50" | 12.18" | 8.83" | 8.51" | 6.39" | 5.19" | 120.31" |
[top]
State/Regional/National Moisture Status
A detailed review of drought and moisture conditions is available for all contiguous U.S. states, the nine standard regions, and the nation (contiguous U.S.):
| northeast u. s. | east north central u. s. | central u. s. |
| southeast u. s. | west north central u. s. | south u. s. |
| southwest u. s. | northwest u. s. | west u. s. |
| Contiguous United States |
[top]
Contacts & Questions