|
Contents Of This Report: |

|
Please note that the values presented in this report are based on preliminary data. They will change when the final data are processed, but will not be replaced on these pages.
National Drought Overview
|
|
[top]
Detailed Drought Discussion
Overview
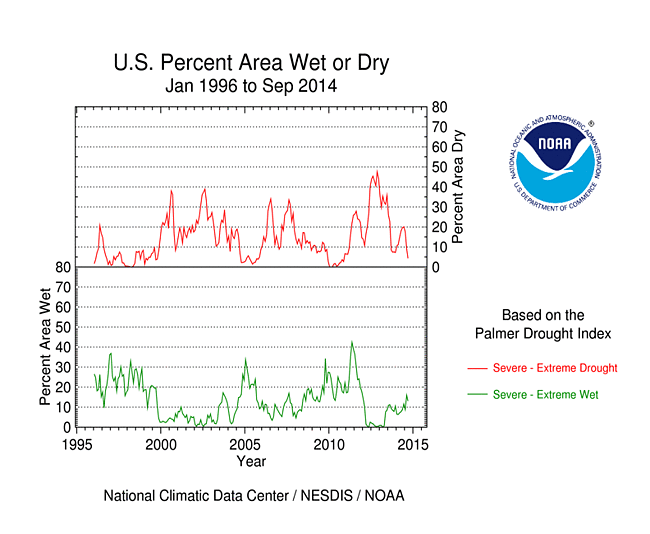
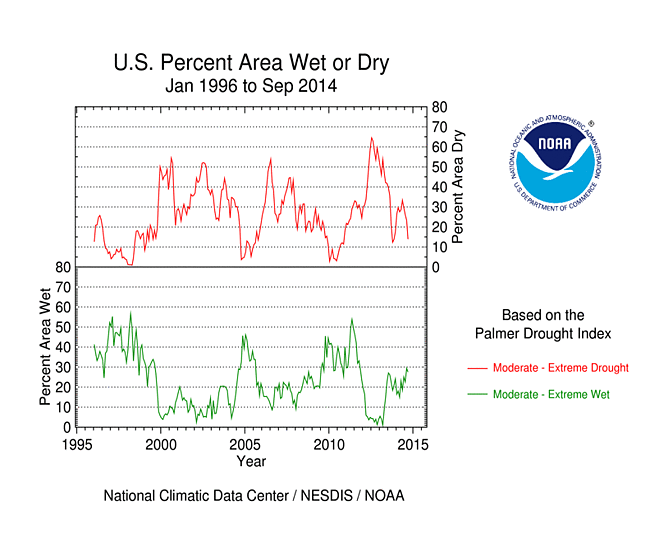
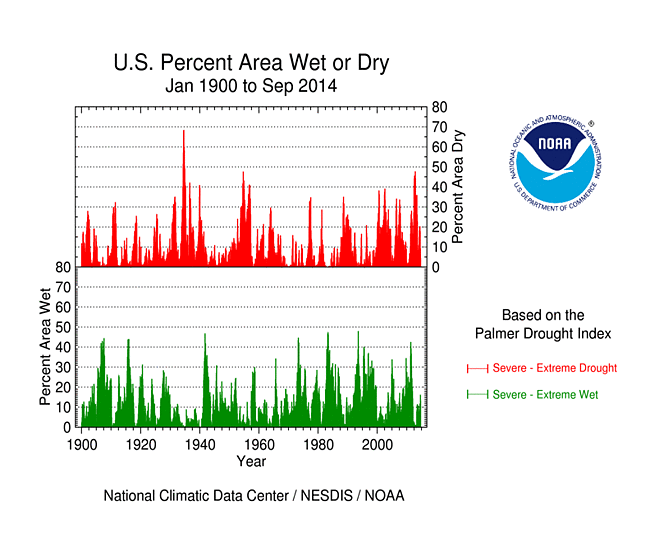
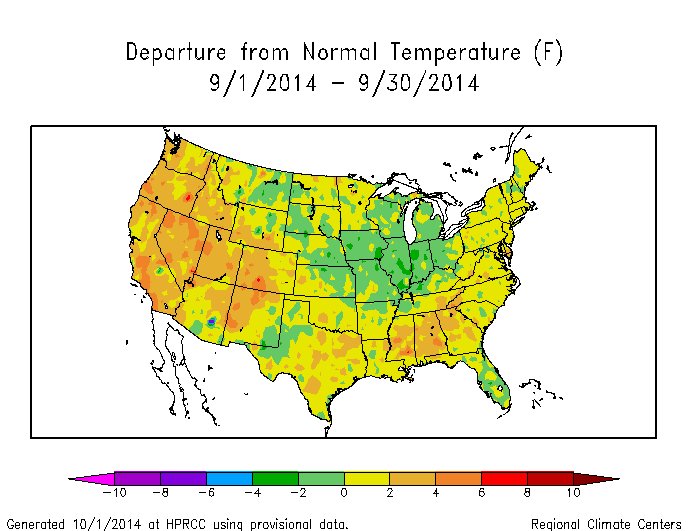
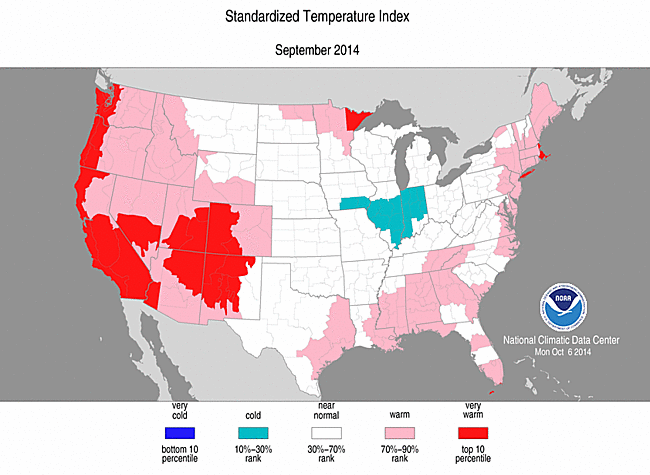
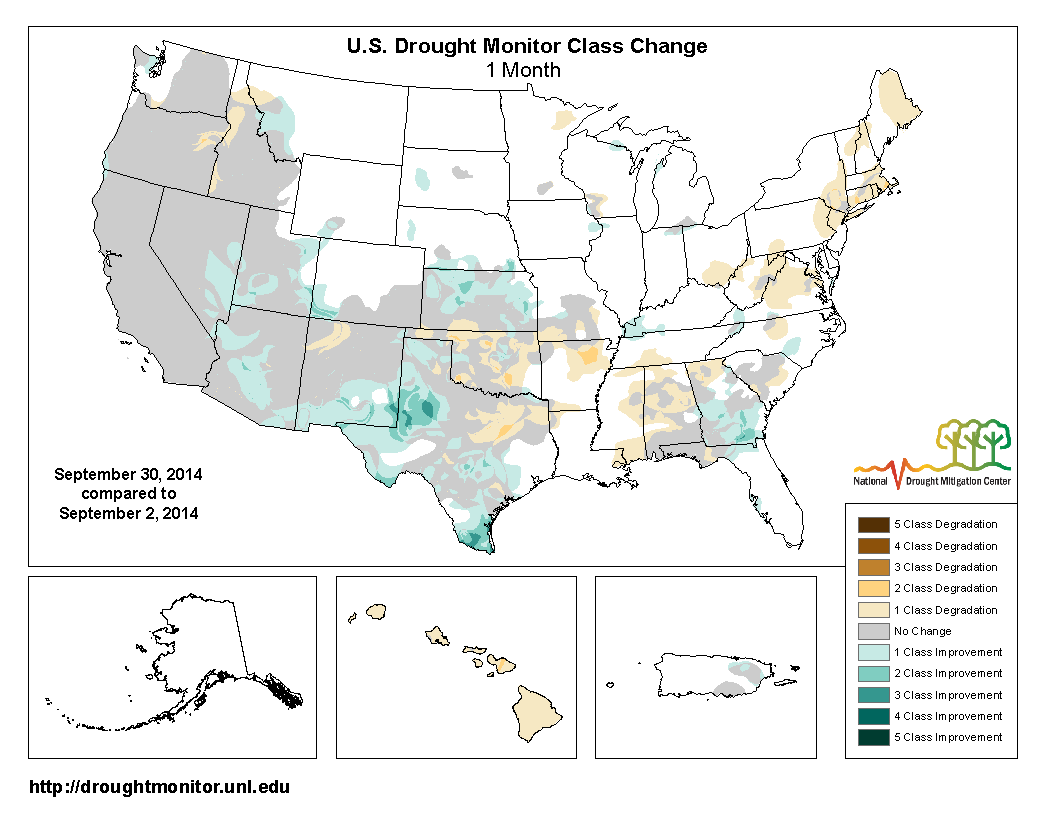
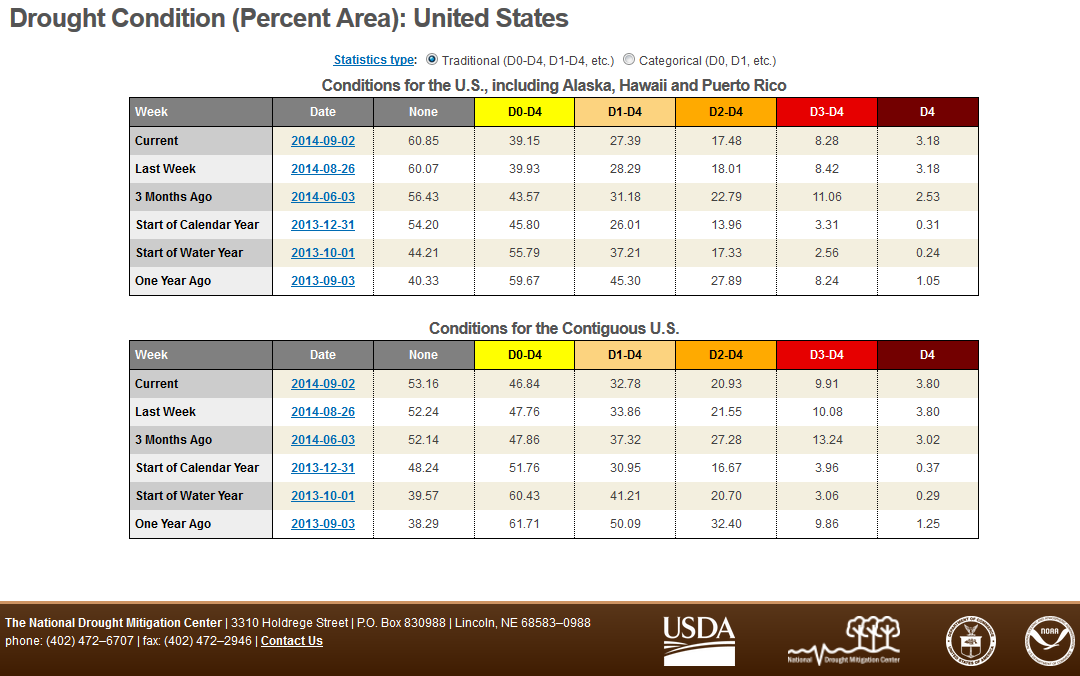
During September 2014, as in previous months, many vigorous short-wave troughs and ridges migrated through an active jet stream, dragging surface fronts and surface low pressure systems along with them. These systems brought above-normal precipitation to parts of the Plains, Midwest, and coastal Southeast. Monsoon showers, which were enhanced by the upper-level systems as well as by tropical moisture, dumped above-normal rainfall over much of the southwestern U.S. and Intermountain Basin. Subsiding air from upper-level ridges kept precipitation below normal across the Northeast, much of the Deep South and Plains, and parts of the Northwest and southern California. The busy parade of troughs and ridges dragged competing warm and cold fronts across the country, resulting in a temperature pattern that was near to cooler than normal across the Midwest, but warmer than normal across much of the West and parts of the South and East Coast. The above-normal rainfall helped reduce drought in the Southwest and parts of the Southern and Central Plains and southern Georgia, but drought or abnormal dryness expanded in parts of the Northeast, Southeast, Southern Plains, and Northern Rockies where precipitation was lacking this month. Alaska was generally cooler than normal in the interior locations and warmer than normal everywhere else, with a mixed precipitation pattern. Hawaii also had a mixed precipitation pattern, but with dryness predominating. When integrated across the CONUS, September 2014 ranked as the 46th wettest September in the 1895-2014 record. On balance, the national drought footprint contracted when compared to last month, decreasing to about 25.5 percent of the U.S. as a whole, according to USDM statistics. According to the Palmer Drought Index, which goes back to the beginning of the 20th century, about 14 percent of the CONUS was in moderate to extreme drought at the end of September, a decrease of about 9 percent compared to last month.
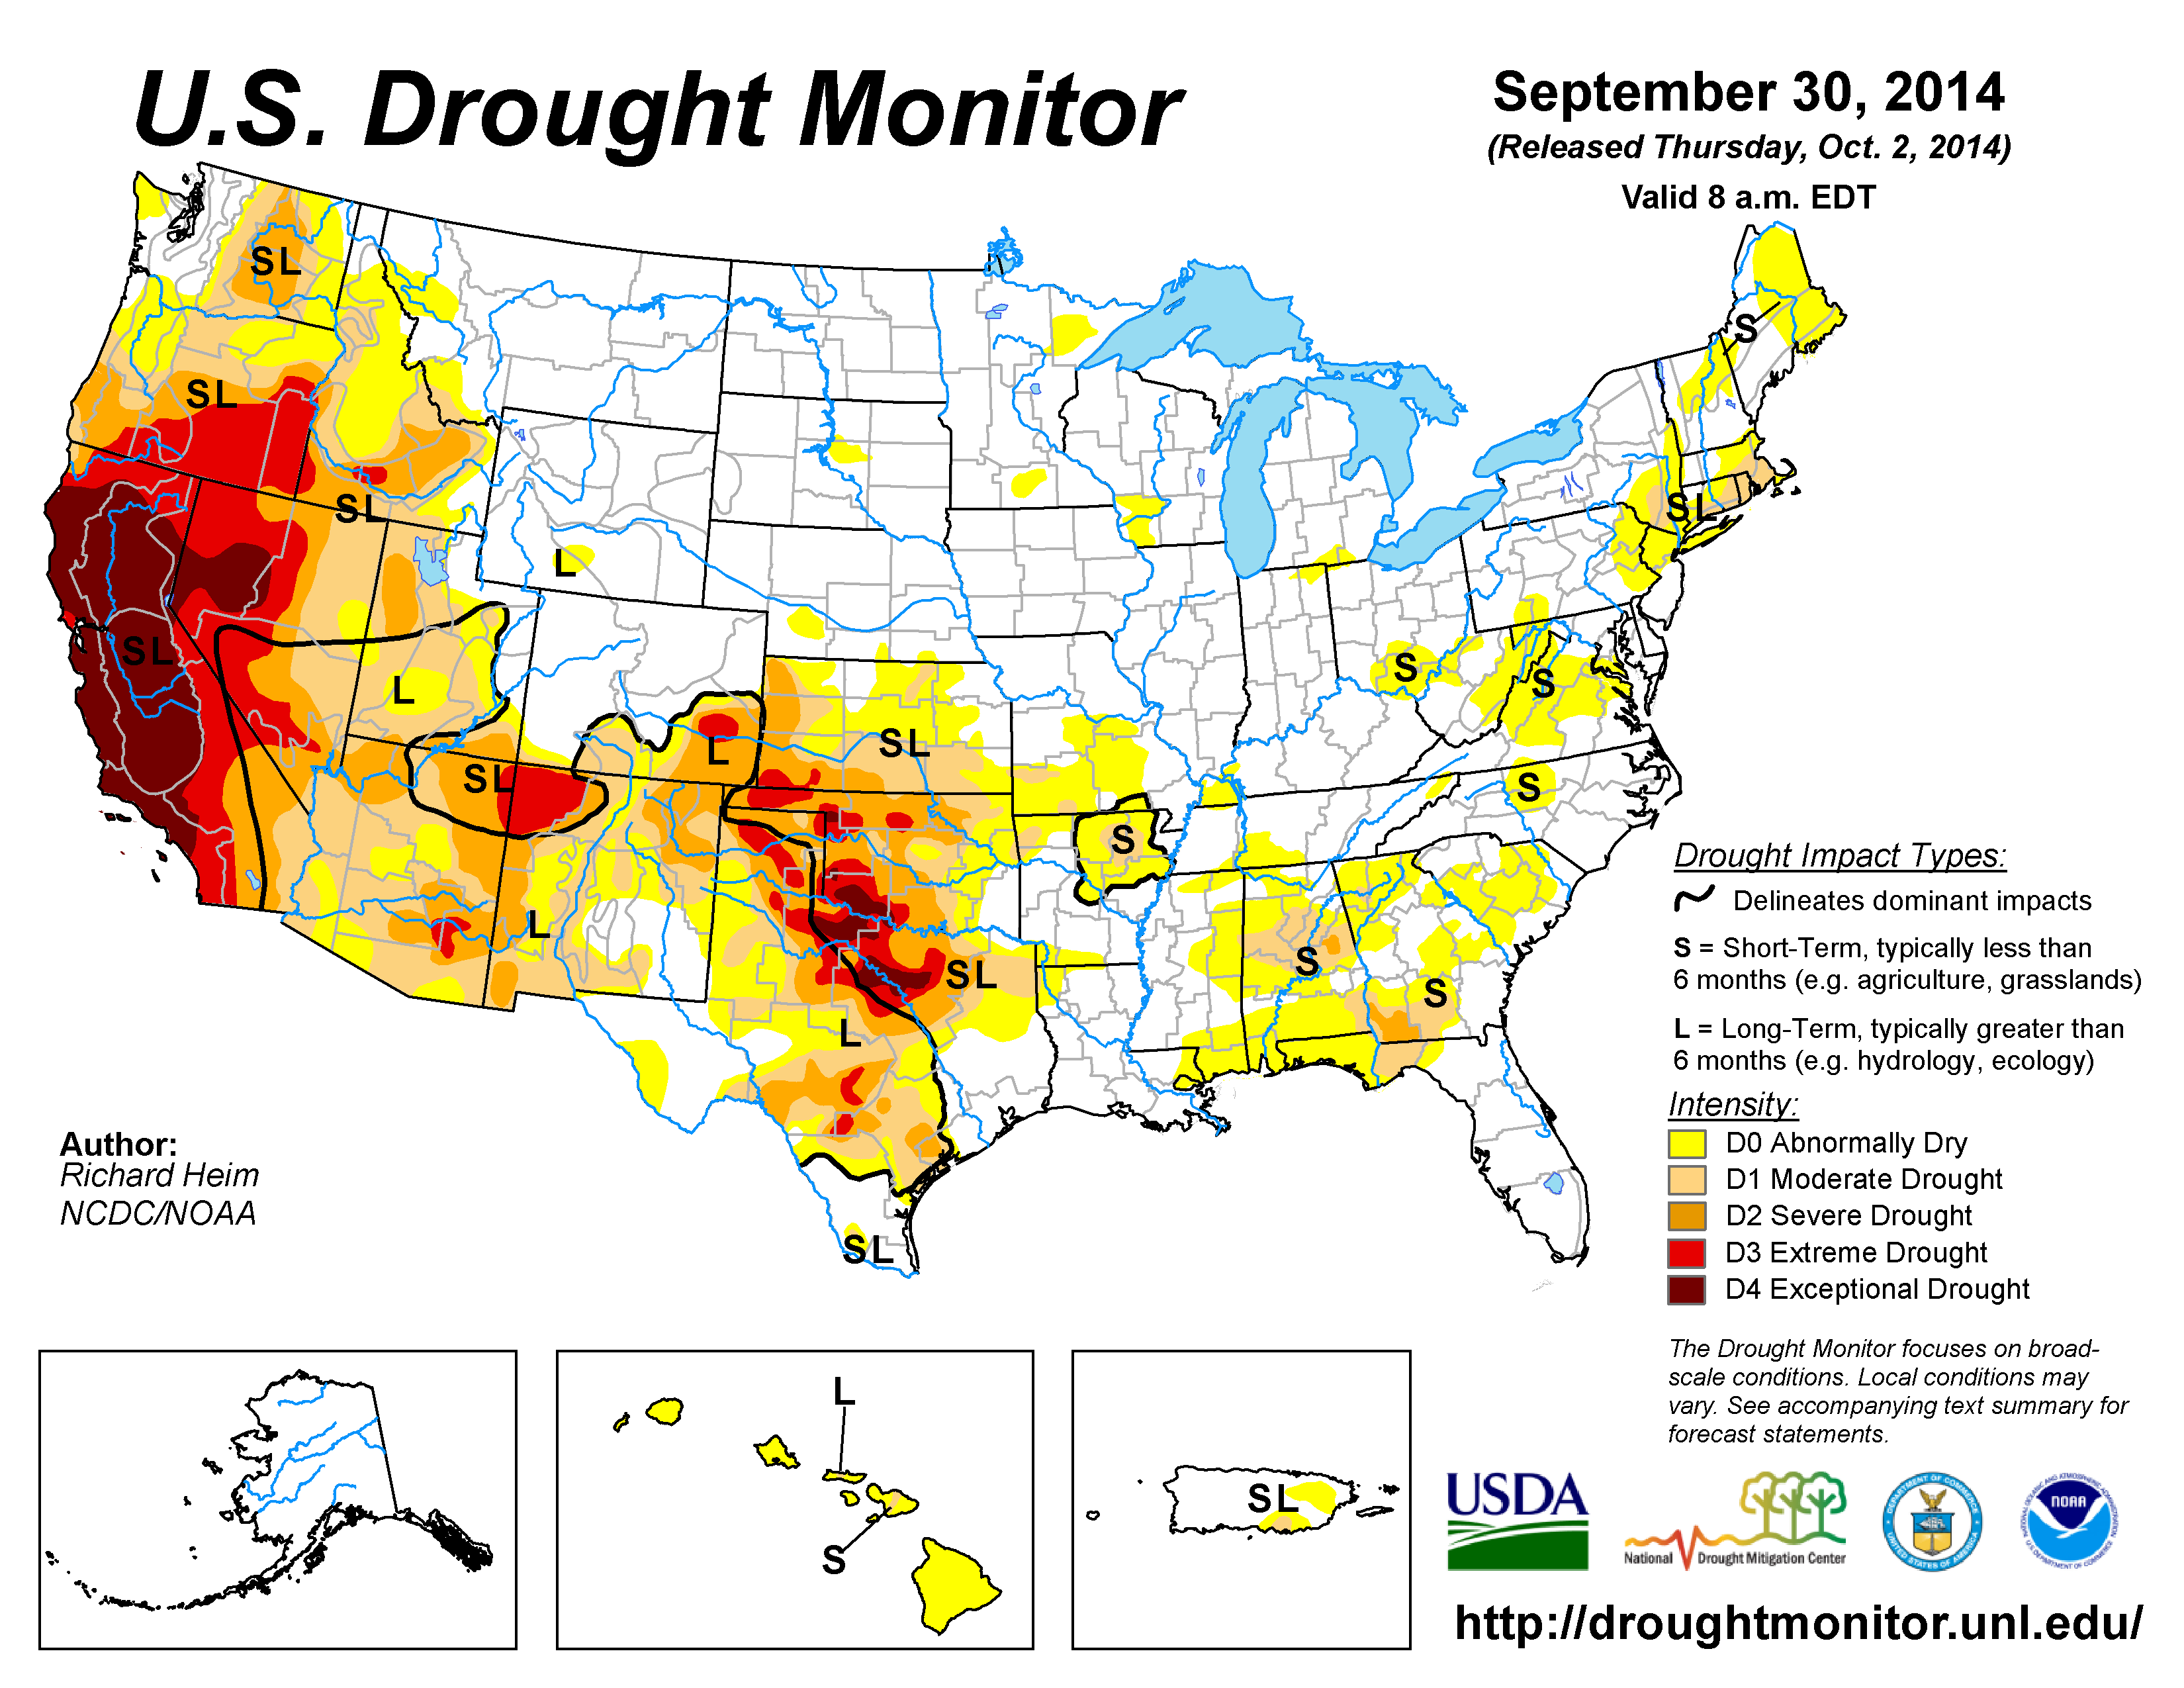
The U.S. Drought Monitor drought map valid September 30, 2014.
By the end of the month:
- moderate (D1) drought covered a large area of the U.S. from the West Coast to the Central and Southern Great Plains, connected across parts of New Mexico, with large areas of severe (D2) drought in the moderate drought area;
- there were two epicenters of extreme (D3) to exceptional (D4) drought within this large moderate to severe drought area — one located in the California-Nevada-Oregon region and the other in the Southern Plains centered in northern Texas and adjacent Oklahoma;
- areas of moderate to severe drought were growing in the Southeast, moderate drought was developing in the Northeast, and pockets of abnormal dryness (D0) to moderate drought lingered or were developing in the Midwest and Mid-Atlantic; and
- moderate drought and abnormally dry conditions lingered in Puerto Rico and Hawaii.
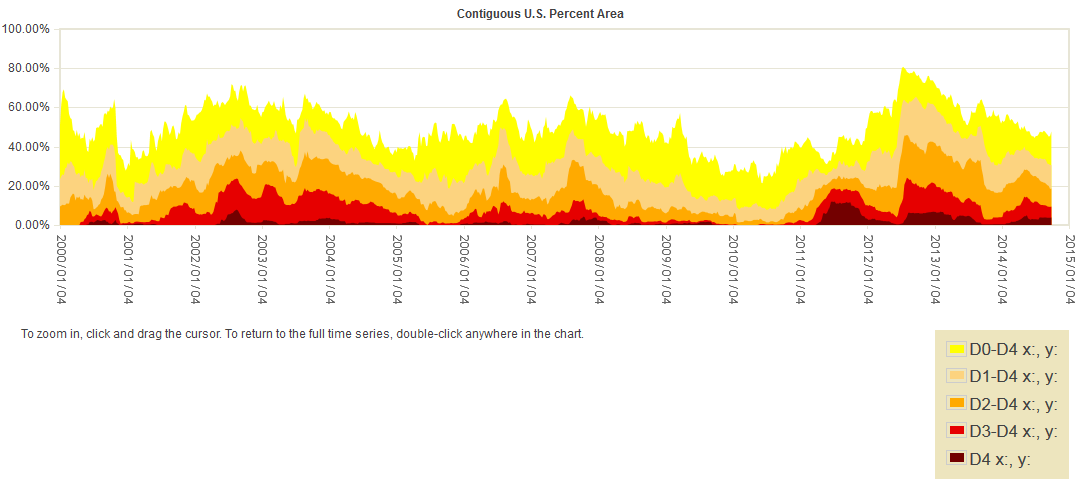
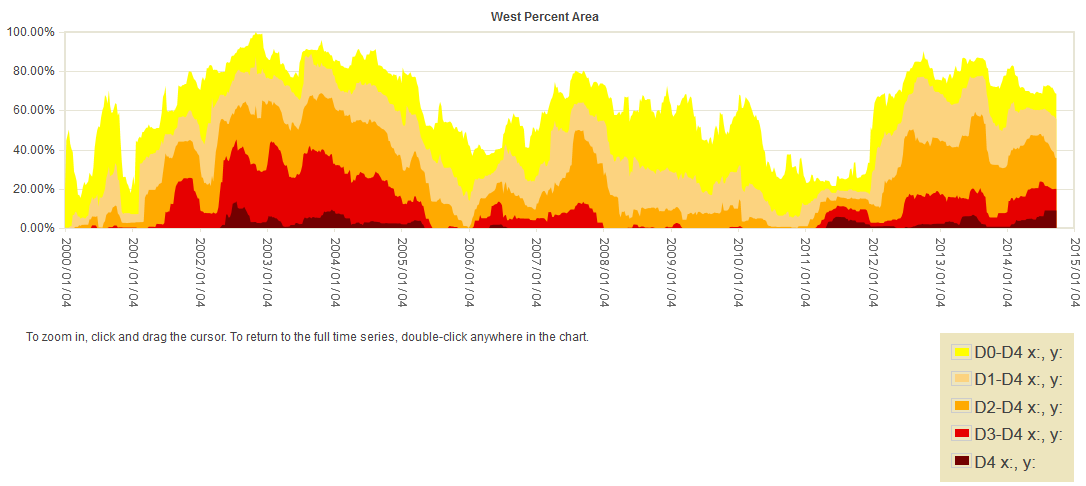
Percent area of the CONUS in moderate to exceptional drought, January 4, 2000 to present, based on the U.S. Drought Monitor.
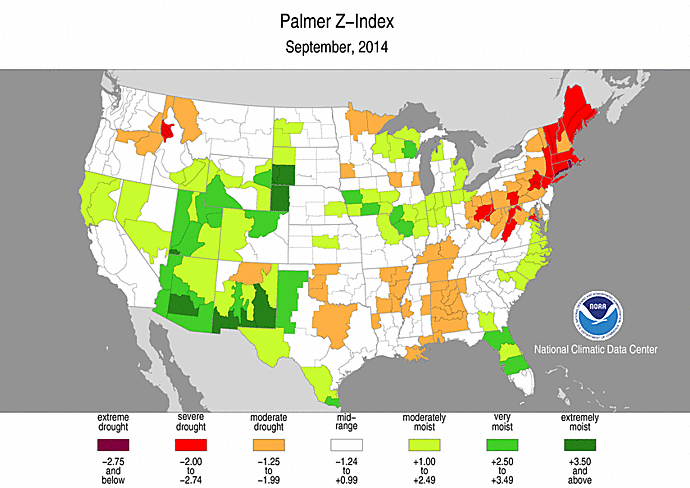
Palmer Drought Index
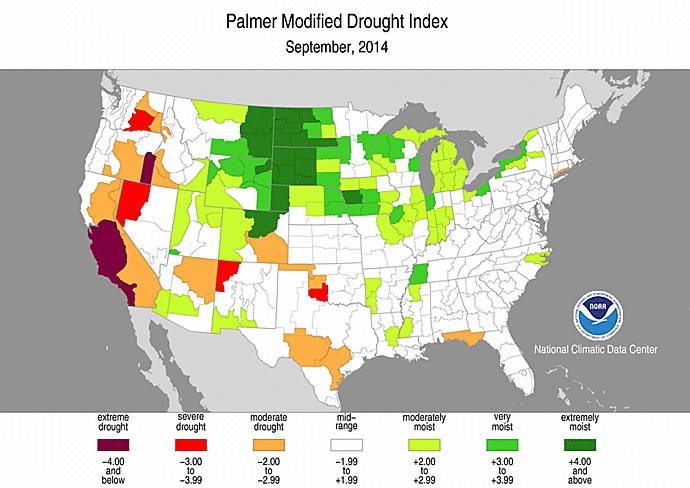
The Palmer drought indices measure the balance between moisture demand (evapotranspiration driven by temperature) and moisture supply (precipitation). The Palmer Z Index depicts moisture conditions for the current month, while the Palmer Hydrological Drought Index (PHDI) and Palmer Drought Severity Index (PDSI) depict the current month's cumulative moisture conditions integrated over the last several months. While both the PDSI and PHDI indices show long-term moisture conditions, the PDSI depicts meteorological drought while the PHDI depicts hydrological drought. The PDSI map shows less severe and extensive drought in the West and parts of the Plains than the PHDI map because the meteorological conditions that produce drought are not as long-lasting as the hydrological impacts.
|
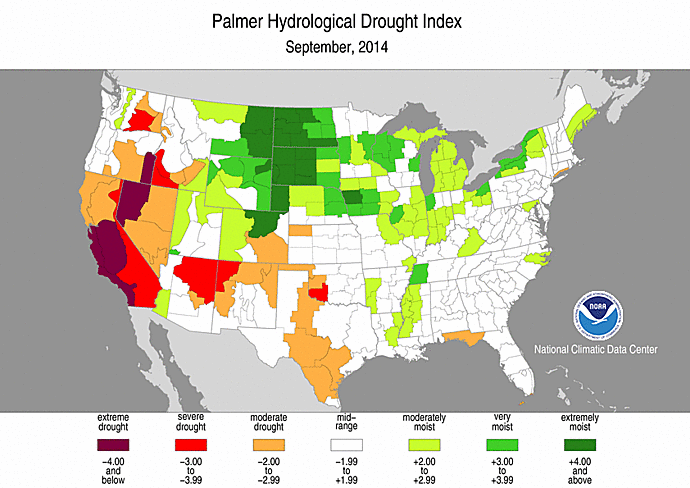 |
Used together, the Palmer Z Index and PHDI maps show that short-term wet or normal conditions occurred during September over much of the West and High Plains which had areas in long-term drought during August, resulting in contraction of drought by the end of September. Short-term dry conditions occurred over parts of the Northwest, which had areas in long-term drought during August, maintaining or intensifying drought by the end of September. Short-term dry conditions also occurred over parts of the South and Midwest, and much of the Northeast, reducing areas of long-term wetness. Wet short-term conditions occurred over parts of the long-term near normal to wet areas of the Northern Plains to Great Lakes, resulting in expansion and intensification of the wet spell areas there.
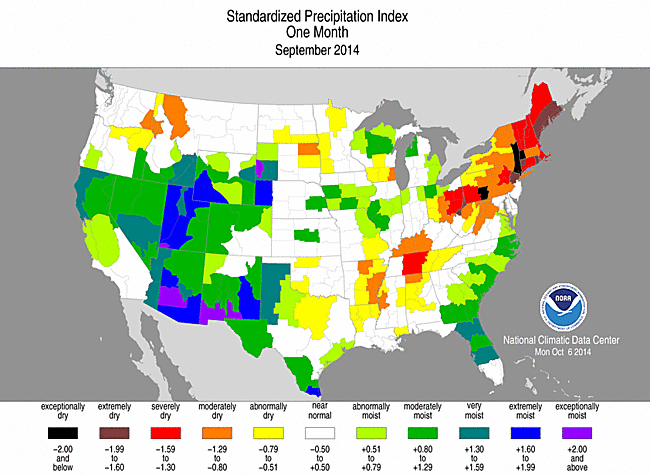
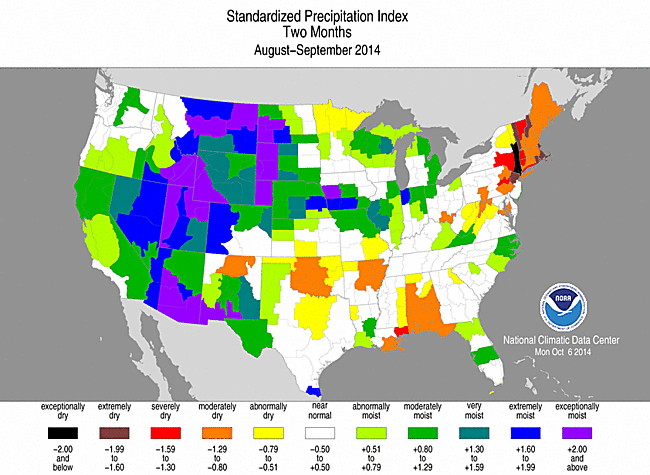
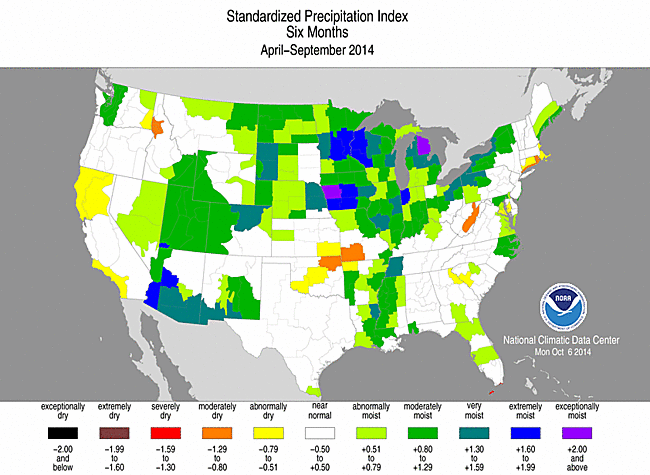
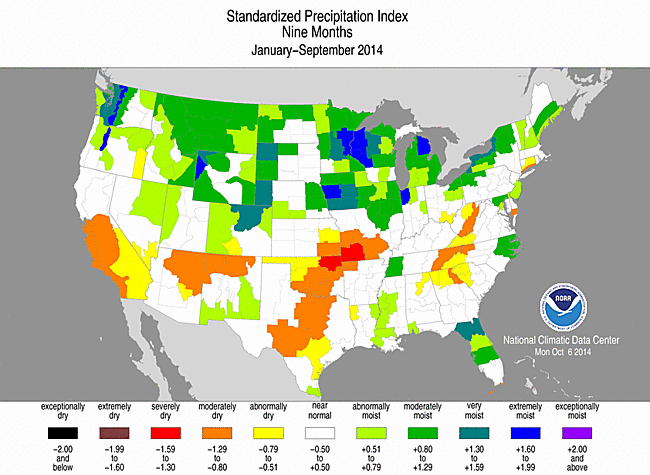
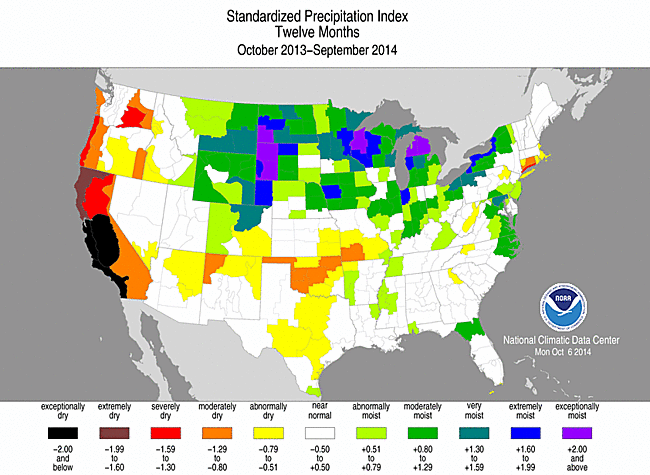
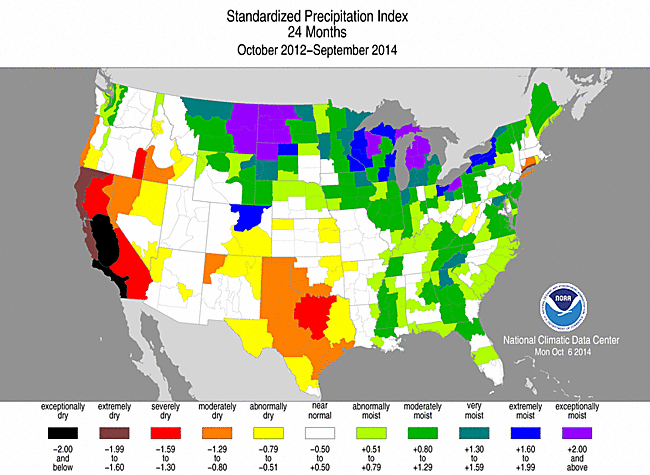
Standardized Precipitation Index
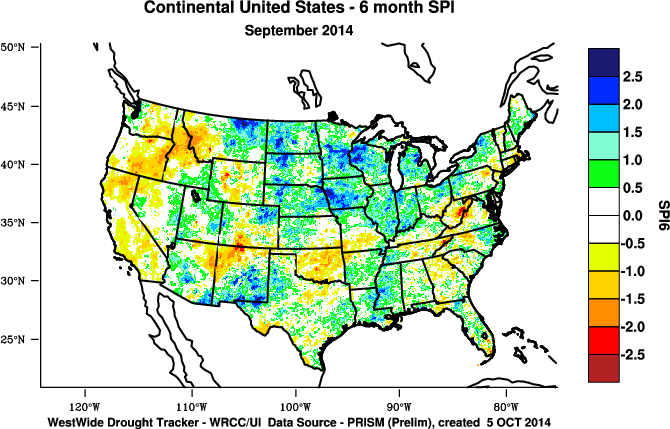
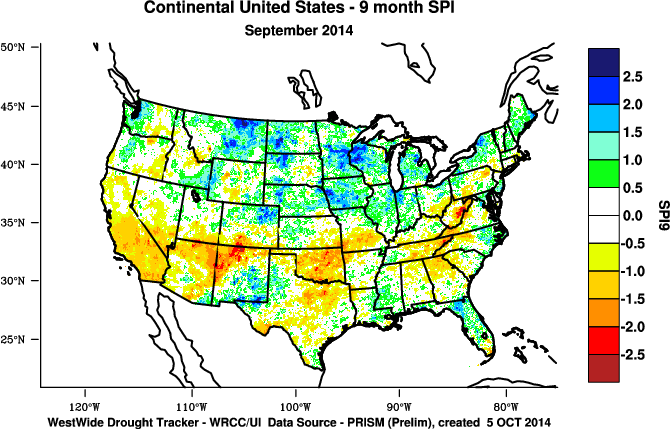
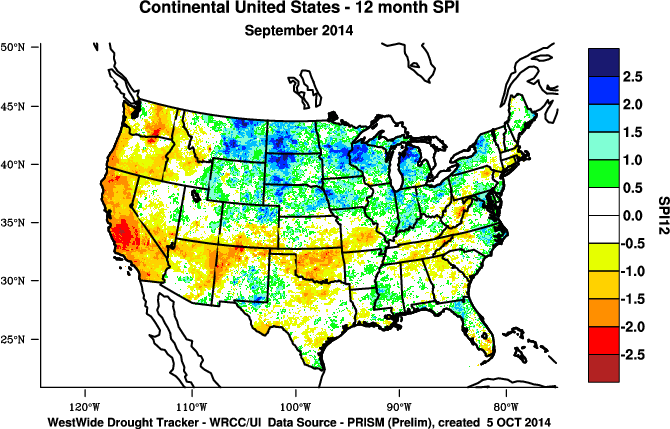
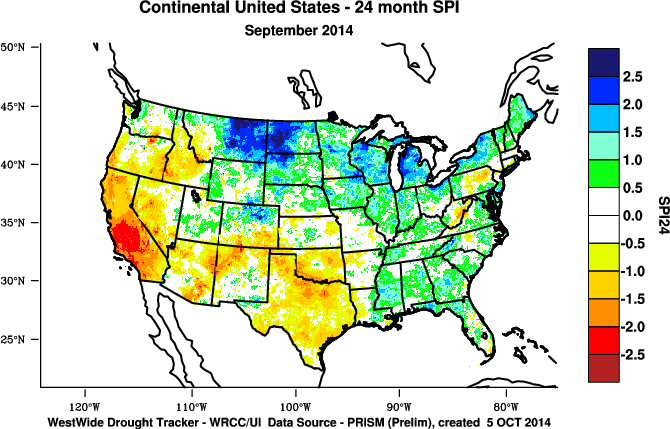
The Standardized Precipitation Index (SPI) measures moisture supply. The SPI maps here show the spatial extent of anomalously wet and dry areas at time scales ranging from 1 month to 24 months.
 |
 |
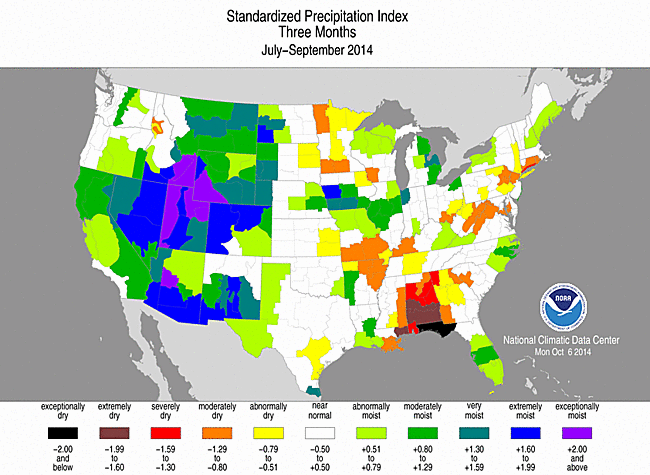 |
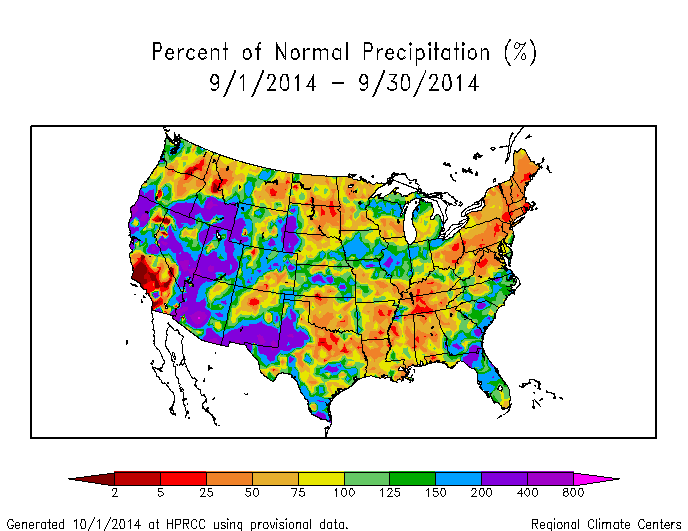
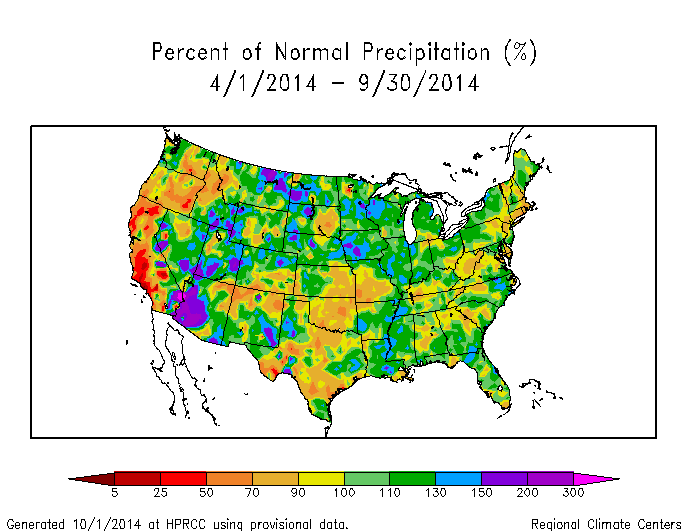
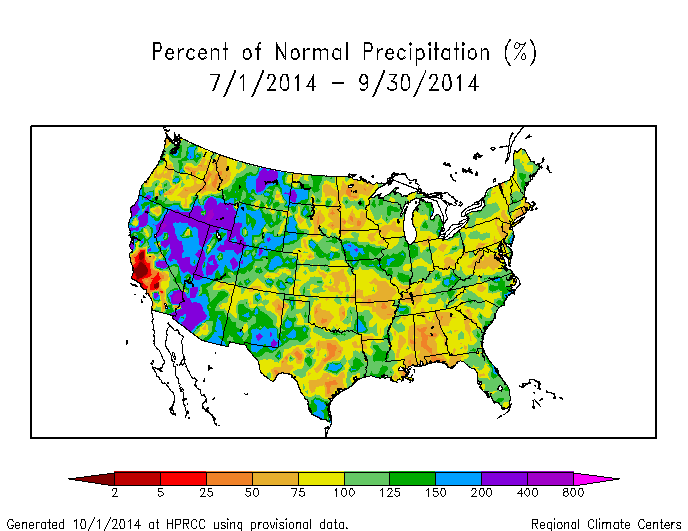
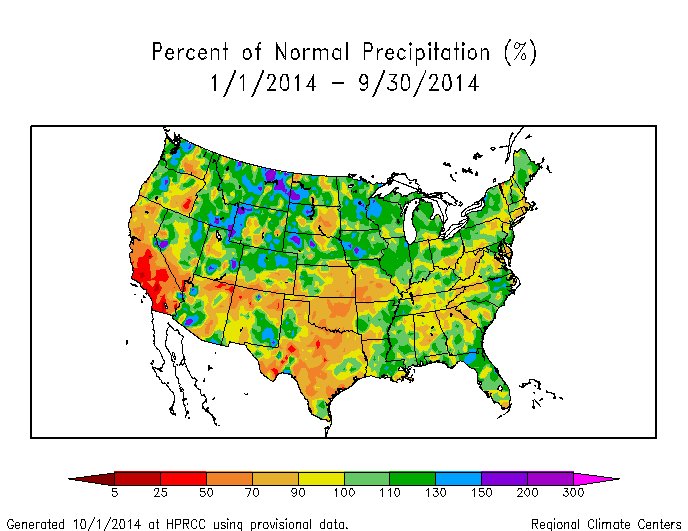
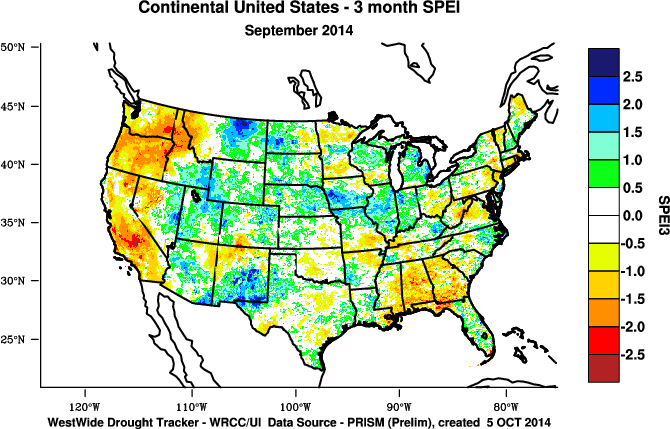
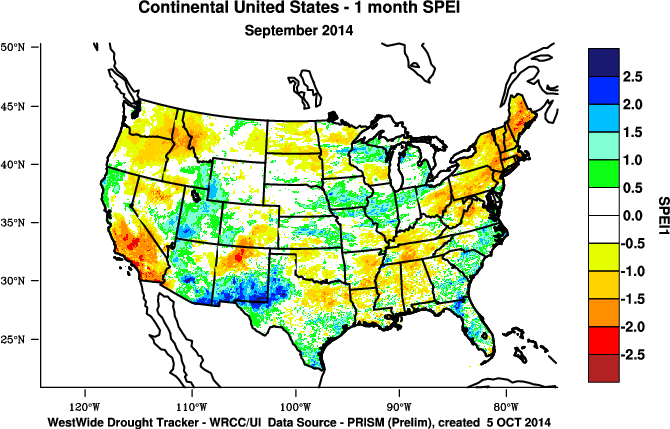
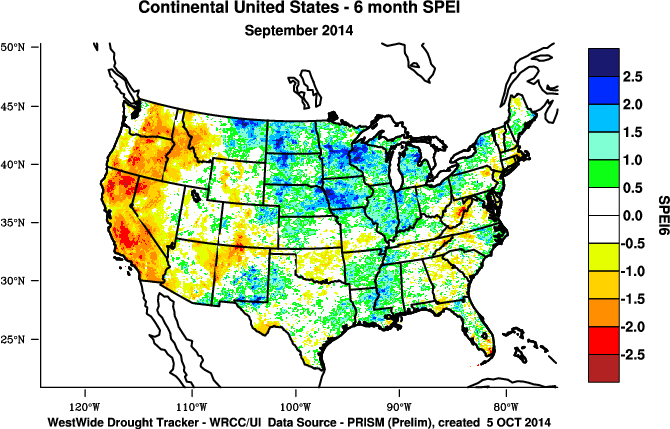
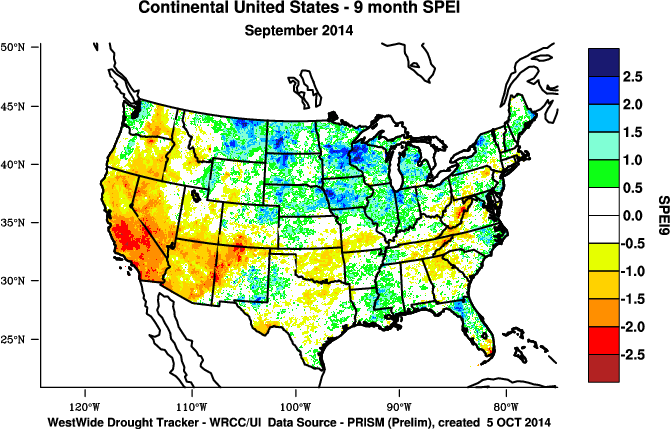
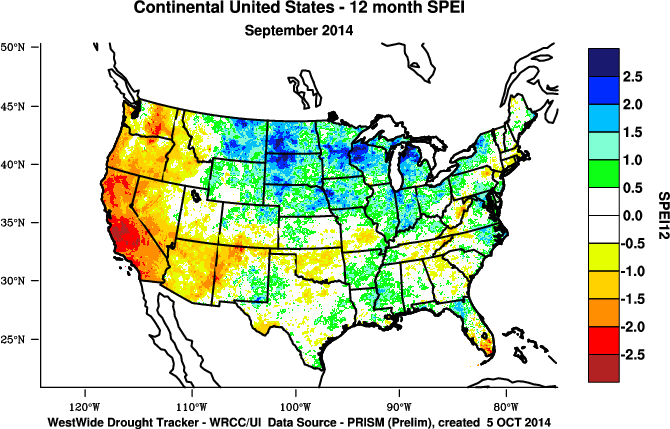
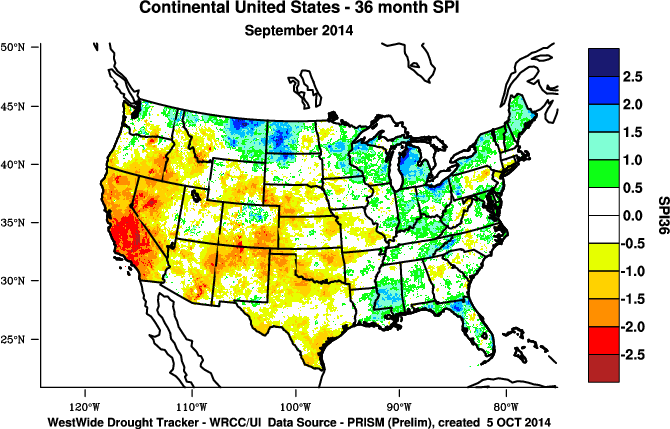
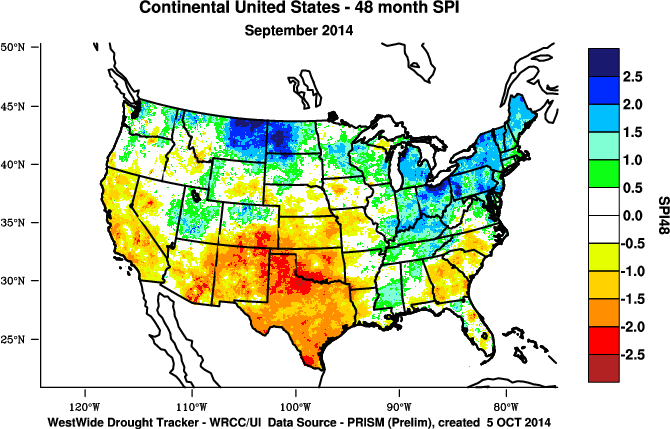
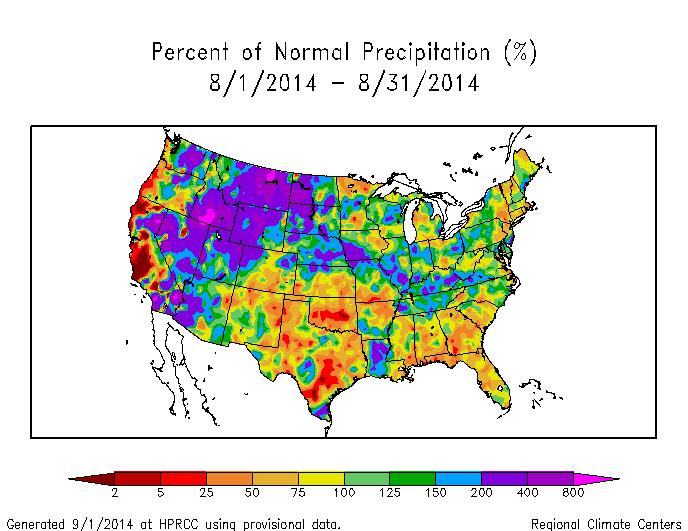
The SPI maps illustrate how moisture conditions have varied considerably through time and space over the last two years. September brought another month of enhanced monsoon rainfall to much of the West, with the 1-month SPI map showing above-normal precipitation to the Southwest, Intermountain Basin, Central Rockies, and parts of California. The September precipitation missed parts of the Pacific Northwest and Northern Rockies. The entire summer has had above-normal monsoon precipitation, and this is reflected in above-normal precipitation for much of the West at the 2- and 3-month time scales, as well as parts of the West on the 6-month SPI map. Dryness in the southwestern U.S., with wet conditions in the Northwest to Central Rockies, is evident at the 9-month time scale, while very dry conditions prevail in the Far West at 12 and 24 months. The Northeast to Central Appalachians were very dry during September, with dryness still widespread across the region at the 2-month time scale and even across parts of it at 3 months. Parts of Southern New England are dry at every time scale, while the northern and western portions of the Northeast are wet at the longer time scales. Dryness is evident in the Tennessee to Lower Mississippi valleys at one month, and spreads to the Gulf Coast (Mississippi, Alabama, Florida) at 2 and 3 months. The Southern Appalachians are dry at 9 months, but otherwise the Southeast is near normal to wet at 6-24 months. The Northern Plains to Upper Midwest show areas of dryness at 1 to 3 months, but wetness dominates from 6 to 24 months. The Southern Plains are mostly characterized by neutral to dry conditions at most time scales, except wet in the High Plains of western Texas at 1 to 3 months.
 |
 |
 |
Agricultural, Hydrological, and Meteorological Indices and Impacts
 |
 |
Drought conditions were reflected in numerous agricultural, hydrological, and other meteorological indicators, both observed and modeled.
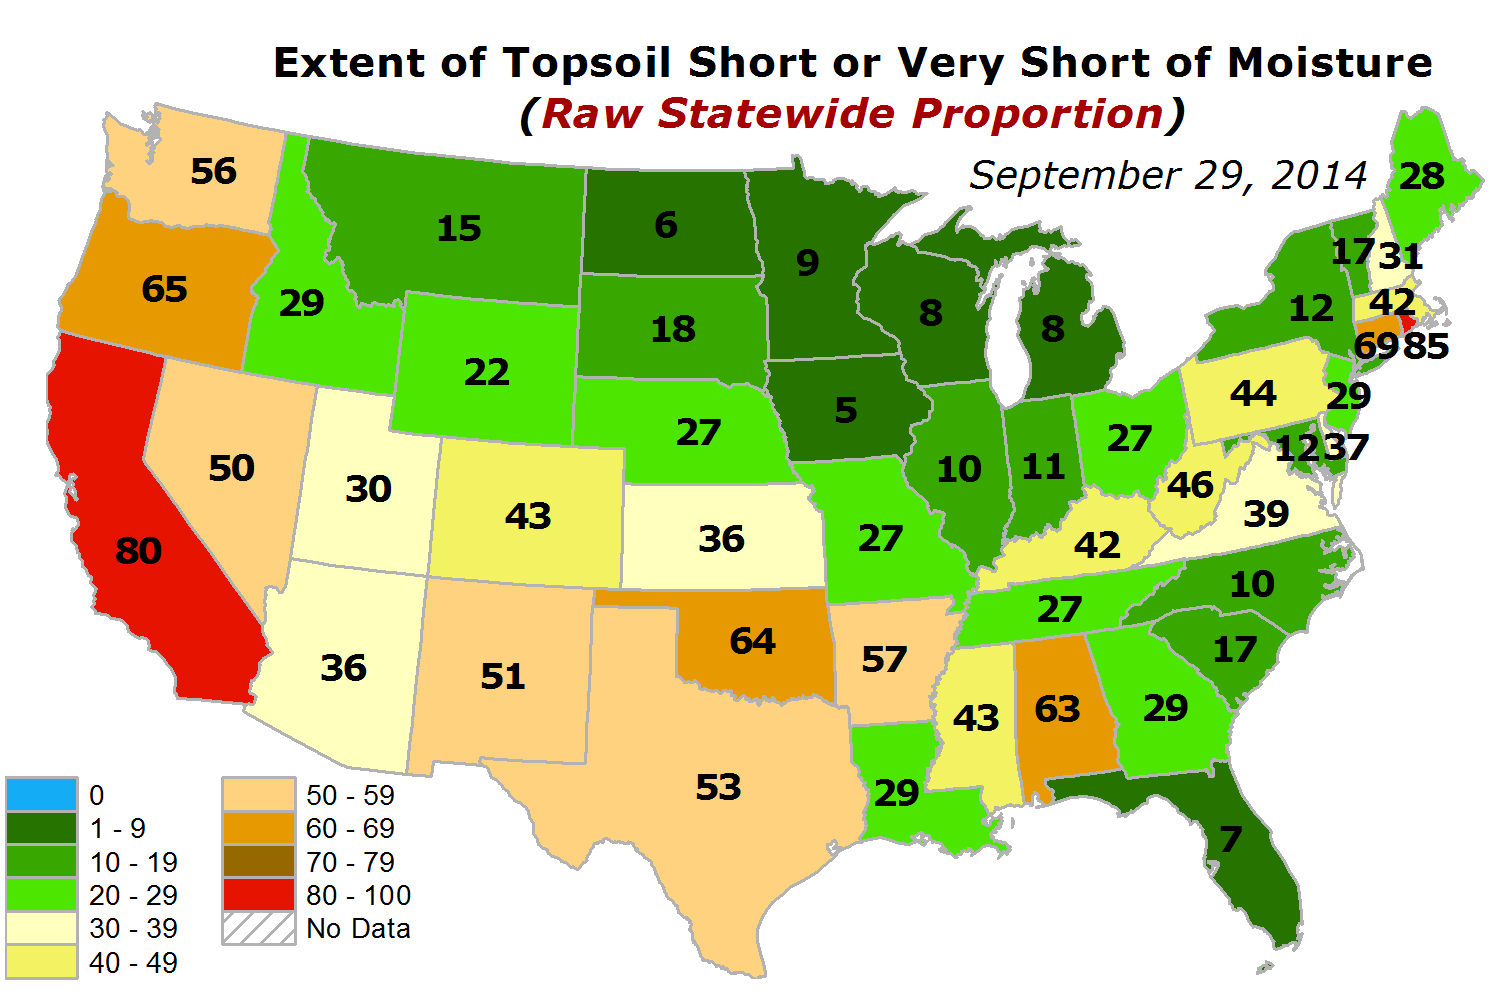
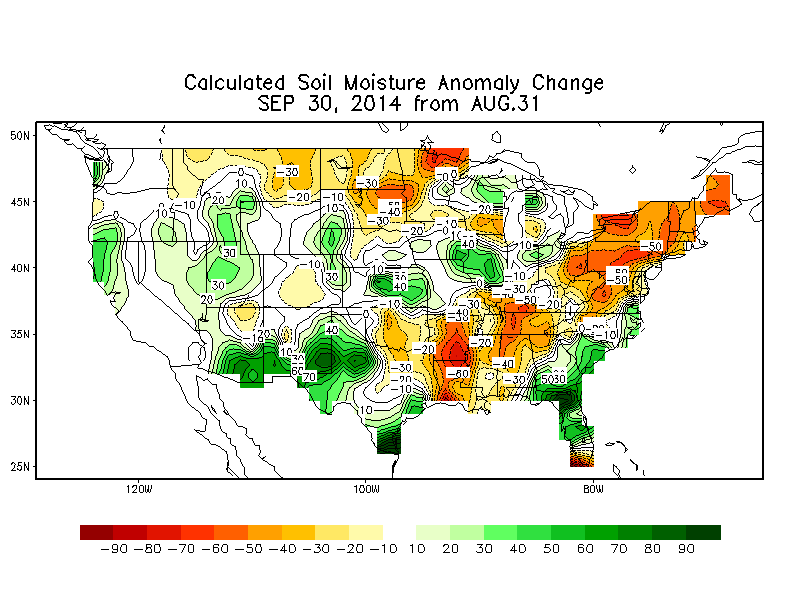
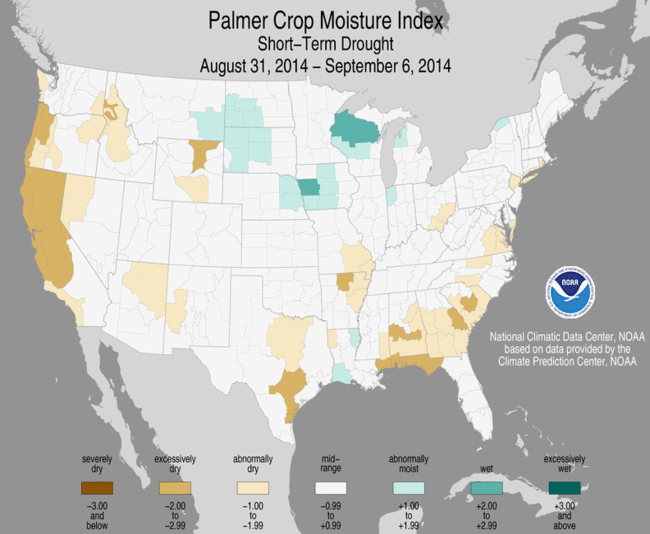
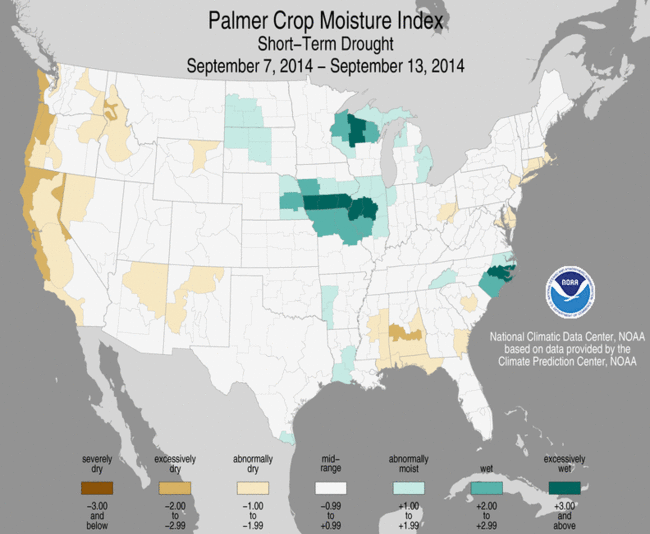
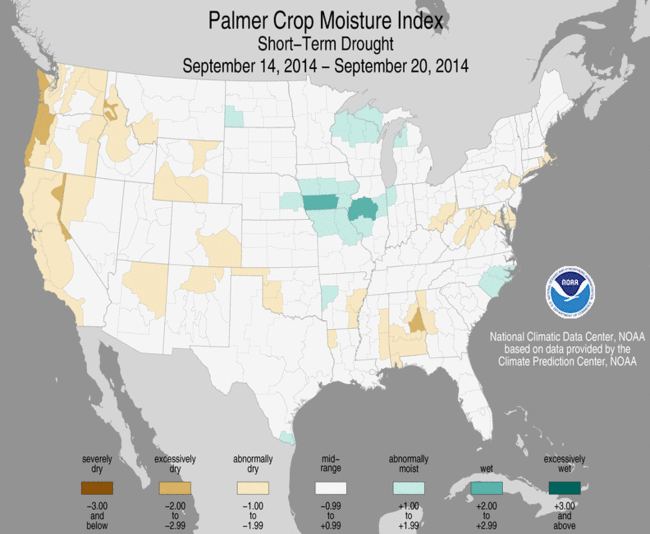
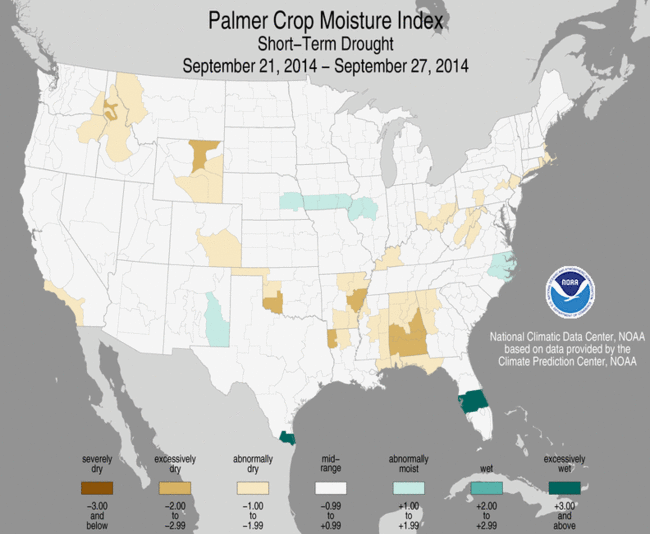
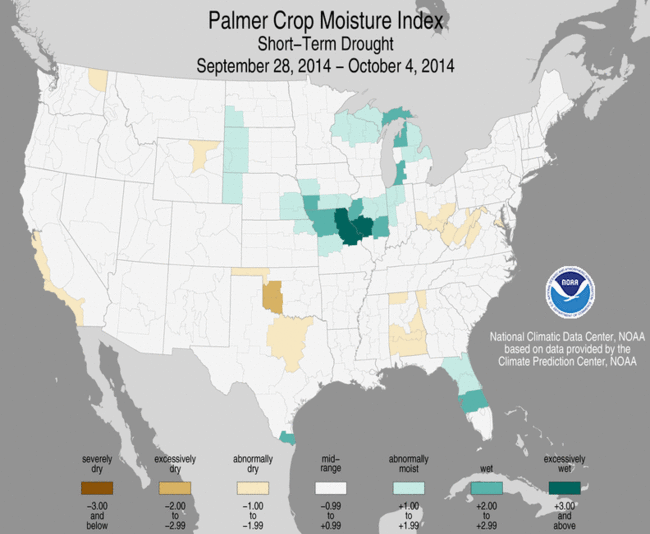
Modeled and observed topsoil moisture improved locally where it rained, and topsoils dried out where it didn't, especially from the Lower Mississippi Valley to the Northeast. The weekly Palmer Crop Moisture Index (CMI) showed improving conditions throughout the month in most areas due to beneficial rain but also due to the seasonal transition to fall when evaporation decreases (weeks 1, 2, 3, 4, 5). According to September 29th statistics from the U.S. Department of Agriculture (USDA), 50 percent or more of the topsoil was rated short or very short of moisture (dry or very dry) in Rhode Island (85%), California (80%), Connecticut (69%), Oregon (65%), Oklahoma (64%), Alabama (63%), Arkansas (57%), Washington (56%), Texas (53%), New Mexico (51%), and Nevada (50%). Subsoil moisture continued to be dry to very dry across these states, with more than 50 percent of the subsoil moisture rated short or very short in California (85%), Oregon (75%), Oklahoma (74%), Rhode Island (70%), Washington (63%), Texas (61%), Alabama (61%), Nevada (60%), New Mexico (55%), Connecticut (54%), West Virginia (51%), and Colorado (50%).
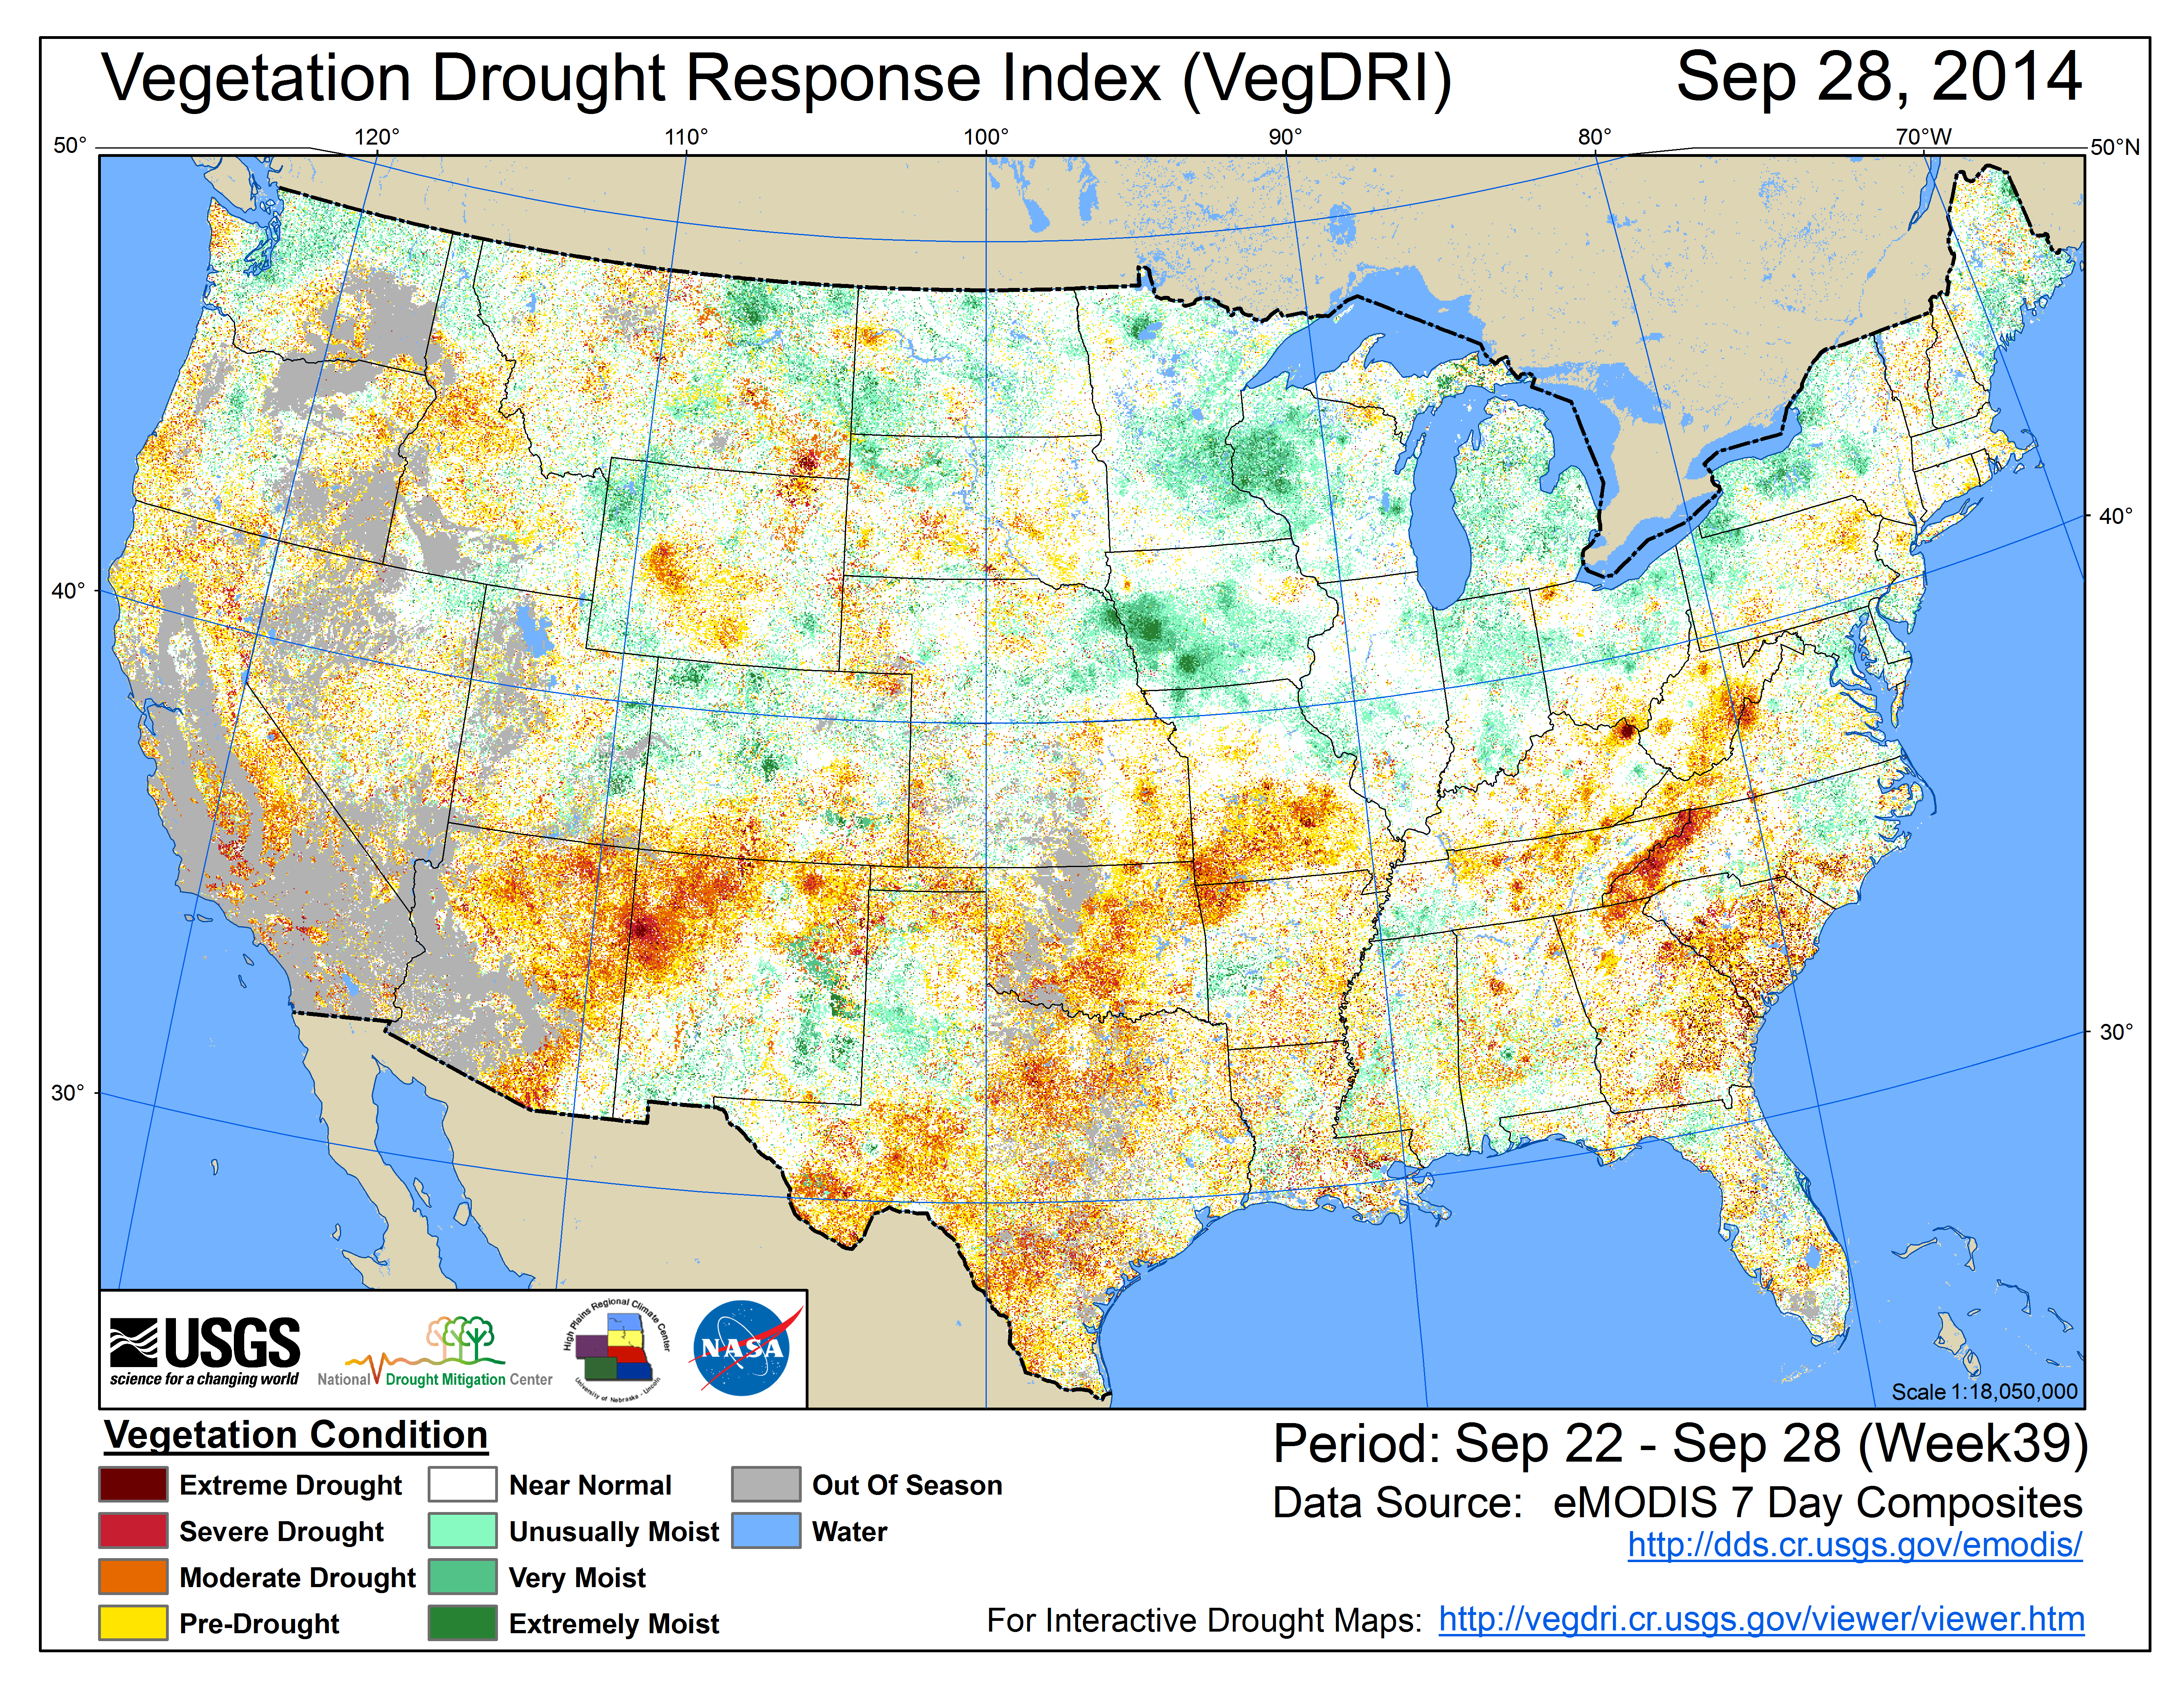
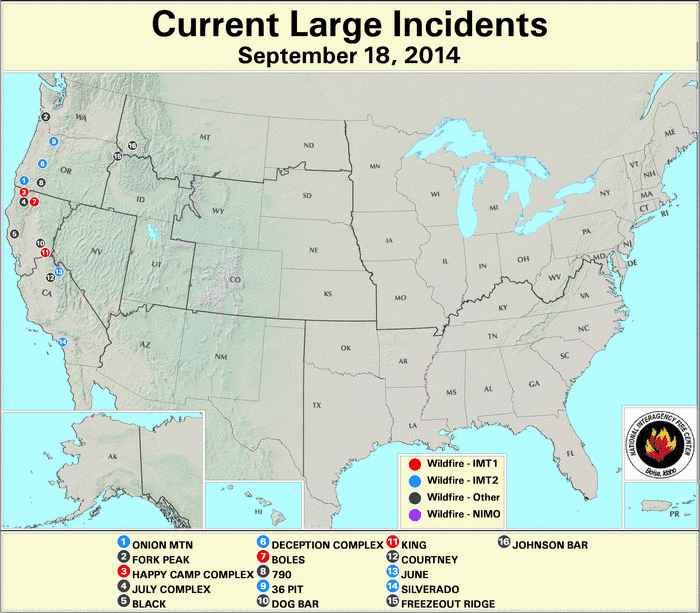
Vegetation continued to be stressed, especially across much of the Southern Plains to West, but also in pockets in West Virginia, Missouri, and Arkansas. As of September 30th, about 21 percent of hay was in drought (down 1 percent from four weeks ago), 5 percent of corn (down 2 percent), 2 percent of soybeans (down 1 percent), 30 percent of the cattle inventory (down 3 percent), and 35 percent of winter wheat (down 7 percent). Nationally, 19 percent of the pasture and rangeland was in poor to very poor condition, with statewide values over 50 percent in California (70%) and over 40 percent in Oregon (47%), Nevada (45%), and Washington (41%). The hot temperatures, low humidities, and prolonged dryness contributed to the development of large wildfires in the West, but rain from low pressure systems and fronts near the end of the month helped reduce the number of wildfires.
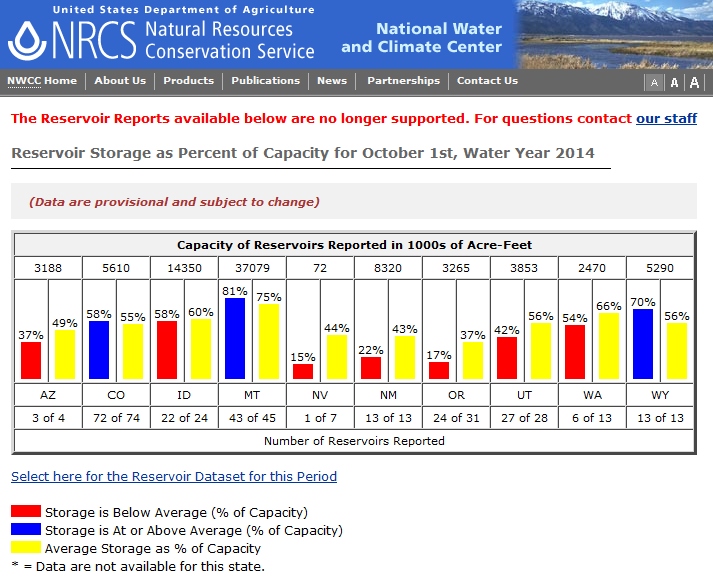
USDA West statewide reservoir status.
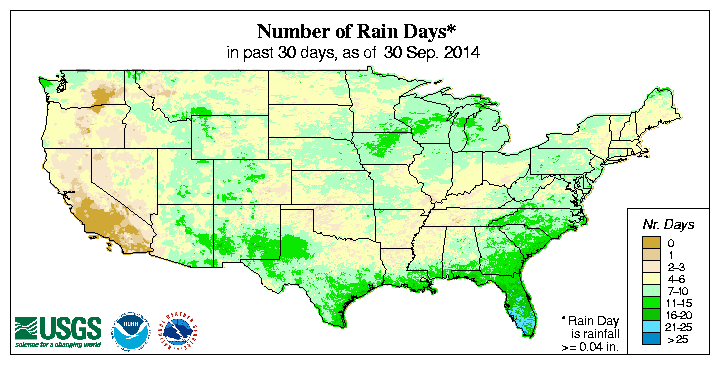
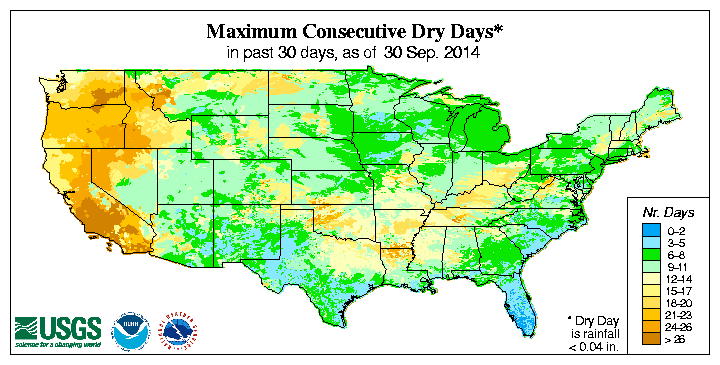
The subnormal precipitation in the Northeast, Tennessee Valley, Northwest, and southern California was reflected in below-normal monthly precipitation totals as well as lack of rain days and long runs of consecutive dry days. These indicators also showed dryness in parts of the Great Plains.
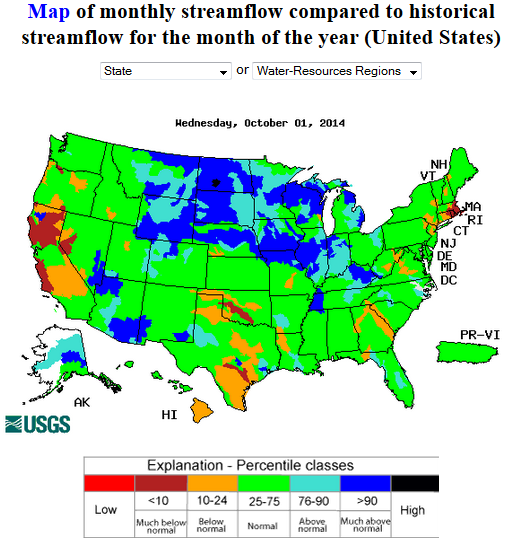
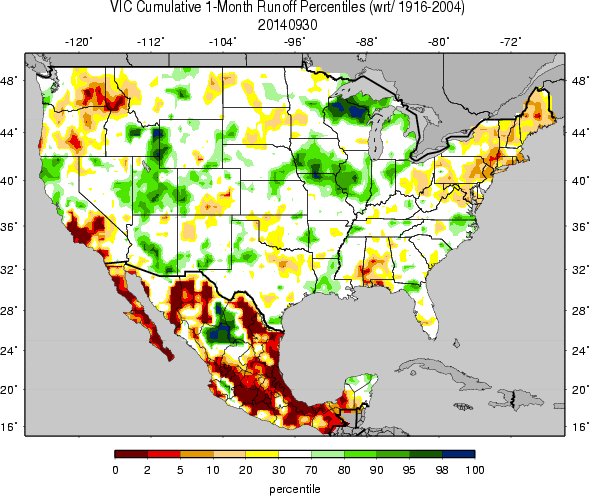
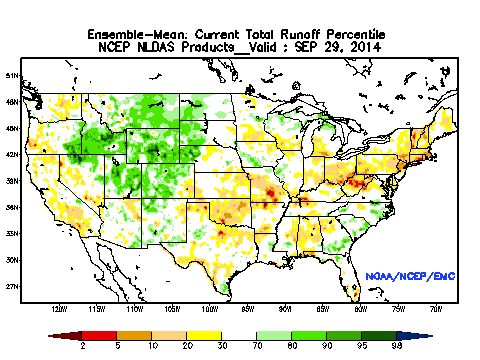
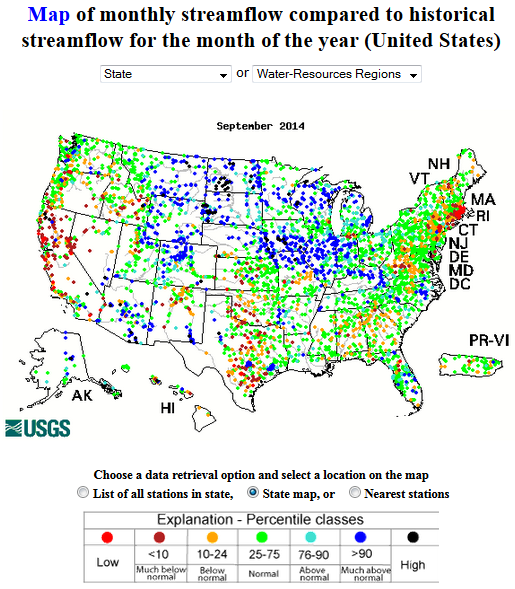
Streamflow and modeled runoff averaged below normal across parts of the West, Southern Plains, and Northeast, with some basins averaging much below normal and some stream gauges measuring record low monthly values for September.
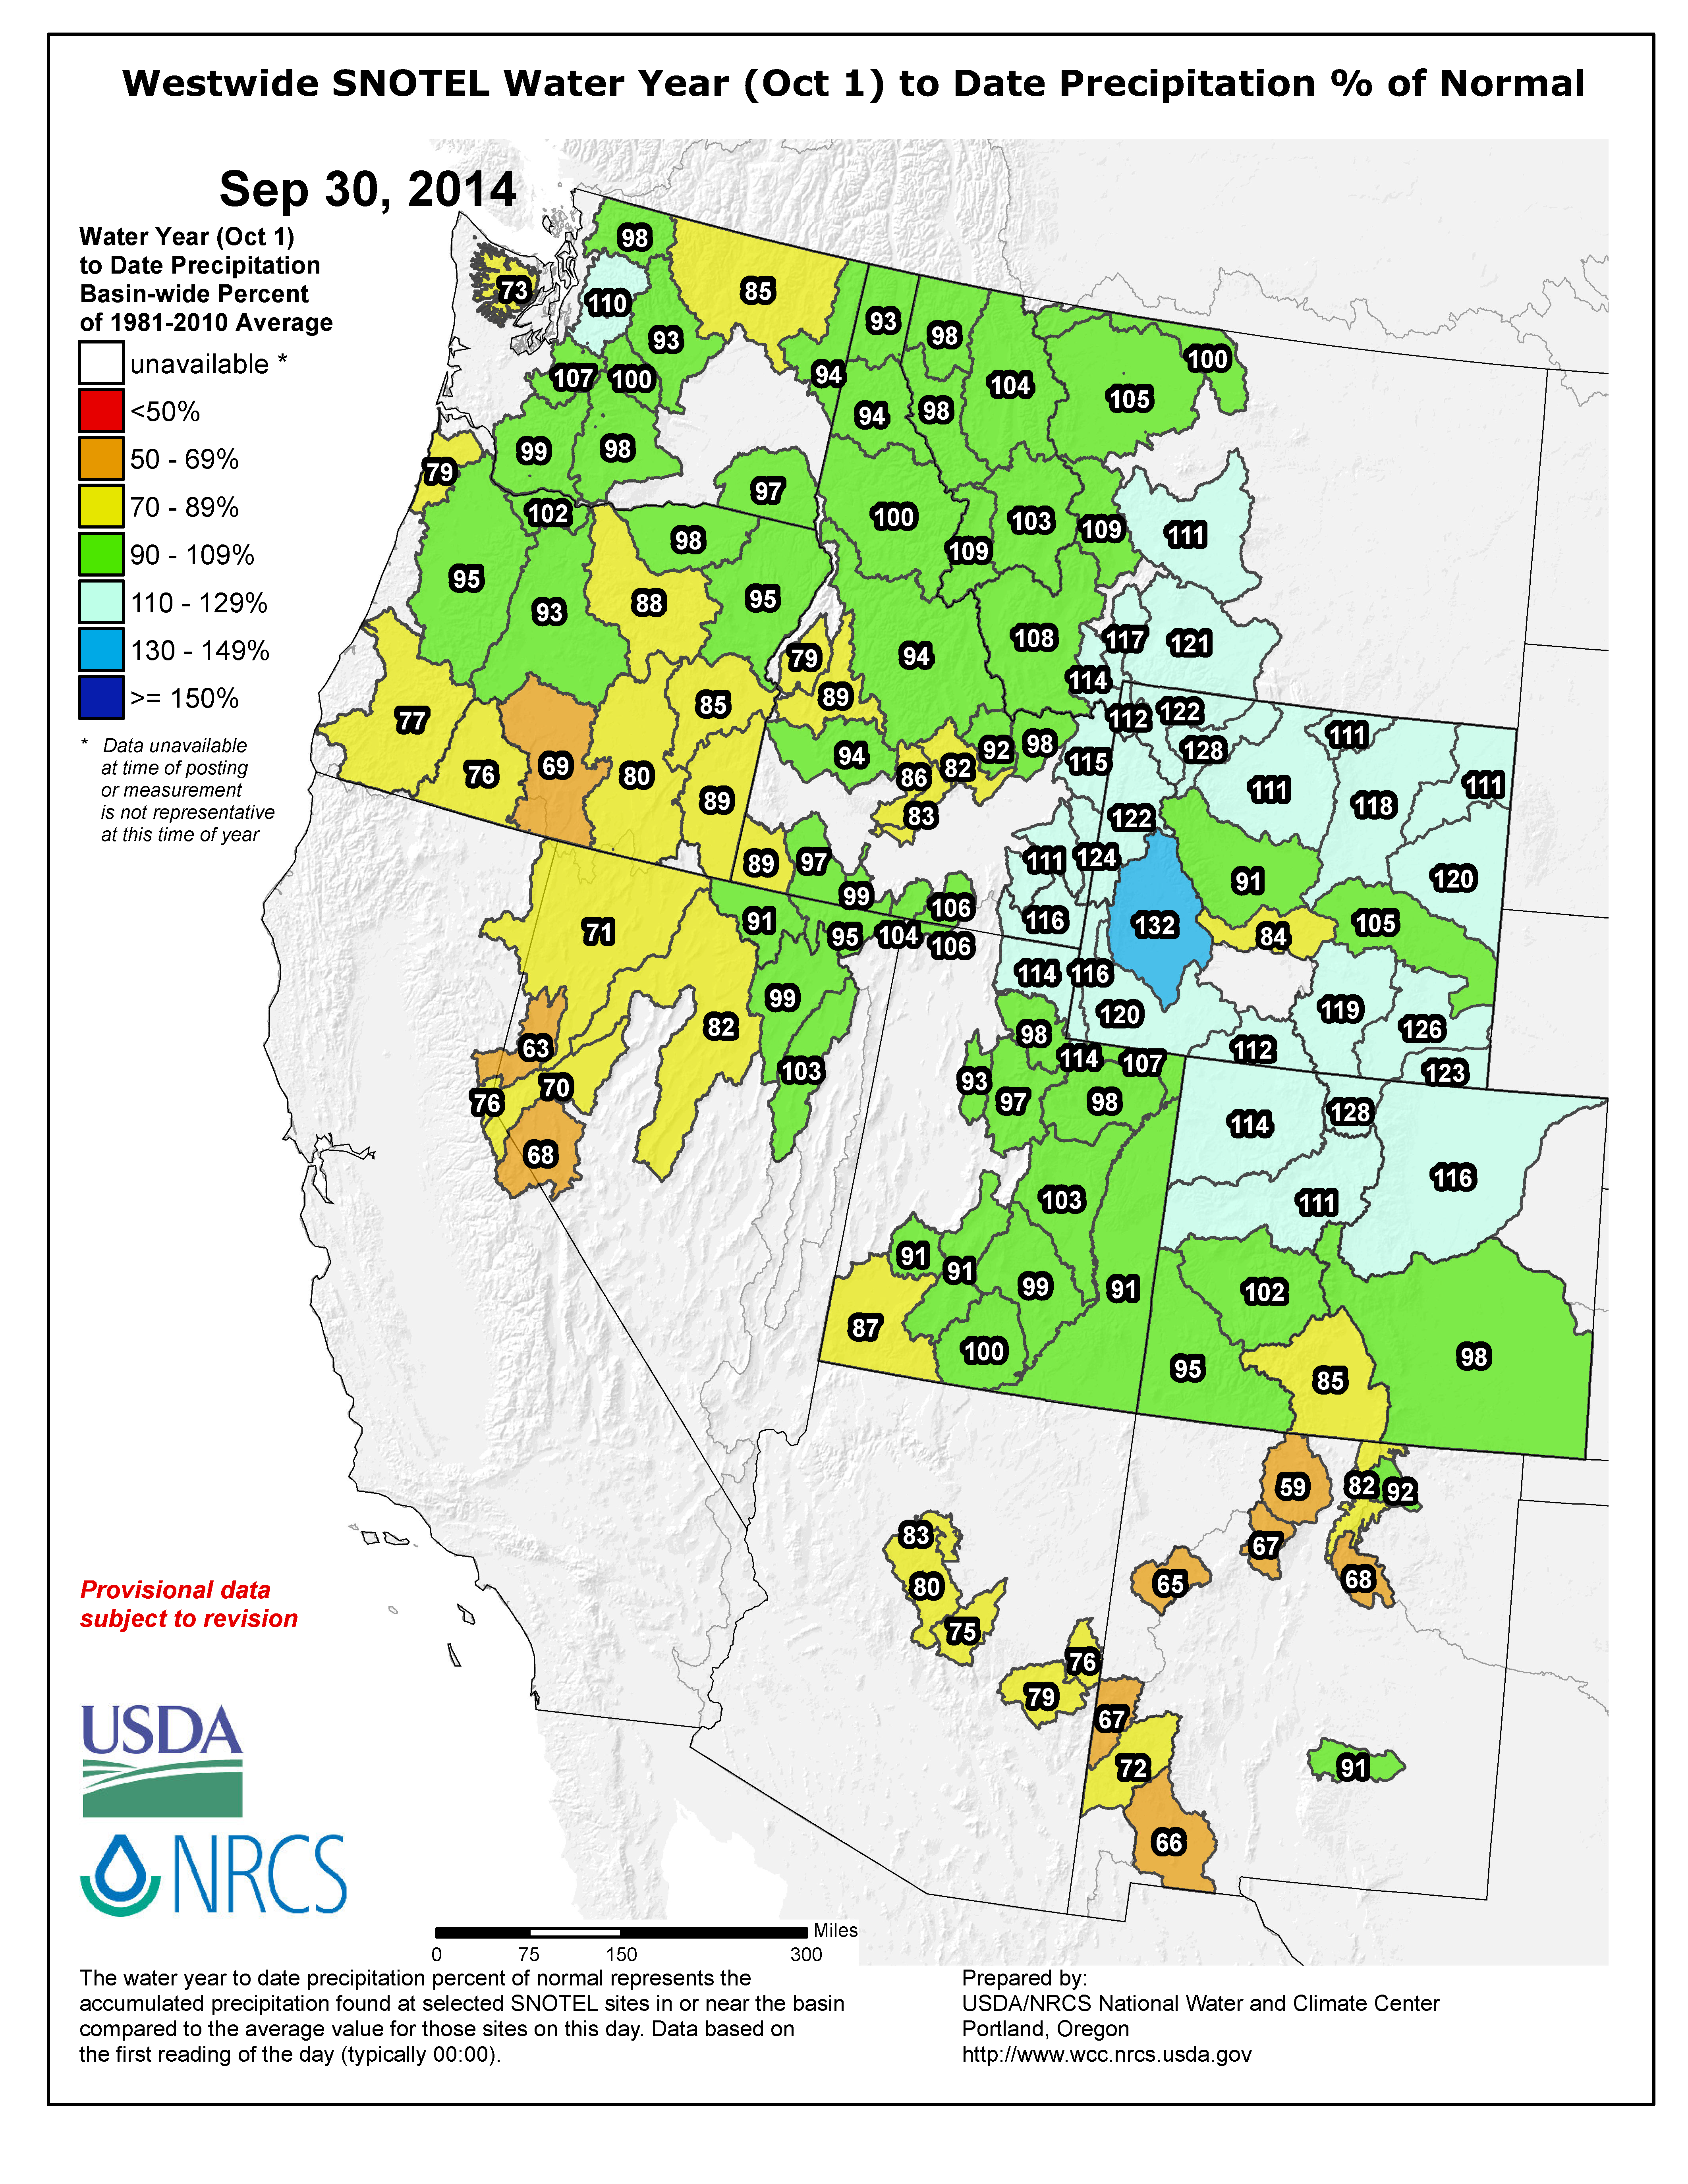
The monsoon precipitation during the
Regional Discussion
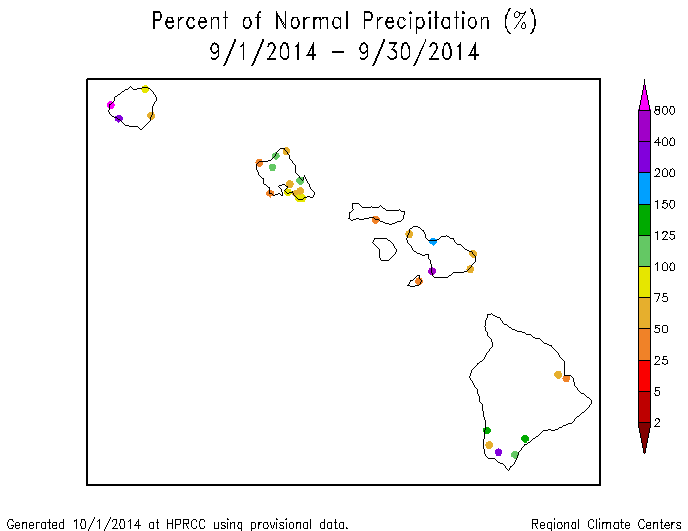
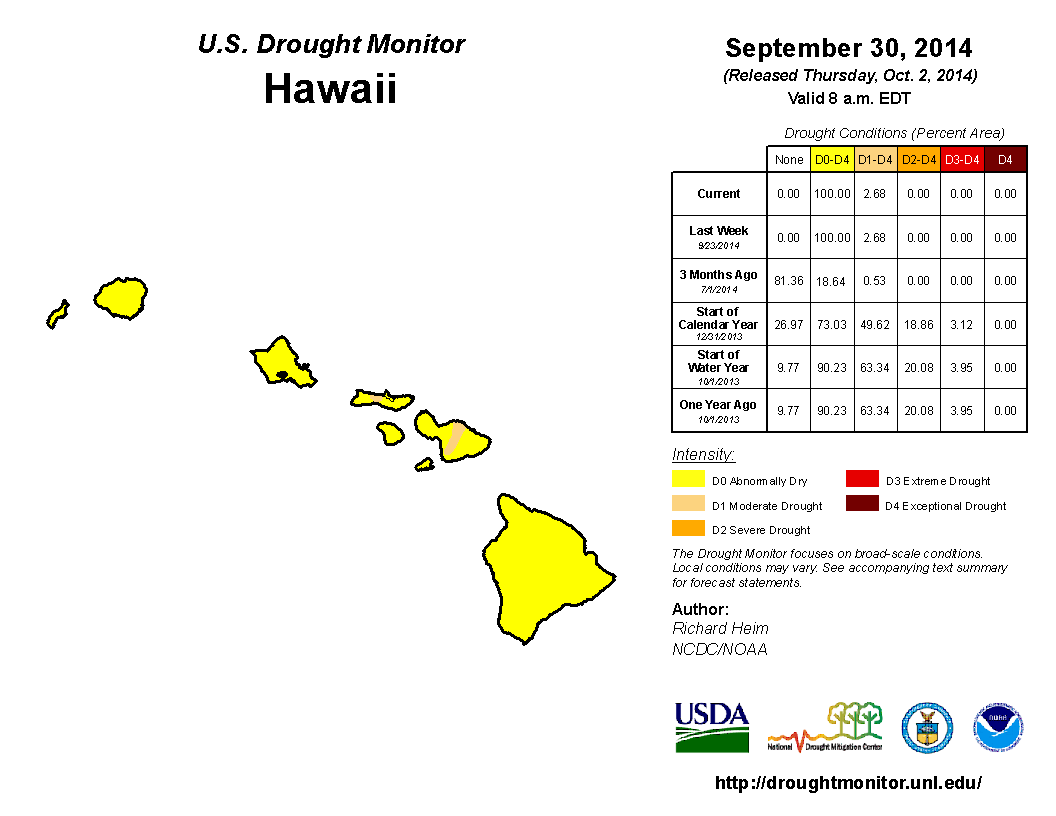
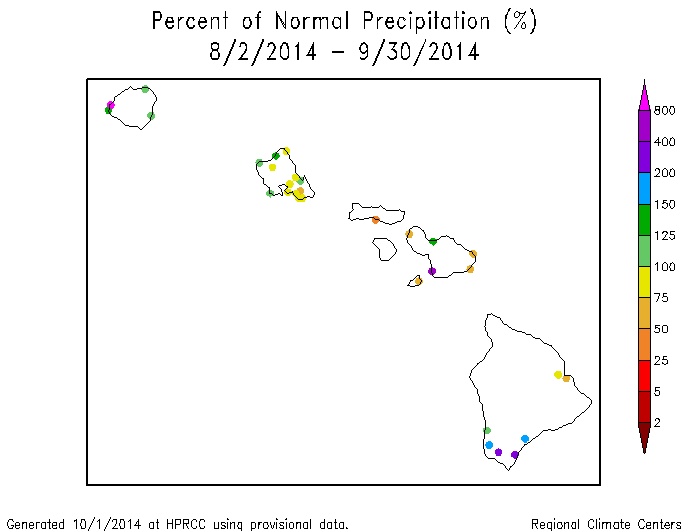
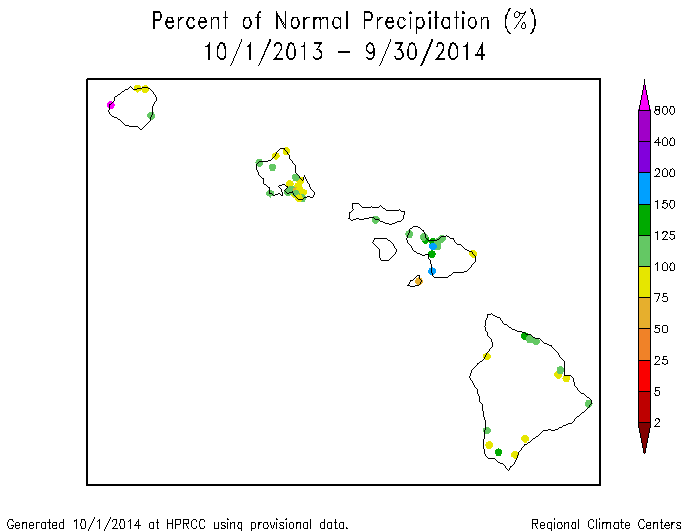
Hawaii: The September 2014 precipitation pattern was mixed across Hawaii, but with dryness predominating. During the previous month, rains brought wetter-than-normal conditions for August-September and July-September to stations in the northern islands and southern Big Island, but the islands in between were mostly drier than normal. Wetter conditions earlier in the year have resulted in above-normal precipitation for most of the stations in the short term (last 6, 9, and 12 months), but drier-than-normal conditions dominate at the longer term (last 24 and 36 months). On the USDM map, abnormal dryness expanded to cover all of the state during September, but moderate drought covered less than three percent of the state, reflecting the low reservoir situation in central Molokai and lowering reservoir and inflow levels in the Upcountry Maui area.
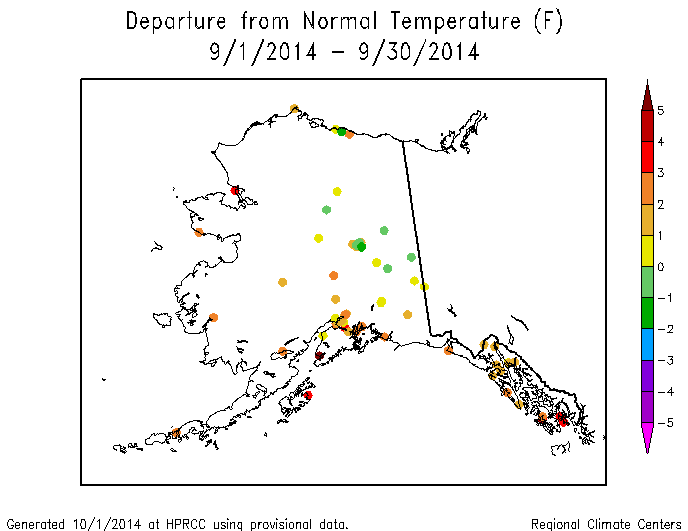
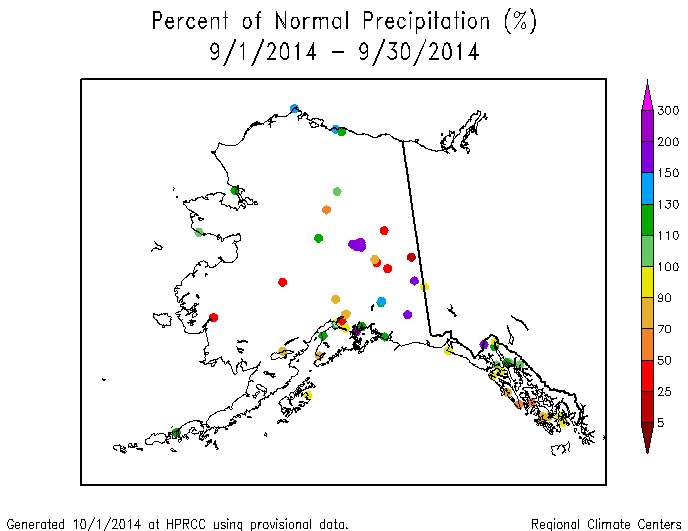
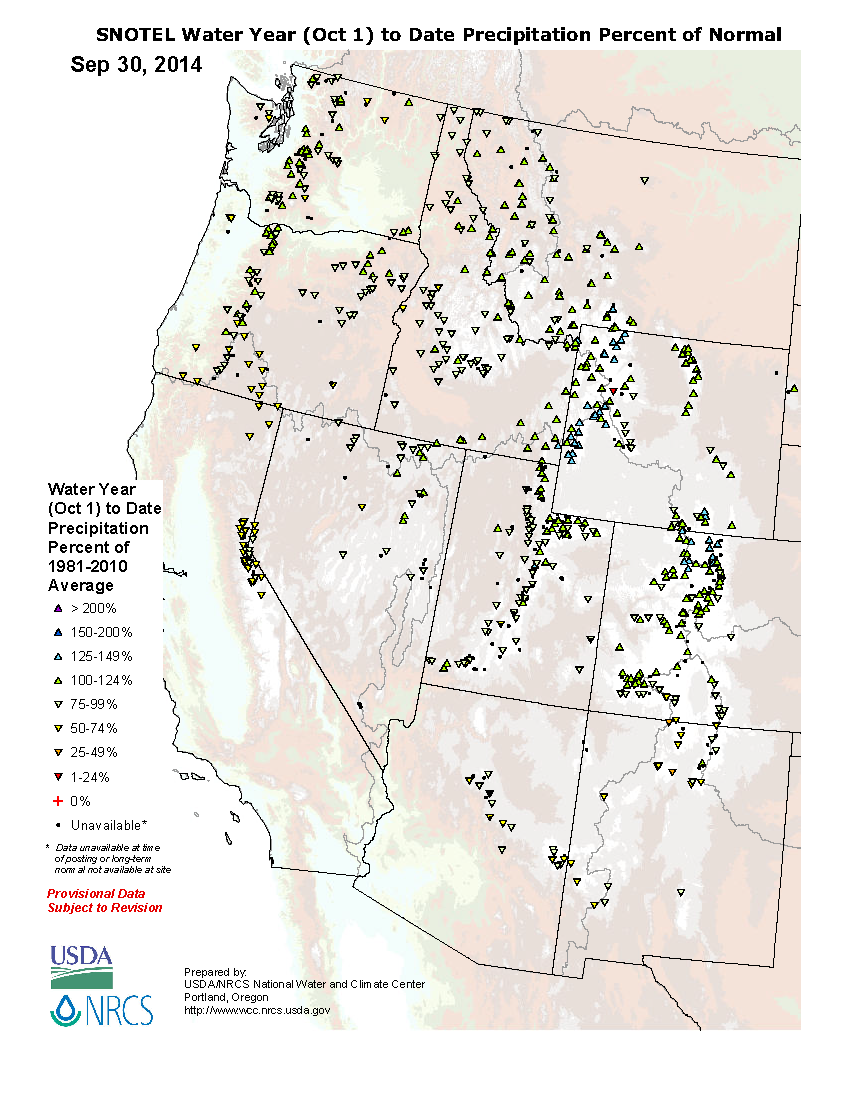
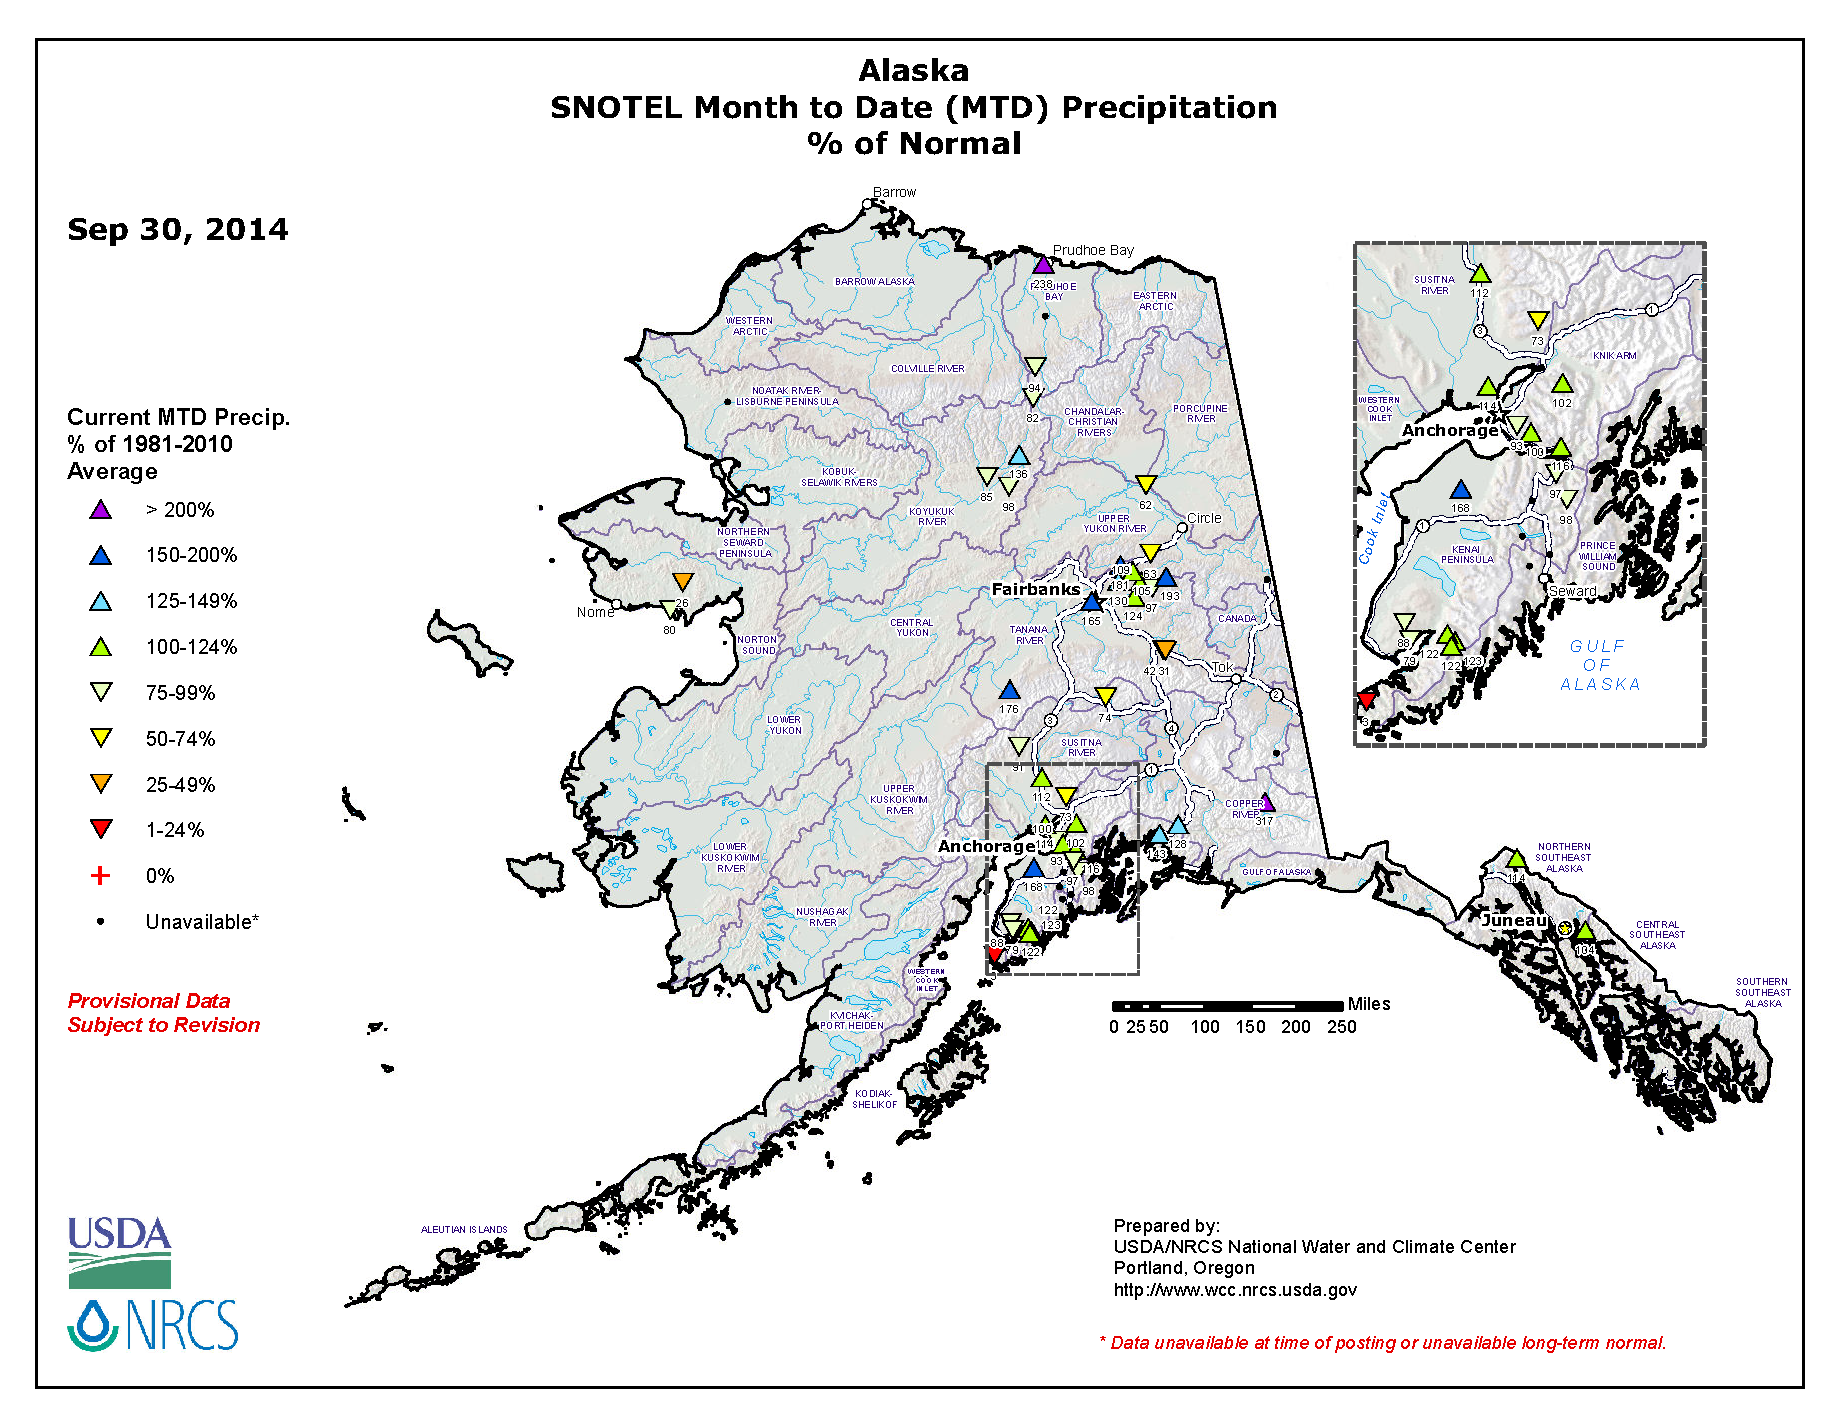
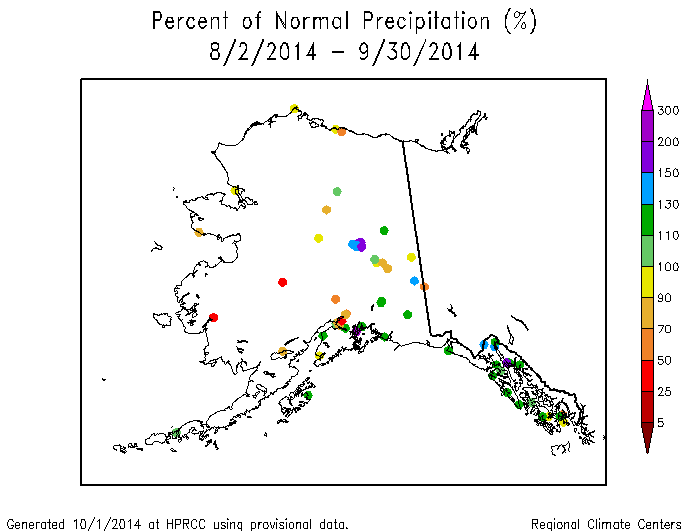
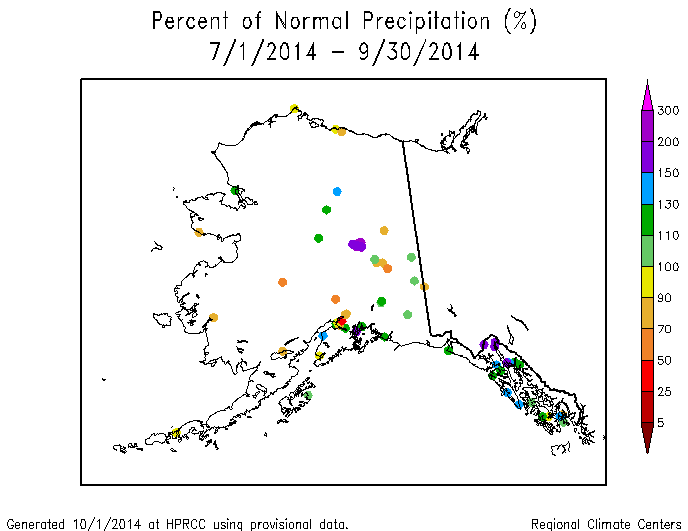
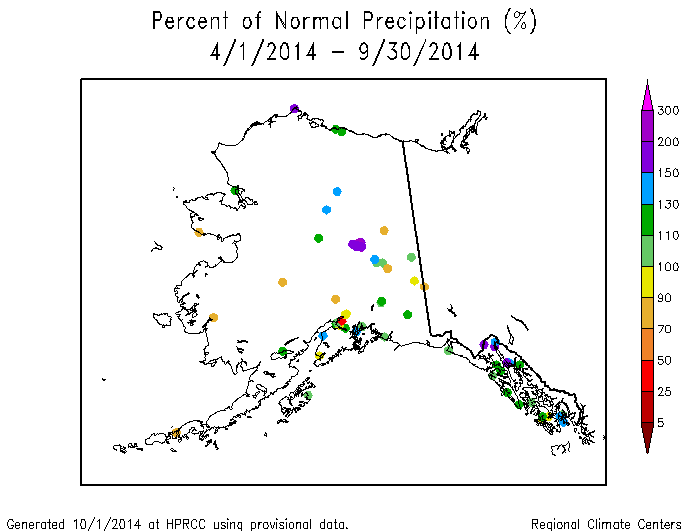
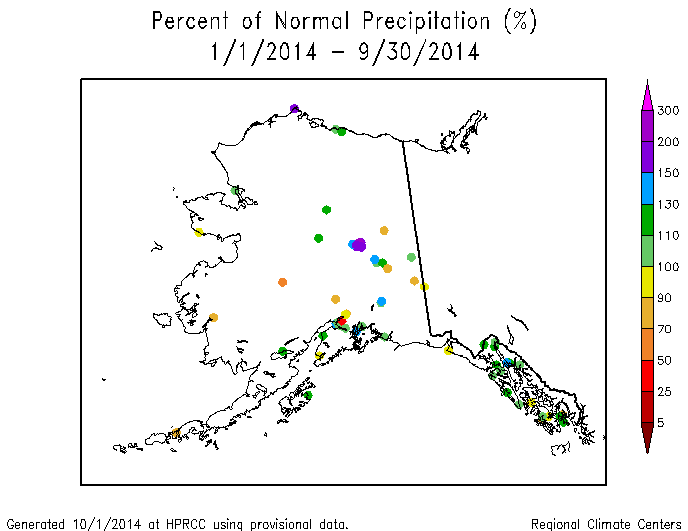
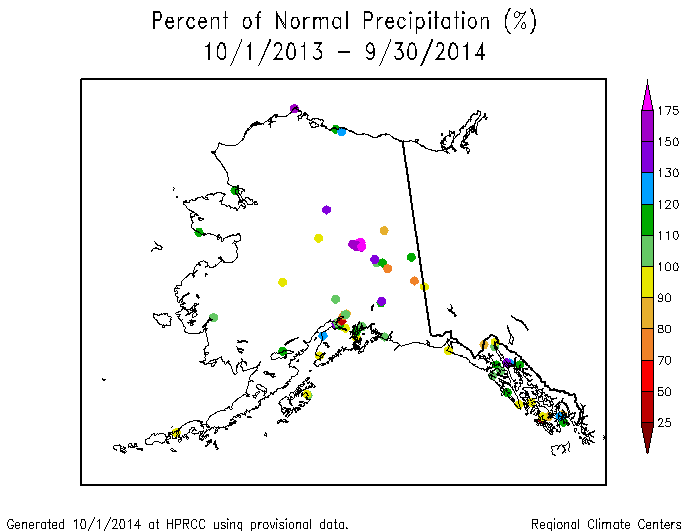
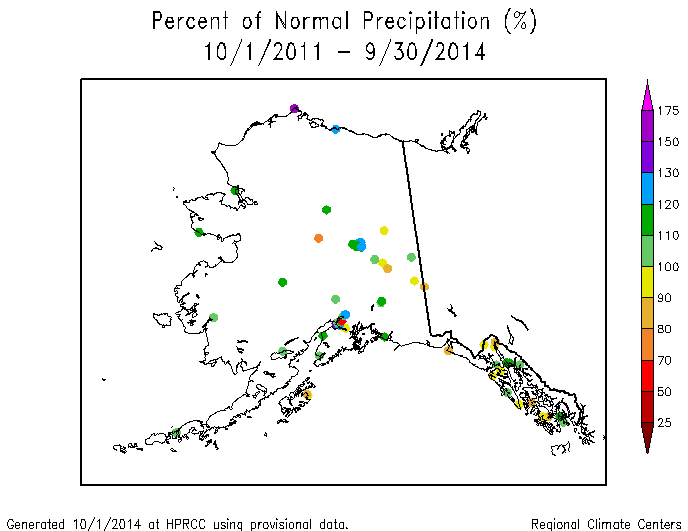
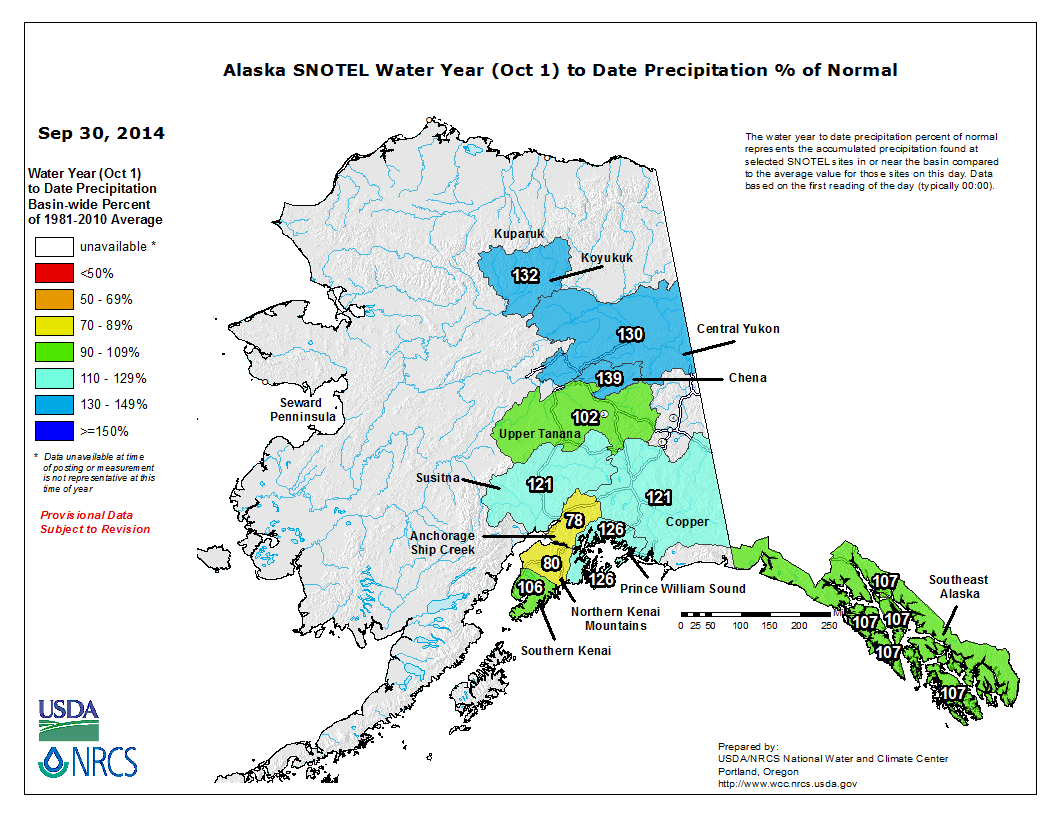
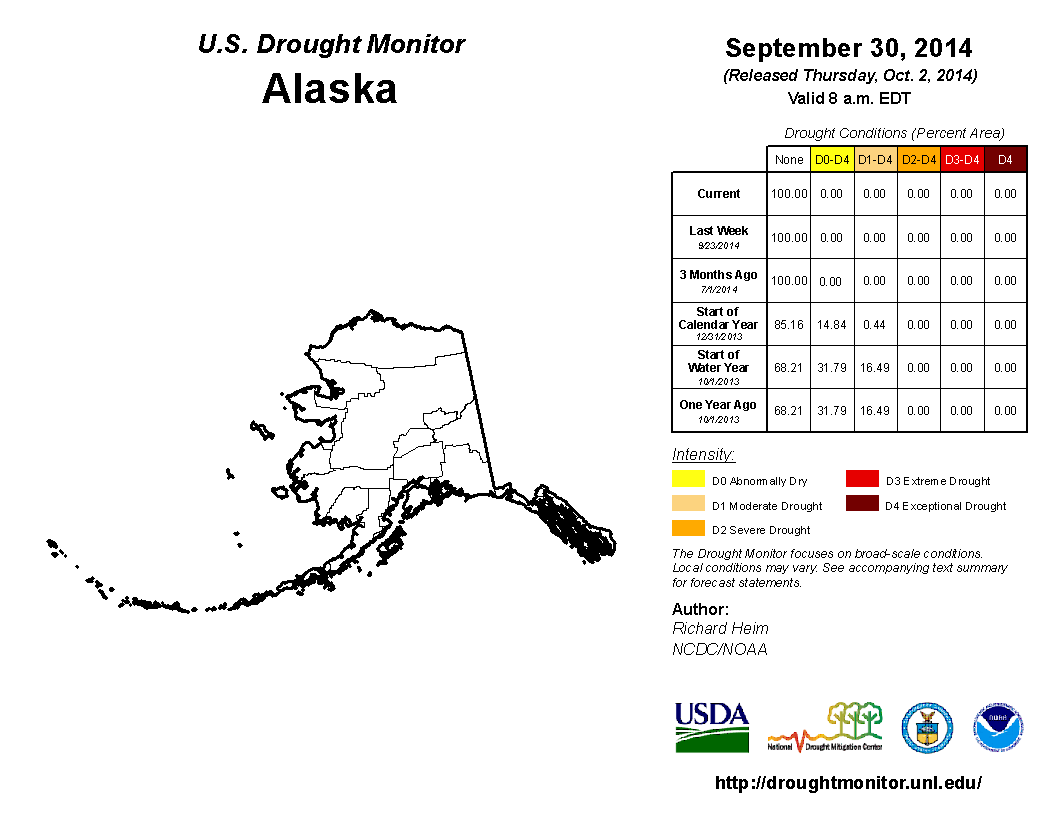
Alaska: Alaska also had a mixed precipitation pattern during September, but generally more stations were drier than normal in the south and interior regions and wetter than normal in the north. The pattern shifts back and forth in the short term (last 2, 3, 6, and 9 months), but generally the southwestern stations are consistently drier than normal and the panhandle stations wetter than normal. The pattern reverses at the longer time scales (last 12, 24, and 36 months). Based on the high elevation (SNOTEL) stations data, most of the basins were near to wetter than normal for the water year (October 1, 2013-September 30, 2014). The September 30th USDM map was free of drought and abnormal dryness.
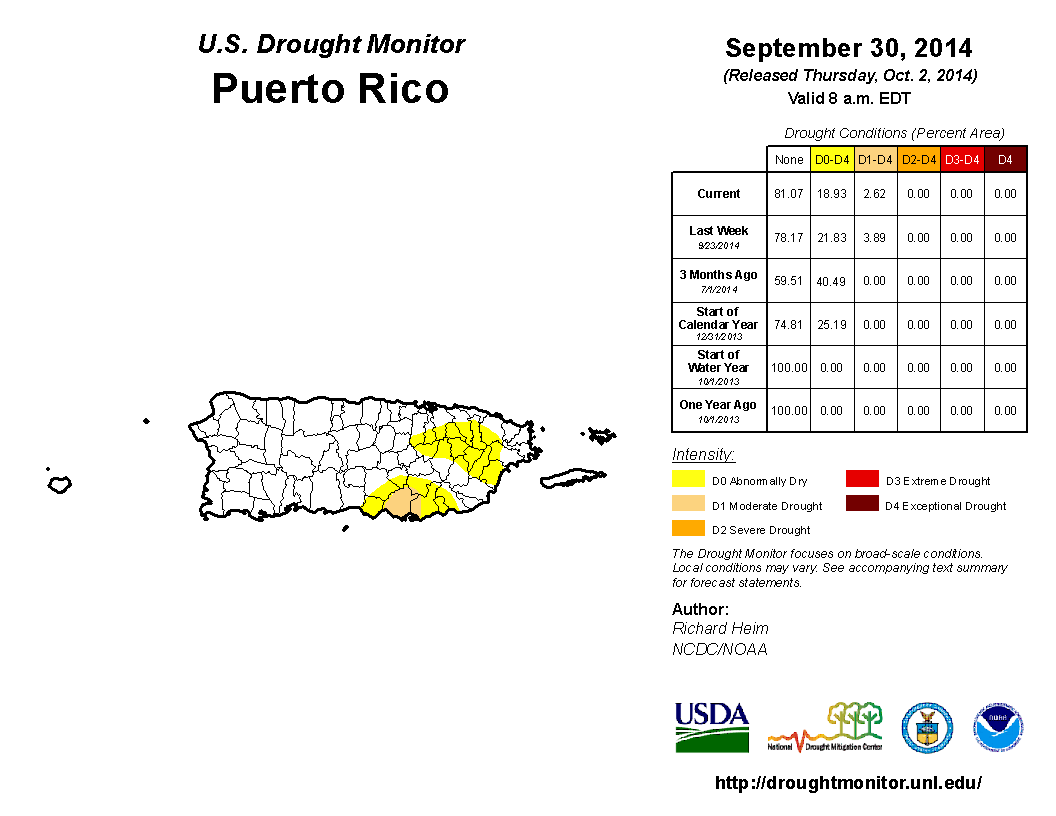
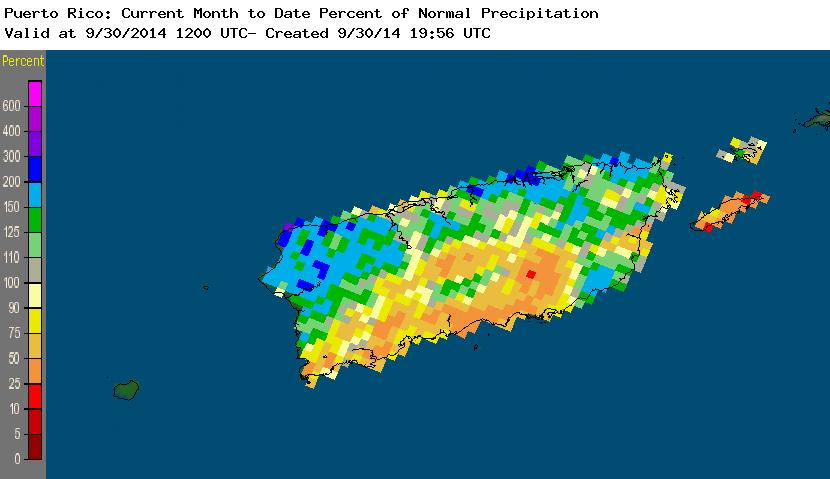
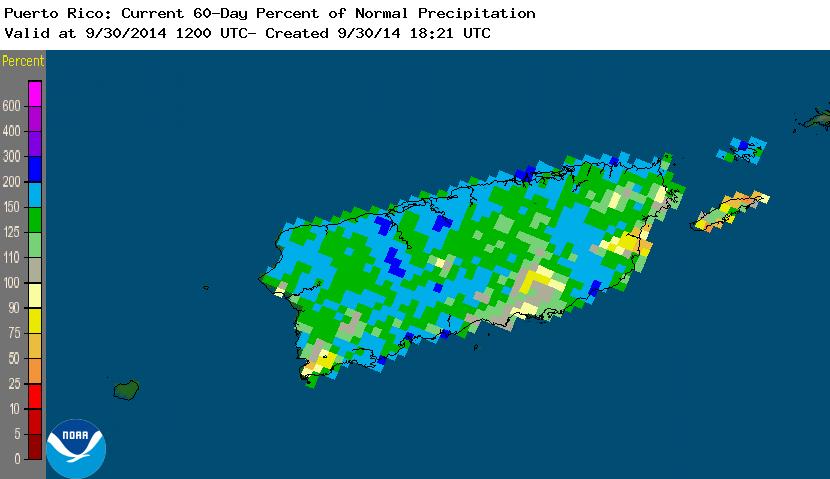
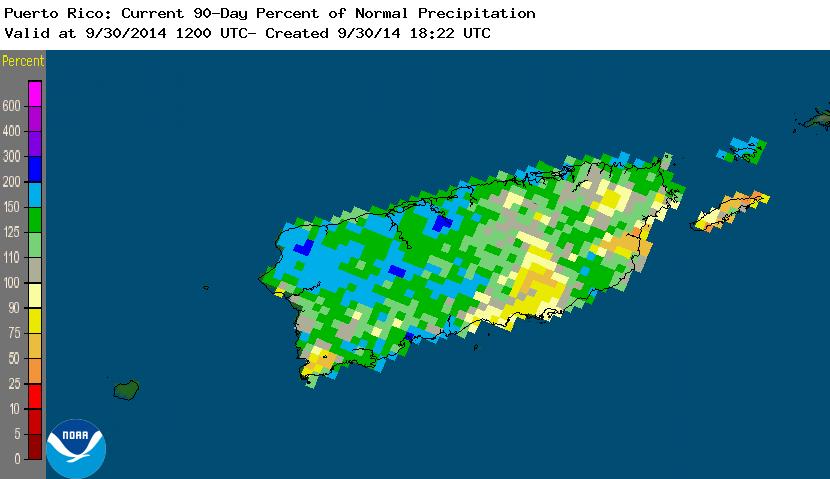
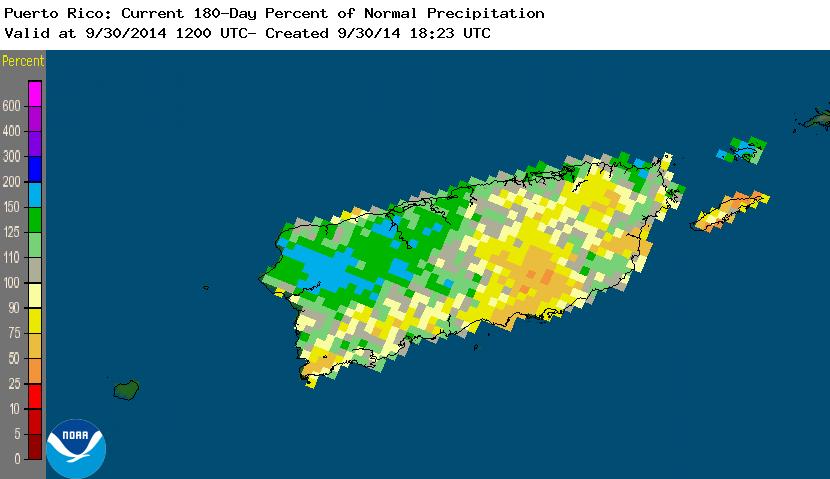
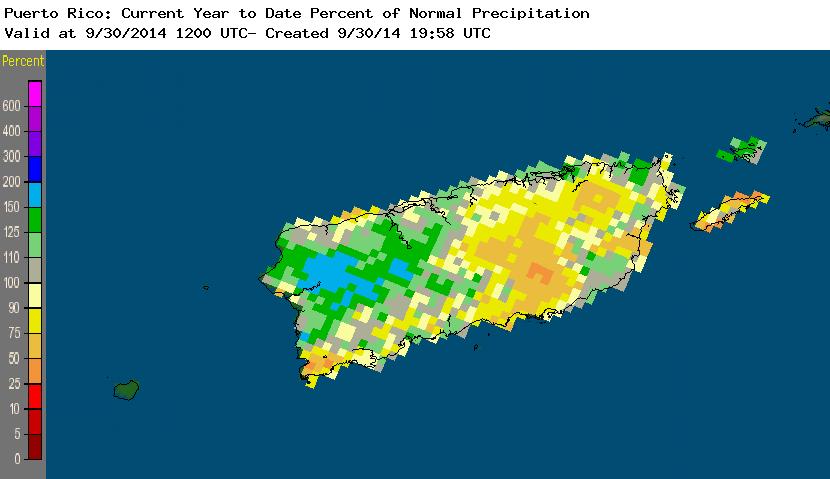
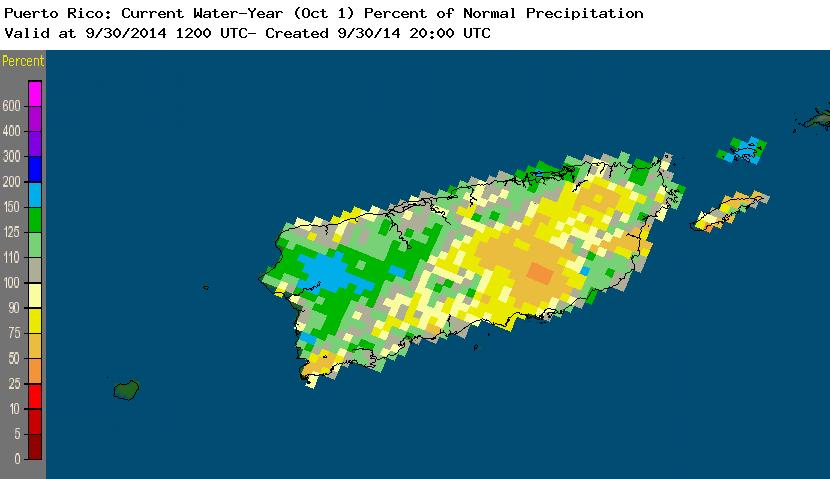
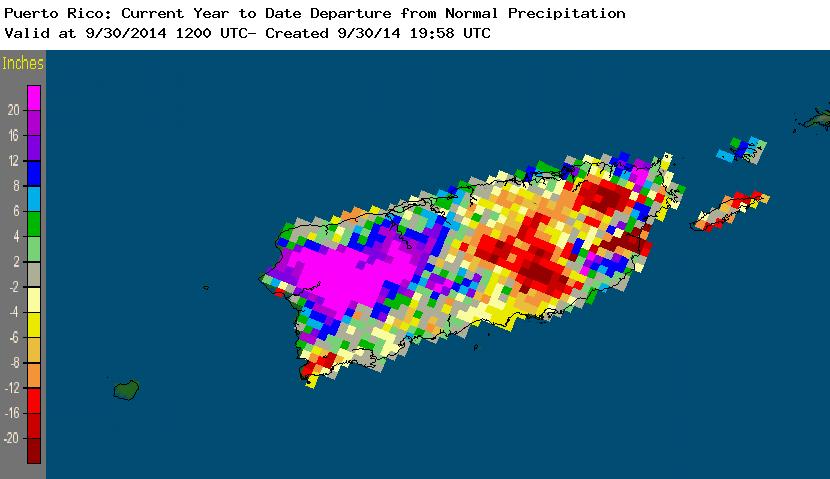
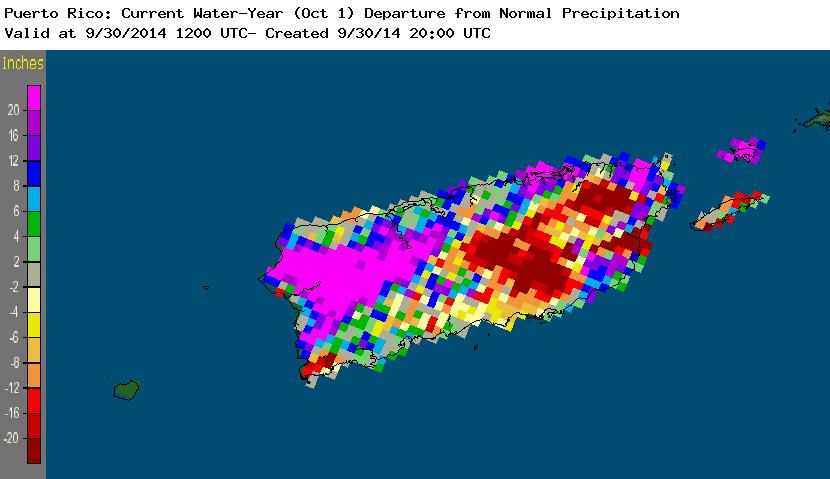
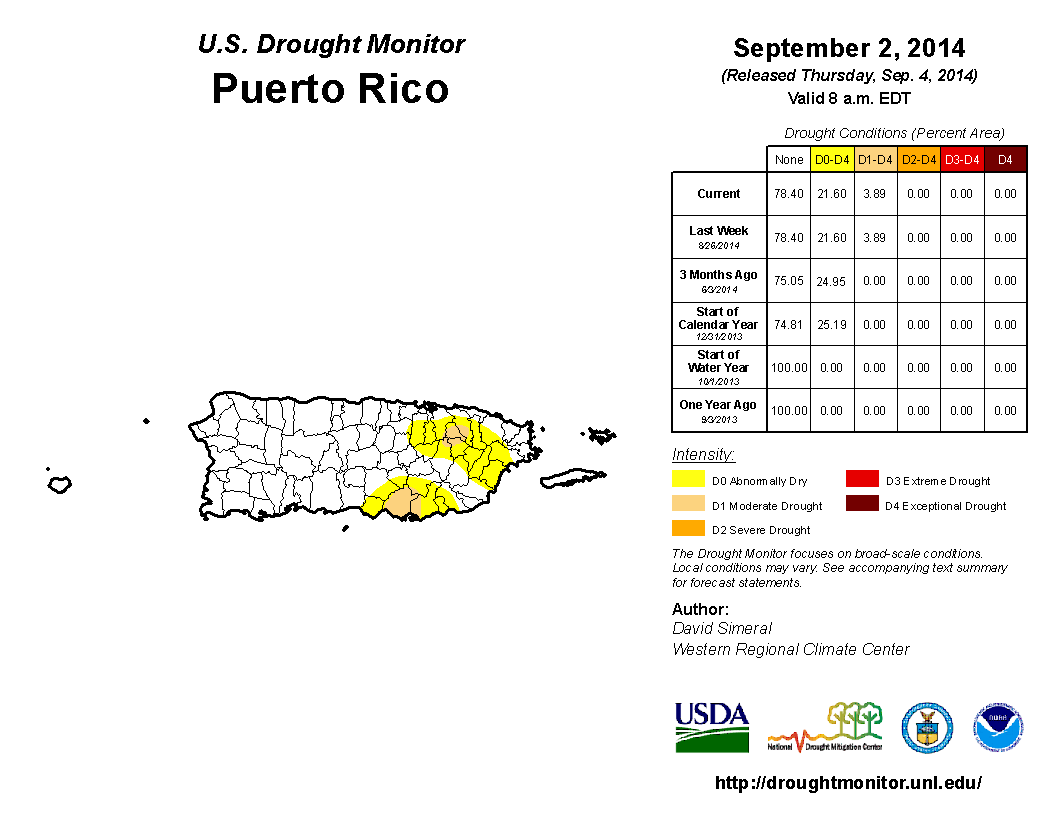
Puerto Rico: September was drier than normal for the southwest to south central portions of the island and near to wetter than normal for the north and east. Tropical rains in August gave Puerto Rico a wetter-than-normal pattern for the last 2 to 3 months, but dryness in the south central to northeast areas re-asserted itself at the longer time scales (last 6, 9, and 12 months). Rainfall deficits in excess of 12 inches were widespread for the last 9 months, and in excess of 20 inches were common for the last 12 months. On the September 30th USDM map, about 3 percent of the island was in moderate drought and 19 percent abnormally dry, which are decreases compared to a month ago.
 |
|
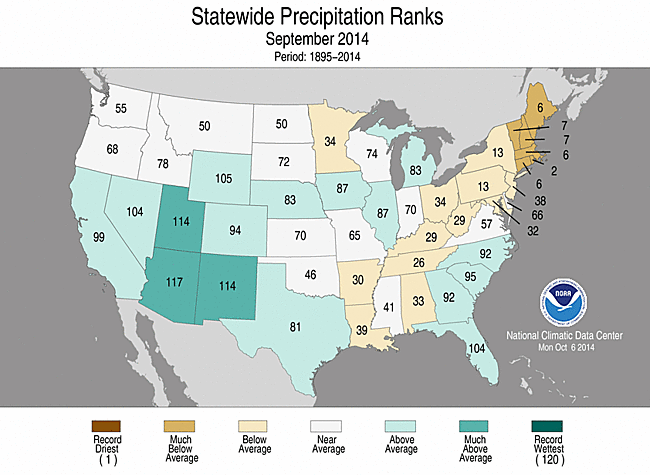
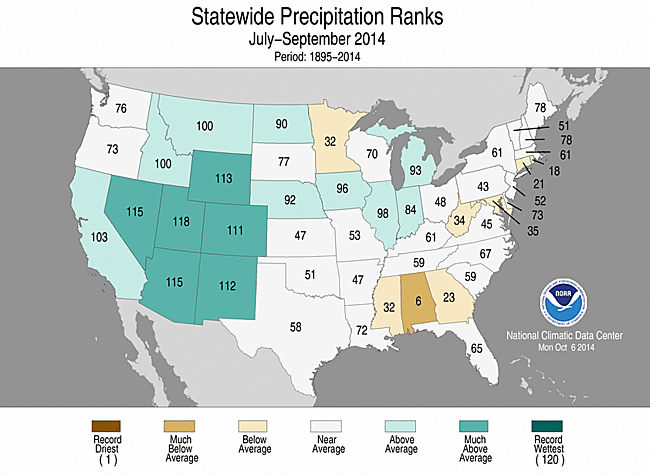
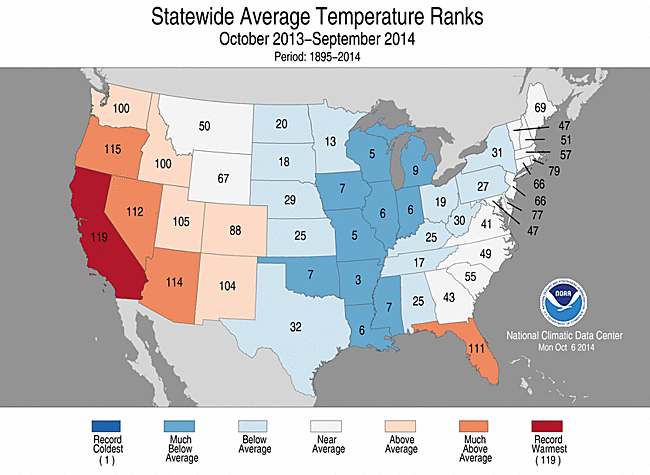
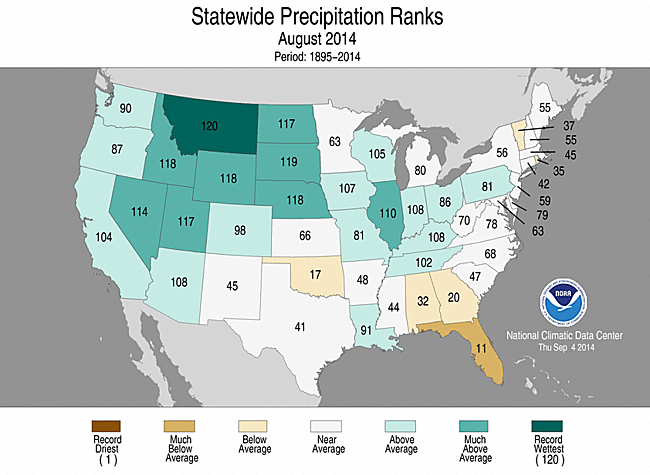
The September precipitation anomaly pattern of dryness in the Northeast and Deep South was reflected in the state ranks, with all of the New England states having the tenth driest, or drier, September in the 1895-2014 record and the rest of the Northeast states (except Delaware) ranking in the driest third of the historical record. For the Northeast region as a whole, September 2014 was the eighth driest September on record. Eight other states in the Midwest and Deep South ranked in the driest third of the historical record. Southern California and much of the Pacific Northwest were also drier than normal, but above-normal precipitation in other parts of California, Oregon, and Idaho gave those states near normal to wetter-than-normal precipitation ranks.
 |
|
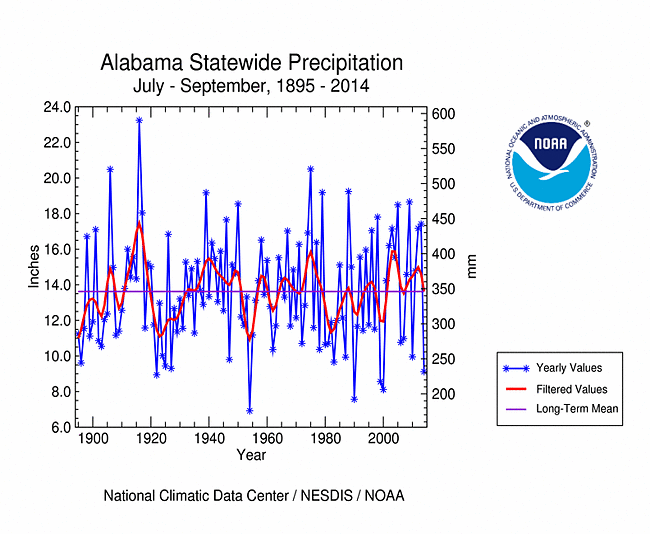
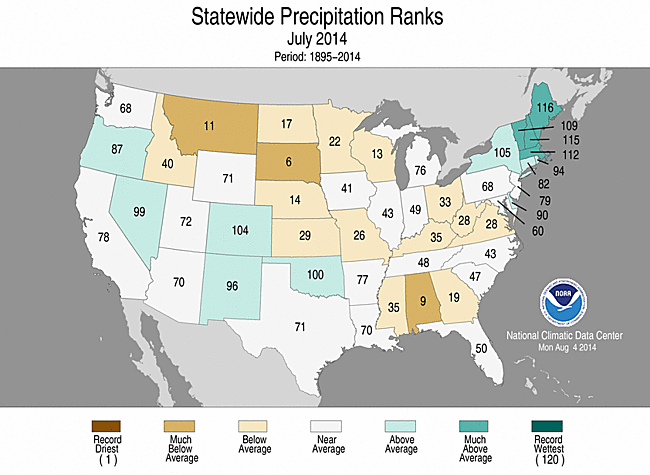
Persistent dryness during the last three months was evident across the Deep South and in parts of the Northwest, Great Plains, Midwest, and Northeast, and in southern California. But localized heavy rains masked the dry signal at the state level for many of these areas. Three states in the Deep South, two in the Mid-Atlantic, two in New England, and one in the Upper Midwest had precipitation ranks for July-September 2014 in the driest third of the historical record. These included Alabama which had their sixth driest July-September in the 1895-2014 record.
 |
|
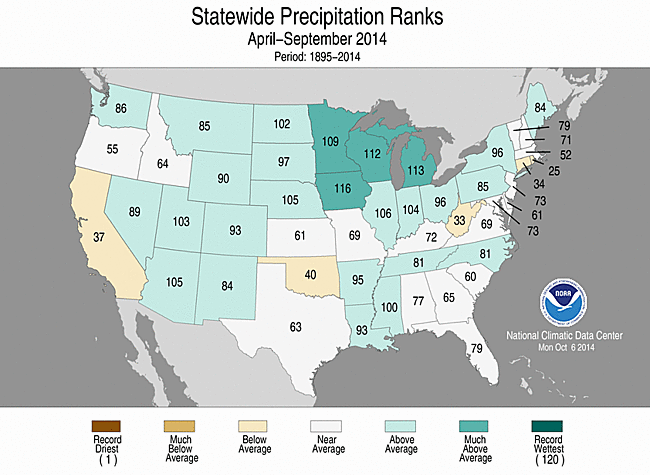
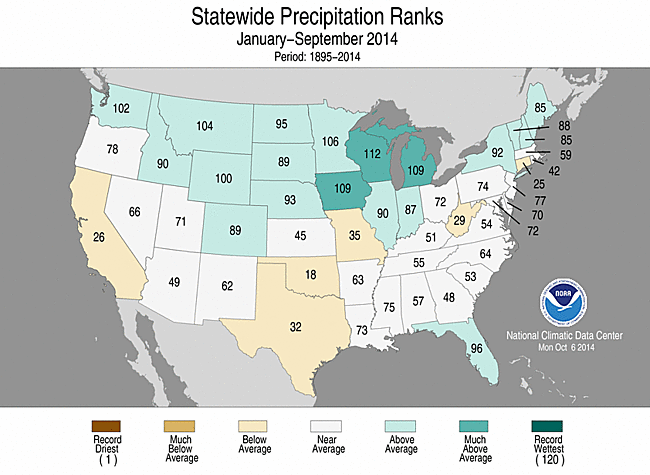
For the longer time scales, as well, a mixed precipitation anomaly pattern masked the dryness at the state level for most states. Severe dryness occurred across most of California and parts of the Pacific Northwest, Southwest, and Central to Southern Plains for April-September 2014, but the state ranks did not reflect this due to local areas of above-normal precipitation, with only five states ranking in the driest third of the historical record. Likewise for the year-to-date. Six states ranked in the driest third of the historical record for January-September 2014, including California and states in the very dry Southern Plains, but none ranked tenth driest or drier. In fact, the wet monsoon season gave Arizona and New Mexico April-September state ranks in the wettest third of the historical record in spite of several areas within each state having very dry six-month periods.
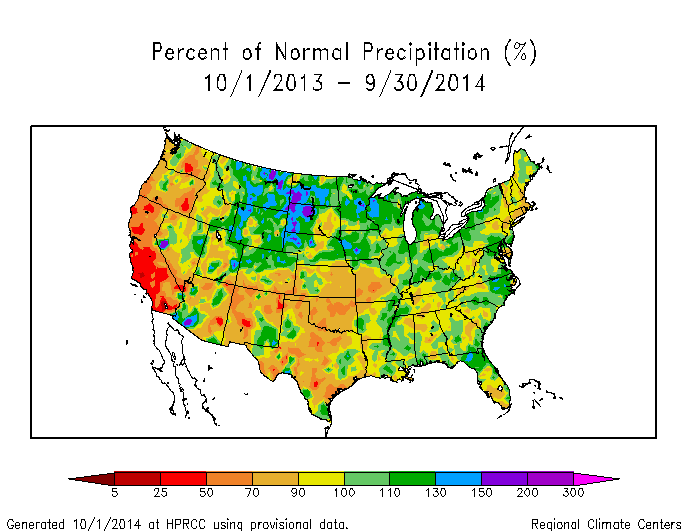
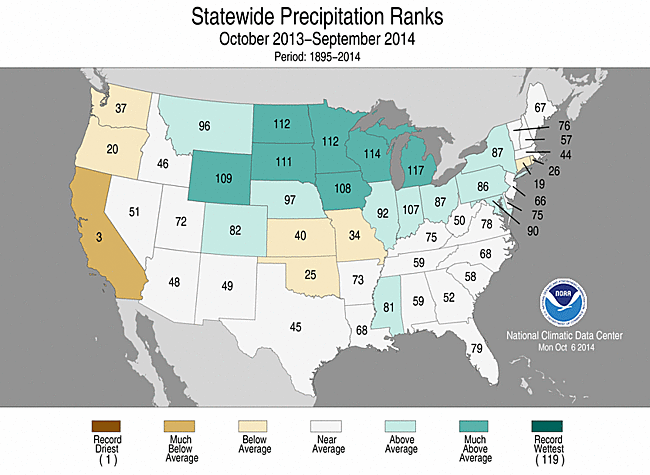
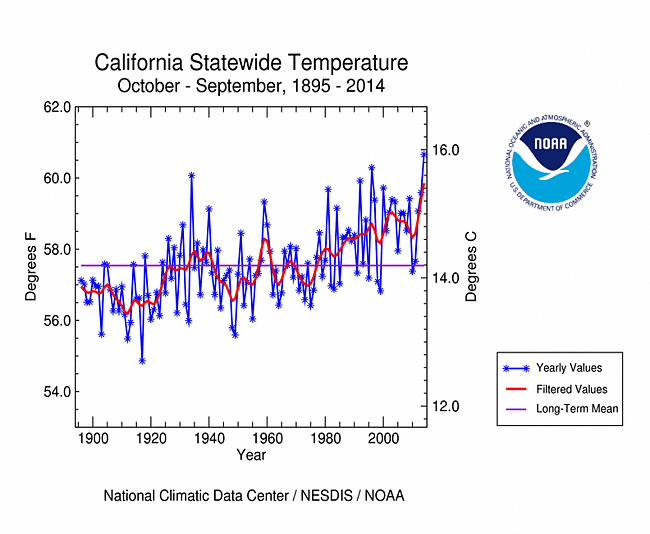
For the last twelve months (October 2013-September 2014), dryness dominated much of the West and the Southern Plains to Midwest, and southern New England, with pockets of wetness in most of the dry areas. California was especially hard hit, having the hottest and third driest October-September on record. Only 1923-24 (driest) and 1976-77 (second driest) had a drier October-September in California. Seven other states ranked in the driest third of the historical record for the 12-month period, including Oregon and Washington in the Pacific Northwest; Oklahoma, Kansas, and Missouri in the Plains to Midwest; and Connecticut and Rhode Island in southern New England.
Standardized Precipitation Evapotranspiration Index:
The SPI measures water supply (precipitation), while the SPEI (Standardized Precipitation Evapotranspiration Index) measures the combination of water supply (precipitation) and water demand (evapotranspiration as computed from temperature). Warmer temperatures tend to increase evapotranspiration, which generally makes droughts more intense.
 |
 |
A circulation pattern with an intense long-wave ridge in the upper atmosphere, entrenched over the West, and an associated cool trough over the eastern CONUS, has persisted for much of the last one to two years. Unusually warm temperatures have been associated with the ridge, which has intensified evapotranspiration and resulted in more severe drought in the West as measured by the SPEI (last 1, 3, 6, 9, 12, 24, 36, 48 months) when compared to the SPI (last 1, 3, 6, 9, 12, 24, 36, 48 months). This is evident at all time scales. Conversely, the unusually colder-than-normal temperatures underneath an upper-level long-wave trough east of the Rockies reduced the severity of drought in the Midwest as seen by less severe SPEI values when compared to SPI values.
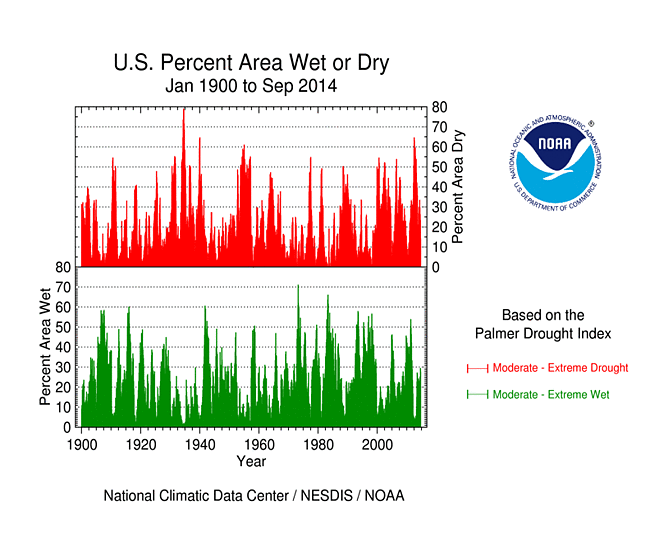
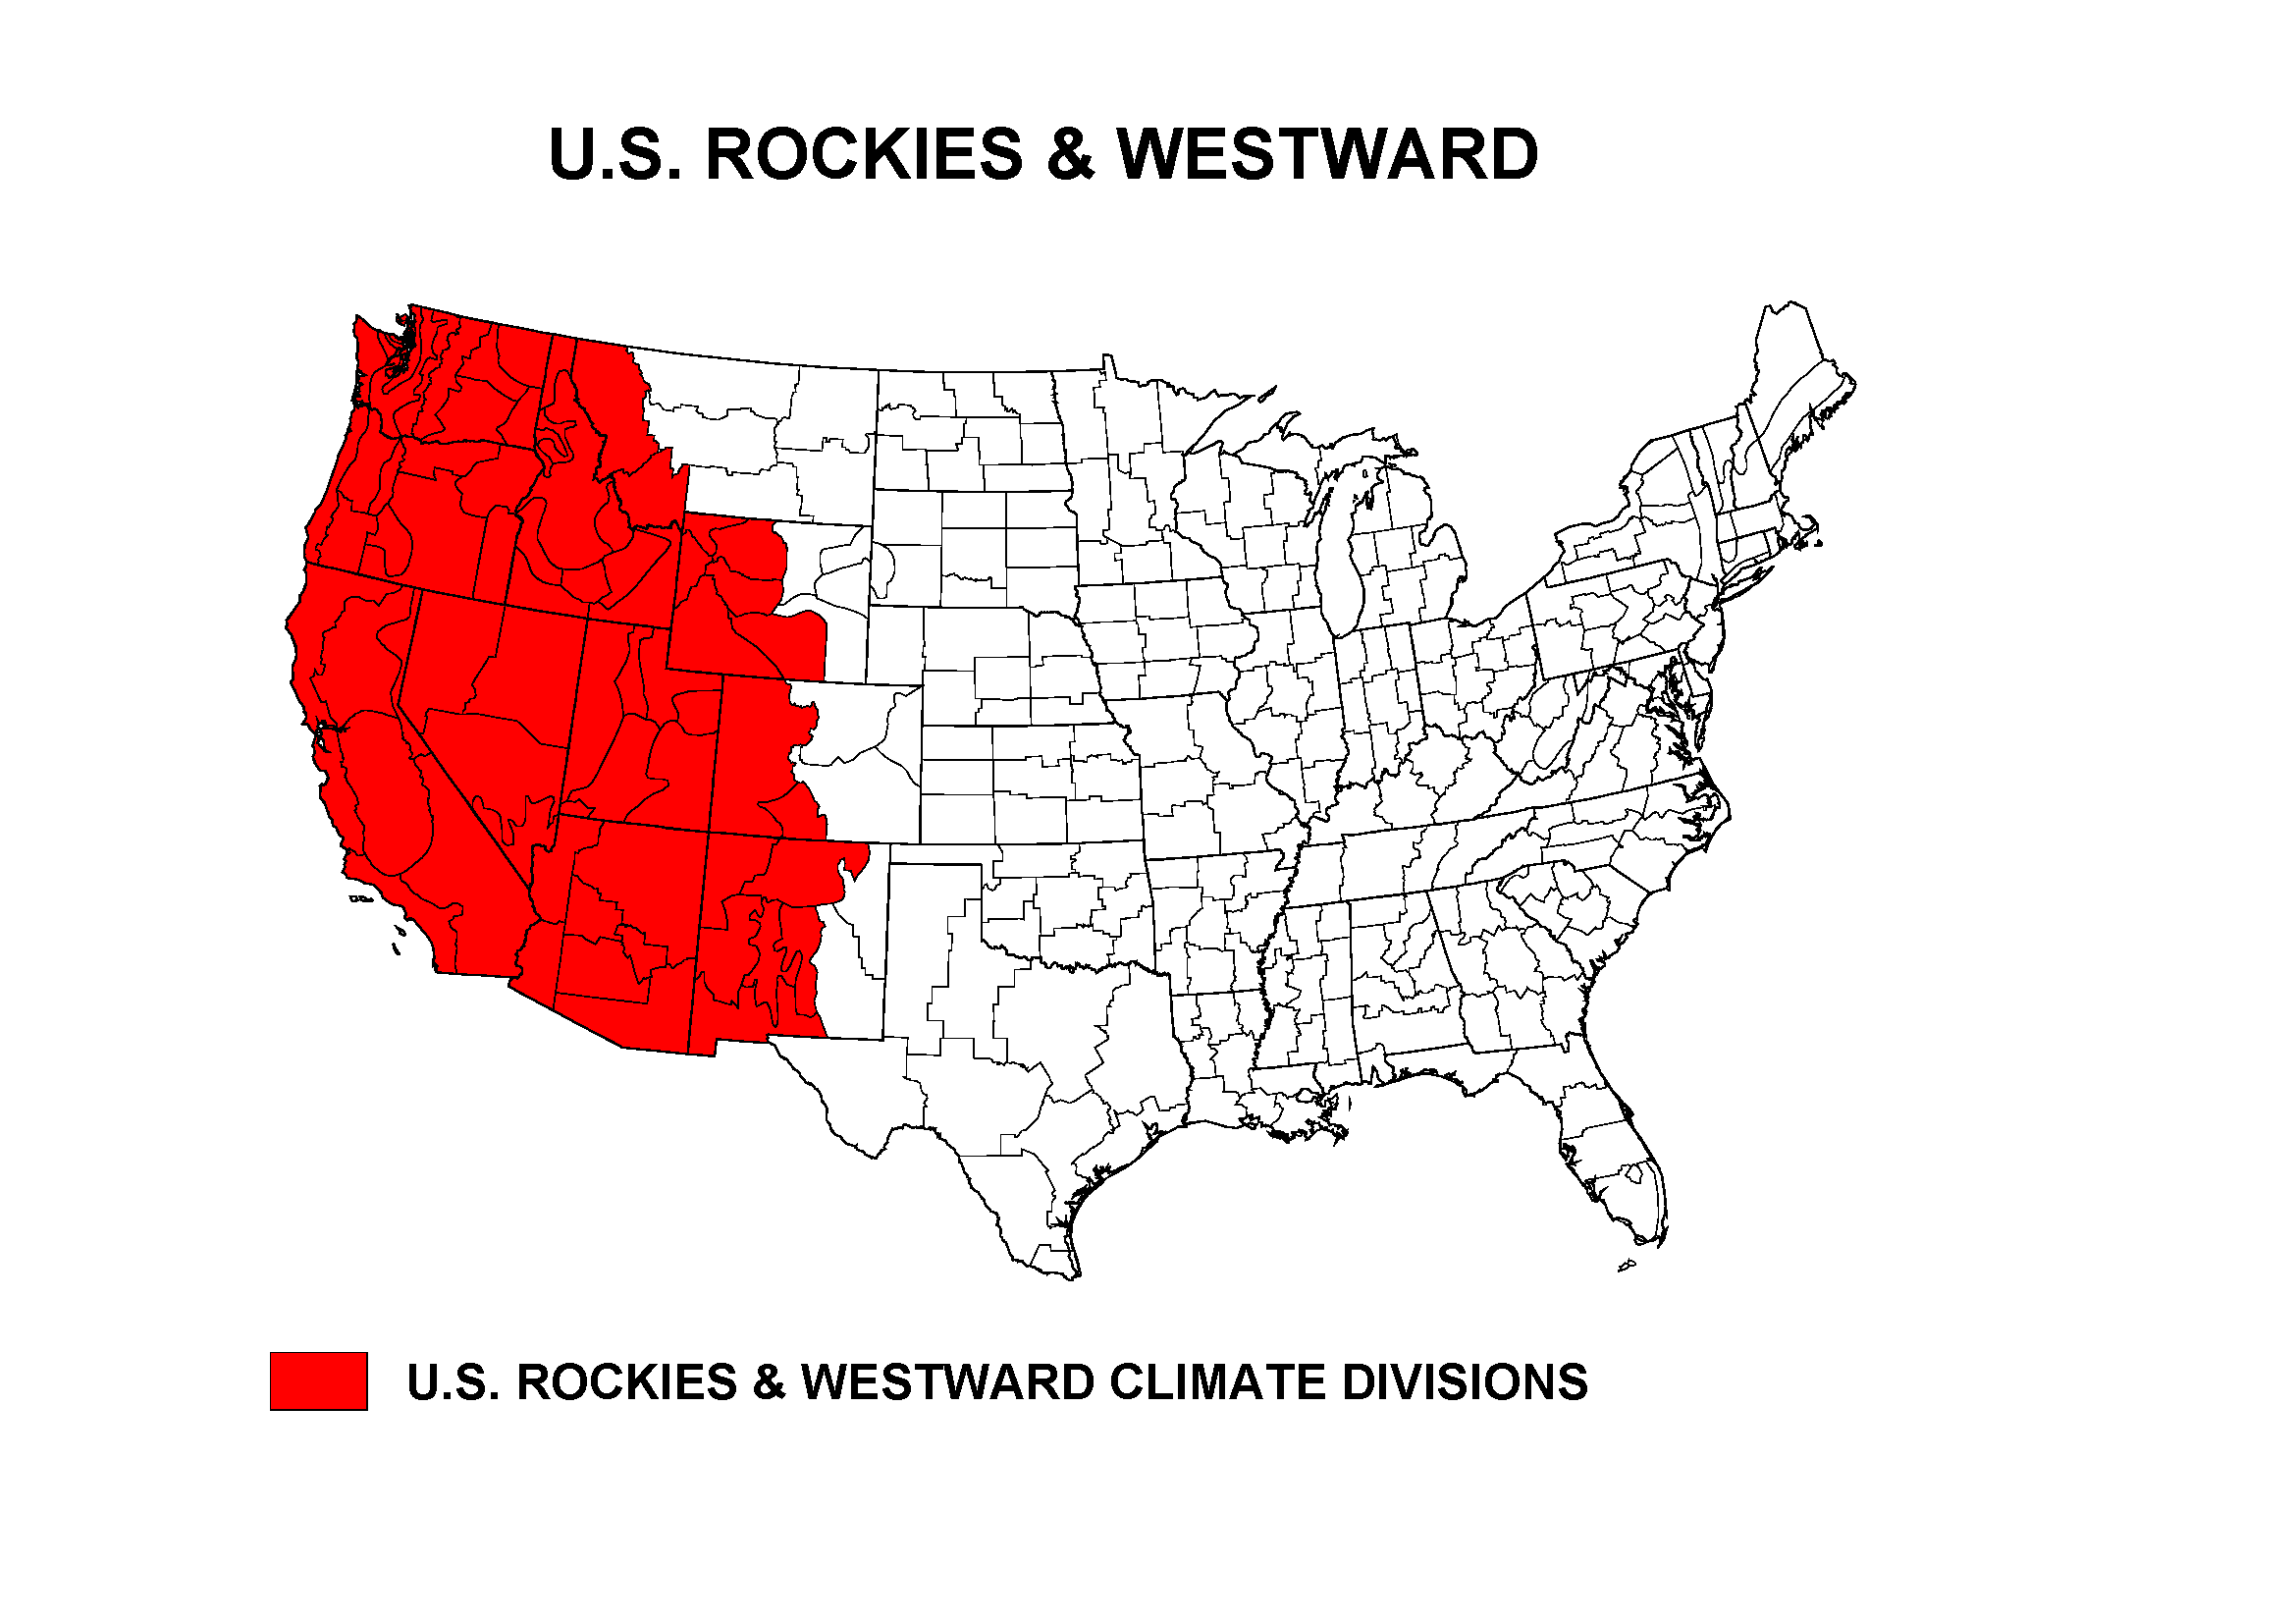
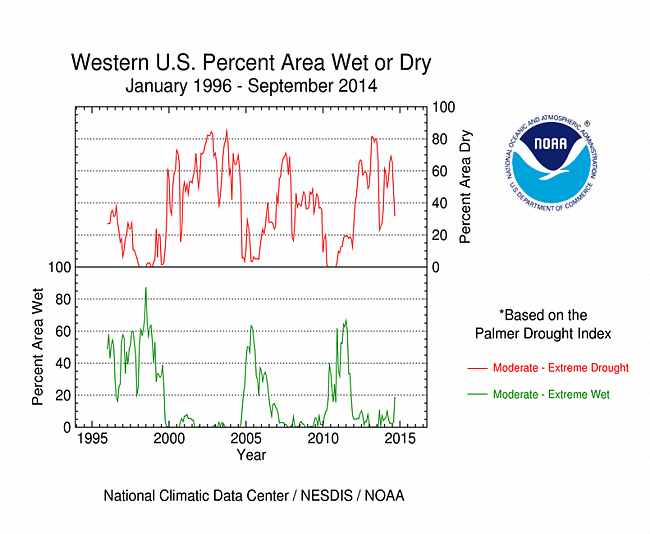
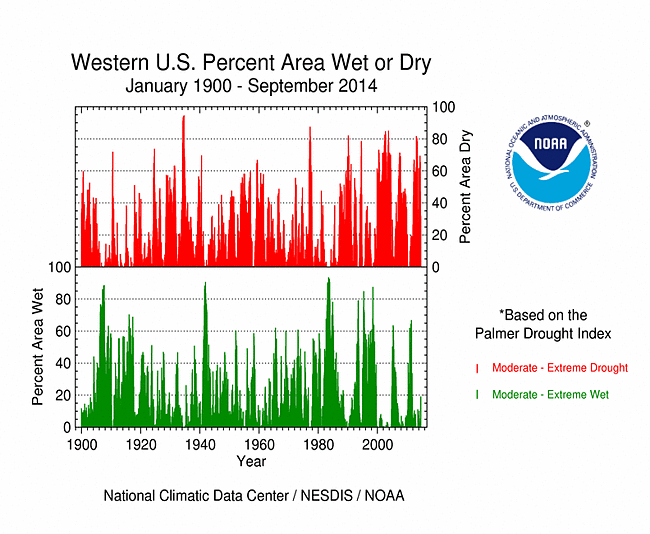 Percent area of the Western U.S. in moderate to extreme drought, January 1900 to present, based on the Palmer Drought Index. As noted above, dry weather has dominated the West for much of the last several months, resulting in significant hydrological (low lake, reservoir, and stream levels) and agricultural impacts. According to the USDM, 55.6 percent of the West was experiencing moderate to exceptional drought at the end of September, which is about two percent less than the previous month. The Palmer Drought Index percent area statistic for the West was 31.7 percent, a decrease of about 15 percentage points from the previous month. |
|
|
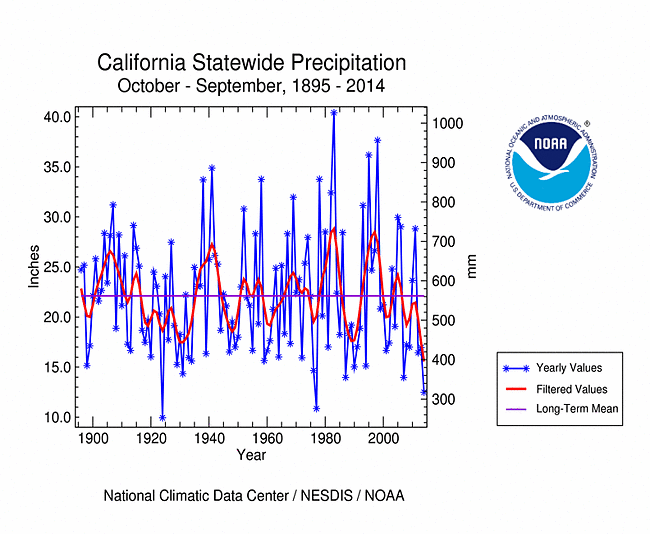
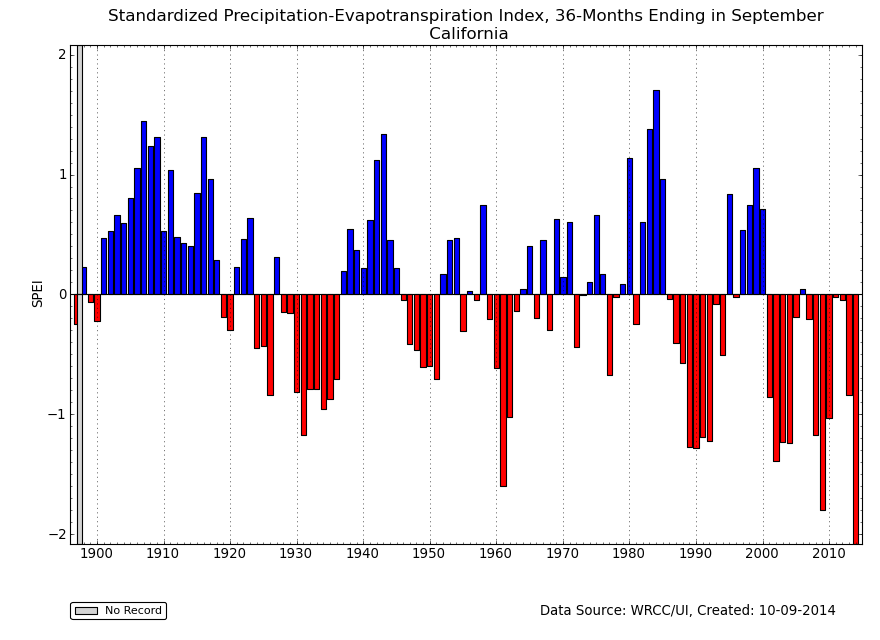
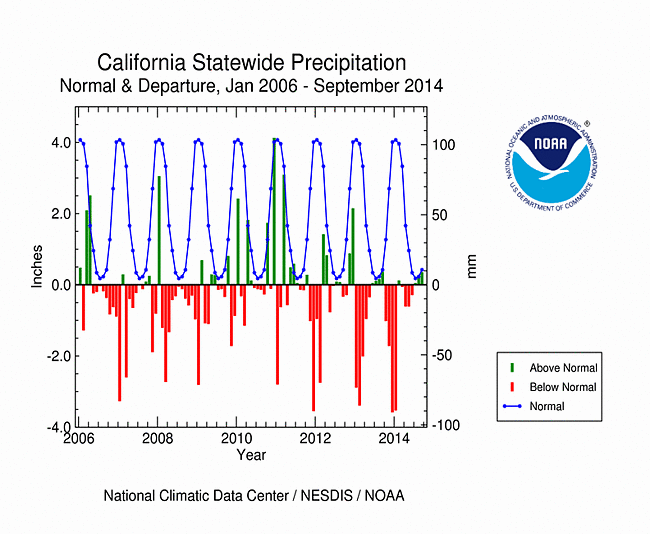
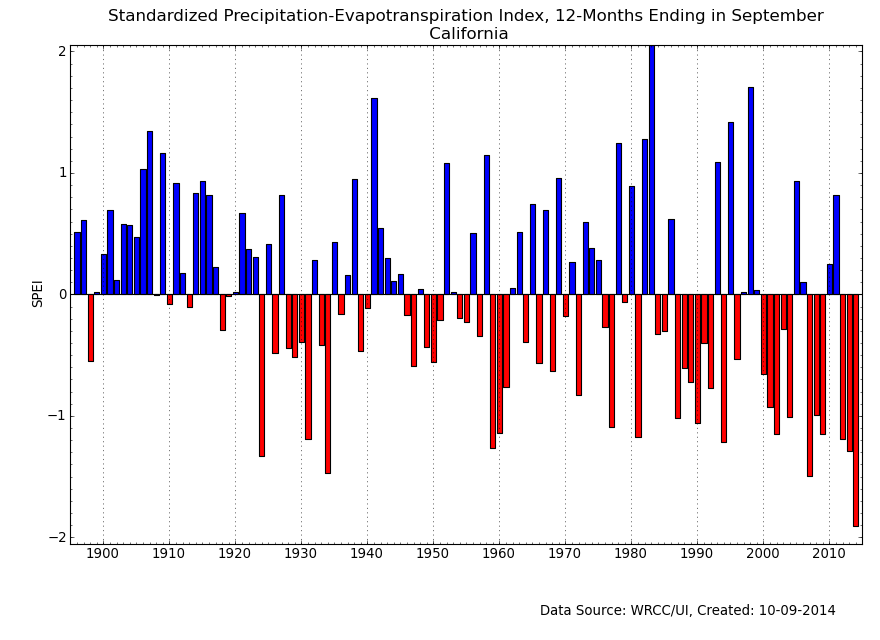
August and September 2014 have been wetter than normal for parts of California, giving the state precipitation ranks that were in the wet third of the historical record (August, September), and July was near normal. July-September 2014 ranked as the 18th wettest July-September. But California has a strong seasonal variation in precipitation, with the summer accounting for very little of the annual total. A September departure from normal of +0.5 inch is miniscule compared to an average monthly total of 4.0 inches during each of the winter months December-February. Consequently, above-normal precipitation is needed during the winter wet season in order for the state to recover from this drought. When the third driest October-September on record is combined with increased evapotranspiration resulting from the hottest October-September on record, the resulting 12-month SPEI for the state breaks all records. With the unusually hot and dry conditions continuing for three consecutive years, the 36-month SPEI for the state is also a record.
|
|
|
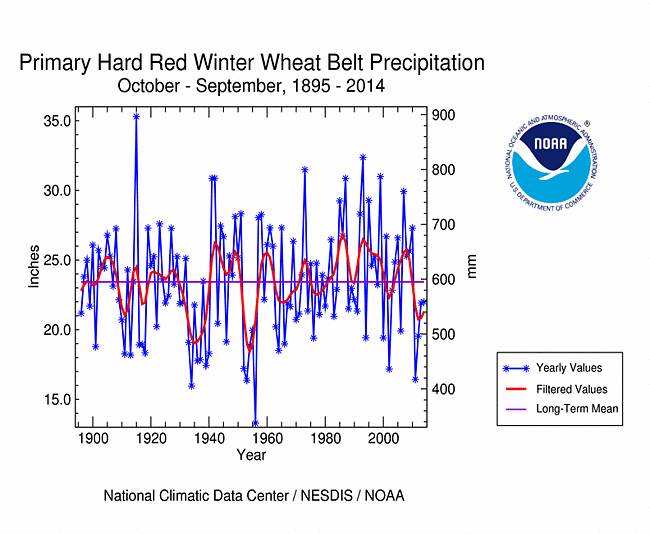 |
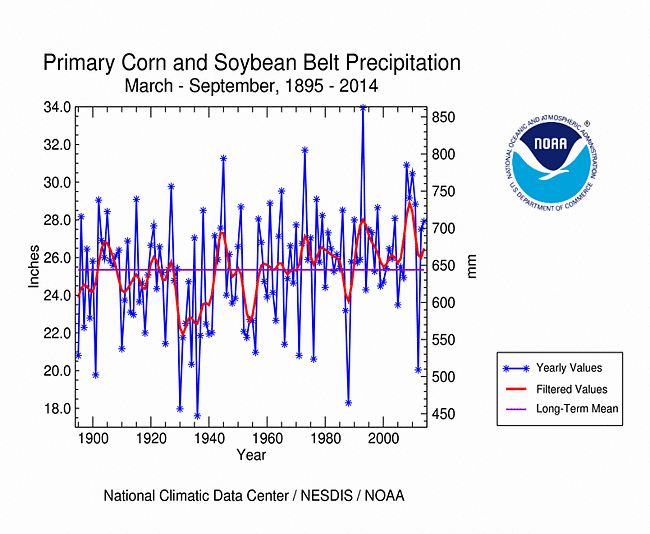
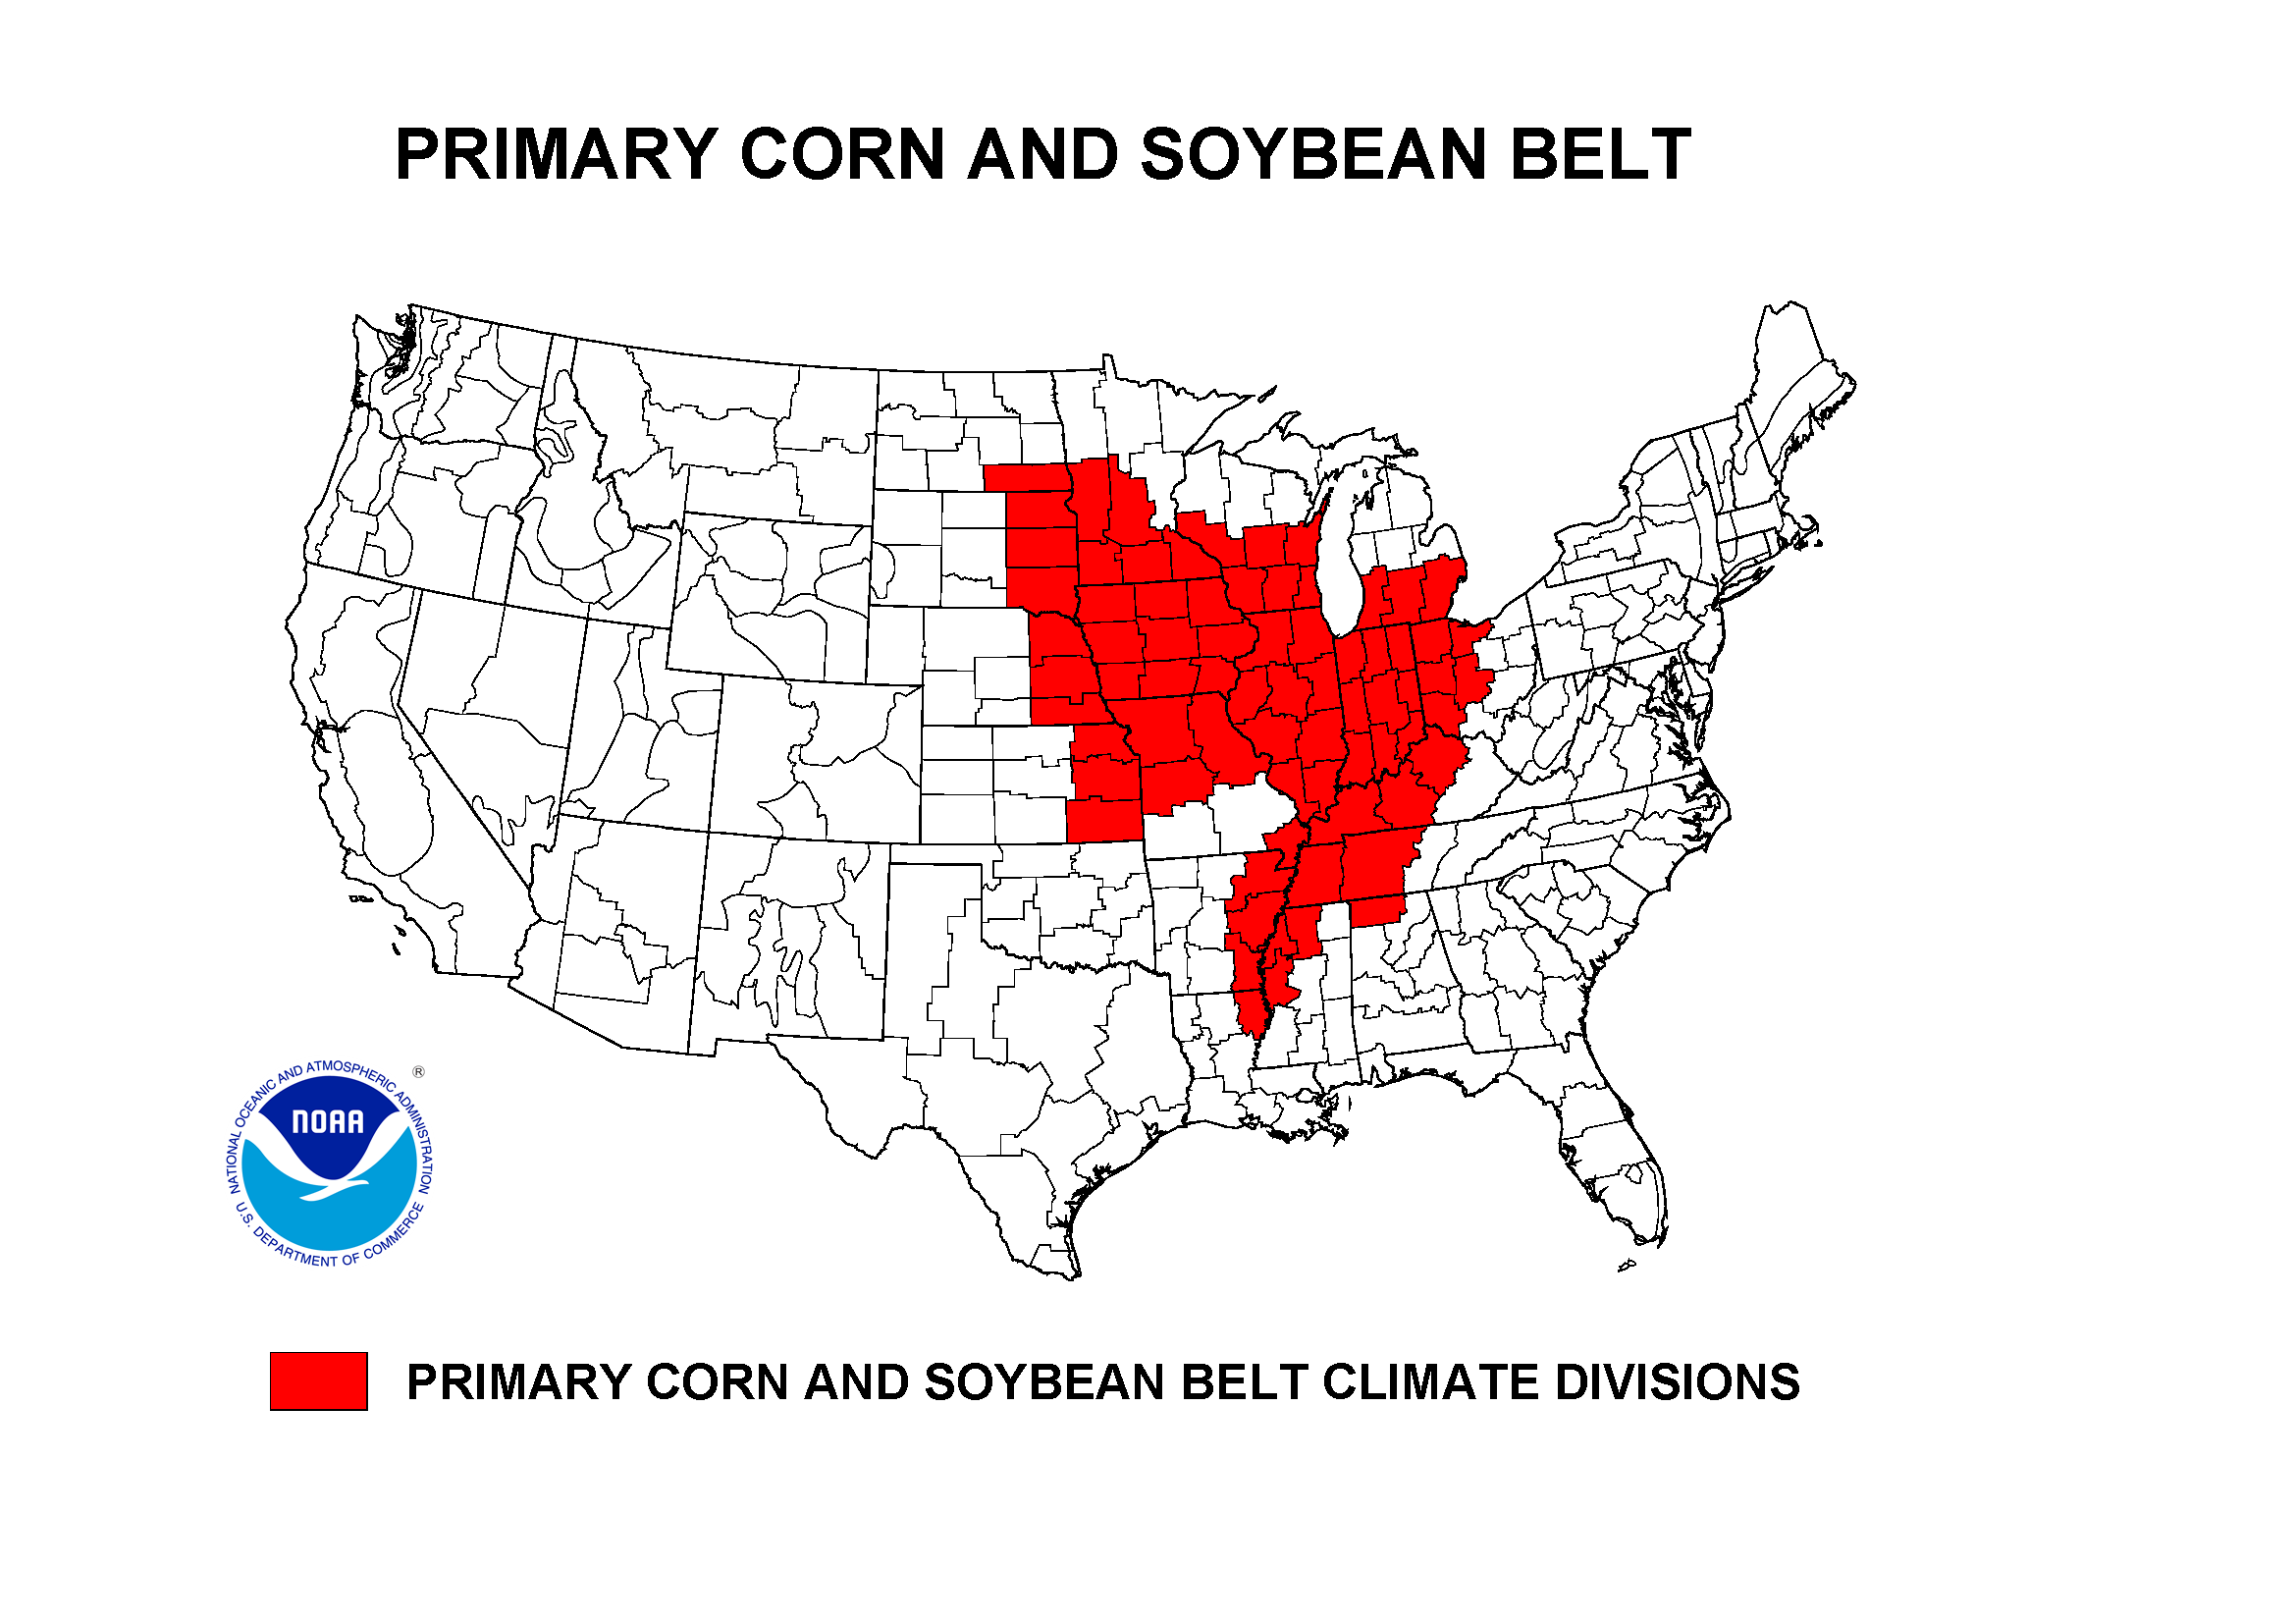
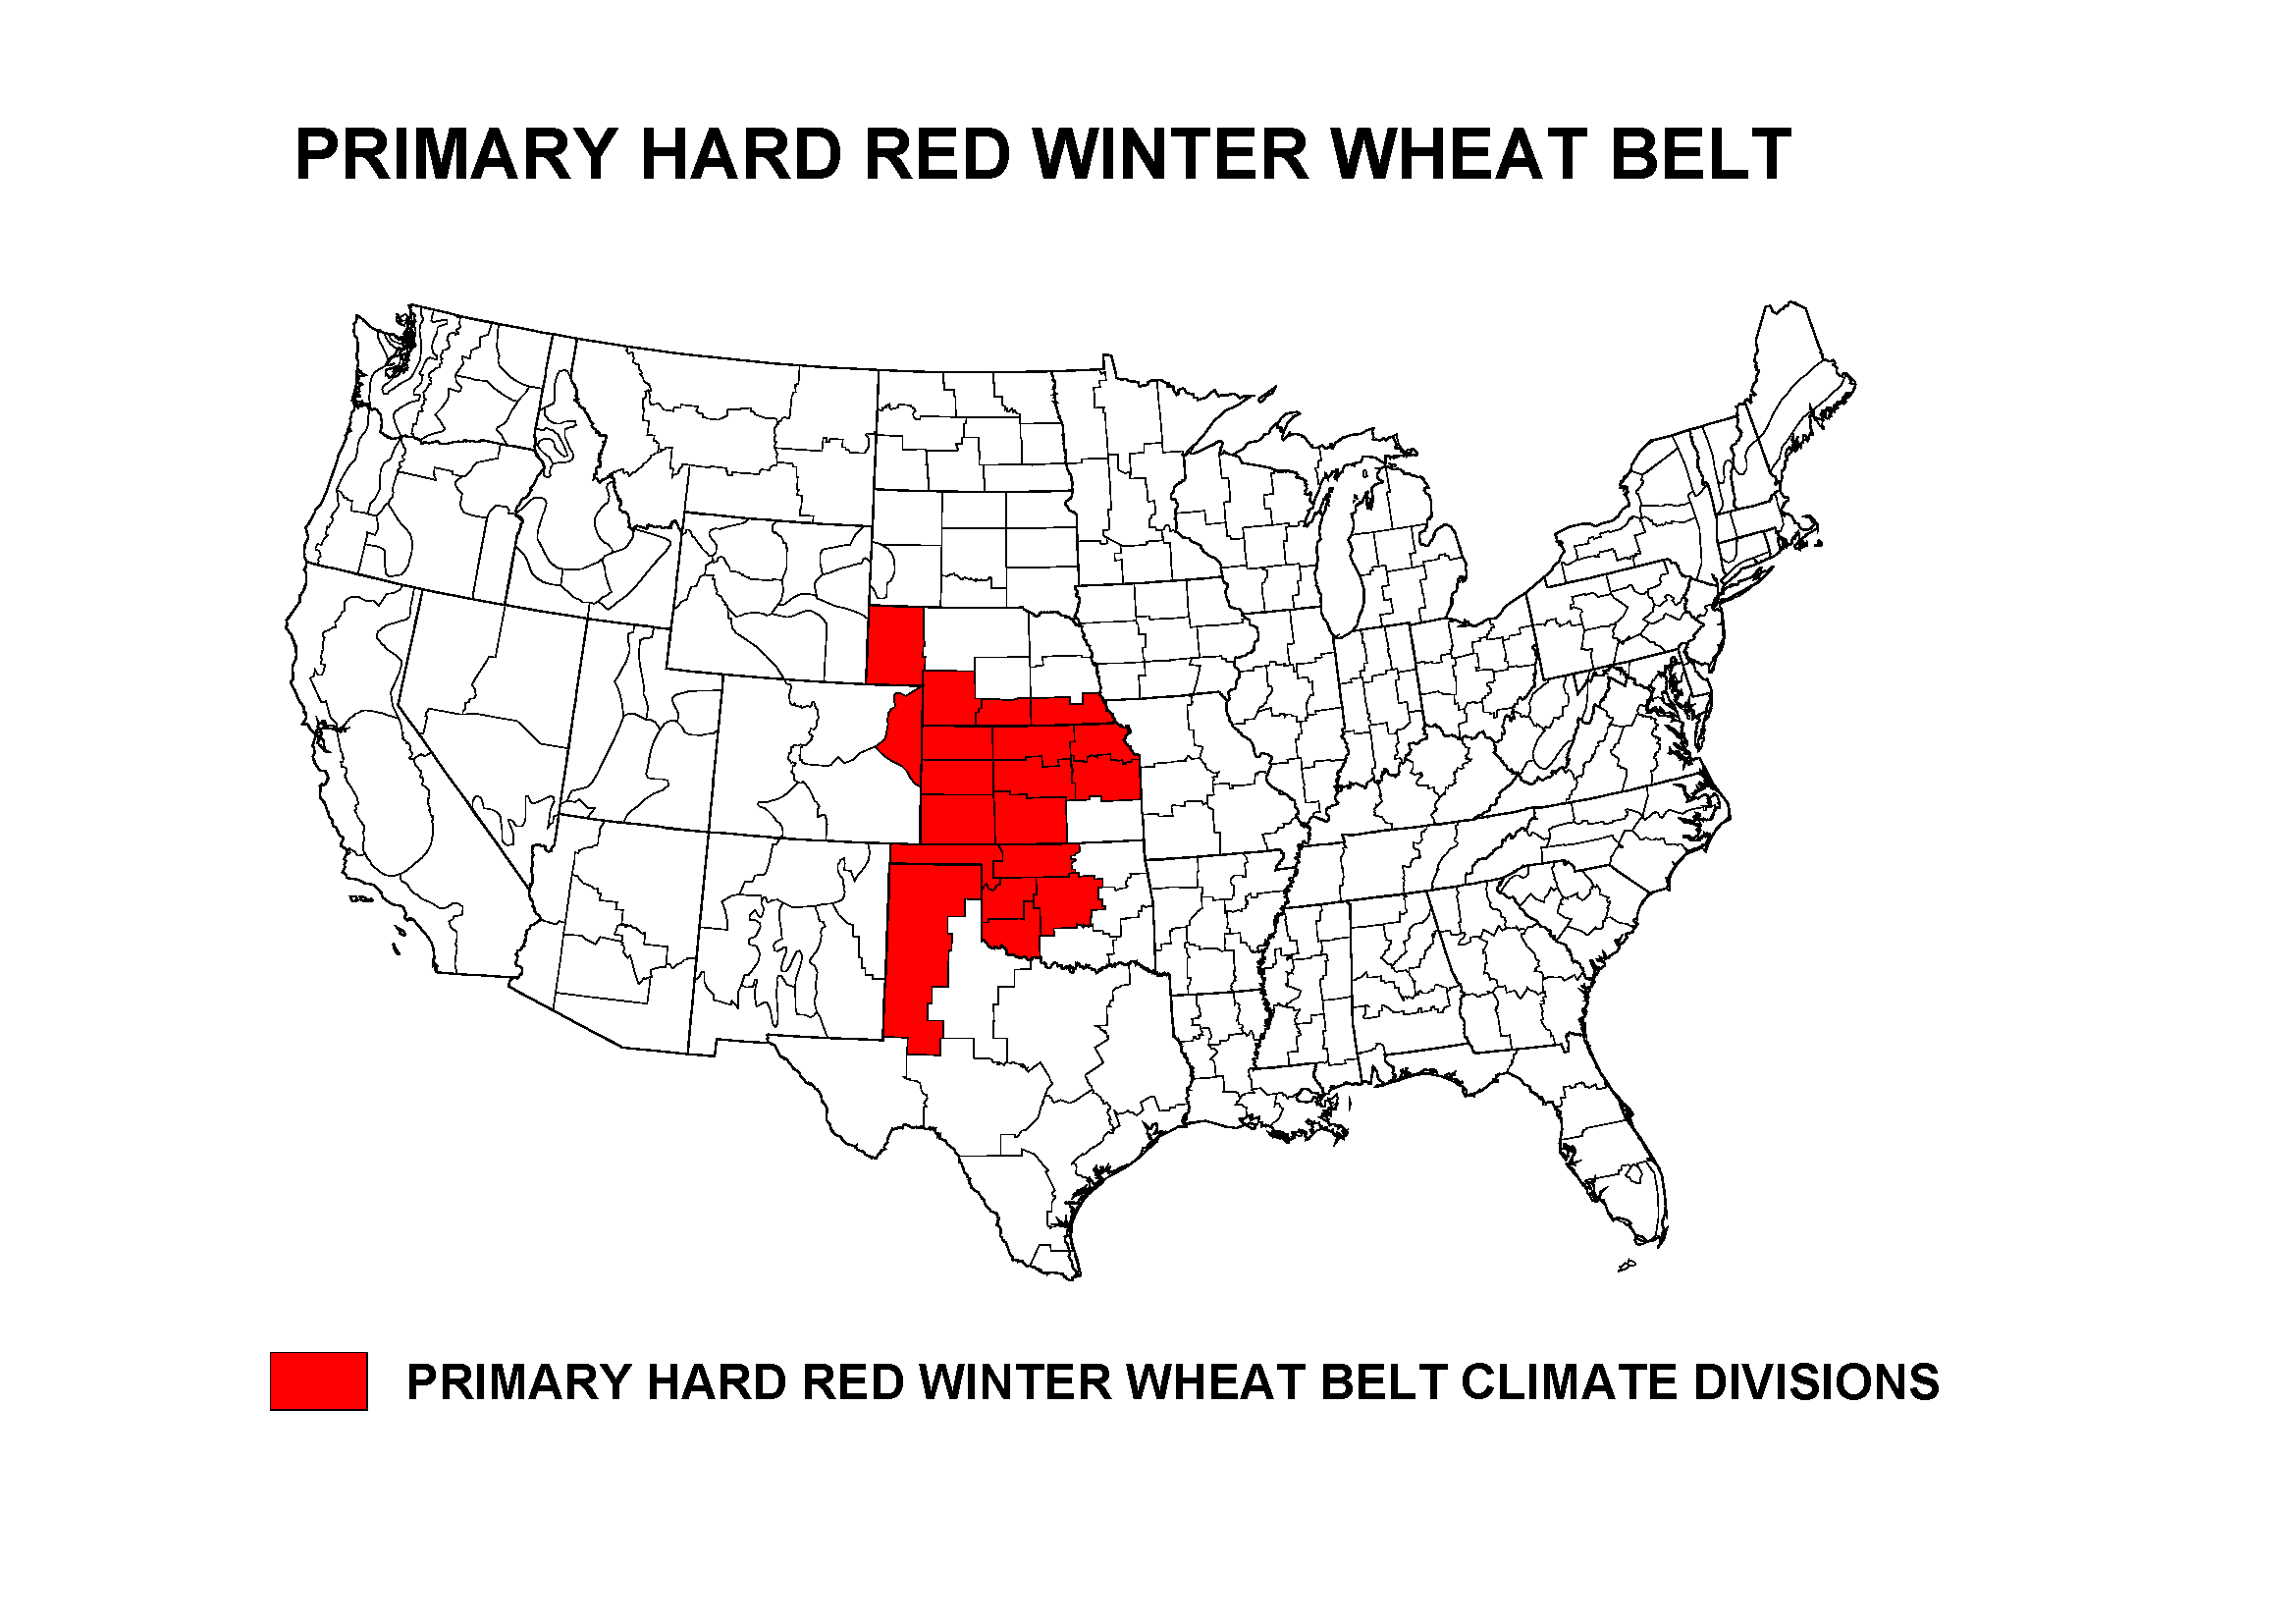
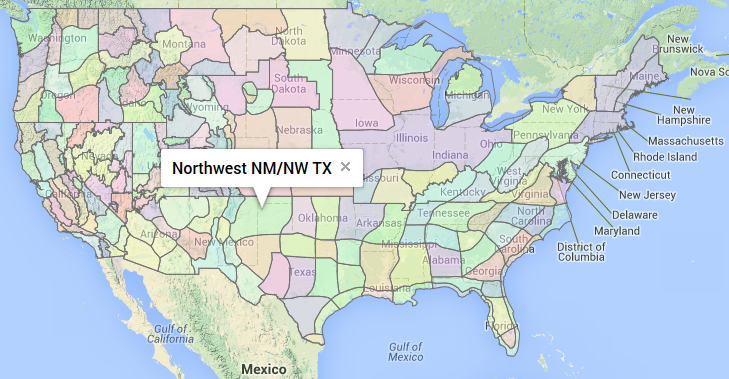
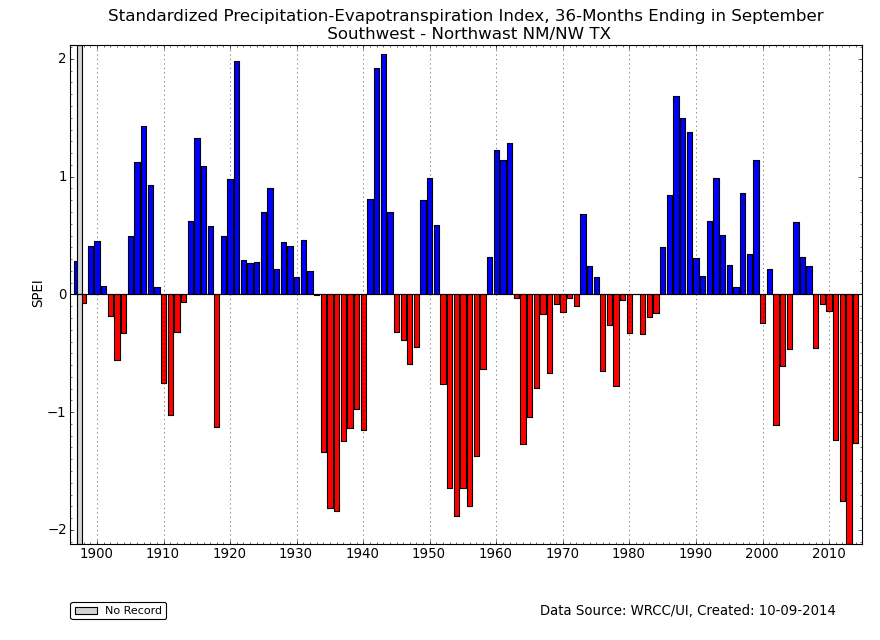
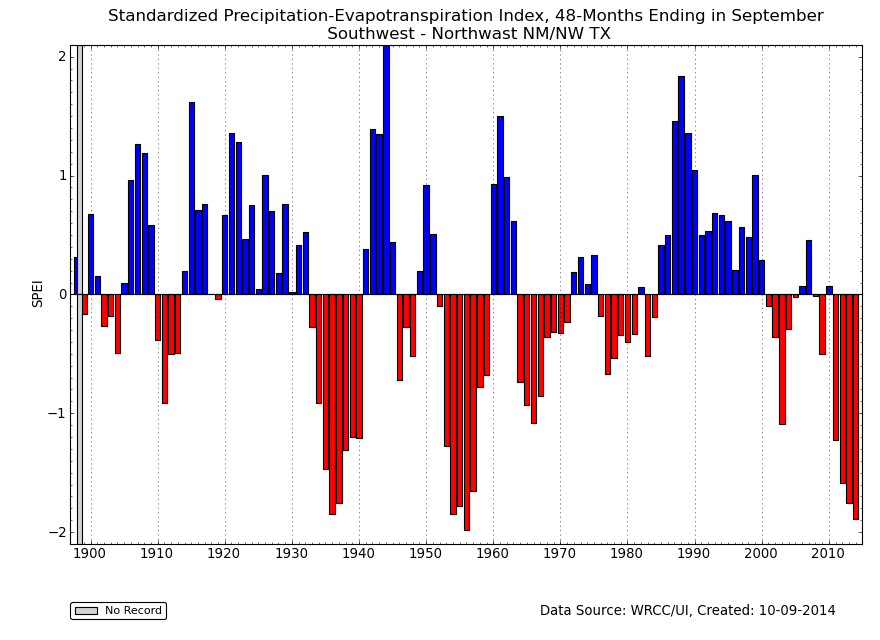
The growing season for the Primary Corn and Soybean agricultural belt has alternated between wetter-than-normal and drier-than-normal months. September 2014 was near normal, ranking as the 53rd driest and 48th warmest September. The growing season (March-September 2014) ranked as the 24th wettest and 25th coolest March-September. For the Primary Hard Red Winter Wheat agricultural belt, the last 12 months ranked as the 49th driest October-September and marked the fourth consecutive October-September with below-average precipitation. When the unusual dryness and heat of this period for northeast New Mexico and the Texas and Oklahoma panhandles region of the wheat belt are aggregated over the last 36 to 48 months, the SPEI indicates that the drought of the last four years has been as severe as the droughts of the 1930s and 1950s.
NOAA Regional Climate Centers:
A more detailed drought discussion, provided by the NOAA Regional Climate Centers and others, can be found below.
West — Pacific Islands
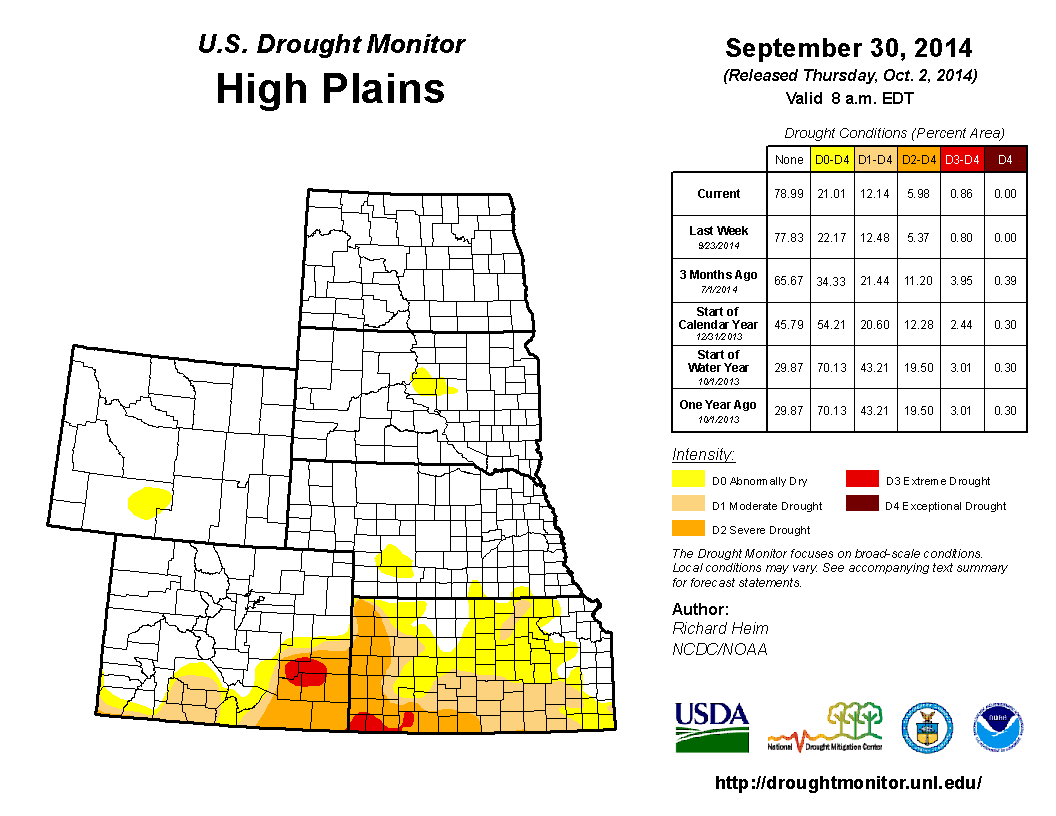
As described by the High Plains Regional Climate Center, September temperatures were largely near normal across the High Plains region, and there were areas of extreme wetness and dryness. A large area of southern North Dakota, central and eastern South Dakota, and isolated pockets throughout the region received at best 50 percent of normal precipitation. Wichita, Kansas was one dry location and only received 0.47 inch (12 mm), or 15 percent of normal precipitation. This ranked as the 6th driest September on record in Wichita. The driest September occurred back in 1956 with 0.03 inch (1 mm) (period of record 1888-2014). Areas receiving over 150 percent of normal precipitation included western Wyoming, central Kansas, parts of eastern Nebraska, and a large swath running from southwestern to northeastern Colorado up through eastern Wyoming, the panhandle of Nebraska, and western South Dakota. The past three months have all ranked in the top 10 for Lincoln, Nebraska with the city having its 7th driest July, 6th wettest August, and 7th wettest September. The heavy precipitation across the region led to much above normal to high flows in the Missouri River Basin. Long-term conditions have also impacted flow in the Basin. For instance, the Black Hills of South Dakota has been experiencing higher flows since the October 2013 blizzard, while lower flows were present along the Republican River, which has been experiencing long-term drought effects. Additionally, increased soil moisture conditions were present across much of Wyoming, the western Dakotas, the panhandle of Nebraska, western and northern Colorado, and eastern Nebraska. Meanwhile, eastern Kansas showed drier conditions.
More improvements were in store this month as heavy rains impacted the High Plains region. The total area in drought (D1-D4) dropped from 21 percent to 12 percent. Nebraska and Wyoming joined the Dakotas as drought-free states in the region. At the end of the month, all drought was confined to Colorado and Kansas; however, there were improvements in both states. Over the past month, Kansas went from 88 percent in drought to 46 percent in drought. The extreme drought conditions (D3) in the northwestern part of the state improved one category and only 2 percent of the state was left with D3. Many improvements were made in northern and eastern areas of the state as well. In Colorado, the main improvement was the removal of moderate drought conditions (D1) in the northwestern portion of the state. Drought in the southeastern part of the state remained about the same, although there were some improvements in the southwest corner of the state.
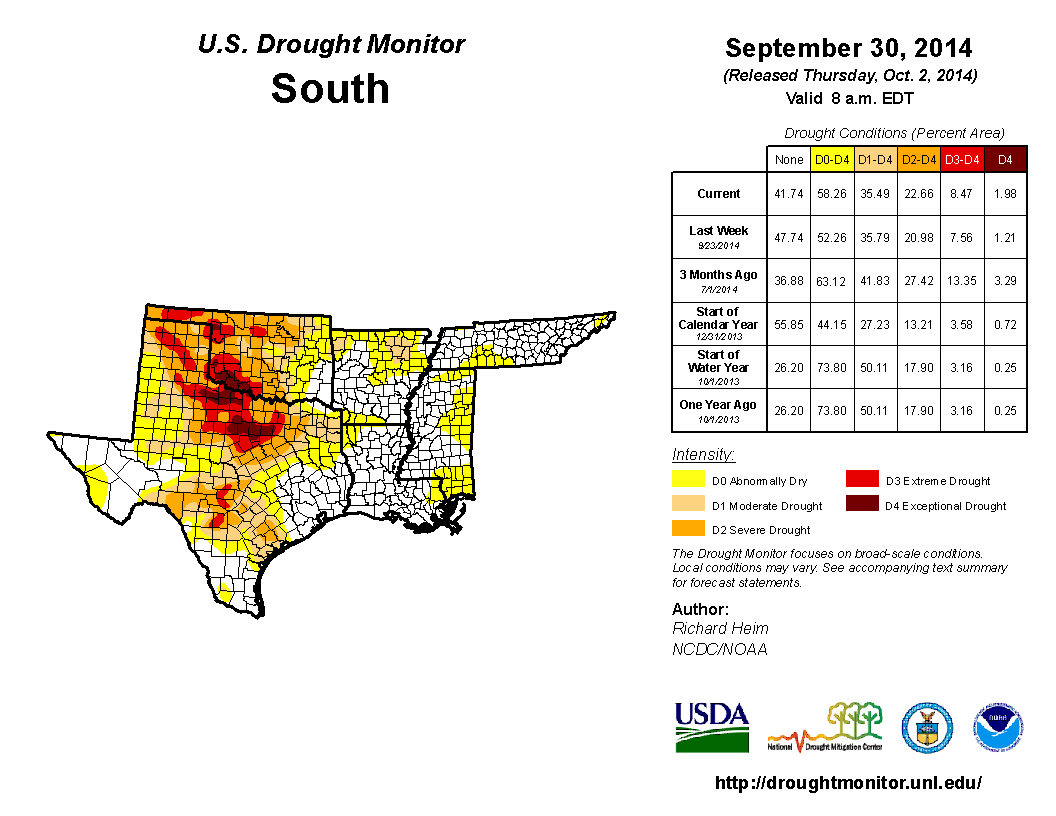
As explained by the Southern Regional Climate Center, September was drier than normal for most of the Southern region, with the exception of western and southern Texas, which saw precipitation totals of over three times the monthly average. Monthly average temperatures did not vary much from normal across the region. Texas was the only state in the region to report a wetter than normal month. For Tennessee, it was the twenty-sixth driest September on record (1895-2014), while Arkansas experienced its thirtieth driest September on record (1895-2014). All other state rankings fell within the middle two quartiles. Drought conditions improved slightly across the Southern region. Texas and Oklahoma are still the only two states exhibiting severe to exceptional drought; however, the areal coverage over the month of September has reduced from roughly 25 percent (of the region) on September 2, 2014, to roughly 22 percent (of the region) on September 30, 2014.
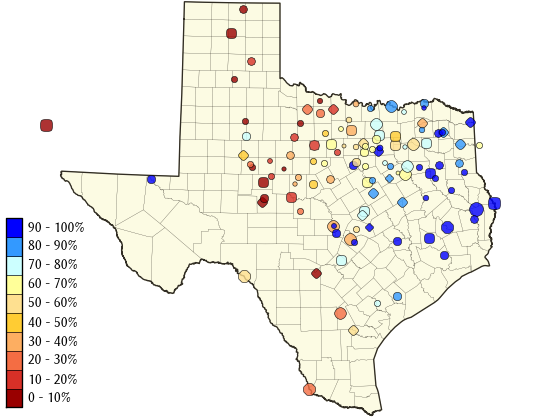
In Texas, September saw improvements to crop moisture and increased crop harvests. Almost all of Texas's crops were at their 5-year average for harvesting by the end of the month, with the exception of peanuts, soybeans, and oats. Corn, cotton, and soybeans are behind their maturation for this time of year as well. Winter wheat is on par in terms of planting and emergence with September 2013 and is ahead of their 5-year average. Rangelands improved somewhat due to the rain, but mostly stayed in the same conditions as August. Beef prices reached another record high this month, which is being credited to the drought both here in Texas and in California (Information provided by the Texas Office of State Climatology). Wet conditions throughout the month led to big improvements to long-standing low reservoirs out west, like Red Bluff Reservoir jumping 50% to its highest level since 1988, being washed out in the statewide average by continually-declining reservoirs in the Metroplex. New and existing plans for dealing with ongoing water supply problems continued to move forward this month. The Lower Colorado River Authority has two plans in place, one for future water release planning where no water will be discharged unless the Highland Lakes are at a combined 50% capacity and one for a new reservoir, the first in decades, costing an estimated $215 million. San Antonio is planning a public-private venture that would add a $3.4 billion pipeline from Burleson County to the city. Raymondville, in an ongoing dispute over water discharge along the Rio Grande, plans to drill for and treat 2 million gallons (7,570,823.5 liters) of groundwater per day in a new well project that's estimated to cost $3.8 million (Information provided by the Texas Office of State Climatology).
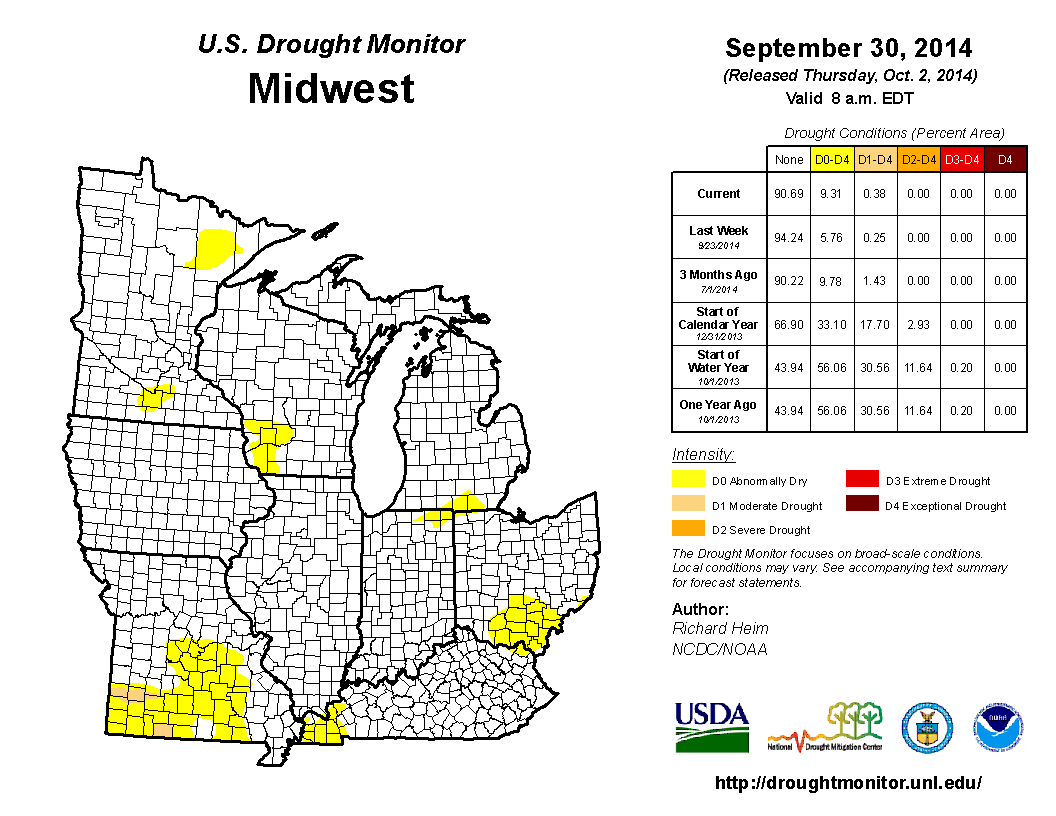
As summarized by the Midwest Regional Climate Center, September temperatures averaged close to normal but were generally cooler than normal in the first half of the month and then warmer than normal in the last week of September. Precipitation varied in both time and location across the Midwest in September. Some large rainfall events affected parts of the region before widespread dryness spread across the Midwest in the latter part of the month. Rainfall totals of up to 150 percent of normal stretched from east central Minnesota to northern Lower Michigan. Another swath of above normal rainfall, nearly 200 percent of normal in central Illinois, stretched from Iowa and northern Missouri to the western shore of Lake Erie. The remaining areas in the region were below normal with some areas in Ohio, Kentucky, and Minnesota reporting less than half of their normal September rainfall totals. Drought was not much of an issue in the Midwest in September. The month began with less than two percent of the region in drought and ended with less than one percent in drought. Harvest was underway in the Midwest with some good and bad news. On the plus side, corn and soybean conditions were reported to be very much skewed towards good and excellent conditions while much less of the crops were in very poor or poor condition. Statewide corn condition ranged from 65 to 86 percent in good or excellent and only 2 to 15 percent in very poor or poor condition. Likewise, statewide soybean condition reported 61 to 78 percent in good to excellent condition while just 4 to 13 percent fell in the very poor or poor categories. Pasture was also in good condition for this time of year. On the negative side, the percentage of corn and soybean crops that had been harvested was behind the 5-year average in all nine Midwest states. First fall freezes were reported scattered across Michigan, Wisconsin, Minnesota, and Iowa between the 11th and 20th of the month.
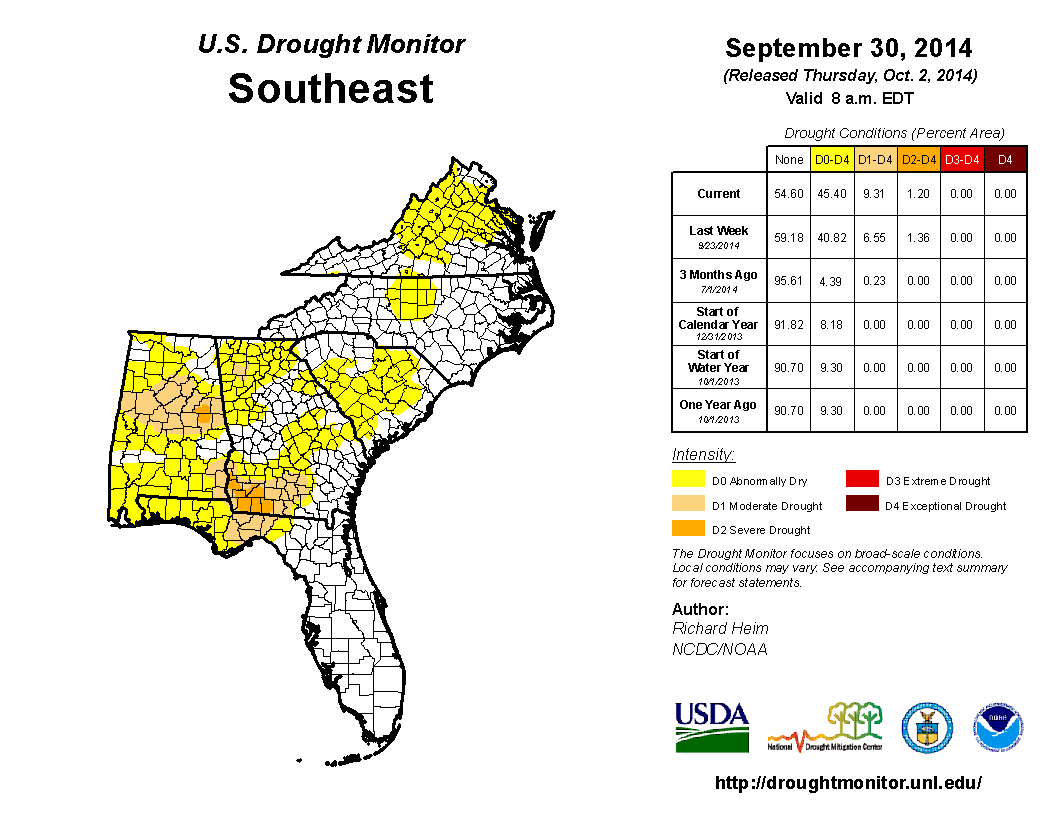
As noted by the Southeast Regional Climate Center, mean temperatures in September were near average across much of the Southeast region as well as Puerto Rico and the U.S. Virgin Islands. Similar to August, precipitation was highly variable across the Southeast during the month of September. The driest locations were found across southern Florida, central and northern Alabama, northwestern Georgia, and central Virginia. Central and northern Alabama was especially dry, with Montgomery (1948-2014) and Huntsville (1937-2014) recording only 0.62 and 0.49 inch (15.7 and 12.4 mm) of precipitation, which was about 15 and 13 percent of normal during September, respectively. In contrast, the wettest locations were found across central Florida, southwestern Georgia, and coastal portions of the Carolinas and Virginia. Several frontal boundaries stalled off of the Atlantic coast during month, and, as a result, various coastal locations recorded an unusually high frequency of days with measureable precipitation. The total monthly precipitation of 6.44 inches (164 mm) was near average for San Juan, PR (1898-2014). The Virgin Islands were exceptionally dry, with St. Thomas (1953-2014) recording only 1.75 inches (44.5 mm) of precipitation, which is about 30 percent of normal for September.
Little change in drought conditions was noted for the Southeast region during September. While approximately 91 percent of the region remained drought-free (less than D1), there were minor changes in drought conditions on a more localized scale, particularly in central Alabama and southwestern Georgia. Areas of moderate drought (D1) expanded substantially across central Alabama, and severe drought (D2) conditions were introduced in Clay and Tallapoosa Counties in the east-central part of the state. Overall, areas of moderate drought (D1) or greater in Alabama increased in coverage from 10 percent on the 2nd to 27 percent on the 30th. Conversely, the areal coverage of moderate-to-severe drought (D1-D2) conditions in southwestern Georgia decreased in coverage. However, rainfall near the end of the month in this region delayed the harvesting of peanut and cotton crops by at least two weeks.
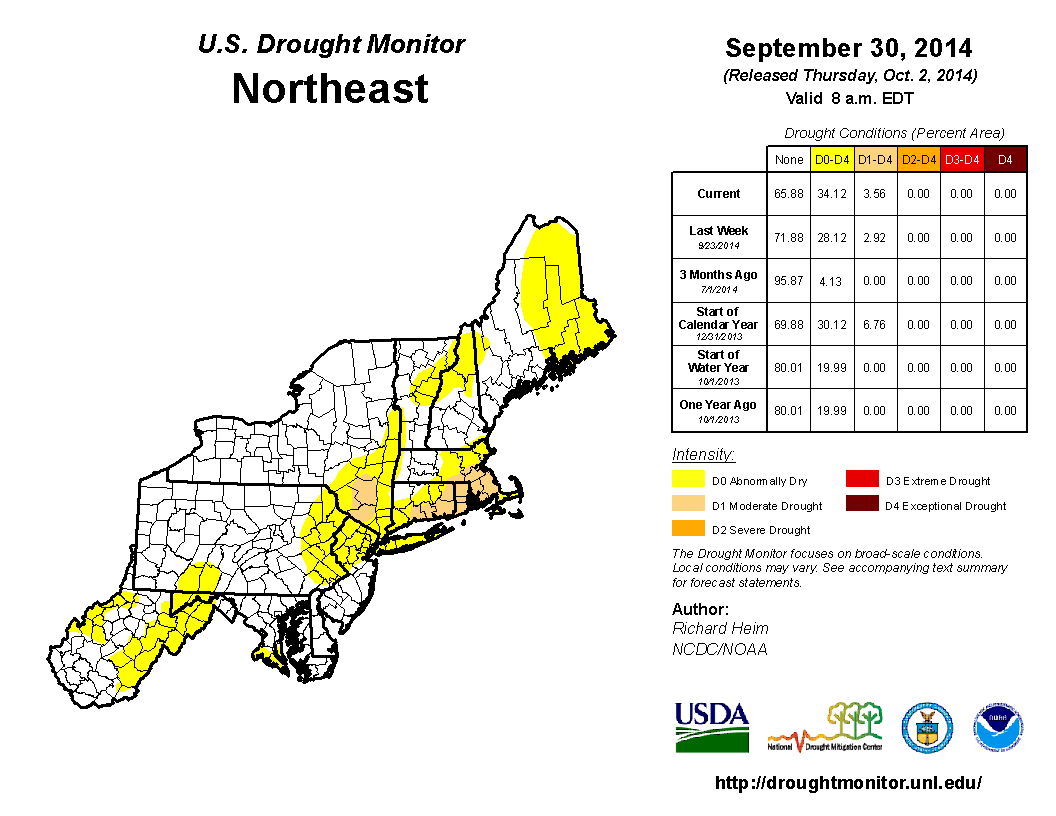
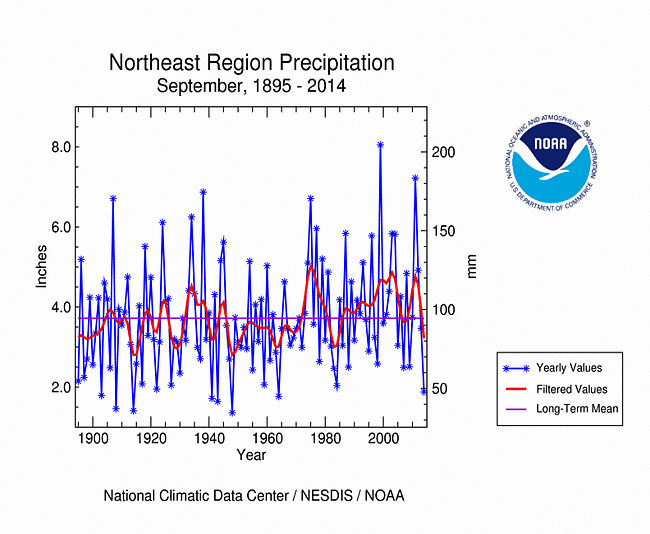
As explained by the Northeast Regional Climate Center, the Northeast was quite dry and warmer-than-normal in September. The region received 1.91 inches (48.51 mm) of rain, 48 percent of normal, making it the 7th driest September since 1895. Eight of the twelve Northeast states ranked this September among their top 13 driest. Rhode Island saw only 21 percent of normal rainfall, making it the 2nd driest September on record. Connecticut, Massachusetts, and Maine had their 6th driest September with 30 percent of normal, 33 percent of normal, and 39 percent of normal, respectively. New Hampshire saw 39 percent of normal rainfall and Vermont saw 45 percent of normal, making it the 7th driest September for both states. At 43 percent of normal, Pennsylvania had its 11th driest September, while New York had its 13th driest at 53 percent. Maryland wrapped up the month at 59 percent of normal, followed by New Jersey at 62 percent and West Virginia at 63 percent. Delaware saw 89 percent of normal rainfall in September.
At the start of September, 6 percent of the Northeast was abnormally dry. Those areas included parts of eastern West Virginia, southeastern New York, and southern New England. Conditions deteriorated throughout the month. By month's end, Delaware was the only state without abnormally dry conditions, and moderate drought had been introduced in southern New England and southeastern New York. According to the USDM released on October 2, 31 percent of the Northeast was abnormally dry, while 4 percent of the region was experiencing moderate drought. Many southern New England waterways were running very low, with streamflows at 10 percent of normal or less. In fact, provisional USGS data (from September 30) showed that a few waterways were at record or near-record low levels. Municipalities issued water conservation alerts due to low reservoirs, and crops and pastures needed to be irrigated due to dry soil conditions.
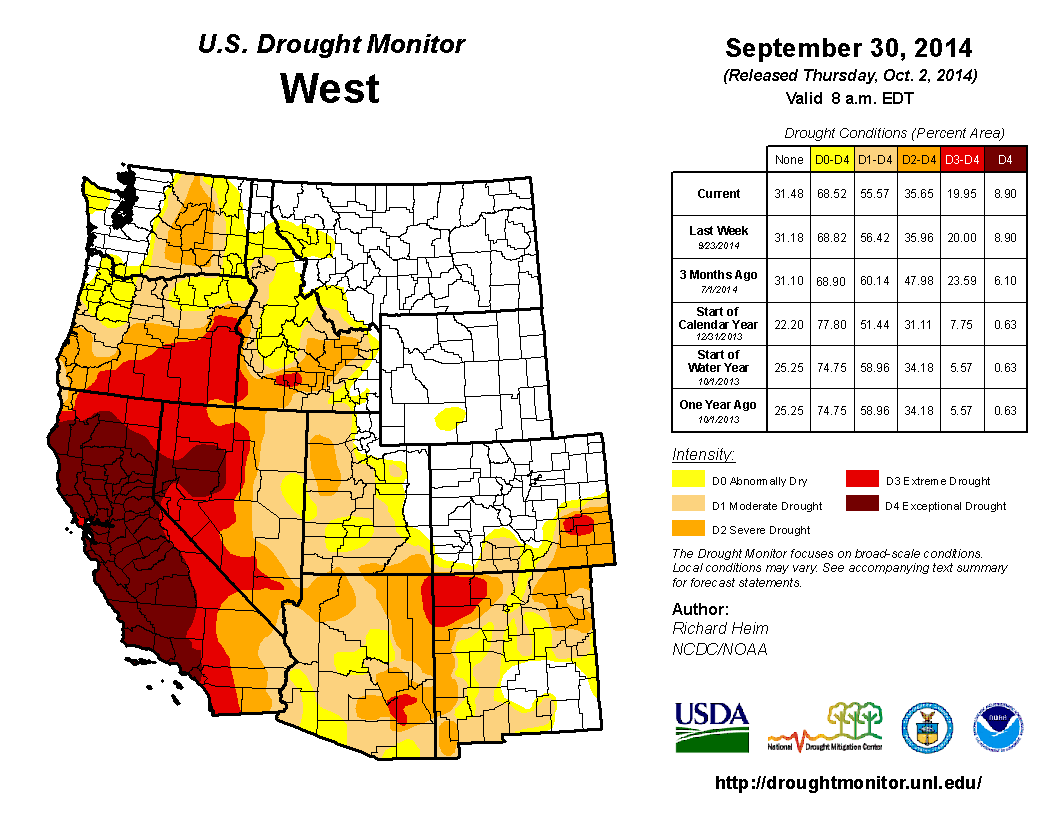
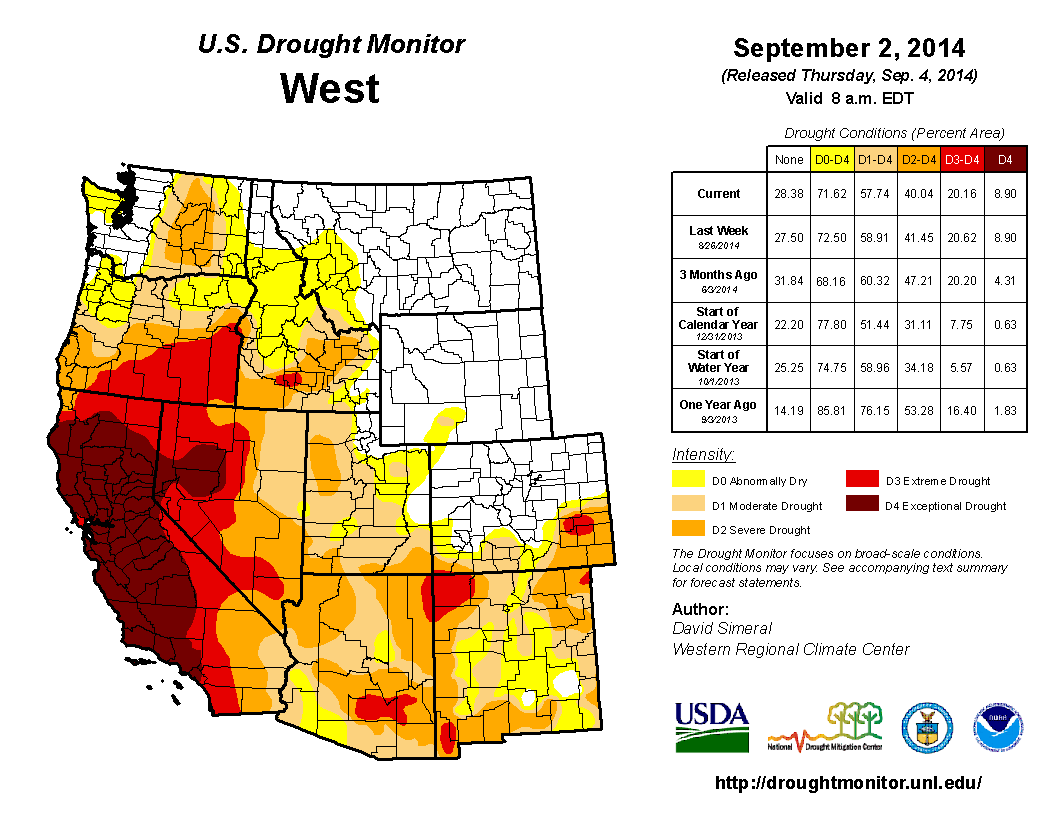
As summarized by the Western Regional Climate Center, scattered areas of the West saw significantly above-normal precipitation this month, notably the Great Basin and areas along the Mexican border. Though several low-pressure systems moved through the West during September, strong high pressure between storms kept temperatures above normal for much of the region.
Remnants of hurricanes Norbert and Odile supplied moisture that allowed for heavy precipitation over the Southwest this month, and a cold-core low-pressure system during the last week of the month also provided precipitation for a wide swath of the West. Despite this month's precipitation, extreme to exceptional drought continues in California, Oregon, and Nevada due to the large precipitation deficit present after 3+ years of drought and the impacts observed in water resources and landscapes. Some improvement in drought conditions was observed in the eastern Great Basin, Arizona and New Mexico though moderate drought persists as drought-related impacts are still apparent.
Precipitation was highly variable throughout Alaska this month. Fairbanks recorded 2.89 in (73 mm) of precipitation, 262% of normal and the second wettest September since records began in 1929. Further southwest, Bethel reported 1.26 in (32 mm), 46% of normal. Temperatures were generally above normal throughout with state, though some Interior locations were slightly cooler than normal. Homer, on the Kenai Peninsula, reported its warmest September since records began in 1932 at an average 53.2 F (11.8 C). Further south, precipitation was variable throughout Hawaii as well. Hilo observed 41% of its normal rainfall; Kahului recorded 186% of normal. The average temperature in Hilo this month was 79.4 F (26.3 C), 3.2 F (1.8 C) above normal and the warmest September in a 66-year record. Other stations in the state generally observed near-normal temperatures.
Pacific Islands: According to reports from National Weather Service offices, the Pacific ENSO Applications Climate Center (PEAC), and partners, conditions varied across the Pacific Islands.
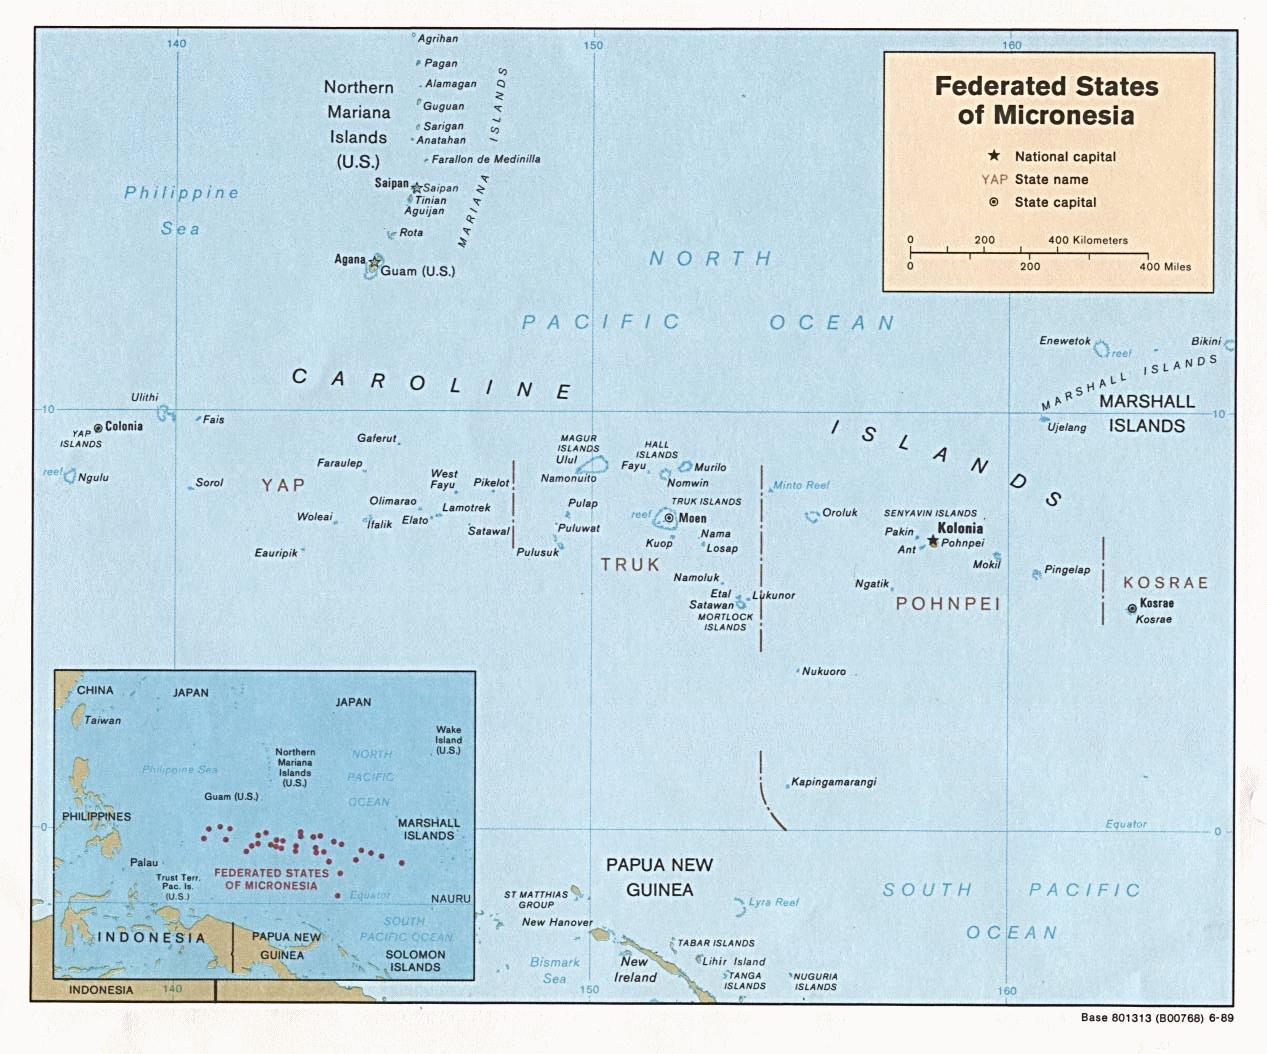
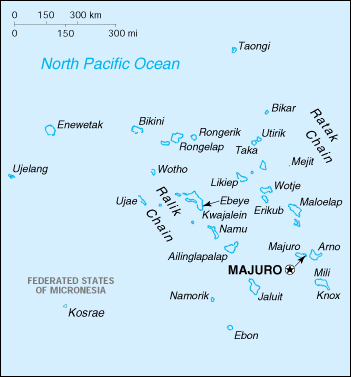
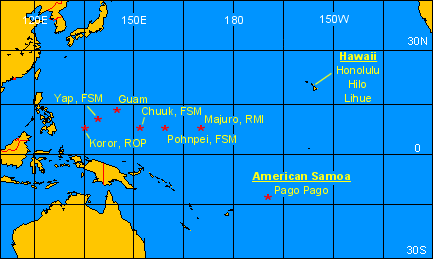
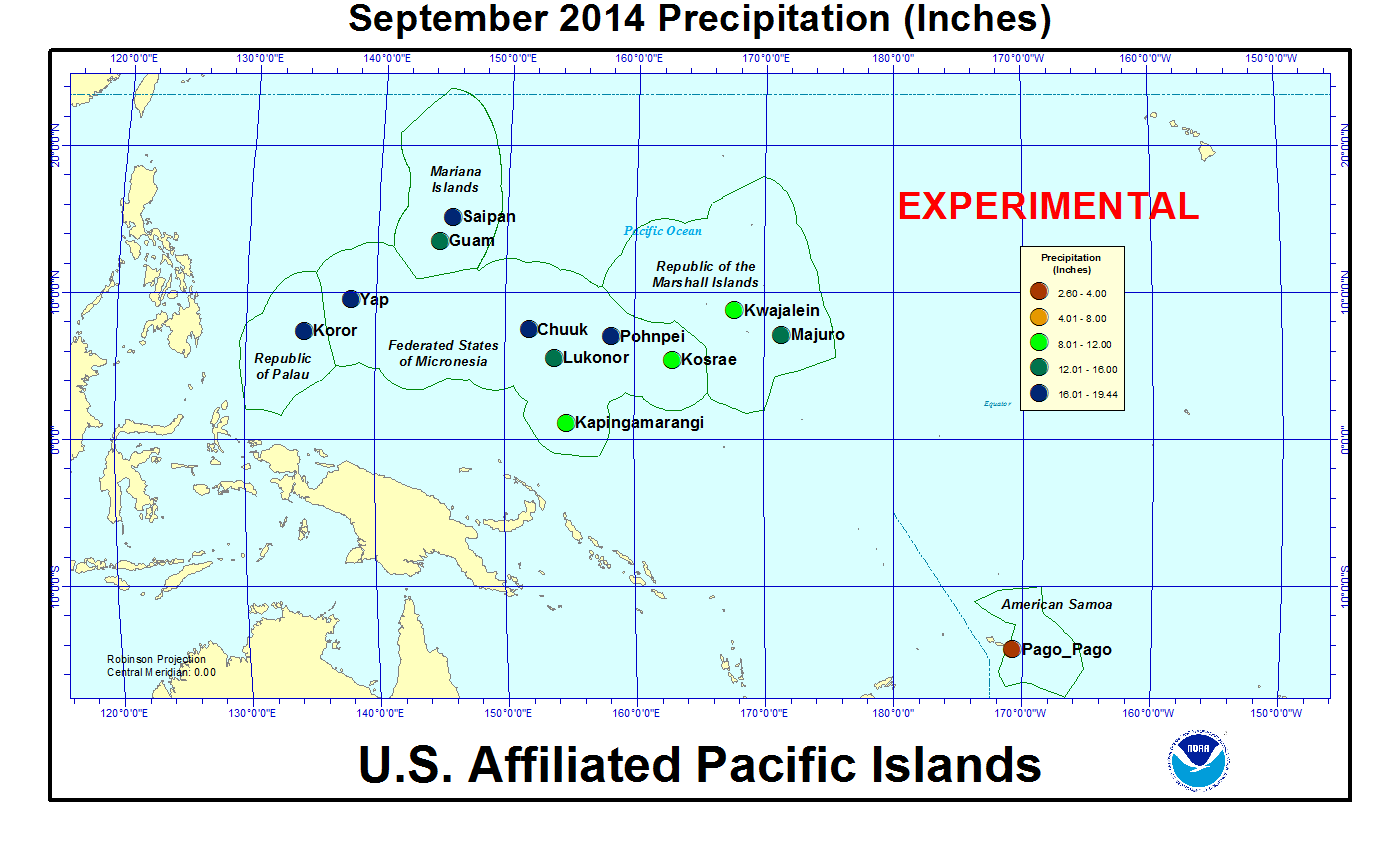
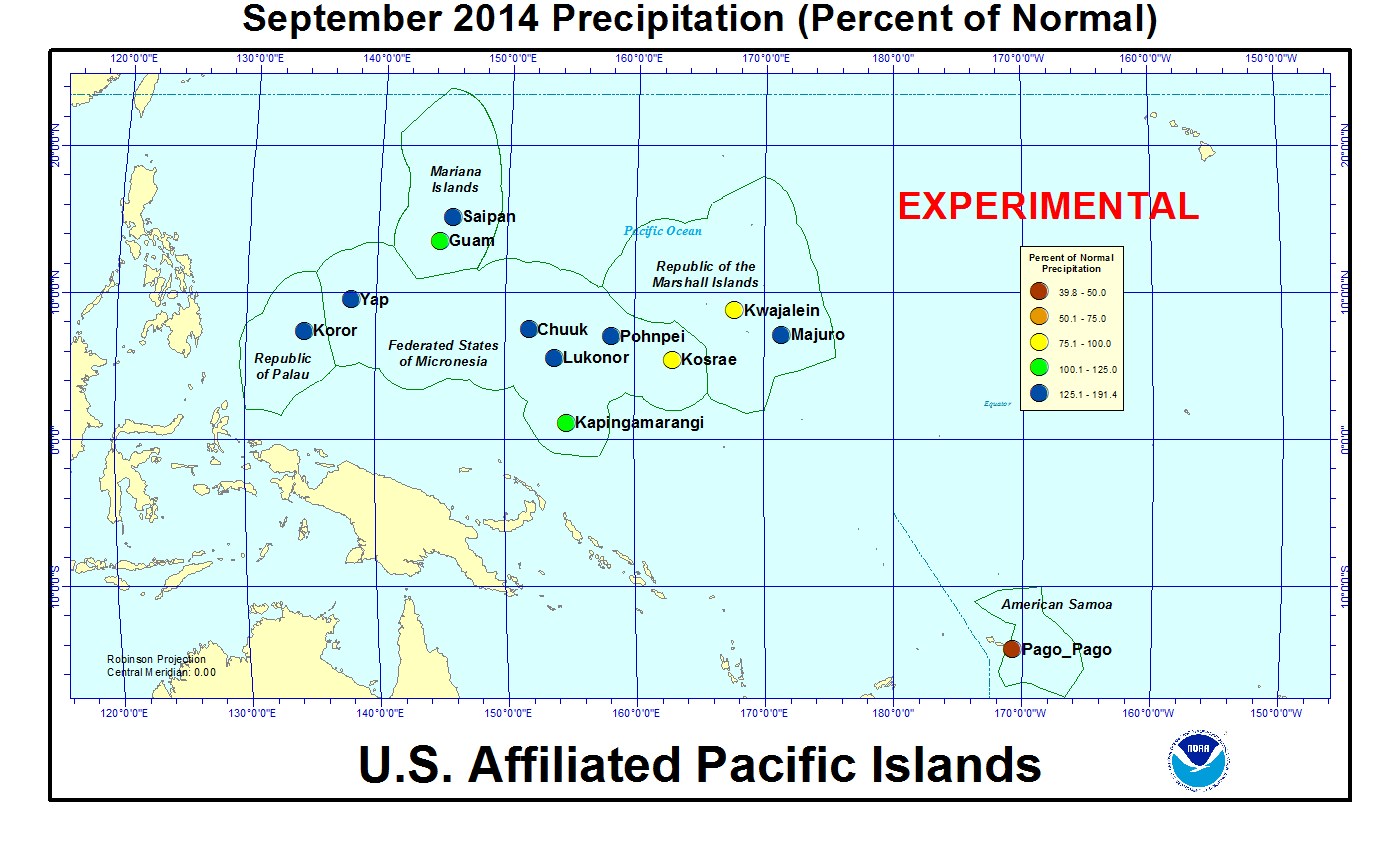
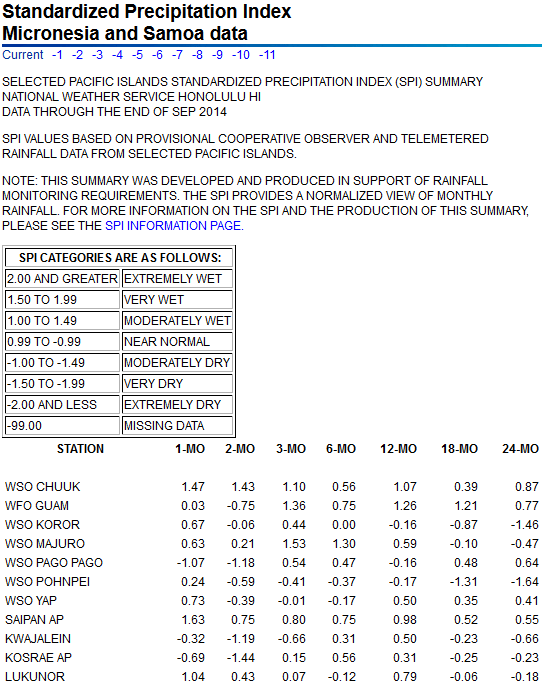
Across the U.S. Affiliated Pacific Islands (maps — Micronesia, Marshall Islands, basinwide), September 2014 was wetter than normal at most of the reporting stations with only Kosrae, Kwajalein, and Pago Pago drier than normal. The rainfall amounts at most stations were above the minimum thresholds (4 or 8 inches) required to meet most monthly water needs. The 4- and 8-inch thresholds are important because, if monthly precipitation falls below the threshold, then drought becomes a concern. Pago Pago, with 2.60 inches, was below the 8-inch threshold. September marks the second consecutive month that Pago Pago was drier than both the 8-inch and 4-inch thresholds.
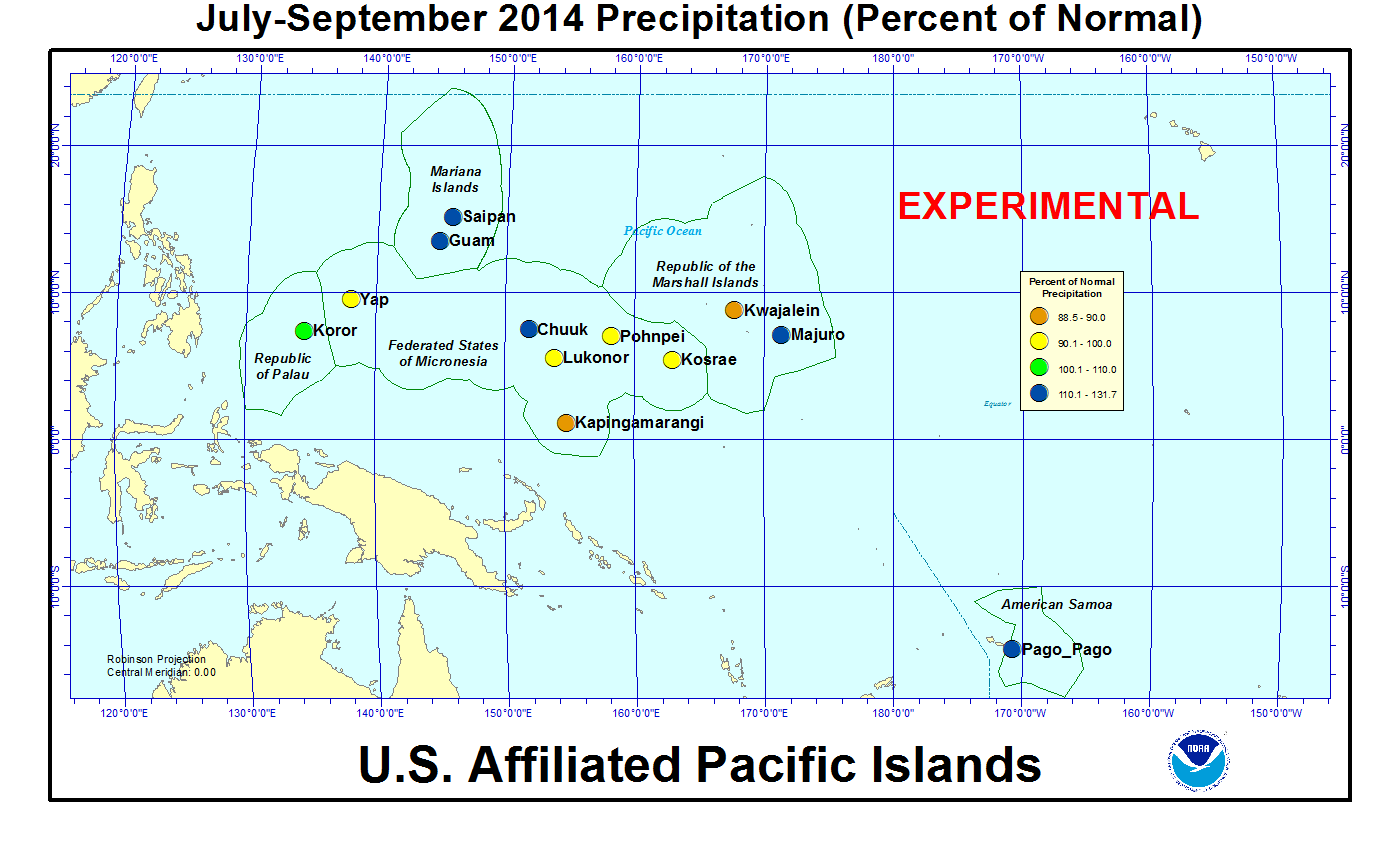
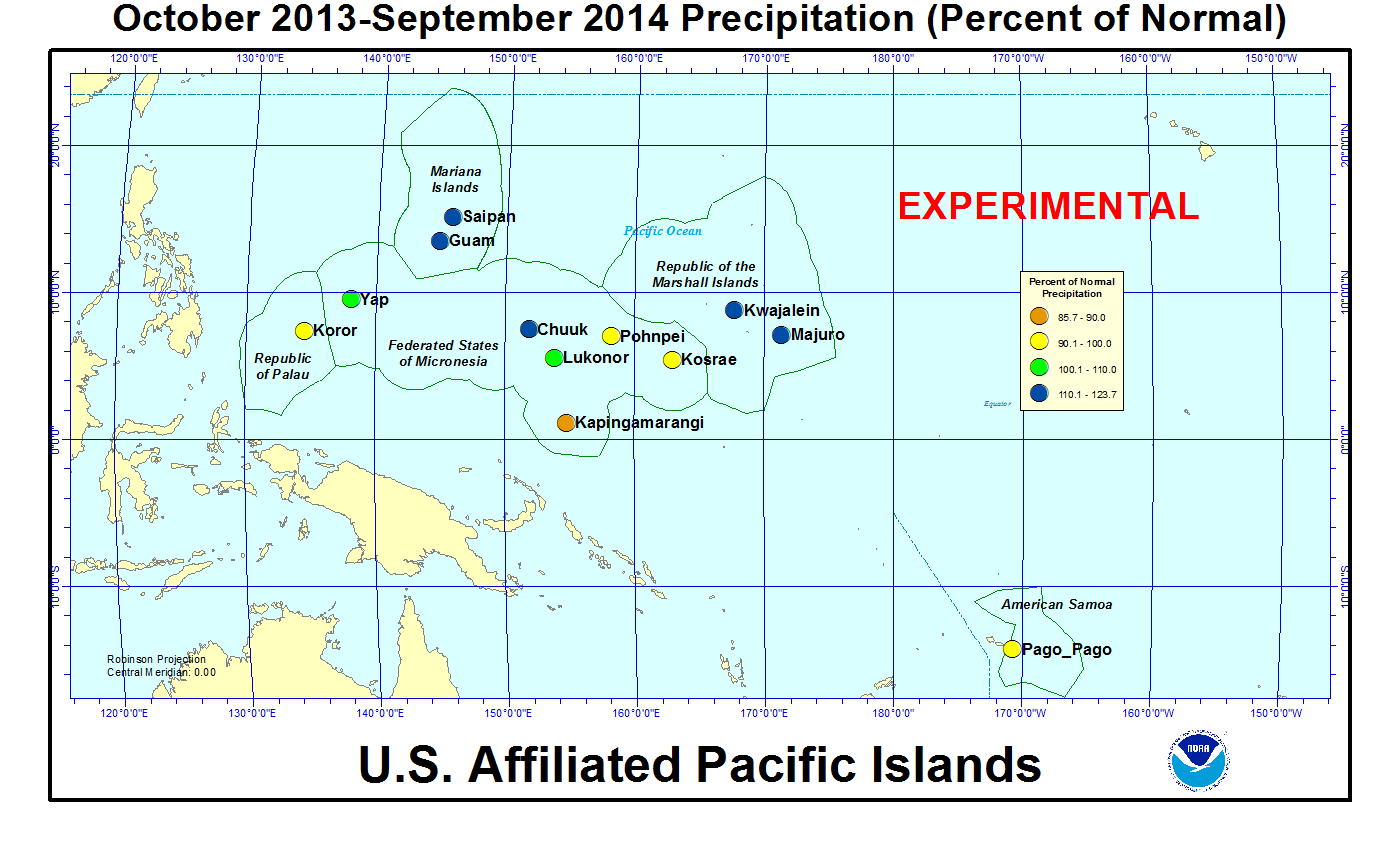
As measured by percent of normal precipitation, Kwajalein has been drier than normal for recent months (September and July-September) but wetter than normal at the longer time periods (year to date [YTD] [January-September] and last 12 months [October 2013-September 2014]), while Koror has been wetter than normal for recent months and drier than normal at the longer time periods. Pago Pago has been drier than normal for September and the last 12 months as a whole, but wetter than normal for the intervening time scales. Kapingamarangi was wet during September but drier than normal for the other three time periods. Yap and Lukonor were drier than normal for July-September, in spite of being wetter than normal during September, and wetter than normal at the longer time periods. Pohnpei was wetter than normal during September but drier than normal at the other three time scales. Kosrae has been drier than normal at all four of these time scales. Saipan, Guam, Chuuk, and Majuro have been wetter than normal for all four of these time scales.
| Station Name | Oct 2013 | Nov 2013 | Dec 2013 | Jan 2014 | Feb 2014 | Mar 2014 | Apr 2014 | May 2014 | Jun 2014 | Jul 2014 | Aug 2014 | Sep 2014 | Oct- Sep |
|---|---|---|---|---|---|---|---|---|---|---|---|---|---|
| Chuuk | 103% | 111% | 75% | 59% | 492% | 89% | 111% | 116% | 76% | 125% | 121% | 166% | 122% |
| Guam NAS | 198% | 56% | 65% | 421% | 170% | 141% | 108% | 99% | 98% | 290% | 62% | 108% | 120% |
| Kapingamarangi | 85% | 38% | 254% | 168% | 112% | 81% | 43% | 83% | 56% | 86% | 96% | 109% | 86% |
| Koror | 86% | 115% | 64% | 170% | 91% | 68% | 224% | 63% | 57% | 121% | 77% | 137% | 94% |
| Kosrae | 201% | 112% | 87% | 86% | 104% | 82% | 150% | 93% | 117% | 175% | 59% | 77% | 93% |
| Kwajalein | 37% | 121% | 39% | 121% | 523% | 475% | 366% | 80% | 104% | 120% | 58% | 88% | 119% |
| Lukonor | 118% | 125% | 90% | 257% | 206% | 138% | 72% | 116% | 110% | 78% | 77% | 146% | 106% |
| Majuro | 71% | 96% | 51% | 125% | 177% | 91% | 246% | 75% | 90% | 201% | 82% | 134% | 114% |
| Pago Pago | 62% | 58% | 99% | 146% | 97% | 65% | 152% | 81% | 154% | 333% | 60% | 40% | 93% |
| Pohnpei | 81% | 142% | 36% | 78% | 225% | 112% | 87% | 87% | 121% | 108% | 74% | 128% | 99% |
| Saipan | 109% | 52% | 71% | 546% | 55% | 167% | 168% | 205% | 92% | 113% | 71% | 191% | 124% |
| Yap | 144% | 74% | 65% | 340% | 91% | 153% | 226% | 39% | 83% | 110% | 65% | 125% | 110% |
| Station Name | Oct 2013 | Nov 2013 | Dec 2013 | Jan 2014 | Feb 2014 | Mar 2014 | Apr 2014 | May 2014 | Jun 2014 | Jul 2014 | Aug 2014 | Sep 2014 | Oct- Sep |
|---|---|---|---|---|---|---|---|---|---|---|---|---|---|
| Chuuk | 11.82" | 11.82" | 8.44" | 5.98" | 35.70" | 7.43" | 13.80" | 13.06" | 8.91" | 14.92" | 15.55" | 19.44" | 166.87" |
| Guam NAS | 22.66" | 4.13" | 3.33" | 16.89" | 5.14" | 2.91" | 2.74" | 3.36" | 6.08" | 29.39" | 9.08" | 13.66" | 119.37" |
| Kapingamarangi | 6.99" | 3.49" | 25.02" | 15.38" | 10.36" | 9.26" | 5.83" | 9.97" | 7.77" | 12.16" | 7.84" | 10.86" | 124.93" |
| Koror | 10.19" | 13.11" | 7.19" | 17.27" | 7.79" | 5.08" | 16.38" | 7.45" | 9.91" | 22.45" | 10.40" | 16.10" | 143.32" |
| Kosrae | 22.03" | 15.54" | 13.94" | 14.39" | 13.47" | 13.12" | 26.29" | 16.59" | 17.08" | 26.06" | 8.32" | 11.00" | 197.83" |
| Kwajalein | 4.17" | 13.63" | 2.62" | 3.81" | 13.82" | 11.17" | 19.24" | 5.36" | 7.22" | 11.88" | 5.61" | 9.49" | 108.02" |
| Lukonor | 13.34" | 11.38" | 10.11" | 21.65" | 18.42" | 12.76" | 8.18" | 13.58" | 12.85" | 12.50" | 10.80" | 14.79" | 160.36" |
| Majuro | 9.01" | 12.84" | 5.76" | 9.66" | 12.19" | 5.96" | 23.20" | 7.58" | 9.86" | 22.49" | 9.64" | 14.93" | 143.12" |
| Pago Pago | 5.71" | 5.91" | 12.71" | 19.54" | 11.65" | 6.95" | 14.29" | 7.84" | 8.22" | 18.48" | 3.22" | 2.60" | 117.12" |
| Pohnpei | 12.37" | 20.99" | 5.79" | 10.27" | 21.50" | 14.70" | 15.96" | 17.33" | 17.95" | 16.74" | 10.52" | 16.06" | 180.18" |
| Saipan | 11.60" | 2.91" | 2.74" | 13.81" | 1.43" | 3.16" | 4.41" | 4.87" | 3.32" | 10.04" | 9.33" | 19.31" | 86.93" |
| Yap | 17.60" | 6.56" | 5.56" | 21.74" | 4.72" | 6.99" | 12.72" | 3.07" | 9.95" | 16.62" | 9.58" | 16.89" | 132" |
| Station Name | Oct 2013 | Nov 2013 | Dec 2013 | Jan 2014 | Feb 2014 | Mar 2014 | Apr 2014 | May 2014 | Jun 2014 | Jul 2014 | Aug 2014 | Sep 2014 | Oct- Sep |
|---|---|---|---|---|---|---|---|---|---|---|---|---|---|
| Chuuk | 11.51" | 10.61" | 11.25" | 10.10" | 7.25" | 8.32" | 12.47" | 11.30" | 11.66" | 11.98" | 12.86" | 11.71" | 136.77" |
| Guam NAS | 11.44" | 7.38" | 5.11" | 4.01" | 3.03" | 2.07" | 2.53" | 3.40" | 6.18" | 10.14" | 14.74" | 12.66" | 99.09" |
| Kapingamarangi | 8.19" | 9.27" | 9.84" | 9.15" | 9.27" | 11.43" | 13.64" | 12.08" | 13.78" | 14.15" | 8.13" | 9.93" | 145.85" |
| Koror | 11.84" | 11.39" | 11.16" | 10.18" | 8.56" | 7.44" | 7.32" | 11.83" | 17.48" | 18.53" | 13.50" | 11.77" | 152.90" |
| Kosrae | 10.94" | 13.83" | 16.11" | 16.67" | 12.93" | 16.06" | 17.51" | 17.75" | 14.64" | 14.91" | 14.22" | 14.22" | 213.87" |
| Kwajalein | 11.18" | 11.28" | 6.66" | 3.16" | 2.64" | 2.35" | 5.26" | 6.72" | 6.93" | 9.87" | 9.74" | 10.74" | 90.41" |
| Lukonor | 11.32" | 9.08" | 11.27" | 8.41" | 8.93" | 9.26" | 11.31" | 11.69" | 11.65" | 15.93" | 14.04" | 10.15" | 151.36" |
| Majuro | 12.73" | 13.44" | 11.39" | 7.74" | 6.88" | 6.58" | 9.42" | 10.11" | 11.01" | 11.17" | 11.69" | 11.17" | 125.25" |
| Pago Pago | 9.26" | 10.14" | 12.84" | 13.34" | 12.00" | 10.68" | 9.39" | 9.66" | 5.33" | 5.55" | 5.38" | 6.53" | 125.57" |
| Pohnpei | 15.27" | 14.83" | 16.08" | 13.18" | 9.55" | 13.17" | 18.41" | 19.96" | 14.81" | 15.43" | 14.26" | 12.55" | 182.36" |
| Saipan | 10.62" | 5.61" | 3.85" | 2.53" | 2.59" | 1.89" | 2.63" | 2.38" | 3.62" | 8.91" | 13.13" | 10.09" | 70.25" |
| Yap | 12.18" | 8.83" | 8.51" | 6.39" | 5.19" | 4.56" | 5.63" | 7.85" | 12.04" | 15.08" | 14.82" | 13.50" | 120.31" |

[top]
State/Regional/National Moisture Status
A detailed review of drought and moisture conditions is available for all contiguous U.S. states, the nine standard regions, and the nation (contiguous U.S.):
| northeast u. s. | east north central u. s. | central u. s. |
| southeast u. s. | west north central u. s. | south u. s. |
| southwest u. s. | northwest u. s. | west u. s. |
| Contiguous United States |
[top]
Contacts & Questions