Contents Of This Report:
|
|
Please note that the values presented in this report are based on preliminary data. They will change when the final data are processed, but will not be replaced on these pages.
National Drought Overview
|
|
[top]
Detailed Drought Discussion
Overview
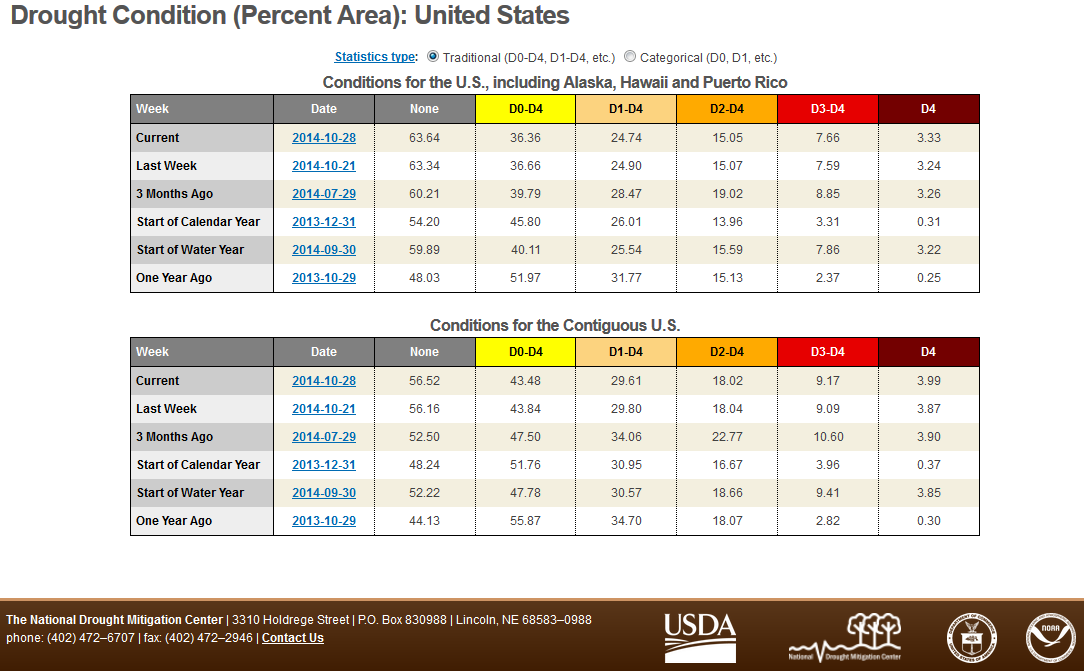
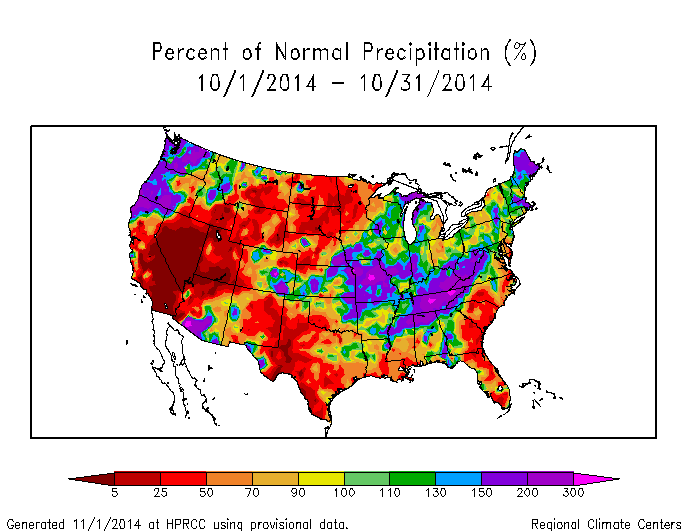
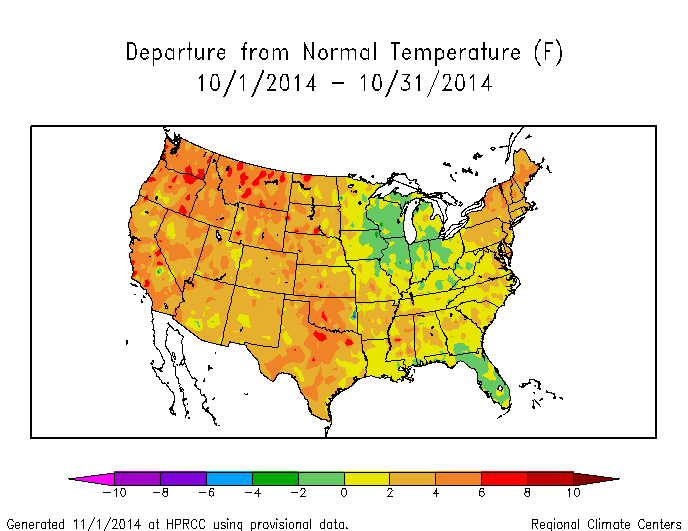
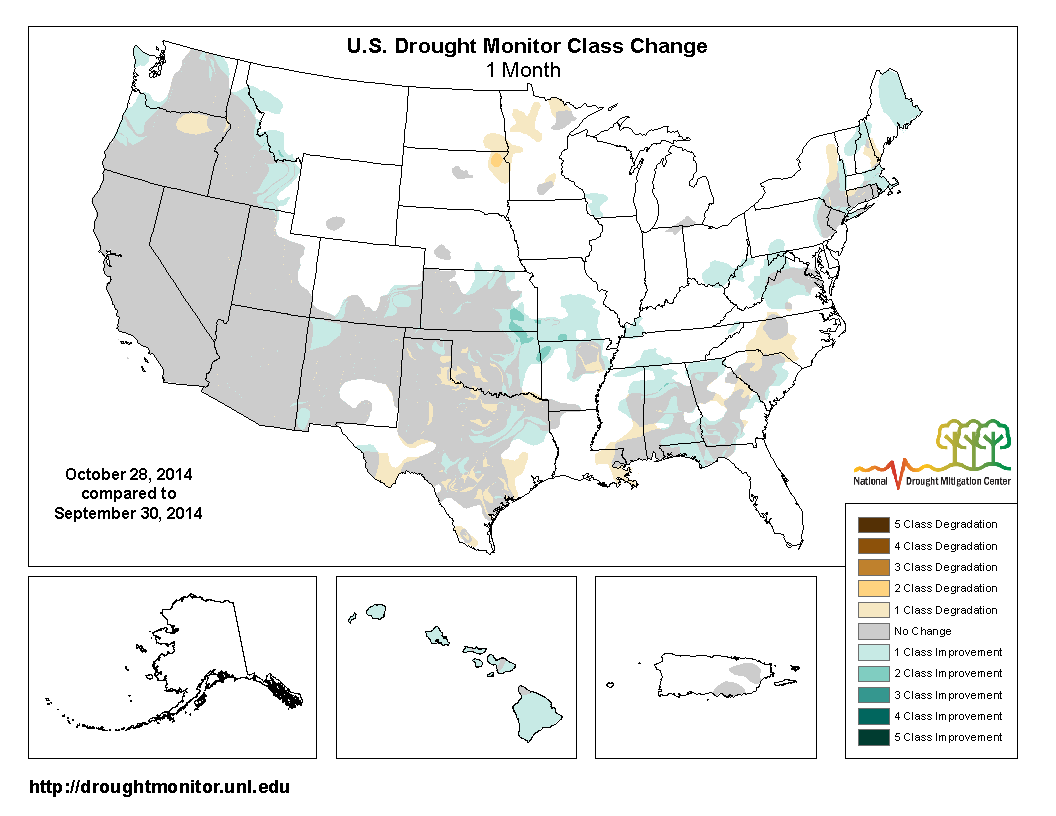
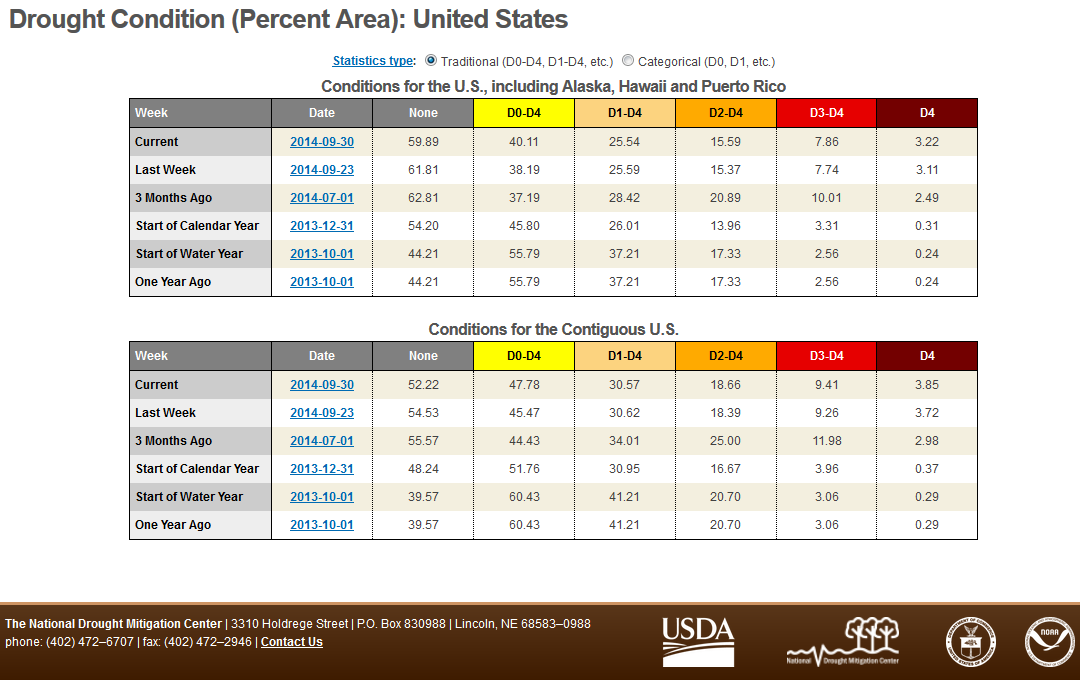
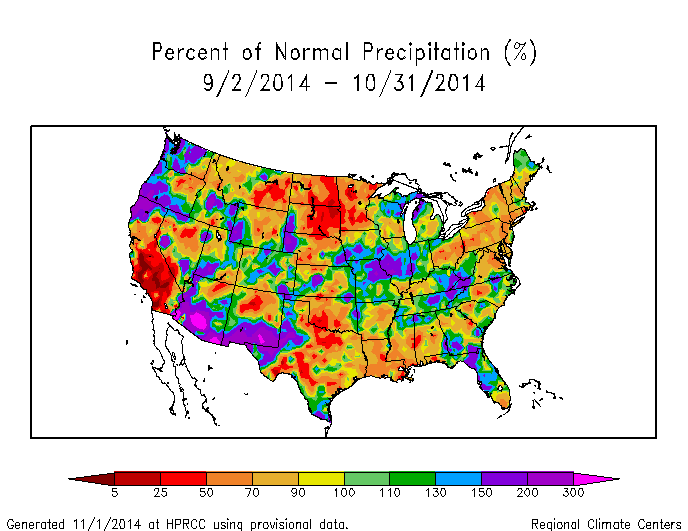
During October 2014, as in previous months, many vigorous short-wave troughs and ridges migrated through an active jet stream, dragging surface fronts and surface low pressure systems along with them. These systems brought above-normal precipitation to the coastal Northwest, parts of the Northeast, and parts of the Midwest to Southern and Central Appalachians. Subsiding air from upper-level ridges kept precipitation below normal across the coastal Southeast and much of the West and Great Plains. The busy parade of troughs and ridges dragged competing warm and cold fronts across the country, but the warm air dominated with monthly temperatures above normal across most of the CONUS. The above-normal rainfall helped reduce drought or abnormally dry conditions in Kansas, Oklahoma, and parts of the Mid-Atlantic to Southeast, but drought intensified in other parts of the Southern Plains. Alaska was predominantly drier than normal with a mixed temperature pattern. Hawaii was wetter than normal in the southern coastal areas and drier than normal on the windward (northeast) side of the southern islands. When integrated across the CONUS, October 2014 ranked as the 47th wettest October in the 1895-2014 record. On balance, the national drought footprint contracted when compared to last month, decreasing to about 24.7 percent of the U.S. as a whole, according to USDM statistics. According to the Palmer Drought Index, which goes back to the beginning of the 20th century, about 18 percent of the CONUS was in moderate to extreme drought at the end of October, an increase of about 4 percent compared to last month.
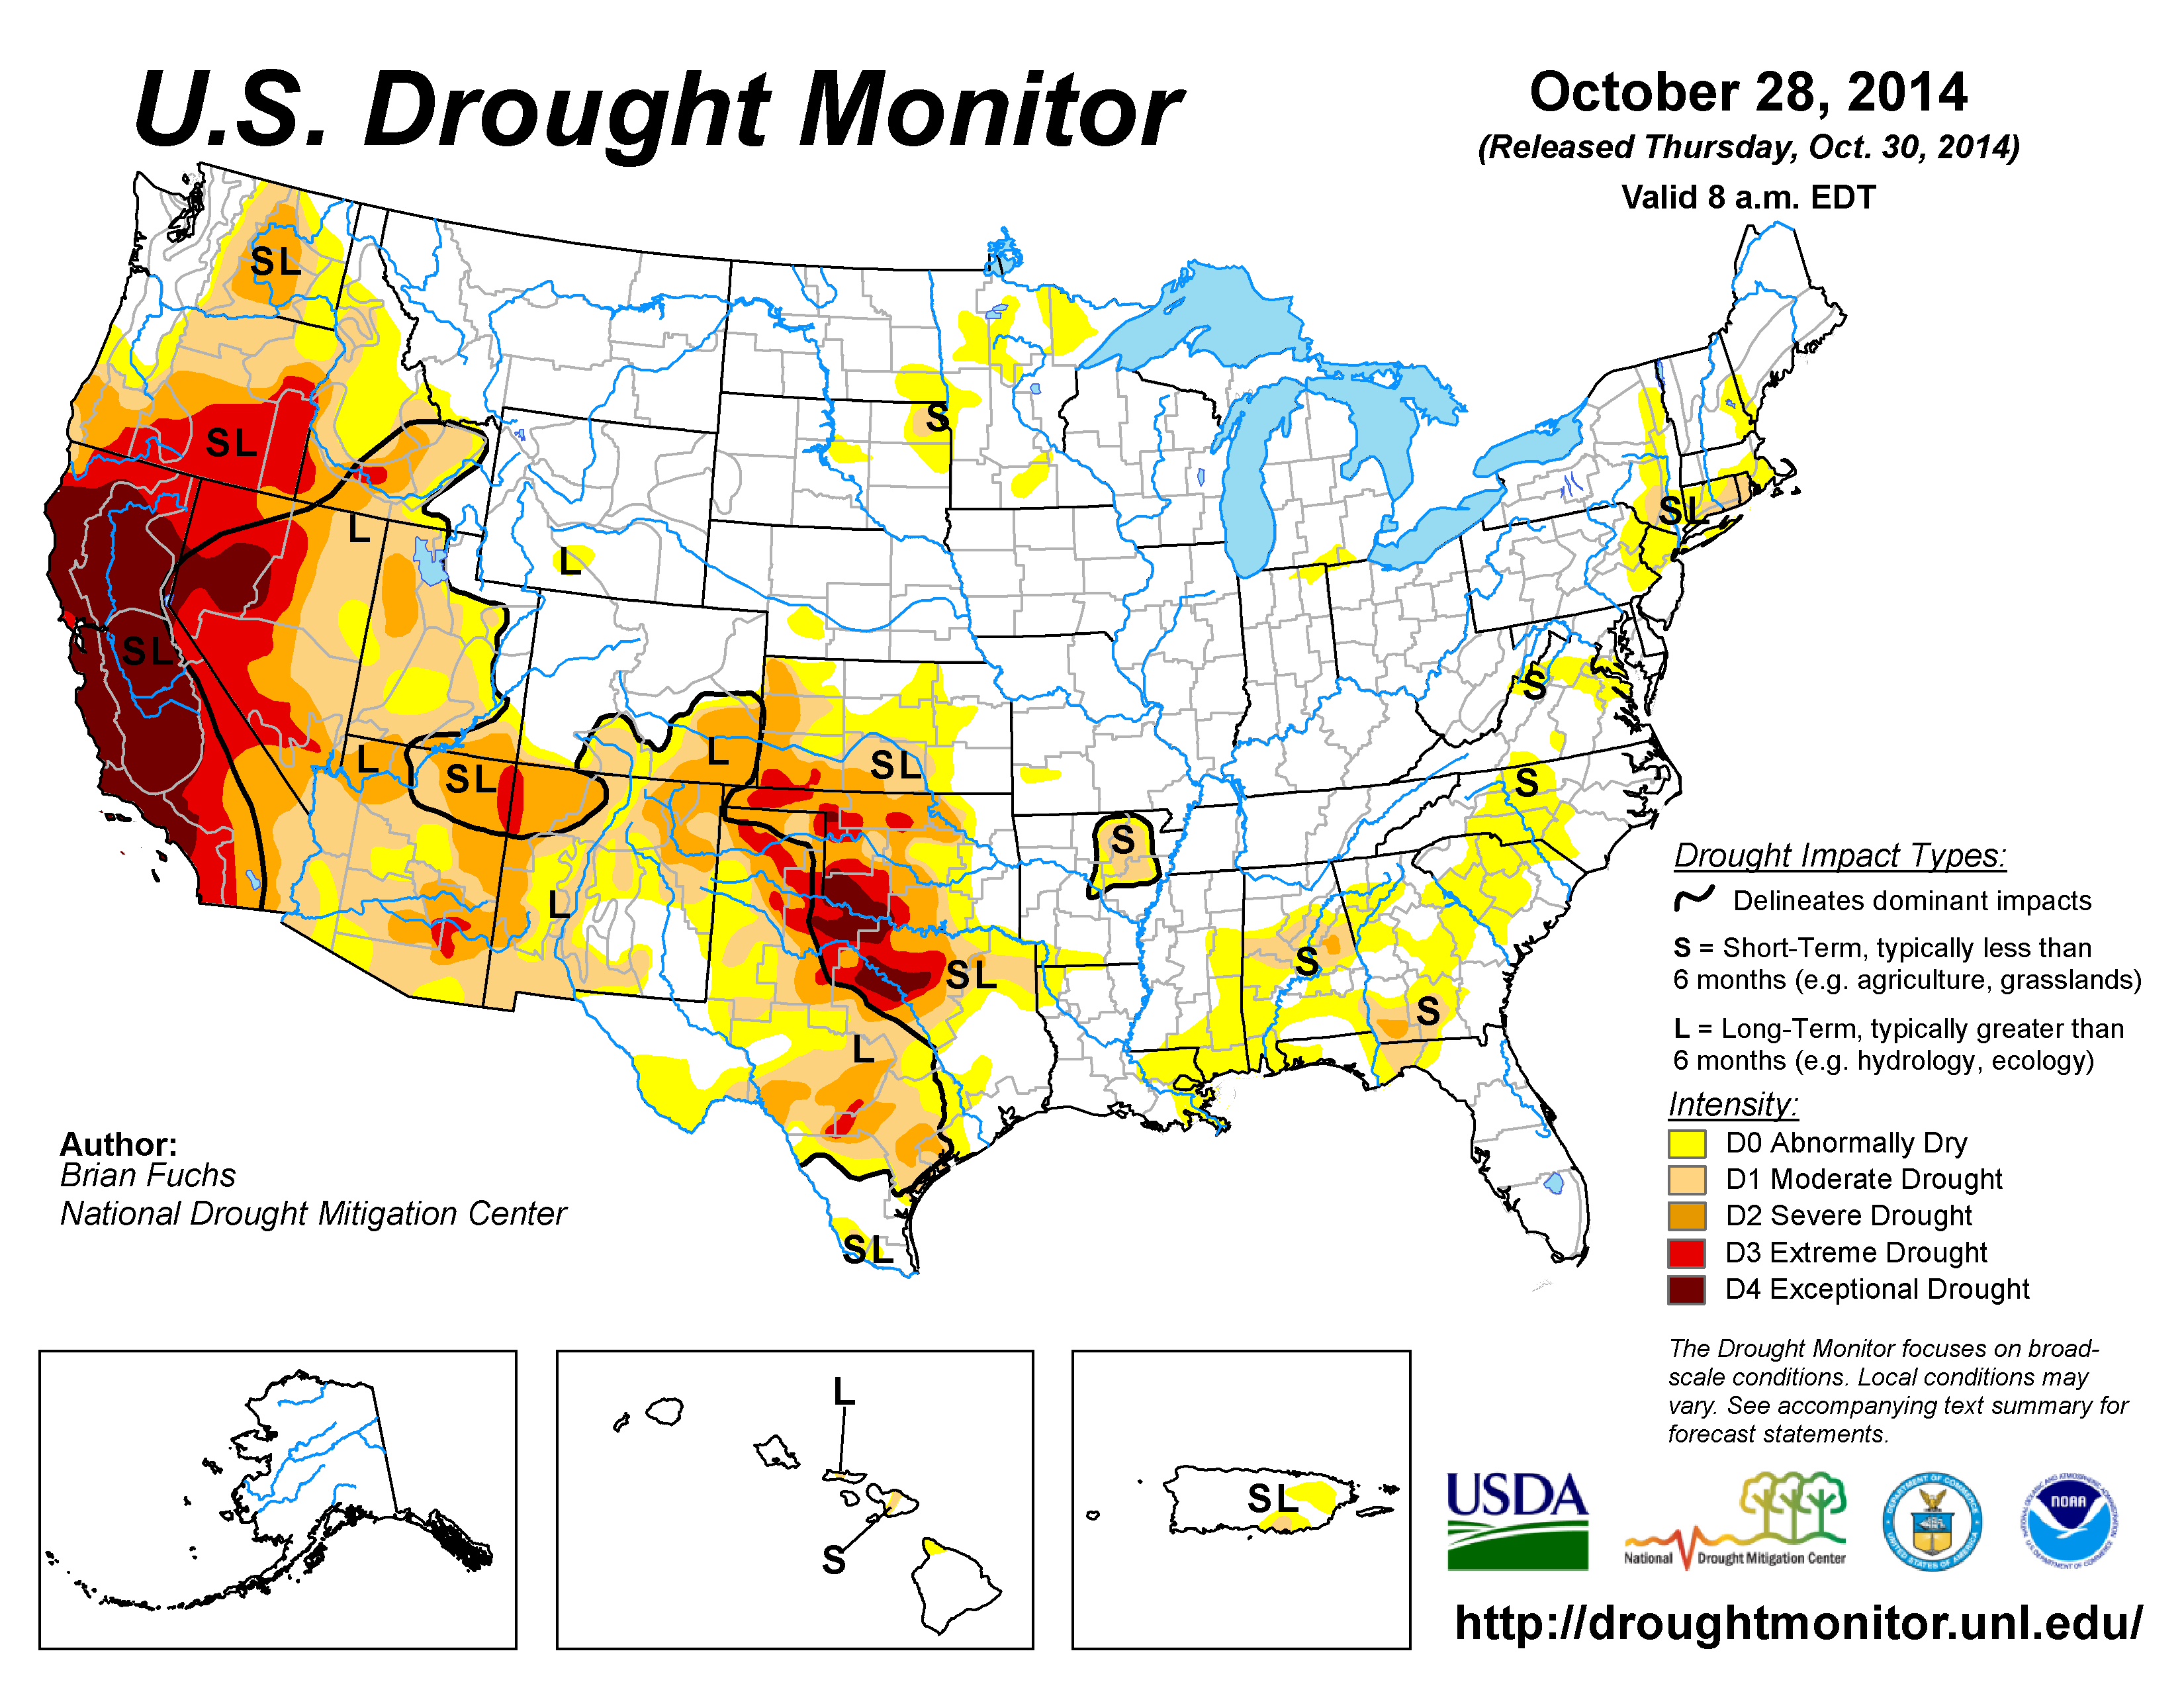
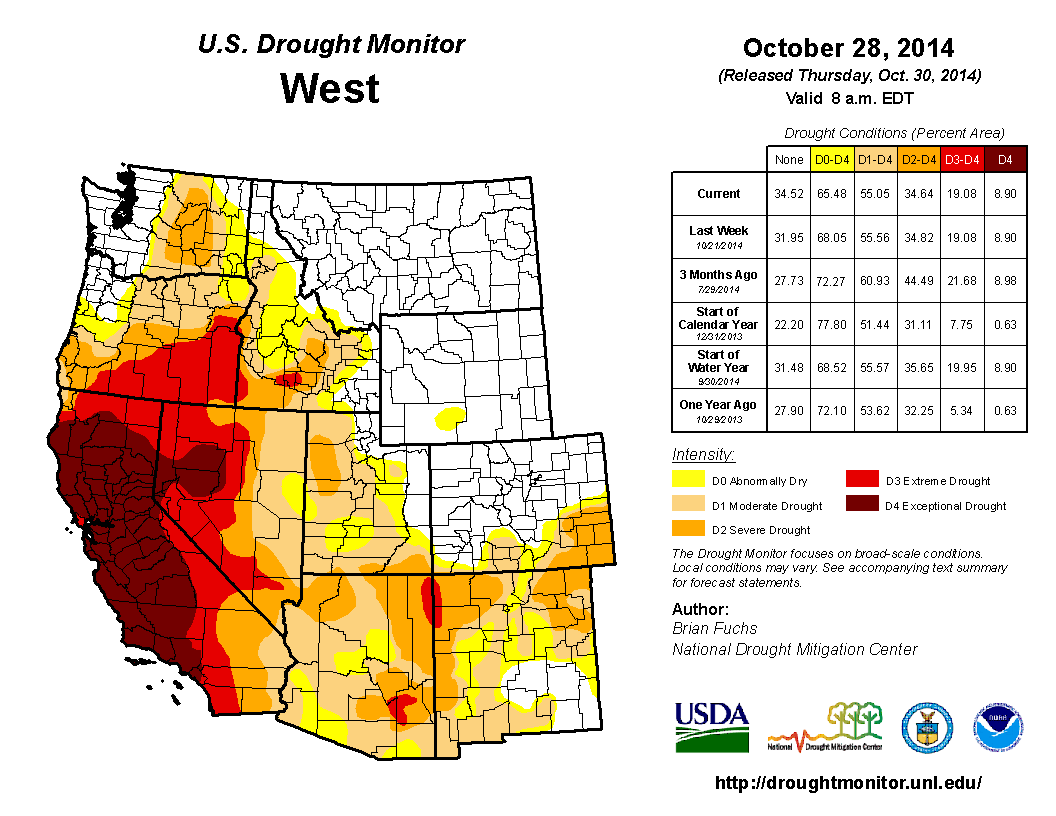
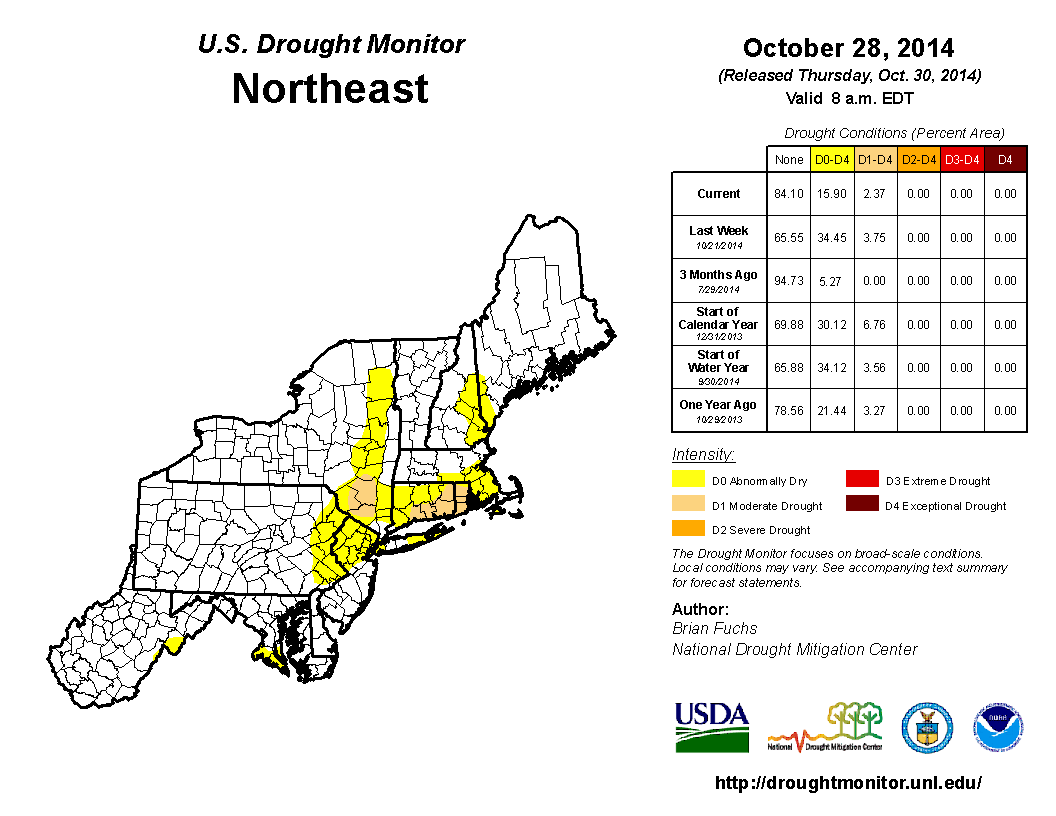
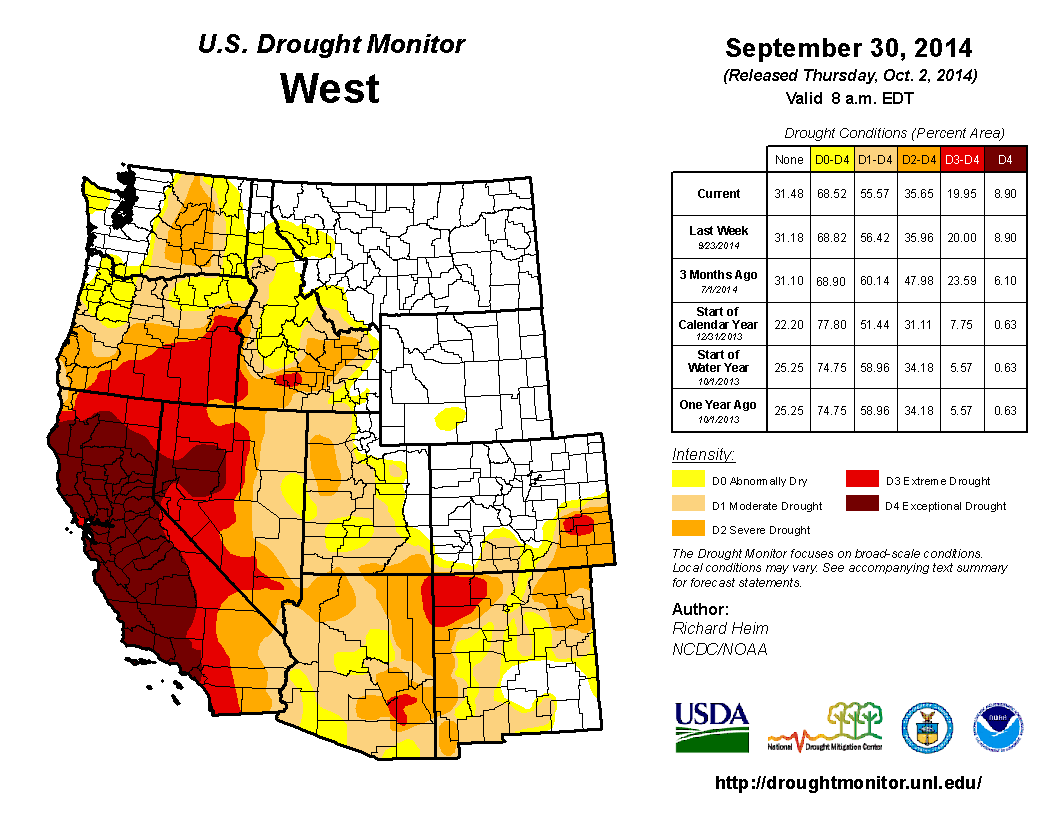
The U.S. Drought Monitor drought map valid October 28, 2014.
By the end of the month:
- moderate (D1) drought covered a large area of the U.S. from the West Coast to the Central and Southern Great Plains, connected across parts of New Mexico, with large areas of more intense drought within the moderate drought area;
- there were two epicenters of extreme (D3) to exceptional (D4) drought within this large moderate to severe (D2) drought area — one located in the California-Nevada-Oregon region and the other in the Southern Plains centered in northern Texas and adjacent Oklahoma;
- areas of moderate to severe drought persisted in the Southeast and moderate drought lingered in the Northeast; and
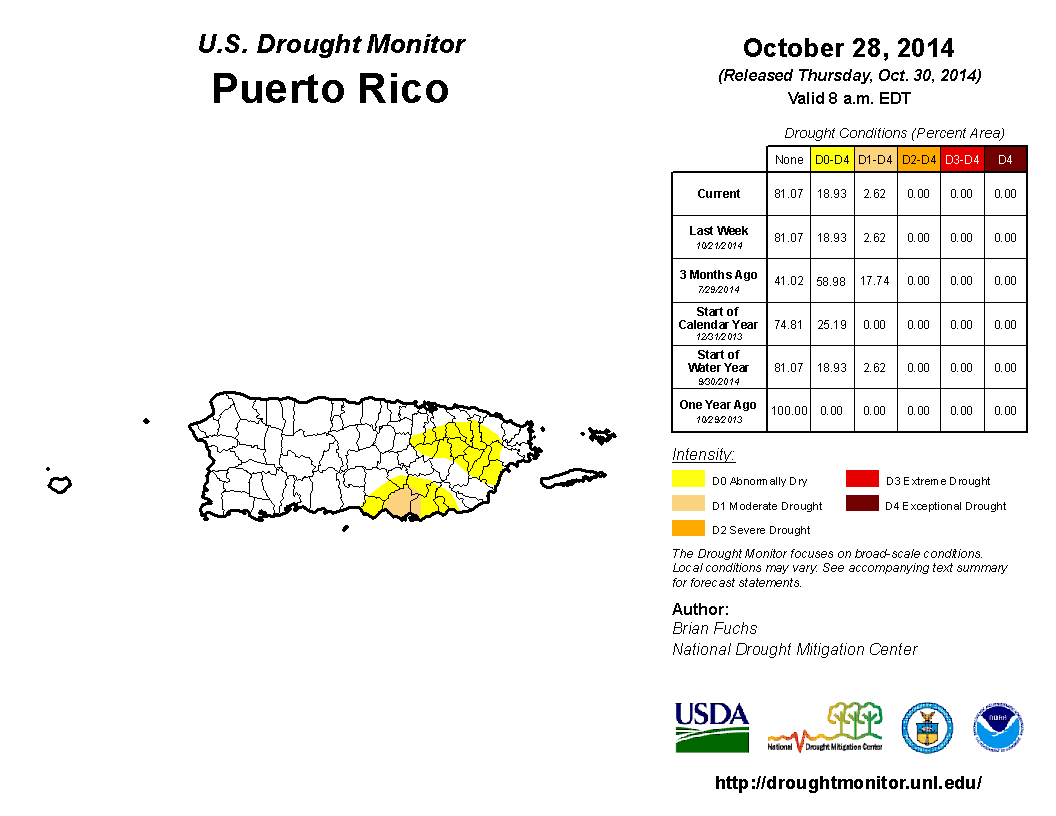
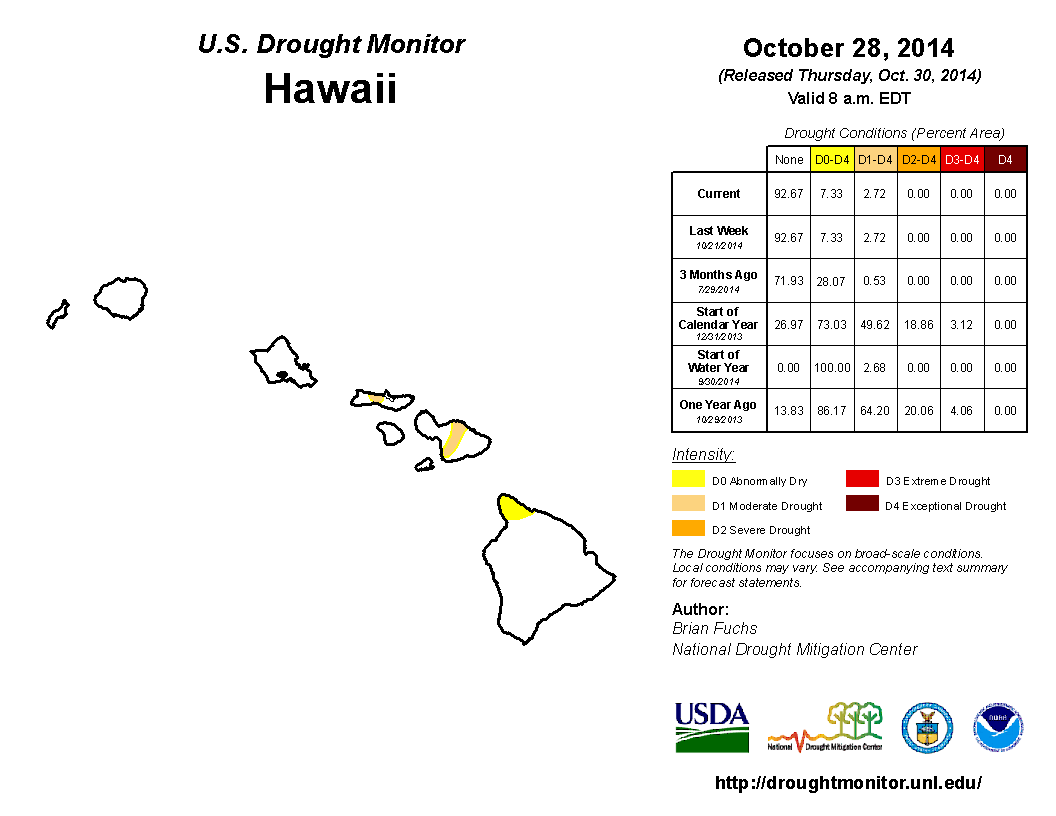
- moderate drought and abnormally dry conditions persisted in Puerto Rico and Hawaii.
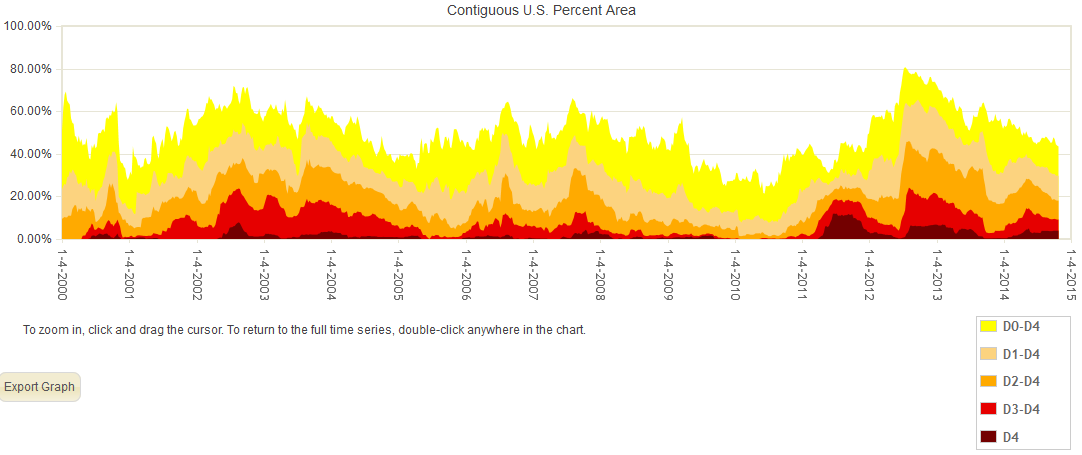
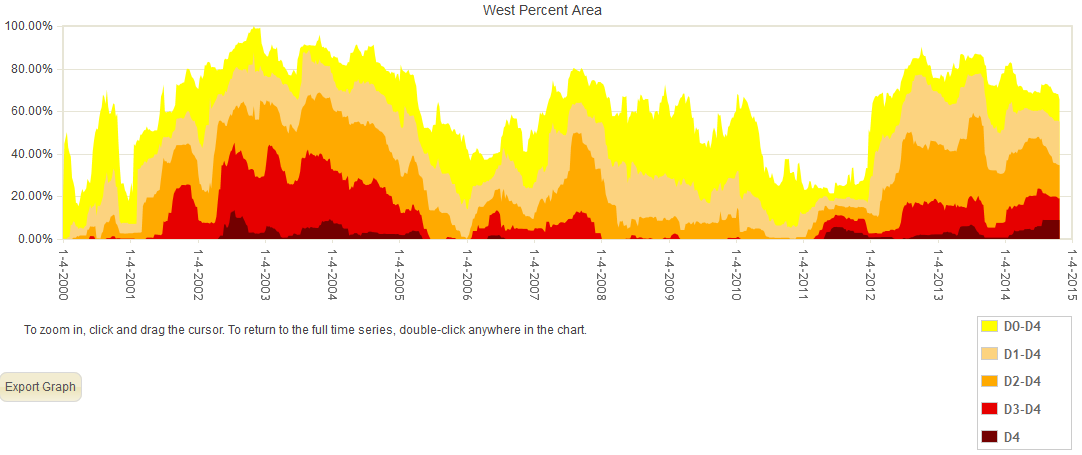
Percent area of the CONUS in moderate to exceptional drought, January 4, 2000 to present, based on the U.S. Drought Monitor.
Palmer Drought Index
The Palmer drought indices measure the balance between moisture demand (evapotranspiration driven by temperature) and moisture supply (precipitation). The Palmer Z Index depicts moisture conditions for the current month, while the Palmer Hydrological Drought Index (PHDI) and Palmer Drought Severity Index (PDSI) depict the current month's cumulative moisture conditions integrated over the last several months. While both the PDSI and PHDI indices show long-term moisture conditions, the PDSI depicts meteorological drought while the PHDI depicts hydrological drought. The PDSI map shows less severe and extensive drought in the West and parts of the Plains than the PHDI map because the meteorological conditions that produce drought are not as long-lasting as the hydrological impacts.
|
 |
Used together, the Palmer Z Index and PHDI maps show that short-term dry conditions occurred over parts of the West and Southern Plains, which had areas in long-term drought during September, maintaining or intensifying drought by the end of October. Short-term dry conditions also occurred over parts of the Intermountain Basin, Northern Plains, and Upper Midwest, reducing areas of long-term wetness.
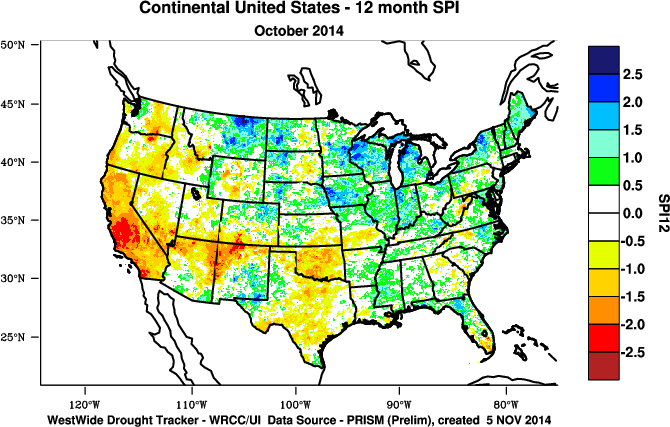
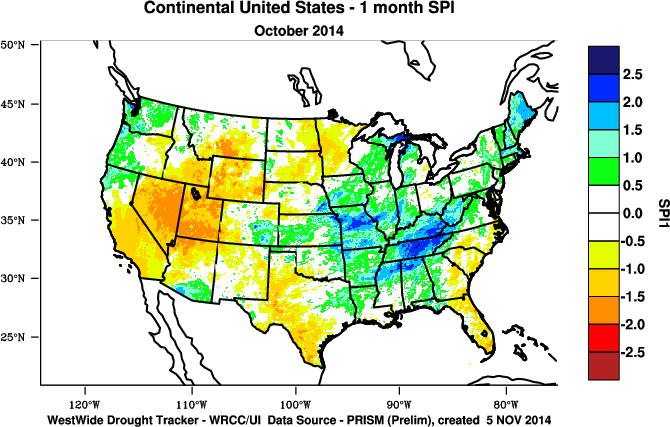
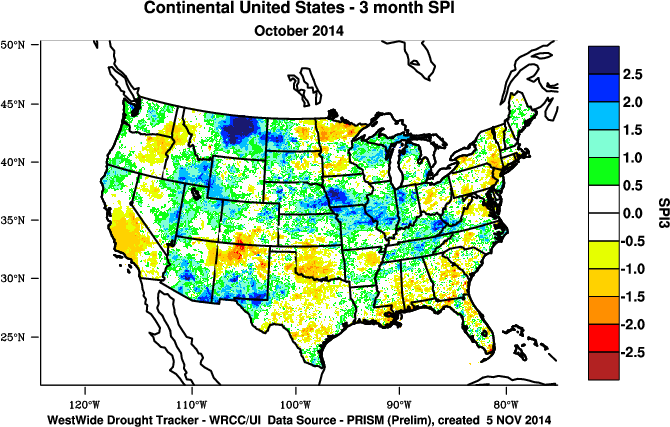
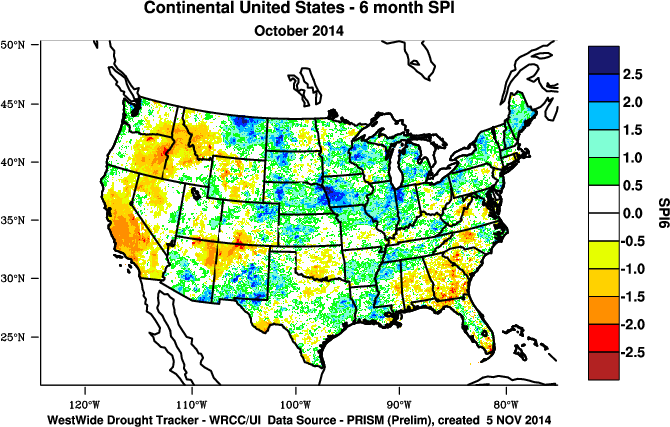
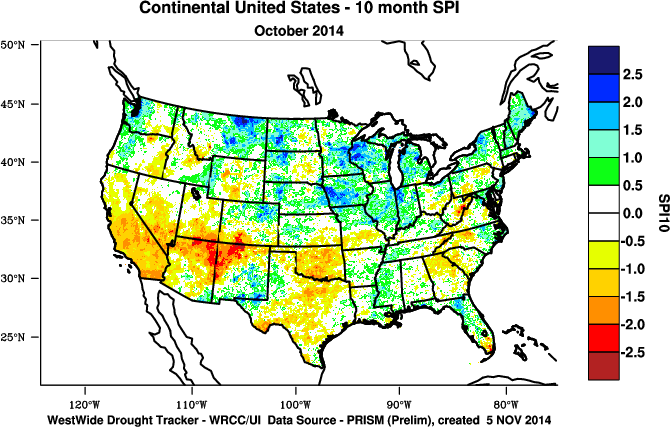
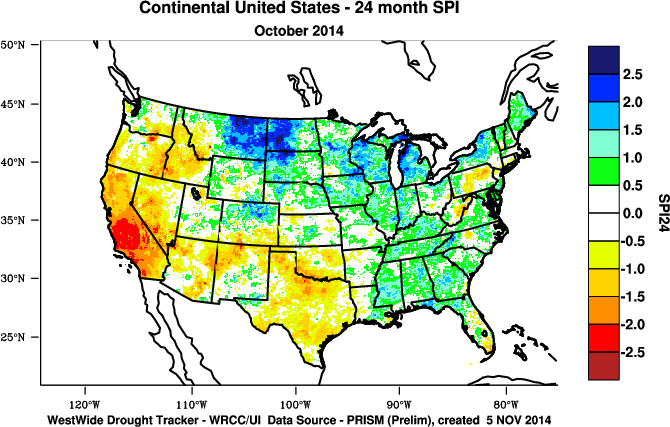
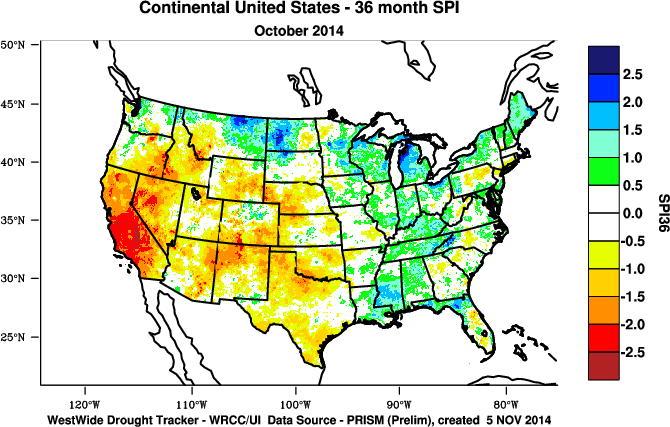
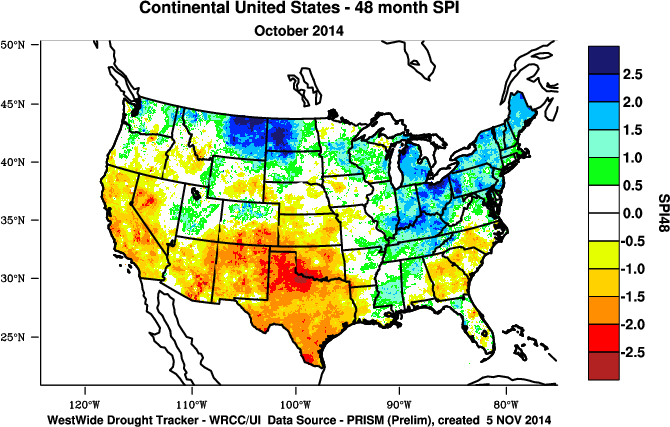
Standardized Precipitation Index
The Standardized Precipitation Index (SPI) measures moisture supply. The SPI maps here show the spatial extent of anomalously wet and dry areas at time scales ranging from 1 month to 24 months.
 |
 |
 |
The SPI maps illustrate how moisture conditions have varied considerably through time and space over the last two years. October was dry across much of the Southwest to Intermountain Basin and Northern Rockies, marking a change from summer monsoon wetness. The summer monsoon showers gave much of the West wet conditions at the 3- to 6-month time scales, but dryness dominated at the 24-month time scale. California was the exception, with dry conditions dominating at most time scales. The Northern Plains shows up as dry at the 1- to 2-month time scales, but wet conditions dominate at longer time scales. The Southern Plains show areas of dryness at all time scales except 6 months. Portions of the Southeast and Gulf of Mexico coast are dry at the 1-, 3-, and 6-month time scales, but wet at 24 months. Dry conditions are evident across parts of the Northeast at 2 to 3 months, and across parts of southern New England at the longer time scales.
 |
 |
 |
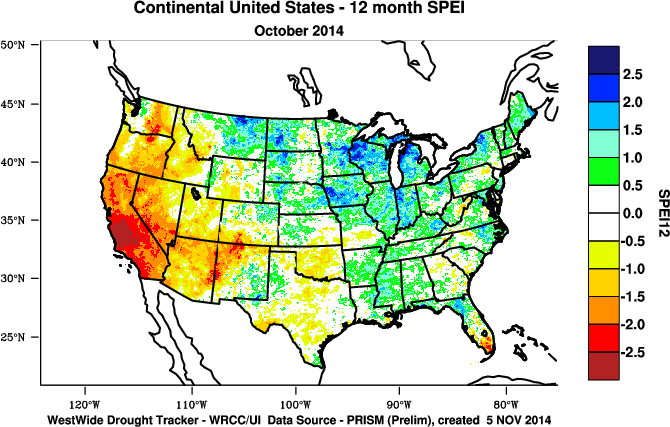
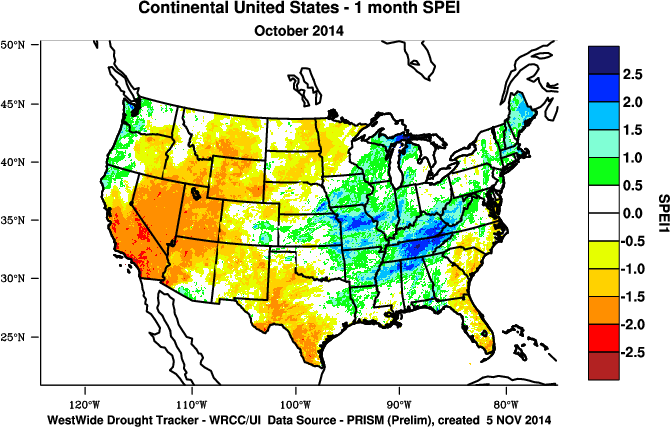
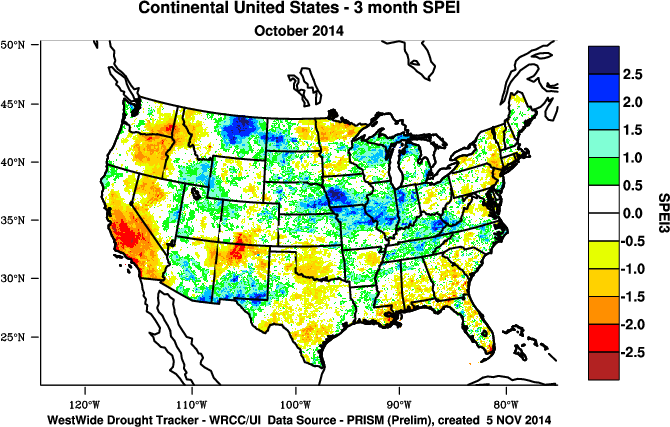
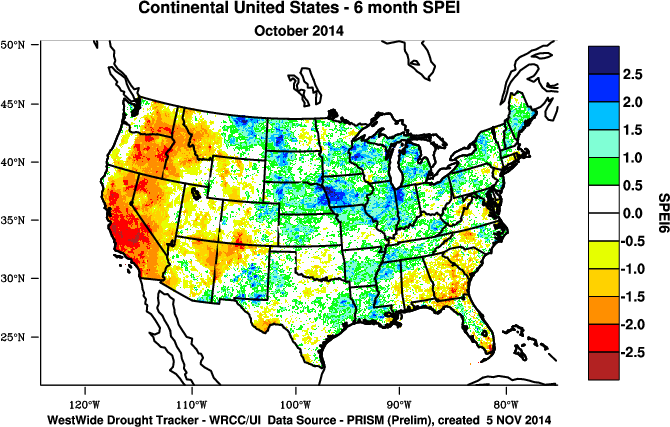
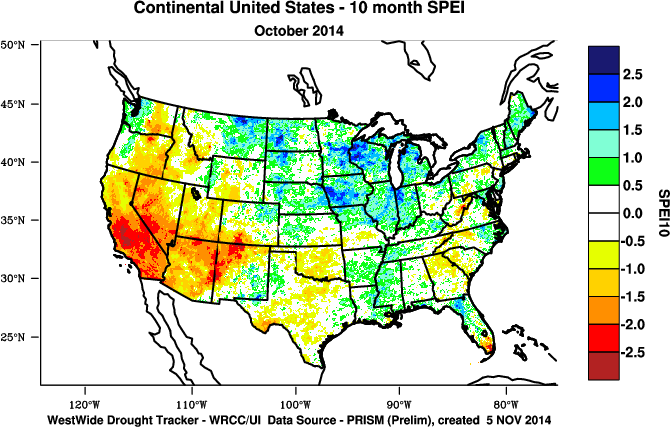
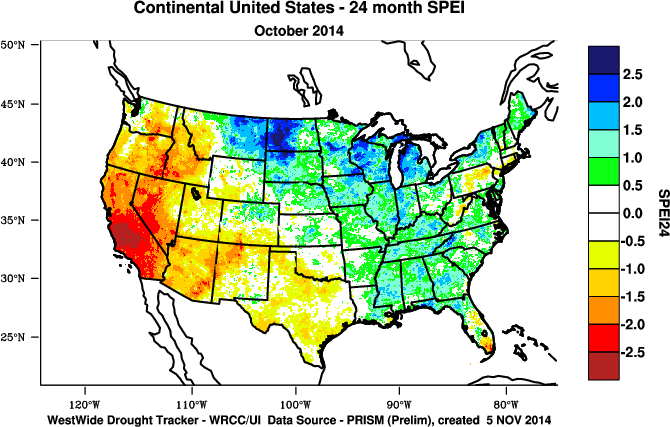
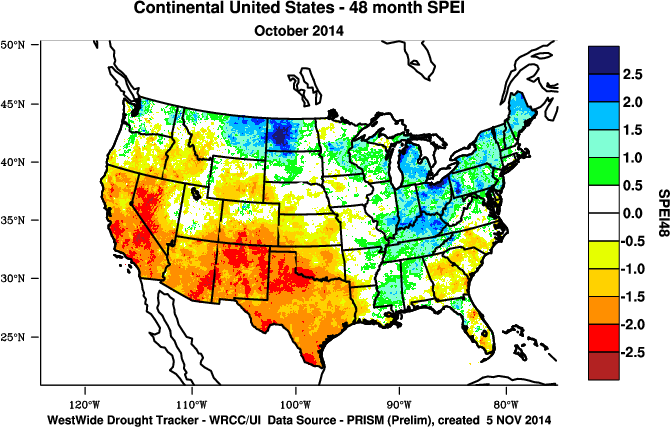
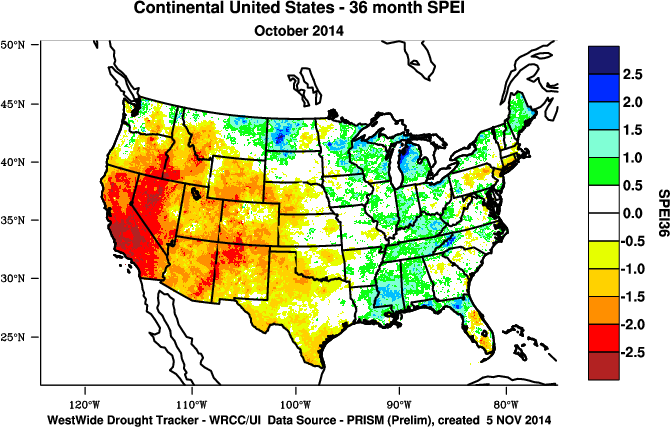
Standardized Precipitation Evapotranspiration Index
The SPI measures water supply (precipitation), while the SPEI (Standardized Precipitation Evapotranspiration Index) measures the combination of water supply (precipitation) and water demand (evapotranspiration as computed from temperature). Warmer temperatures tend to increase evapotranspiration, which generally makes droughts more intense.
 |
 |
A circulation pattern with an intense long-wave ridge in the upper atmosphere, entrenched over the West, and an associated cool trough over the eastern CONUS, has persisted for much of the last one to two years. Unusually warm temperatures have been associated with the ridge, which has intensified evapotranspiration and resulted in more severe drought in the West as measured by the SPEI (last 1, 3, 6, 10, 12, 24, 36, 48 months) when compared to the SPI (last 1, 3, 6, 10, 12, 24, 36, 48 months). This is evident at all time scales. Conversely, the unusually colder-than-normal temperatures underneath an upper-level long-wave trough east of the Rockies reduced the severity of drought in the Midwest as seen by less severe SPEI values when compared to SPI values.
 |
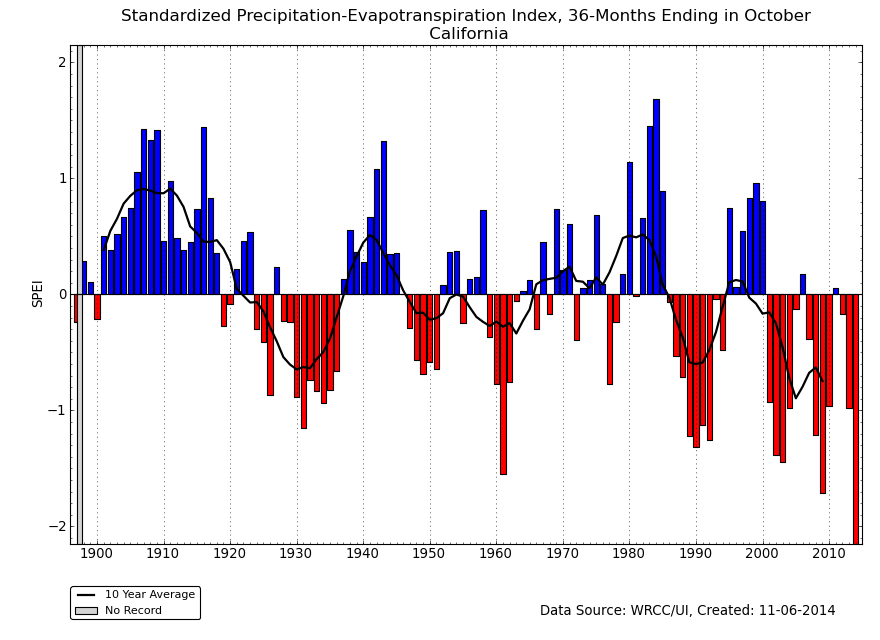 |
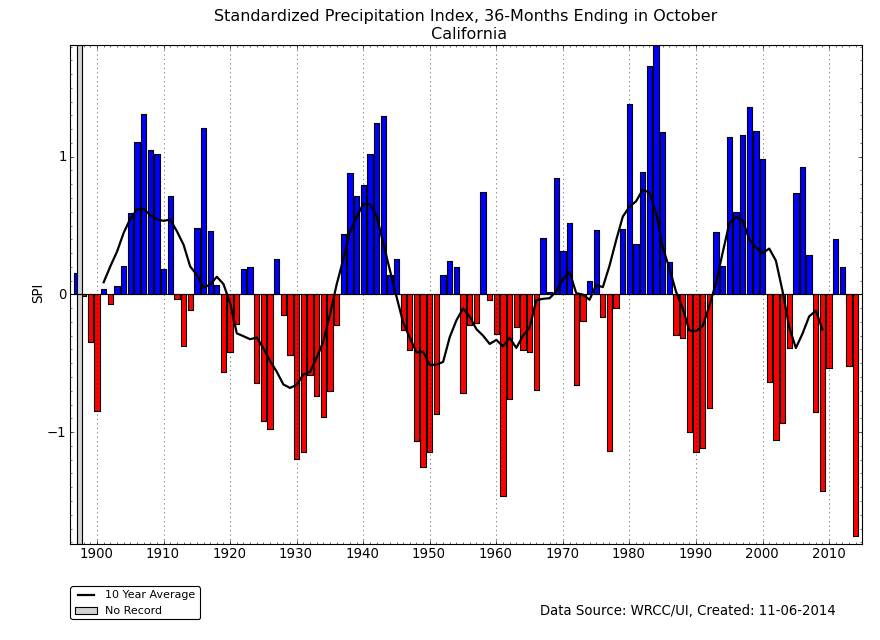
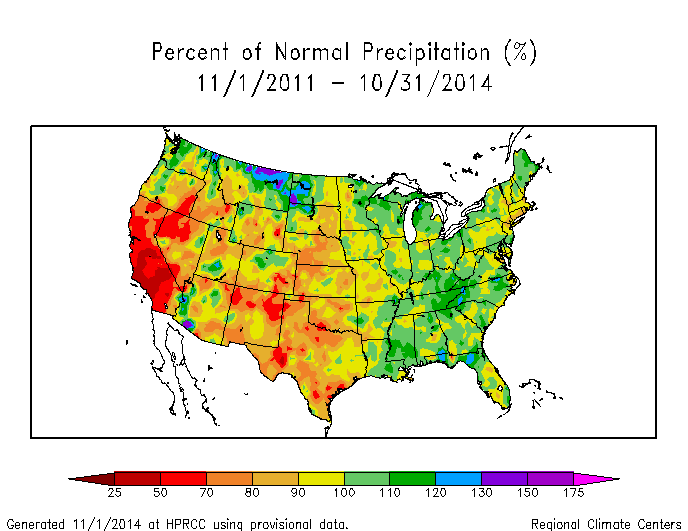
The dryness and heat has been especially intense over California. The last 36 months (November 2011-October 2014) has been the driest and warmest such 36-month period on record. This combination has resulted in the most extreme 36-month SPEI on record. By this measure, the current drought is the most severe drought for California in the last 120 years. The record dryness has also made the November 2011-October 2014 SPI the most severe 36-month SPI on record, but when the record heat is included, the SPEI is more severe than the SPI.
Agricultural, Hydrological, and Meteorological Indices and Impacts
 |
 |
Drought conditions were reflected in numerous agricultural, hydrological, and other meteorological indicators, both observed and modeled.
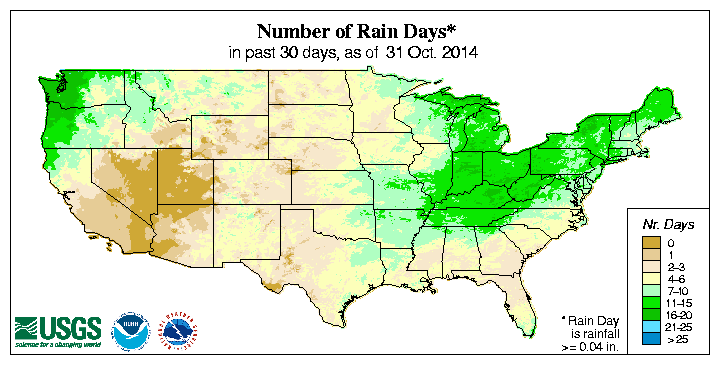
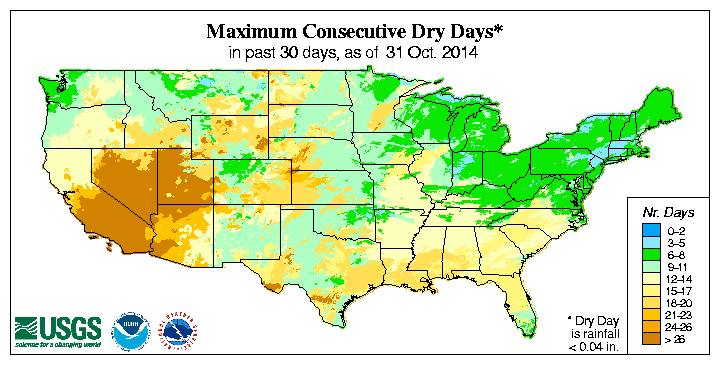
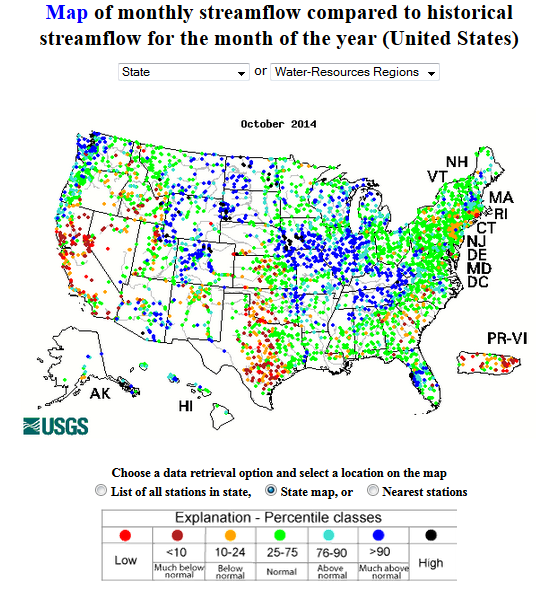
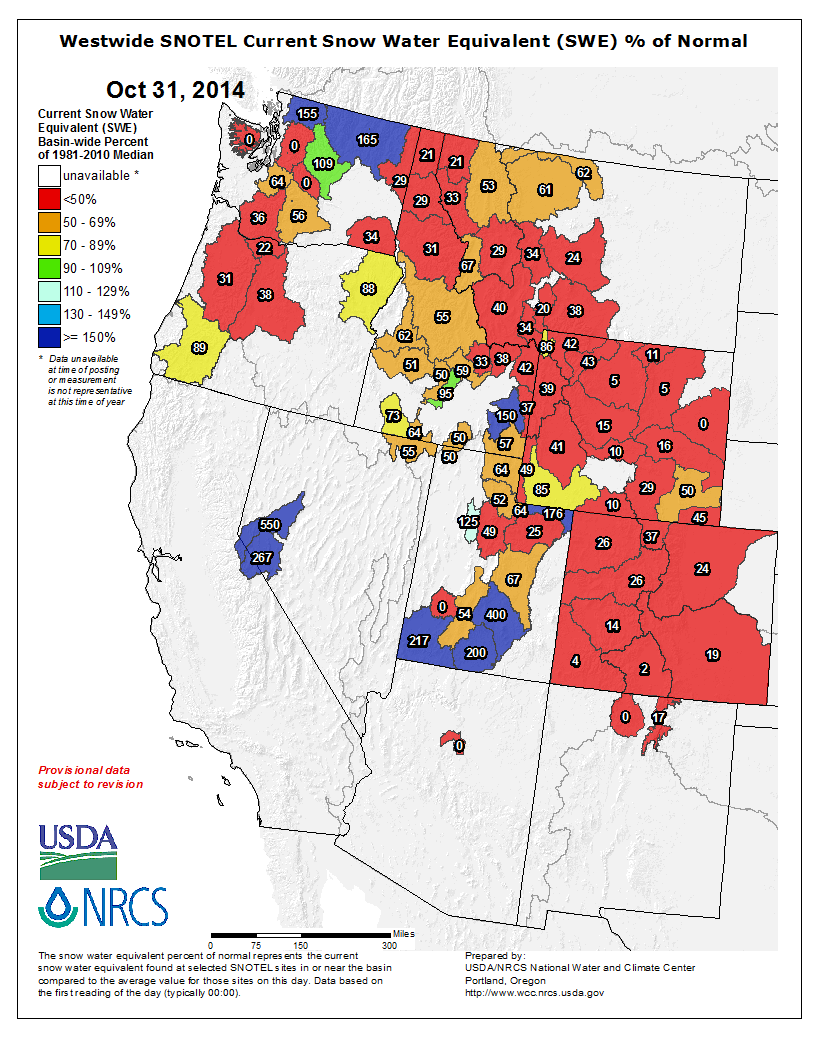
Most of California was drier than normal during October 2014, but above-normal precipitation in the northern counties skewed the state's monthly precipitation rank (48th driest for October). There were few days with precipitation, resulting in long runs of consecutive dry days, from southern California and Arizona to the Central Rockies. Persistent dryness in California and adjacent states for the last 12 to 36 months has reduced runoff and lowered stream and reservoir levels, depleted soil moisture, and ravaged agriculture and pasture and range land. According to an October 27th U.S. Department of Agriculture (USDA) report, 75 percent of California's pasture and range land was rated in poor to very poor condition and 85 percent of the state's topsoil and subsoil was rated short or very short of moisture (dry to very dry). Even with the recent precipitation in the Pacific Northwest, more than 50 percent of the topsoil and subsoil was rated short or very short of moisture in Oregon and Washington. The summer monsoon rainfall improved conditions in the intermountain basin states, but soil moisture continued dry, with 40 percent or more of the subsoil short or very short in Arizona, Colorado, and Utah, and 50 percent or more of the topsoil and subsoil in Nevada and New Mexico still short or very short of moisture. Although this is early in the season, the western snow season has gotten off to a slow start with only the high elevation stations having an established snow pack and most basins having below normal snow water content.
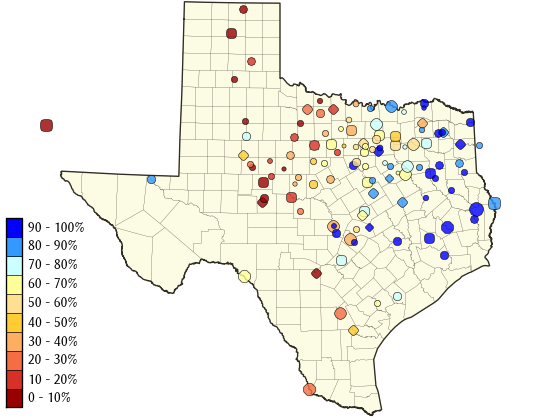
In the Southern Plains, a dry October contributed to reduced runoff, lowered stream and reservoir levels (especially in Texas), and drying soils. Precipitation during the last six months over parts of the Southern Plains has helped replenish soil moisture in the surface layers, but the subsoil moisture and vegetation have had little chance to recover from the severe drought of 2012-2013. Over sixty percent of the subsoil was still rated short or very short of moisture by the USDA in Oklahoma (72%) and Texas (61%).
Below-normal precipitation for the last two to four months has dried soils in parts of the Northern Plains to Upper Midwest and Northeast. Nearly 50 percent (49%) of the subsoil was rated short or very short of moisture, and 45 percent of the pasture and range land was rated in poor to very poor condition, in Connecticut.
Regional Discussion
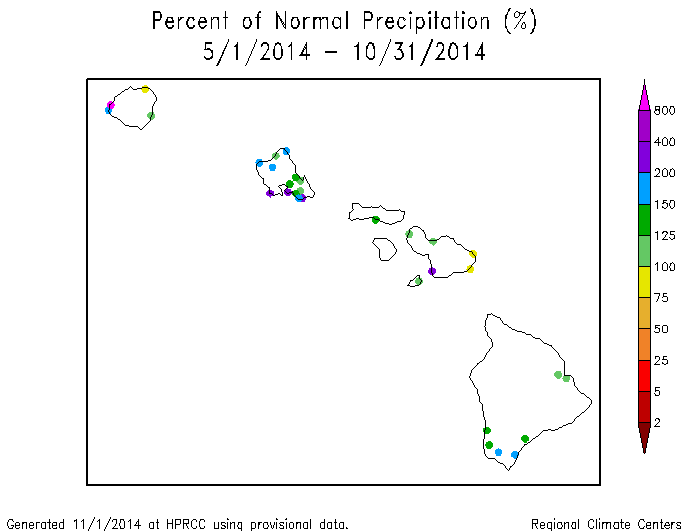
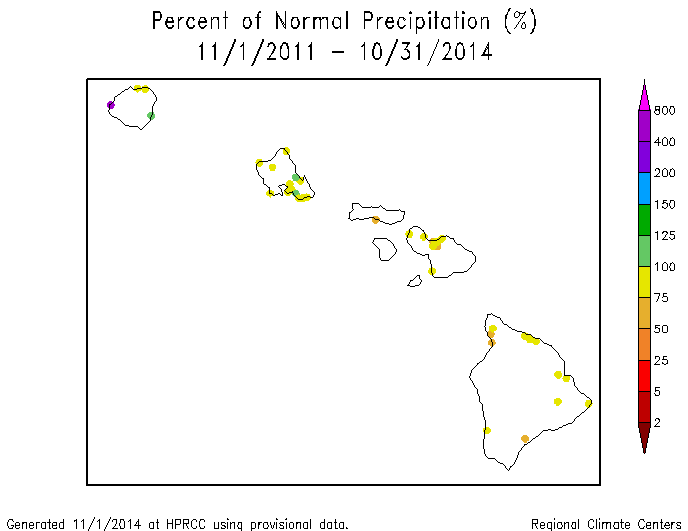
Hawaii: Moisture from tropical system Ana contributed to Hawaii having an October 2014 precipitation pattern that was wetter than normal in the southern coastal areas of all of the main islands, but drier than normal on the windward (northeast) side of Maui and The Big Island. This pattern persisted through the last 2 to 3 months. Rainfall earlier in the year combined to give most of the state a wetter-than-normal pattern in the short-term (last 4, 6, 7, 10, 12 months). But drier-than-normal conditions dominate at the longer term (last 24 and 36 months). On the USDM map, moderate drought covered less than three percent of the state, reflecting the low reservoir situation in central Molokai and the Upcountry Maui area.
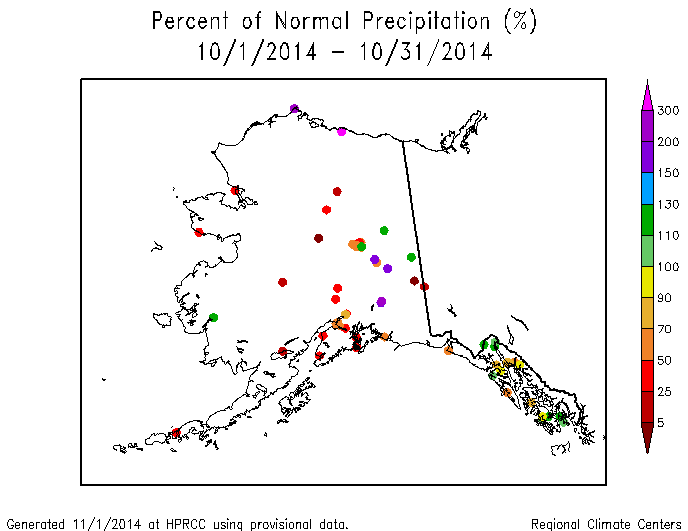
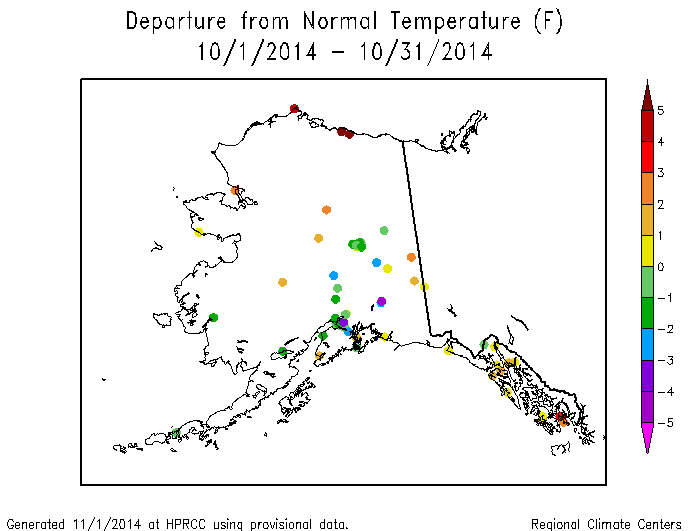
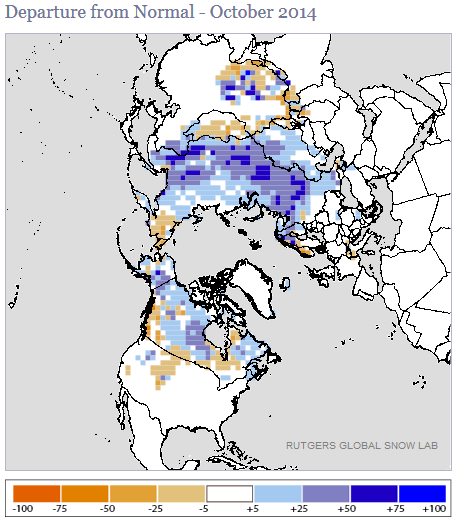
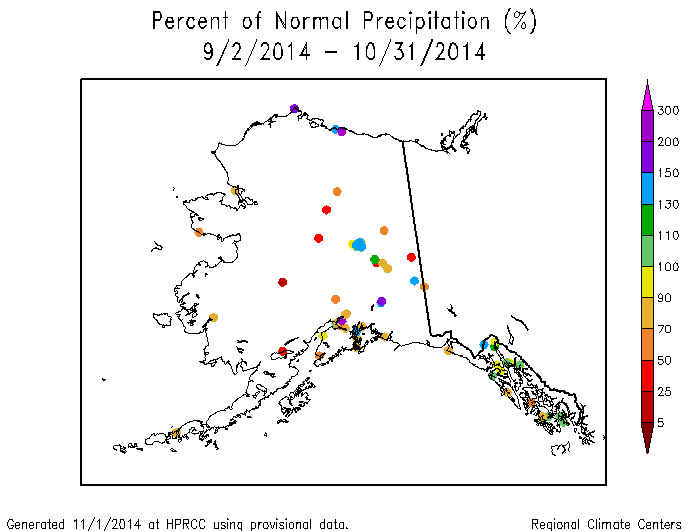
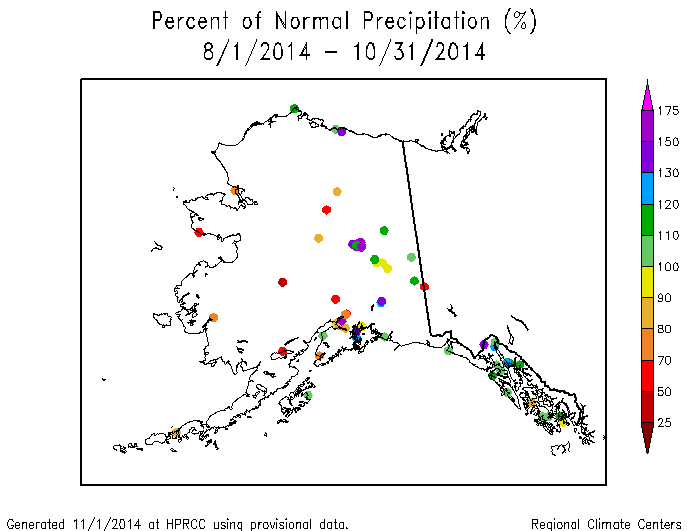
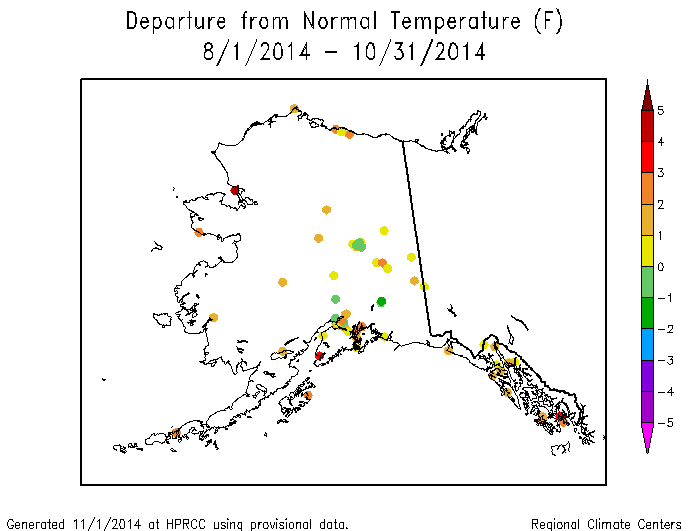
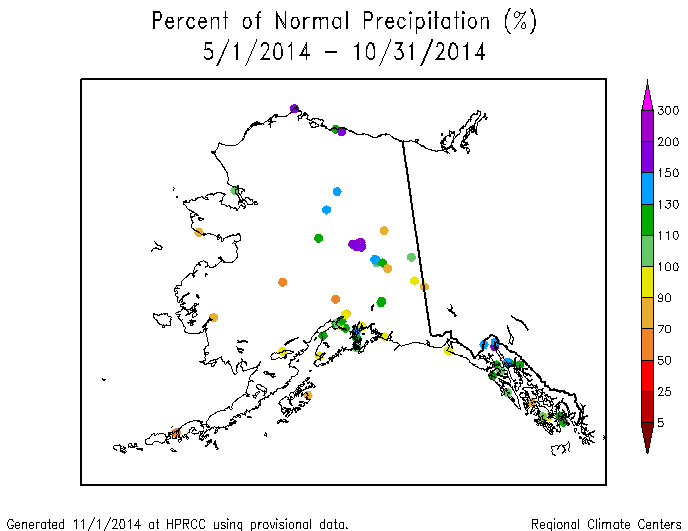
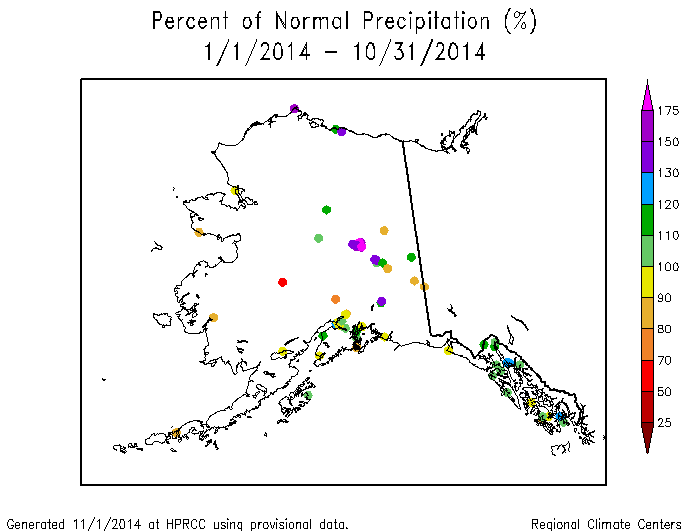
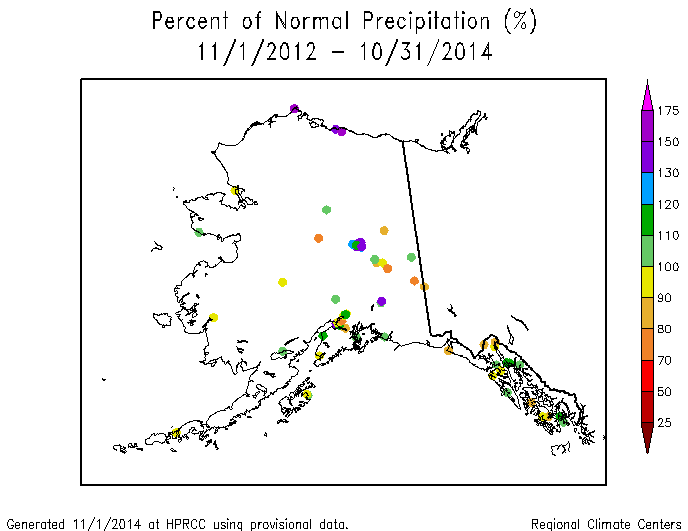
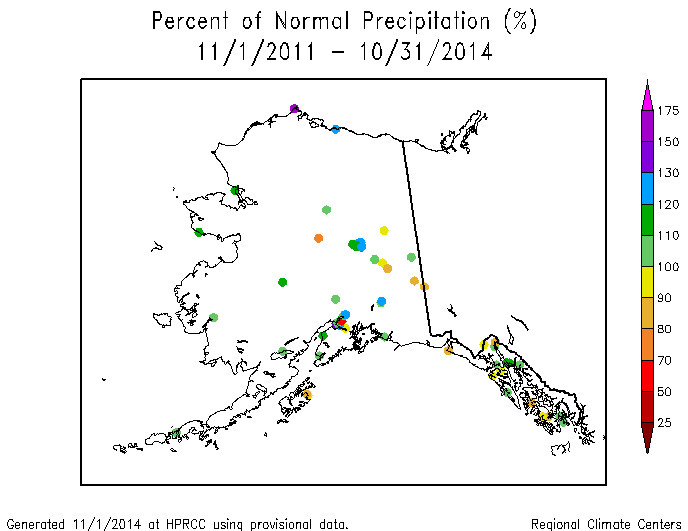
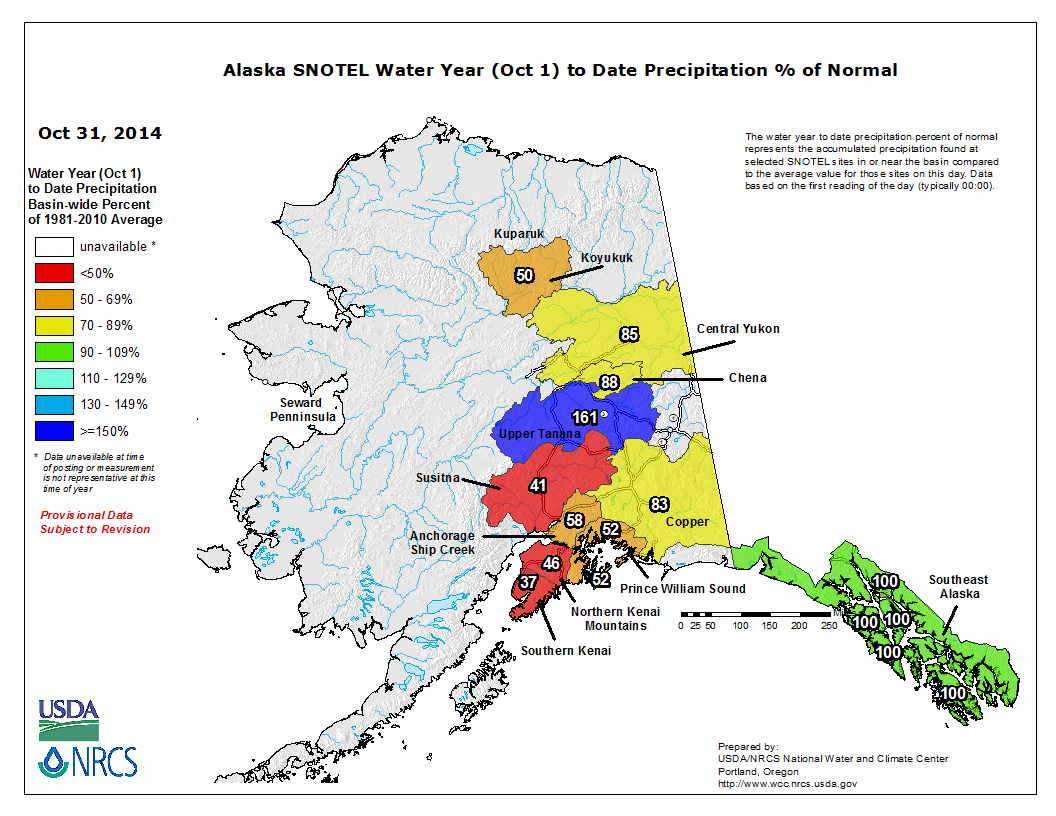
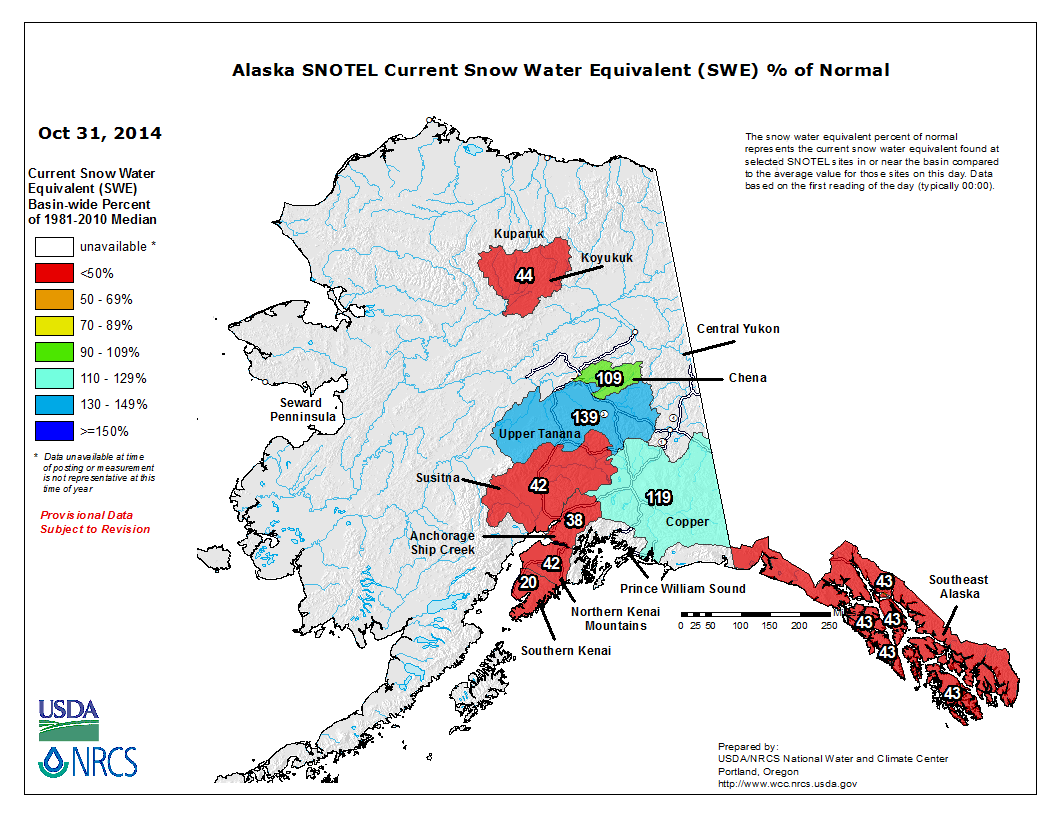
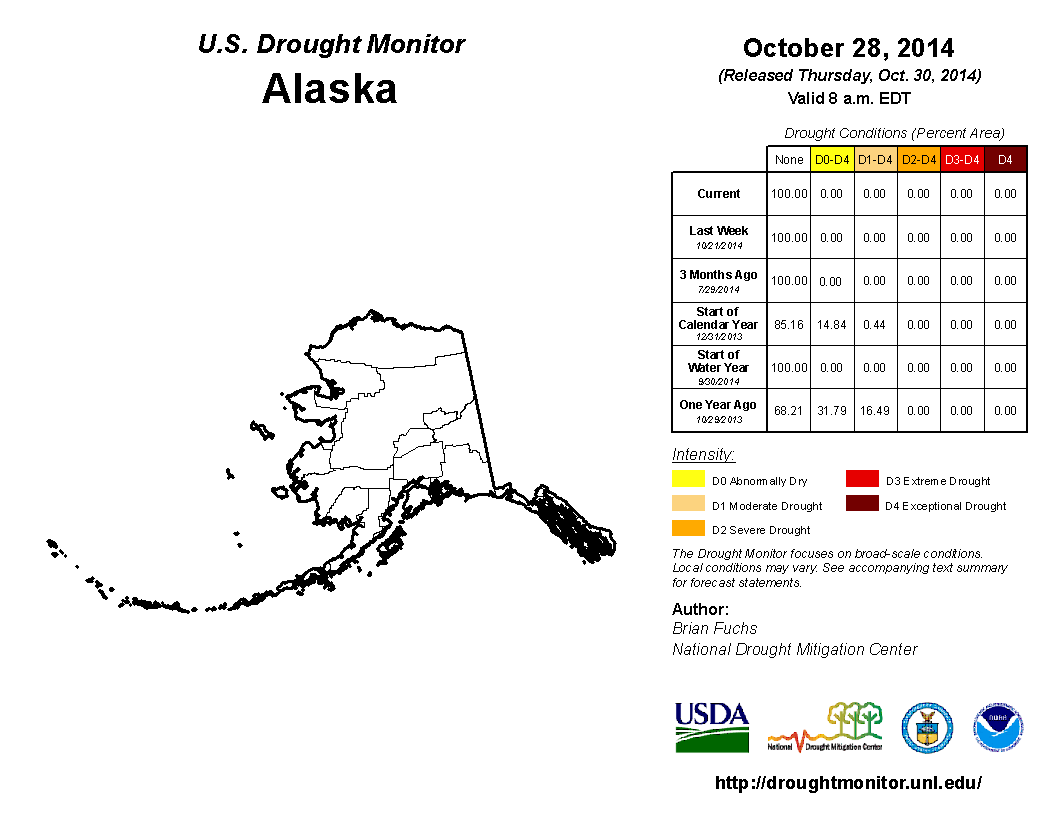
Alaska: Alaska was predominantly drier than normal during October with a mixed temperature pattern. The below-normal precipitation pattern was widespread at 2 months, but was more concentrated in the west at 3 months. The 3-month temperature pattern was predominantly warmer than normal. At intermediate time scales, the precipitation pattern was drier than normal in the southwest, wetter than normal in the north and in the panhandle, and mixed in between (last 4, 6, 7, 10, and 12 months). The pattern becomes mixed at the longer time scales (last 24 and 36 months). Based on the high elevation (SNOTEL) stations data, most of the basins were drier than normal for the water year that just started (October 1-31, 2014) with a mixed pattern of snow water content anomalies. The October 28th USDM map was free of drought and abnormal dryness.
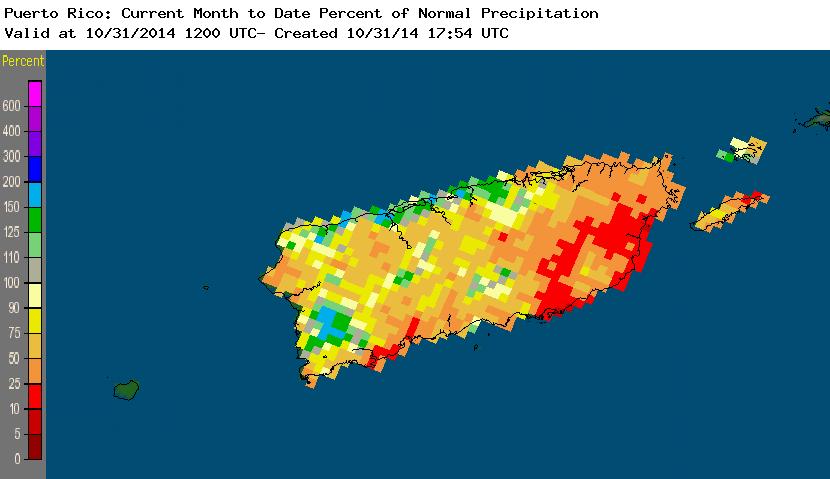
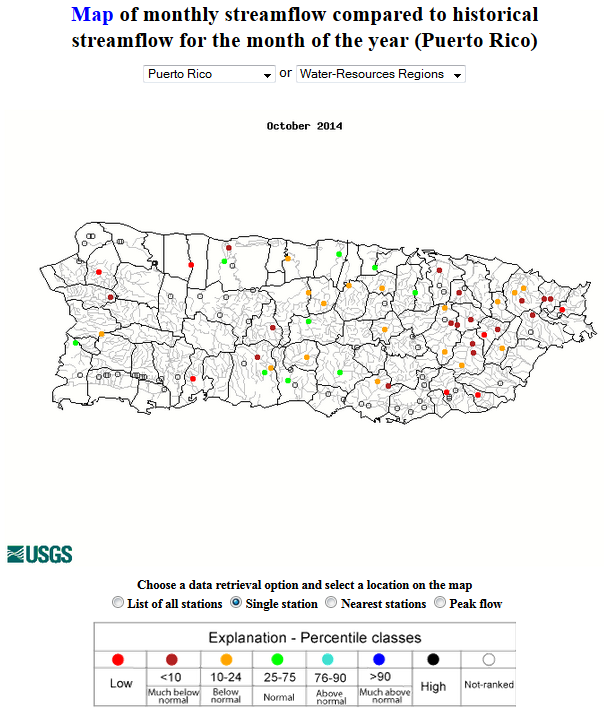
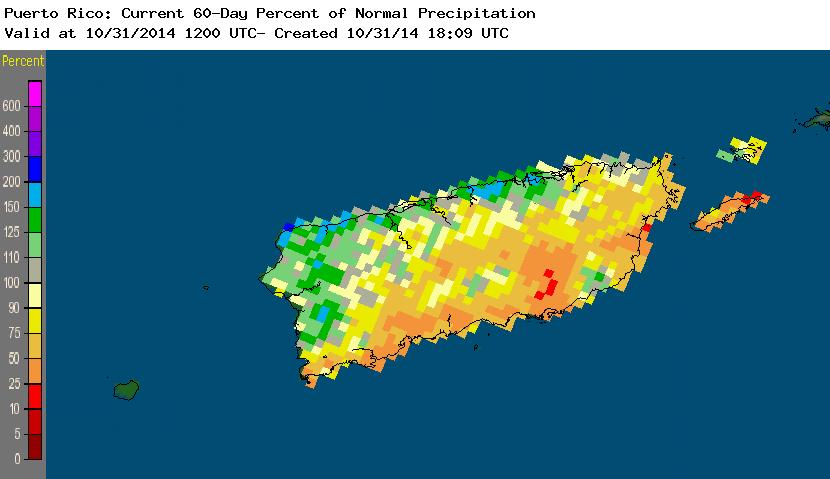
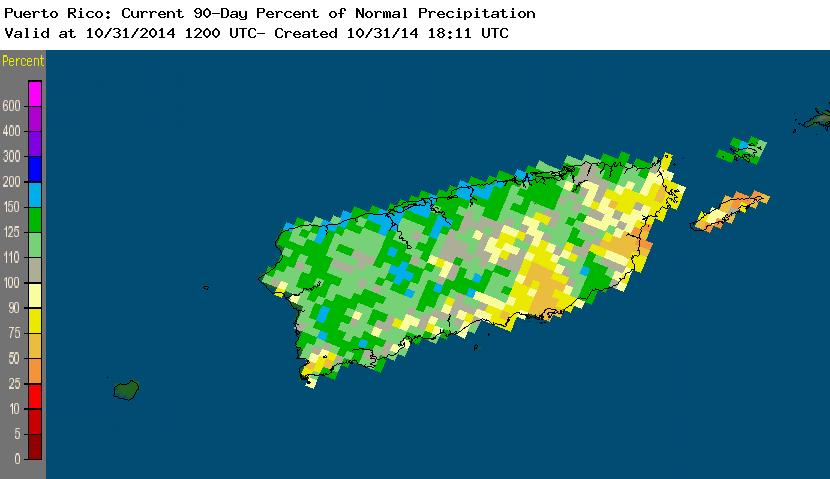
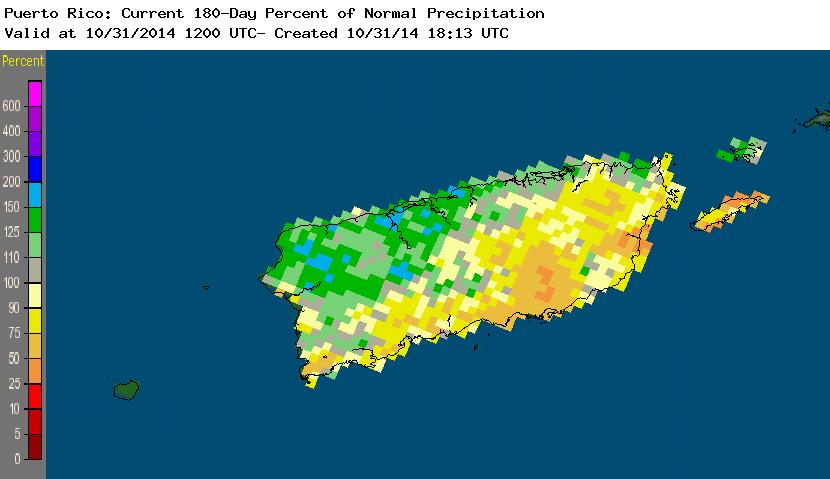
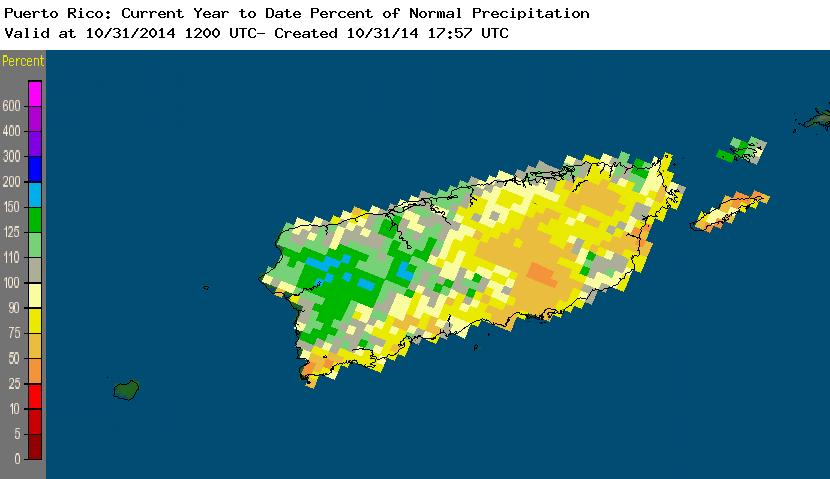
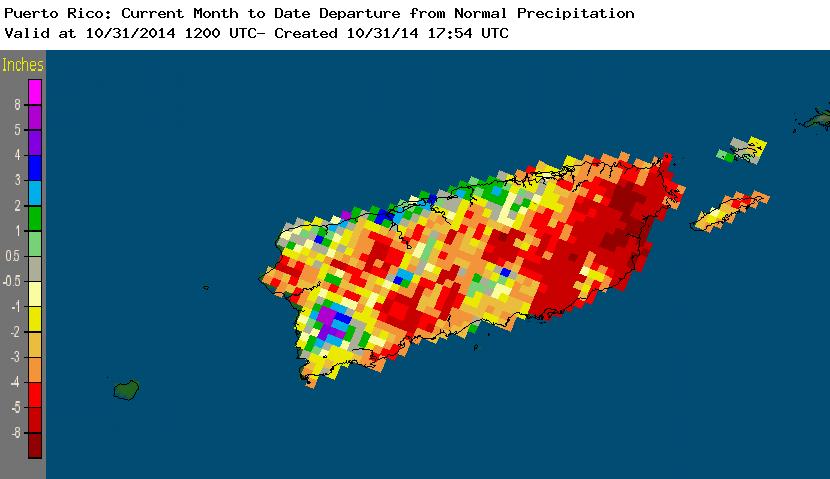
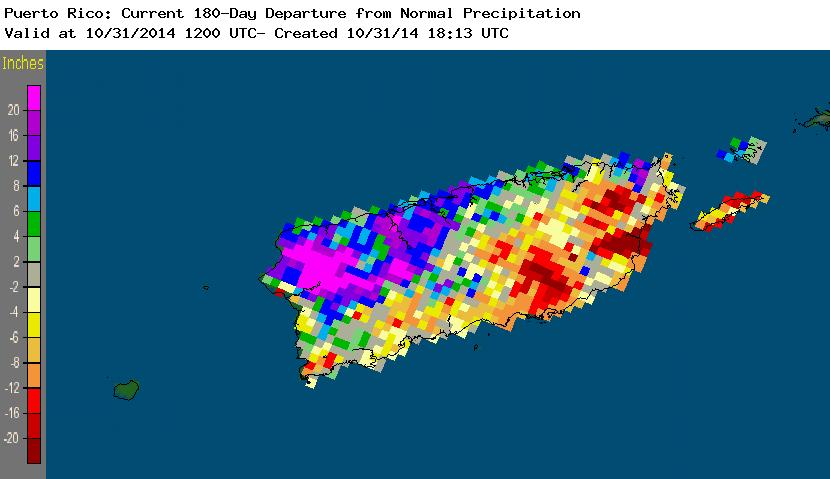
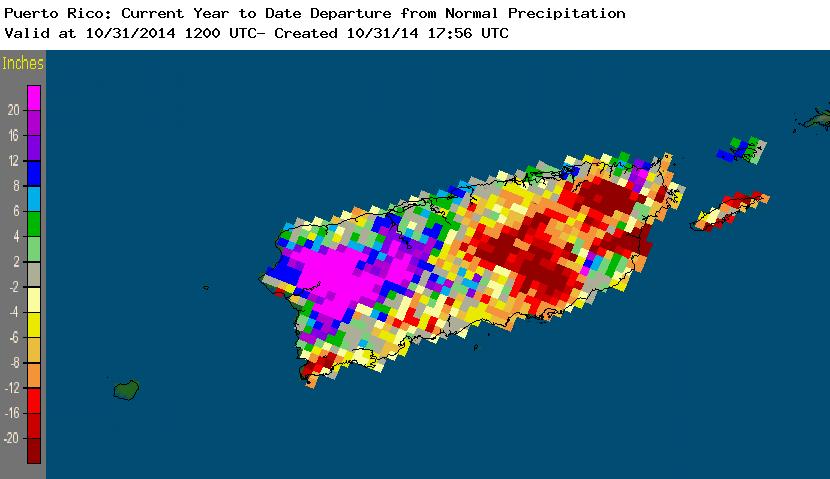
Puerto Rico: October was drier than normal for most of Puerto Rico, but especially so in the southeast, with widespread below-normal streamflow. The southern and eastern parts of the island were drier than normal for the last 2 months, but tropical rains in August gave most of the state a wetter-than-normal pattern for the 3-month time scale. Dryness in the south central to northeast areas re-asserted itself at the longer time scales (last 6 and 10 months). Rainfall deficits in excess of 5 inches were widespread in the southeast and east during October, and deficits in excess of 12 inches were evident for the last 6 and 10 months. On the October 28th USDM map, about 3 percent of the island was in moderate drought and 19 percent abnormally dry.
 |
|
The October precipitation anomaly pattern of dryness in the West, Plains, and Southeast was reflected in the state ranks, with ten states ranking in the driest third of the historical record. Nevada and Utah each ranked in the top ten driest category with the fifth driest October in the 1895-2014 record.
A variable pattern of precipitation characterized the last 3, 6, and 10 months, with just a few states ranking in the driest third of the historical record. Connecticut was the only state that persistently ranked drier than average at all three of these time scales.
 |
|
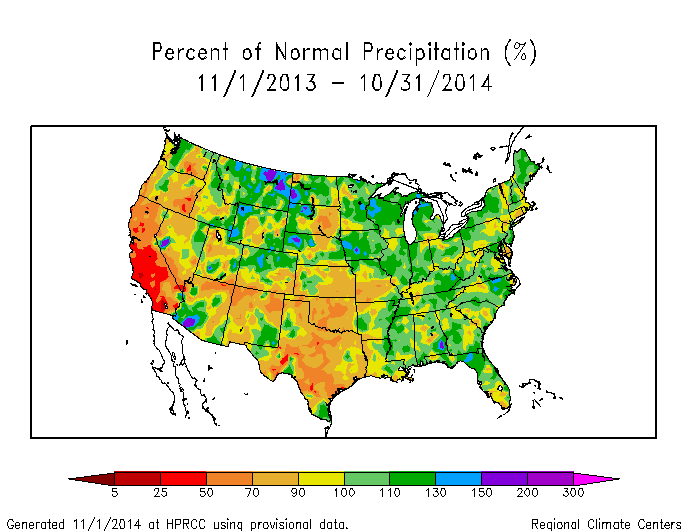
For the last twelve months (October 2013-September 2014), dryness dominated the West Coast and Southern Plains. California was especially hard hit, having the hottest and fourth driest November-October on record. Only 1976-77 (driest), 1923-24 (second driest), and 1975-76 (third driest) had a drier November-October in California. Four other states (Oregon, Oklahoma, Texas, and Connecticut) ranked in the driest third of the historical record for the 12-month period.
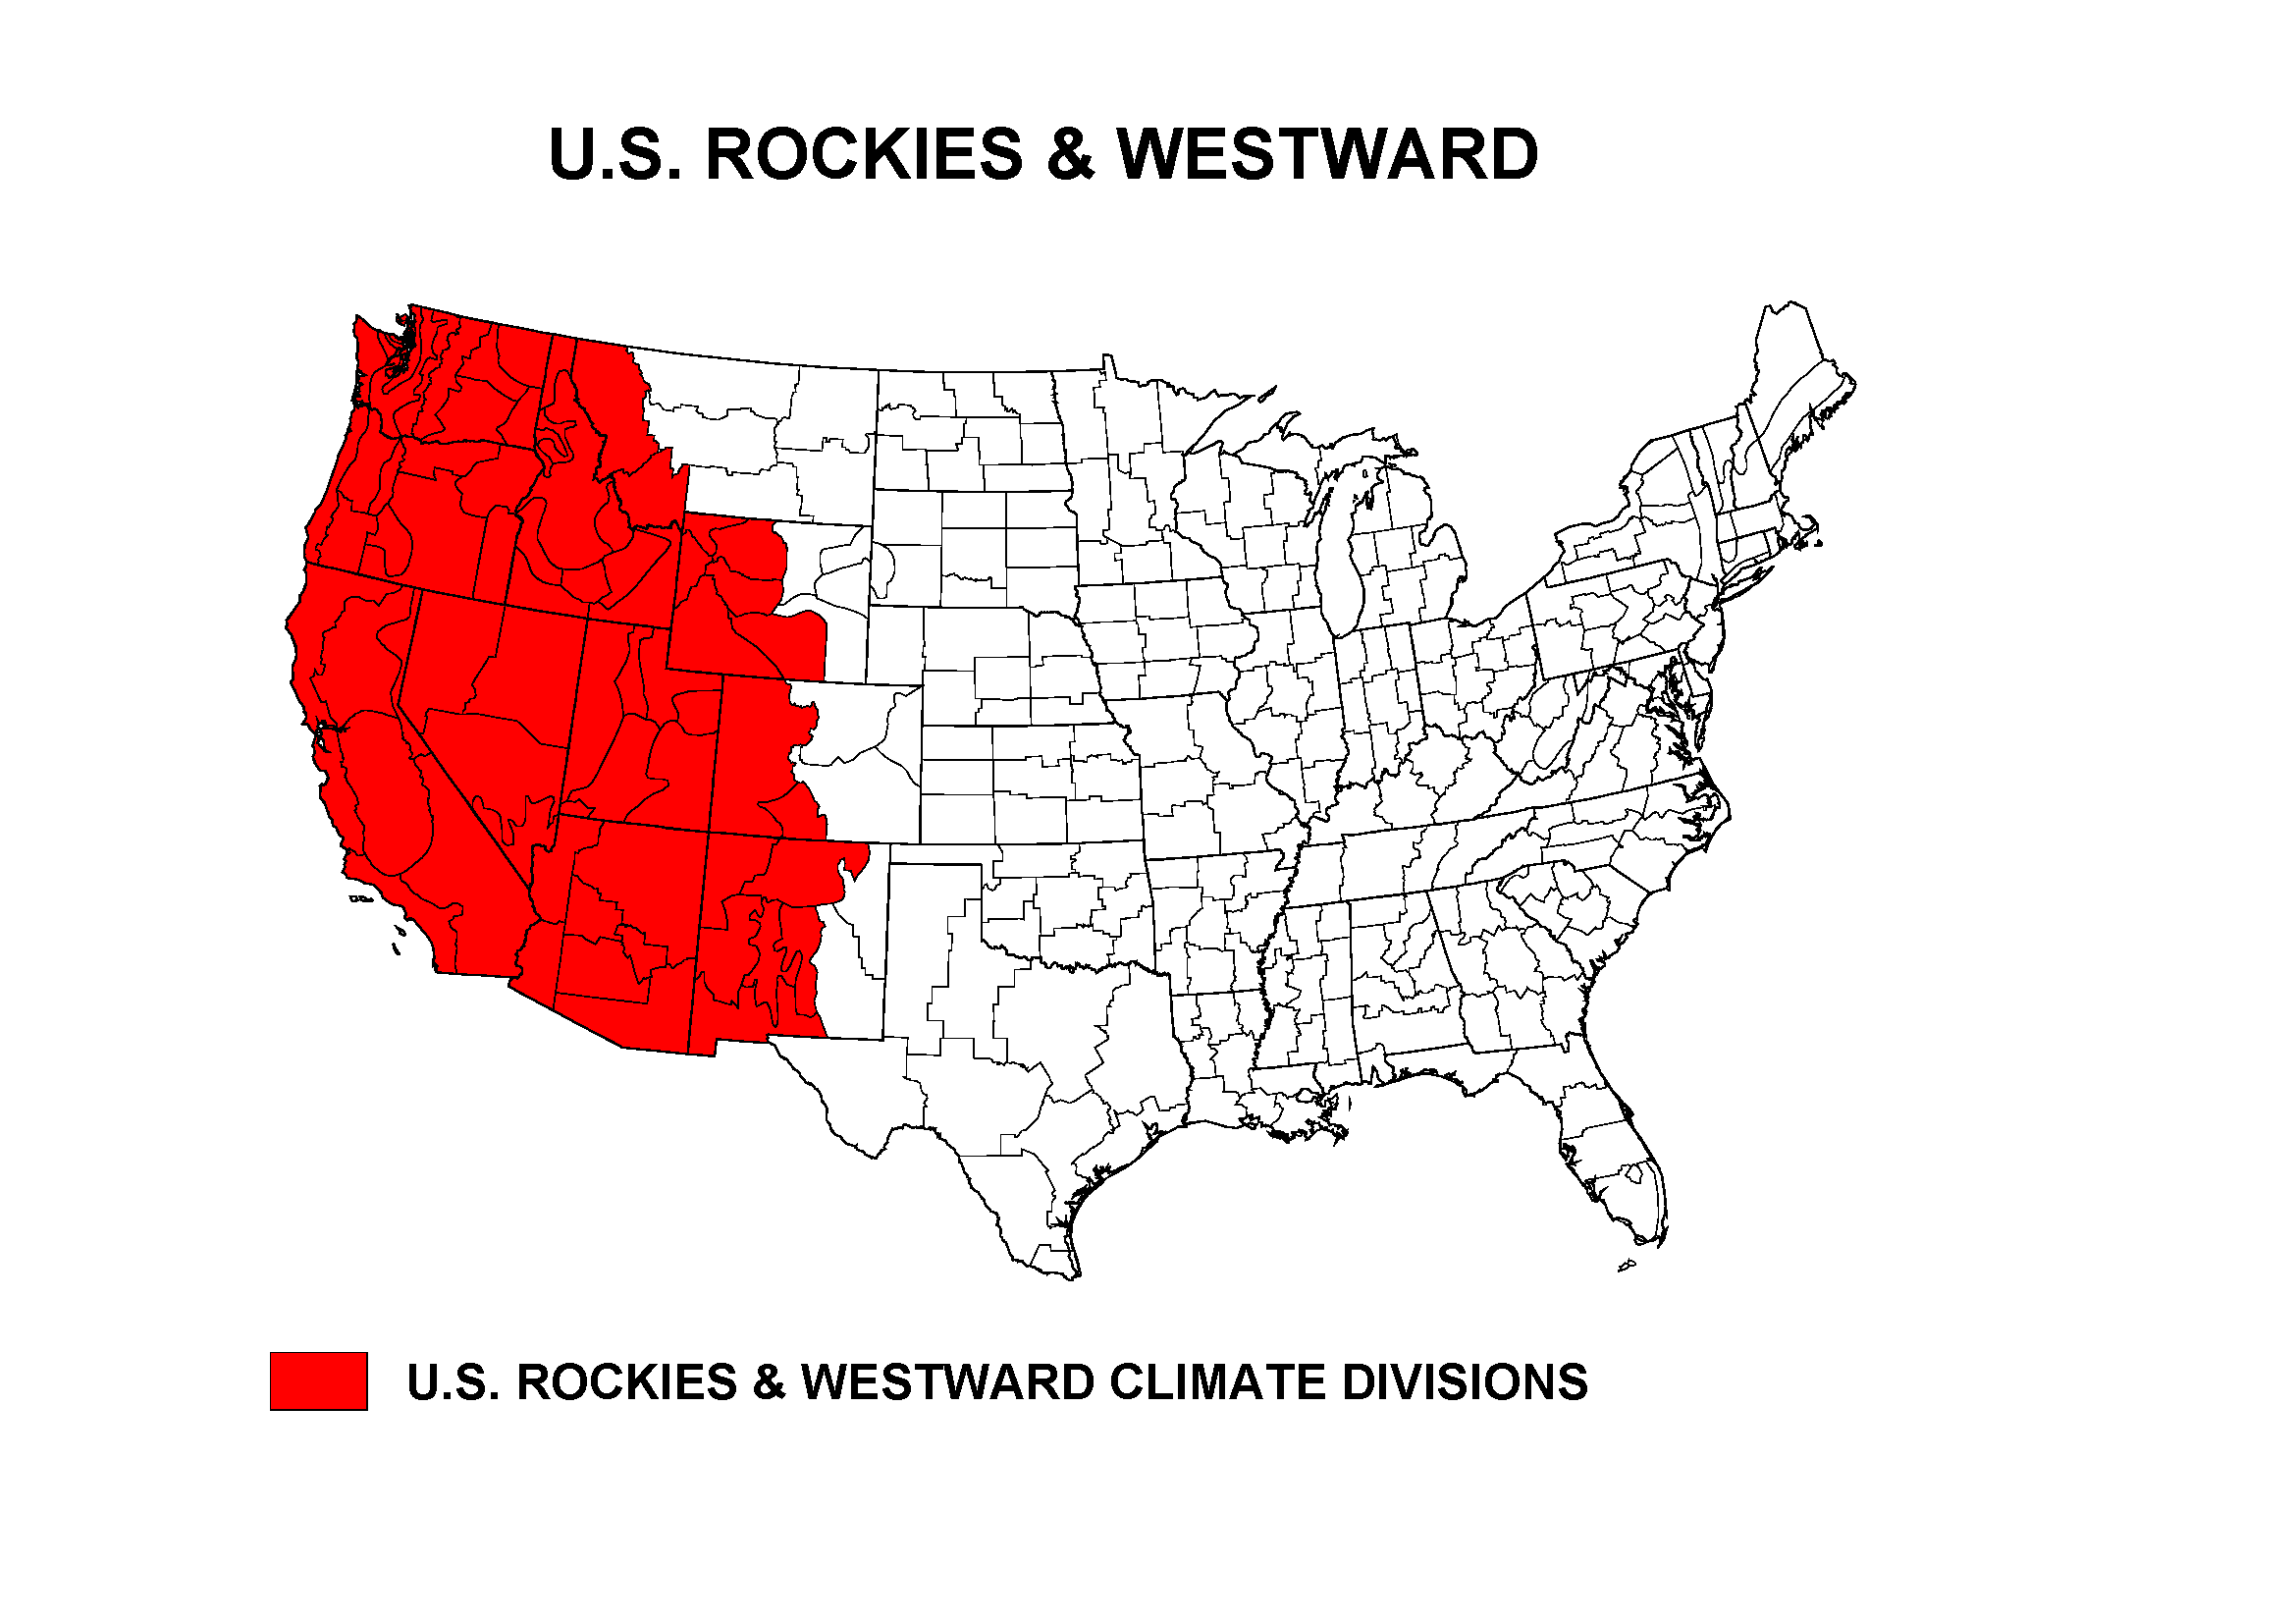
 Percent area of the Western U.S. in moderate to extreme drought, January 1900 to present, based on the Palmer Drought Index. As noted above, dry weather has dominated the West for much of the last several months, resulting in significant hydrological (low lake, reservoir, and stream levels) and agricultural impacts. According to the USDM, 55.1 percent of the West was experiencing moderate to exceptional drought at the end of October, which is slightly less than the previous month. The Palmer Drought Index percent area statistic for the West was 41.1 percent, an increase of about 10 percentage points from the previous month. |
|
|
 |
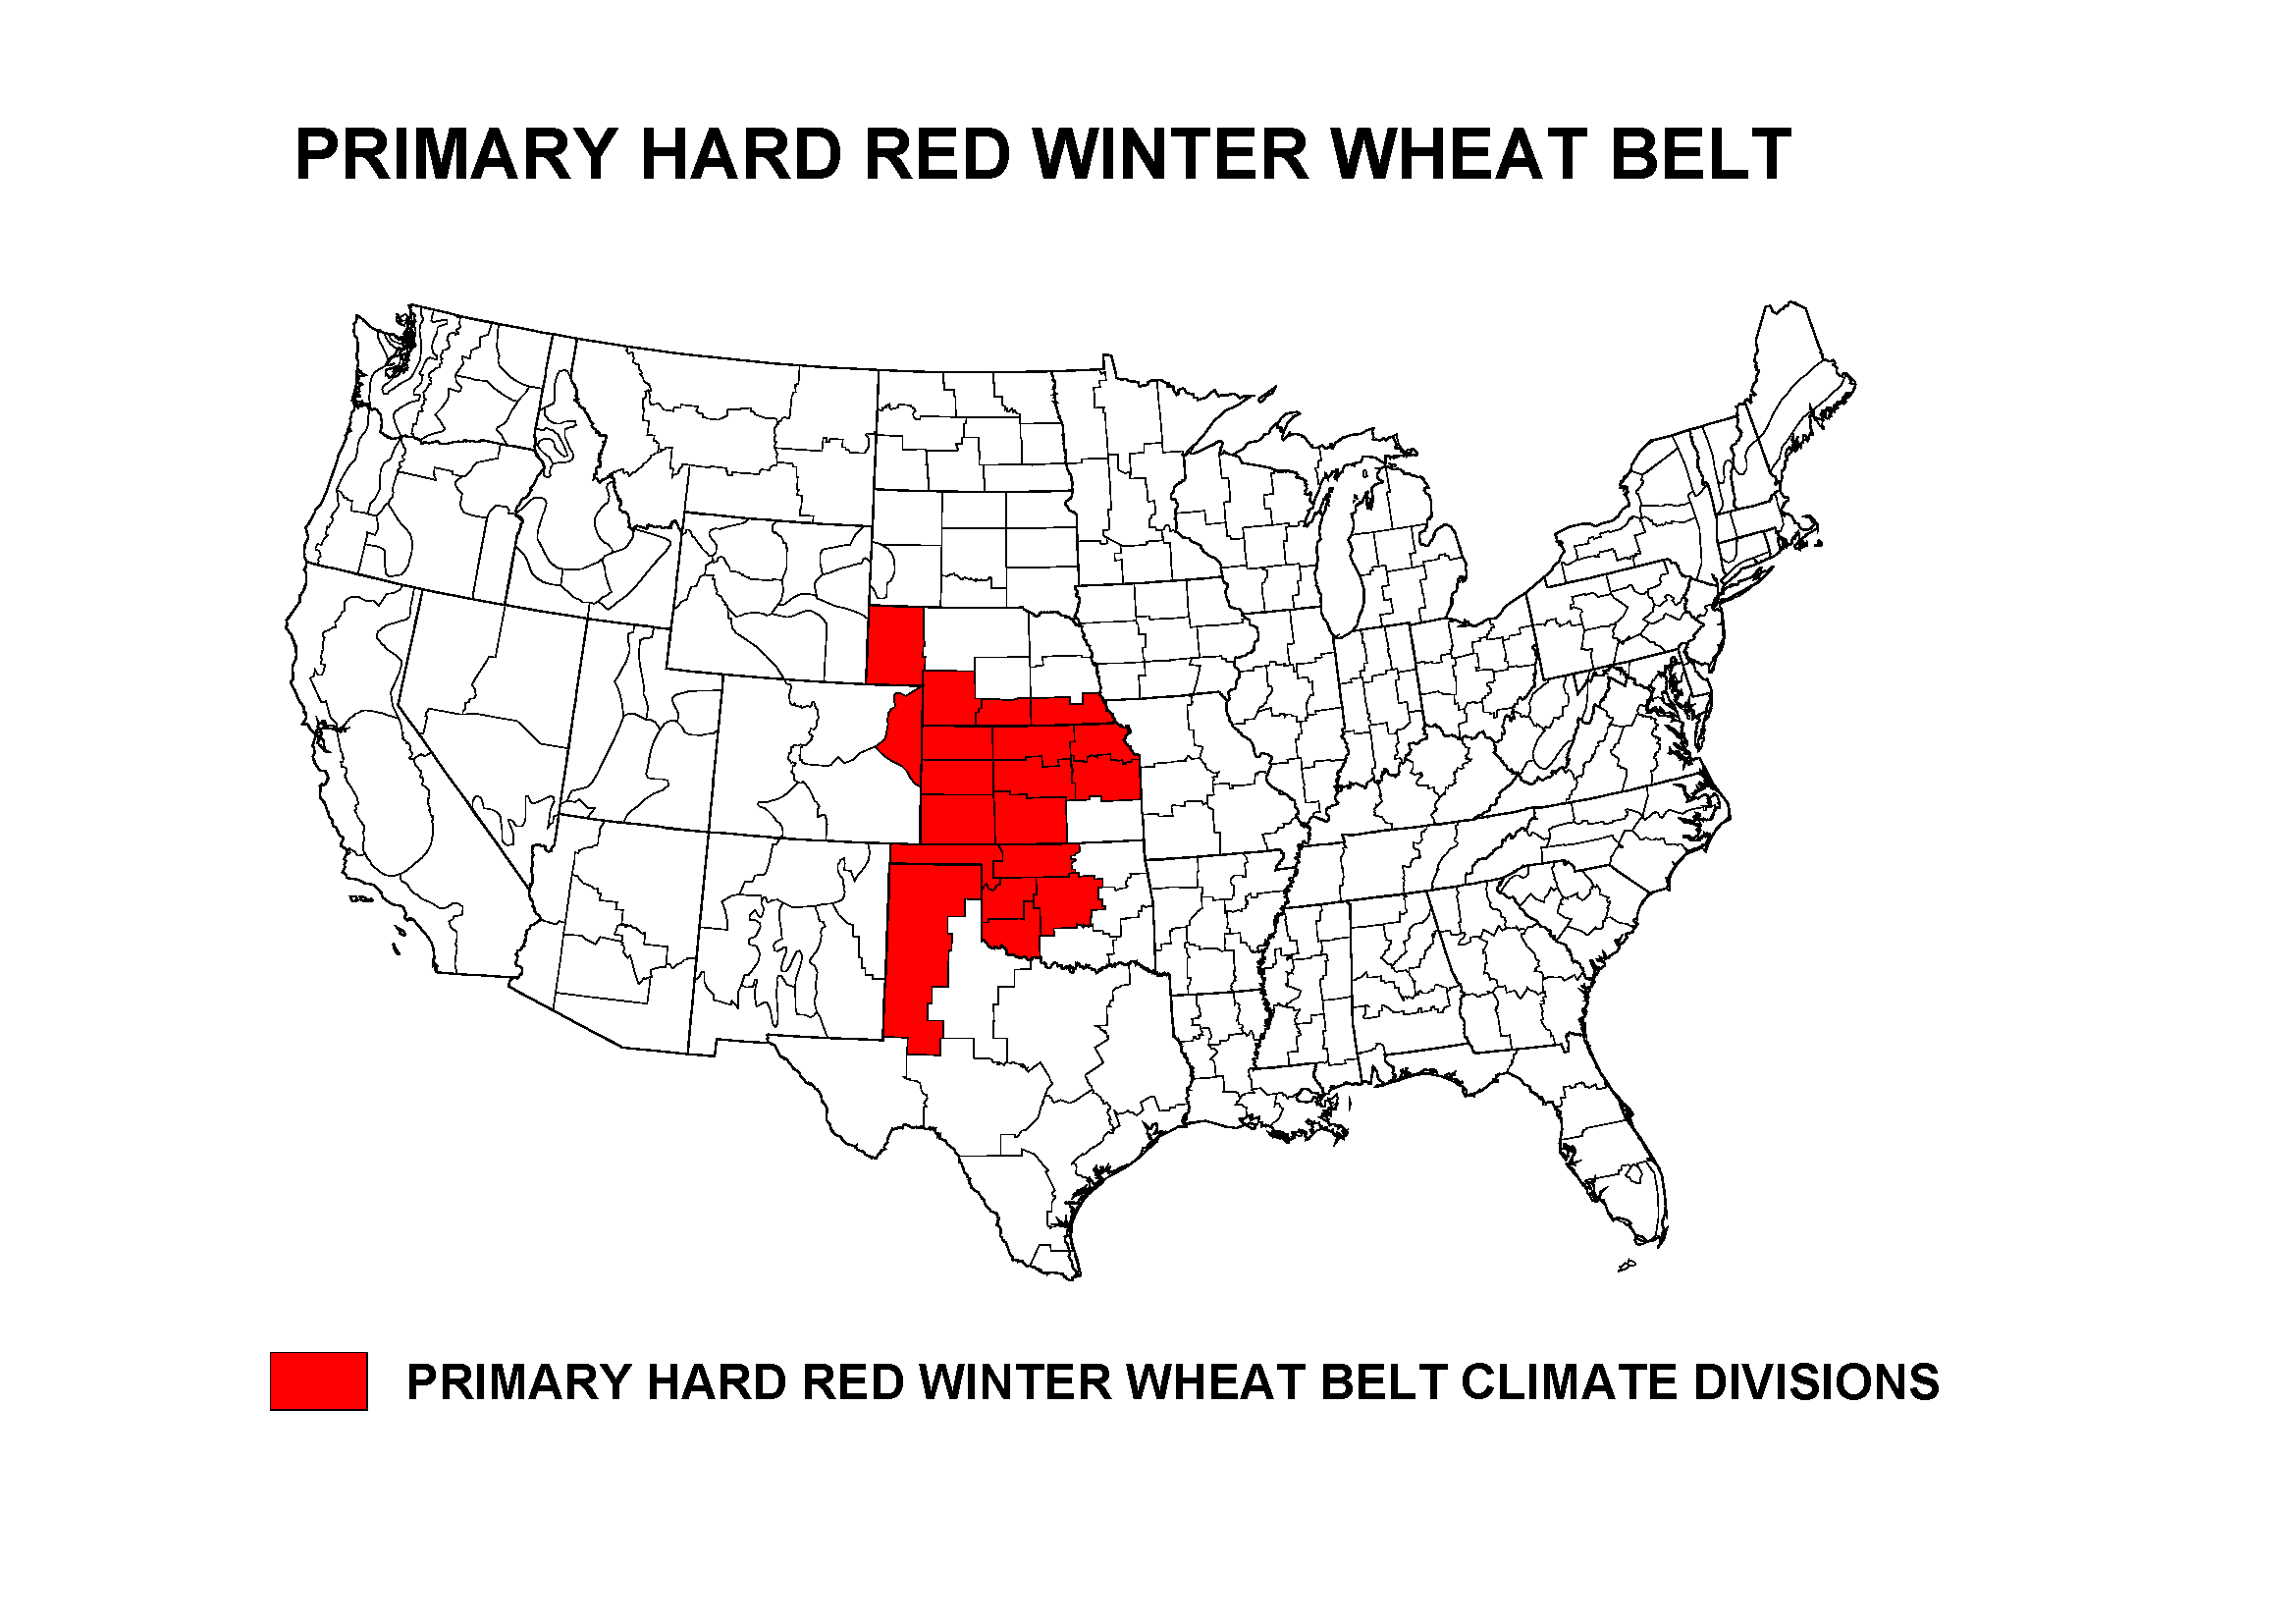
 |
October marks the start of the growing season for the Primary Hard Red Winter Wheat agricultural belt. While portions of the region were drier than normal this month, October 2014 ranked as the 52nd wettest and ninth warmest October in the 1895-2014 record regionwide. According to November 2nd USDA statistics, 93 percent of the winter wheat crop was rated fair to excellent, with only seven percent rated in poor to very poor condition.
NOAA Regional Climate Centers:
A more detailed drought discussion, provided by the NOAA Regional Climate Centers and others, can be found below.
West — Pacific Islands
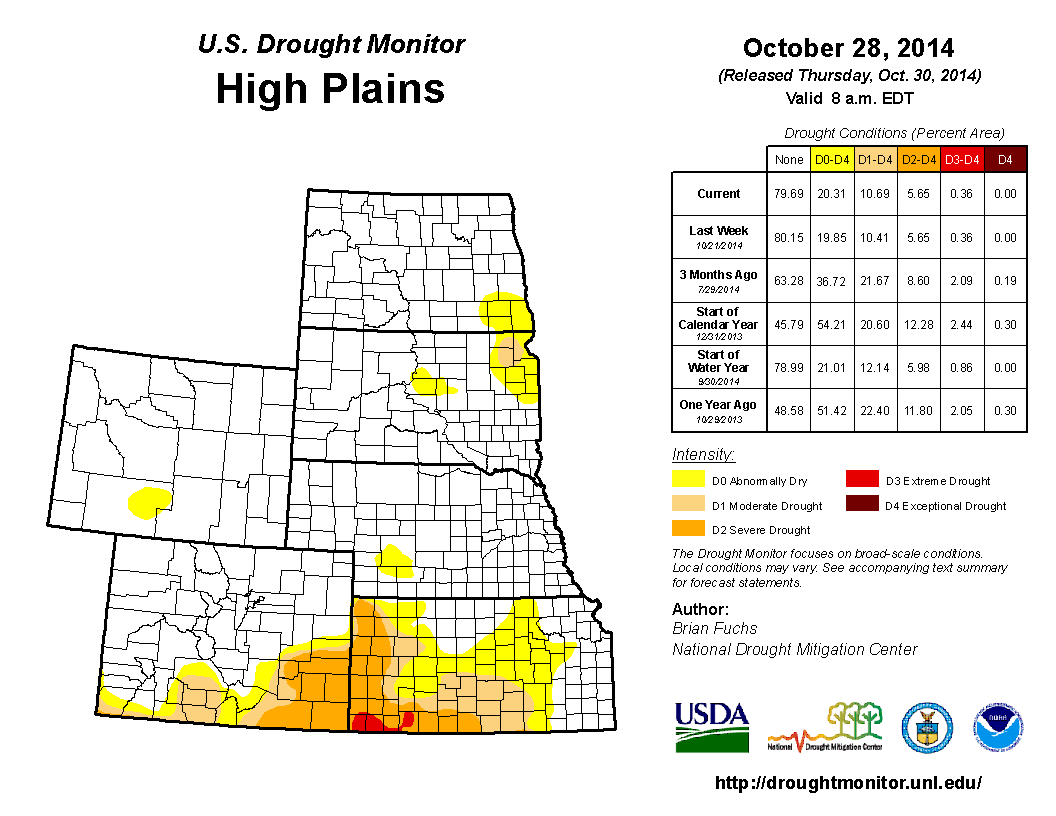
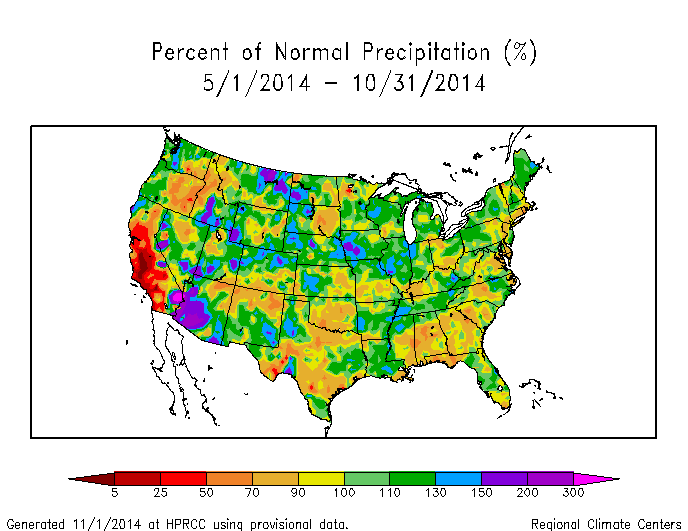
As described by the High Plains Regional Climate Center, October 2014 was fairly dry, with most of the High Plains region receiving at most 1.00 inch (25.4 mm) of precipitation. This translated into a widespread area receiving less than 50 percent of normal precipitation including large areas of the Dakotas, much of Wyoming, and a swath stretching from northeastern Colorado into northern Kansas and southern and central Nebraska. The dry conditions did allow producers to make significant harvest progress and aided in crop drydown. Areas receiving over 150 percent of normal precipitation were isolated to eastern Nebraska, central and eastern Kansas, and southeastern Colorado. Much of that precipitation occurred during the first half of the month. Sheridan, Wyoming had its 4th driest October on record with only 0.16 inch (4 mm). With records dating back to 1907, the driest occurred in 1965 with 0.02 inch (1 mm). For the first time in just over a year, the entire High Plains region was warmer than normal.
There were only slight changes to drought conditions in the High Plains region according to the USDM. The total area in drought (D1-D4) dropped slightly from 12 percent to 11 percent. At the beginning of the month, only Colorado and Kansas had drought conditions, however by the end of the month moderate drought (D1) had developed in northeastern South Dakota where dry conditions have prevailed over the past few months. A new area of abnormally dry conditions (D0) also developed in northeastern South Dakota and southeastern North Dakota. Conditions in Kansas improved, mainly in the eastern part of the state. Statewide, drought conditions went from 46 percent to 38 percent over the past month. Meanwhile, the last remaining extreme drought (D3) area in Colorado was eliminated and now severe drought conditions (D2) remain.
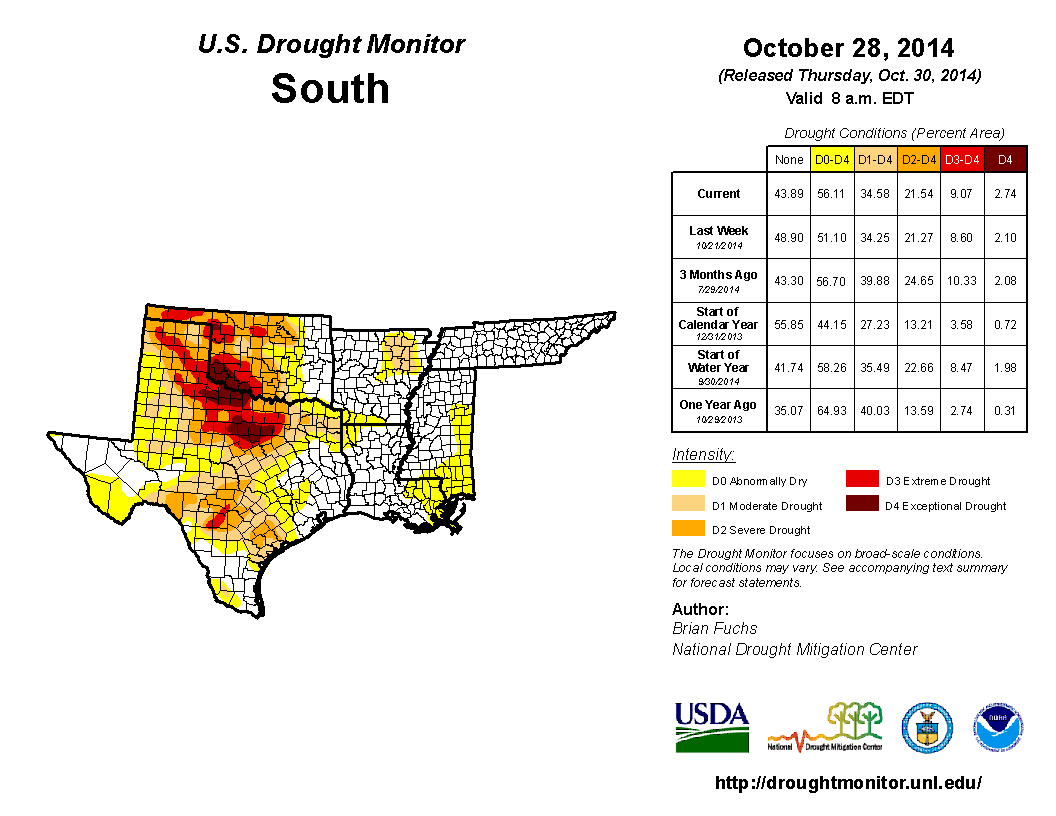
As explained by the Southern Regional Climate Center, October mean temperatures were consistently warmer than normal across much of the Southern region, with Texas having the fifth warmest October on record (1895-2014). October precipitation totals varied significantly from west to east. Conditions were very dry in western and southern Texas, with most stations reporting under 50 percent of normal precipitation. Conditions were also quite dry in southern Louisiana, and in particular, southeastern Louisiana. Conversely, conditions were quite wet in the eastern two thirds of Tennessee with most stations reporting between 150 to 300 percent of normal precipitation. Conditions were equally wet in northern Mississippi and along the northern border of Arkansas and Oklahoma.
Drought conditions in the Southern region did not change significantly from the previous month. Northern Texas and southern Oklahoma are still experiencing severe to exceptional drought conditions and the areal extent of that drought has been consistent throughout the month of October. Uncharacteristically dry conditions in southern Louisiana and southern Mississippi has led to the addition of some abnormally dry conditions (D0) and a small area of moderate drought along the Mississippi Gulf Coast. In Texas, despite the lack of rainfall in many regions of the state, agricultural conditions largely remained as they were as the end of September. Most regions saw a gradual slide to worsened topsoil and subsurface soil moisture conditions, but crops themselves were rated the same, with only small variations in each crop's average condition with no change overall in crop condition index. Harvesting of peanuts in the northeast and deep south Texas is behind its 5-year average by 21% and soybeans are behind theirs by 26%, hindered slightly by intermittent rainfall across the state during the month. The winter wheat crop is still ahead of its 5-year average in terms of maturation, but reports indicate that continued dry conditions could threaten the crop's further development (Information provided by the Texas Office of State Climatology).
As summarized by the Midwest Regional Climate Center, October temperatures averaged to within 2 degrees F (1 C) of normal across the Midwest, and October precipitation was above normal for most of the region. Exceptions were Wisconsin (the only colder-than-normal state in the region) and Minnesota (the only Midwest state to record below normal statewide precipitation with just 47 percent of normal). Only the southeast corner of Minnesota was wetter than normal for the month while much of the state received less than half of normal precipitation, with an area in west central Minnesota below 25 percent of normal. Much of October's rain fell in the first half of the month.
The last remaining drought areas in the Midwest, in southwest Missouri, were removed in the October 14 issue of the USDM thanks to the plentiful precipitation totals received early in the month. The region remained drought free throughout the rest of the month. It was the first time the Midwest was completely drought free since June of 2011, though the region was nearly free of drought in July of 2013 as well. Despite the lack of drought, abnormally dry conditions expanded in Minnesota to cover nearly a quarter of the state by the end of October.
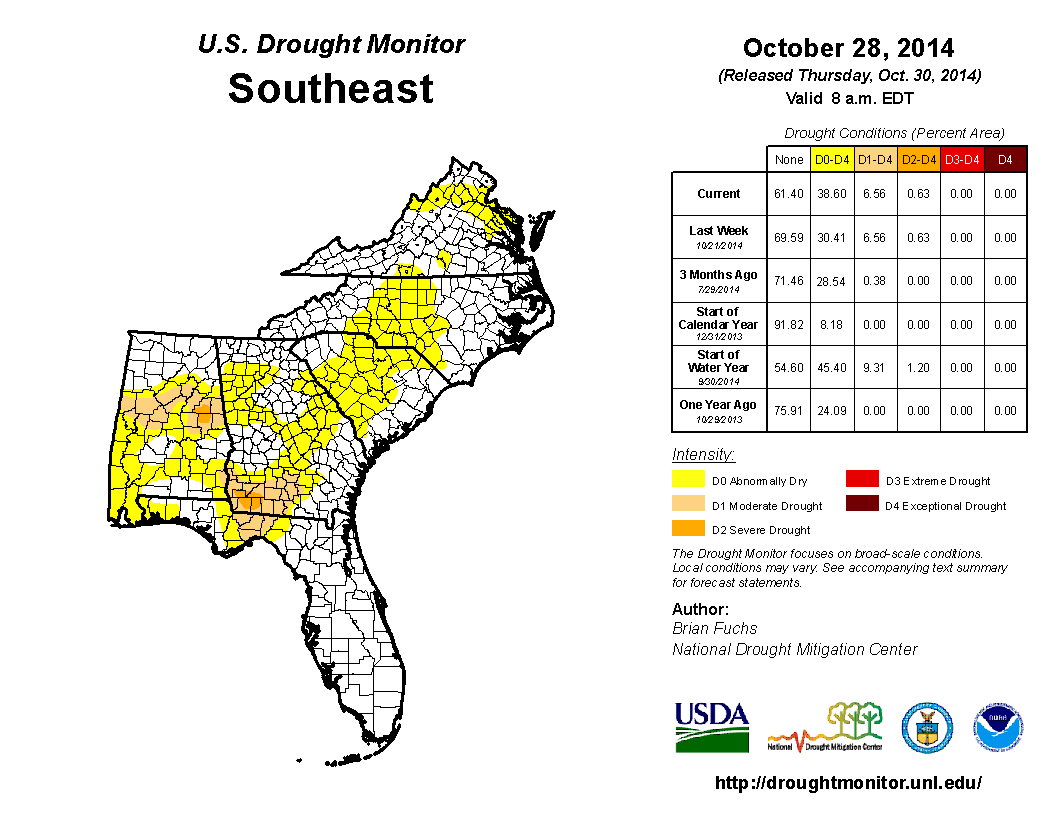
As noted by the Southeast Regional Climate Center, mean temperatures in October were near average across much of the Southeast region, while precipitation was highly variable across the region. Unusually wet conditions were confined to the Appalachian Mountains and markedly dry conditions along the Atlantic coastal plain. The driest locations were found across much of the Florida Peninsula excluding the Panhandle region, where monthly precipitation departures exceeded 2 inches (50.8 mm) below normal. Many locations in this area recorded measurable precipitation on five or fewer days during the month. Daytona Beach, FL (1923-2014) observed its fourth driest October on record with only 0.58 inch (14.7 mm) of precipitation, which is approximately 14 percent of normal. The wettest locations were found across northern Alabama and portions of western North Carolina and Virginia, where monthly precipitation departures exceeded 5 inches (127 mm) above normal in some places.
Mean temperatures were above average across Puerto Rico and the U.S. Virgin Islands, with San Juan, PR (1898-2014) observing its third warmest October on record. Puerto Rico and the U.S. Virgin Islands were much drier-than-normal during October, as the monthly precipitation total for Juncos, PR (1931-2014) was only 1.21 inches (30.7 mm), or about 15 percent of normal.
Little change in drought conditions was noted for the Southeast region during October. Approximately 93.5 percent of the region remained drought-free (less than D1), and drought conditions improved slightly across portions of central Alabama and southwestern Georgia. In Alabama, areas of moderate drought (D1) decreased significantly from about 26 percent on September 30th to around 16 percent on October 28th. While the coverage of moderate drought conditions in Georgia remained constant at 11 percent, the area of severe drought (D2) in southwestern Georgia decreased slightly from 5 percent on September 30th to 2 percent on October 28th. Generally dry conditions during October aided in the final harvest of peanuts, cotton, and hay in Georgia and northern Florida, but the quality of these crops was negatively affected by locally persistent drought conditions across this region.
As explained by the Northeast Regional Climate Center, October was a warm month in the Northeast and the region ended the month on the wet side of normal, seeing 4.53 inches (115.06 mm) of precipitation, or 117 percent of normal. Precipitation departures for the wet states ranged from 164 percent of normal in West Virginia to 101 percent of normal in Rhode Island. Maryland saw 100 percent of normal precipitation, while departures for the dry states ranged from 98 percent of normal in New York and Connecticut to 68 percent of normal in Delaware.
Every Northeast state but Delaware had areas of abnormal dryness or moderate drought at the start of October, according to the USDM. As of October 2, abnormal dryness covered 31 percent of the Northeast, while 4 percent of the region was under moderate drought conditions. By mid-month, 37 percent of the region was abnormally dry, with 4 percent still experiencing moderate drought. Mid- to late month rain helped ease some of the dryness so that by month's end 14 percent of the region was abnormally dry and 2 percent was under moderate drought conditions.
As summarized by the Western Regional Climate Center, strong high pressure was present over the West for much of the month, contributing to the above normal temperatures observed across the region, with several locations experiencing their warmest October on record. Several warm and moist storms moved into the Pacific Northwest, resulting in significantly above normal precipitation for that area. Further south, October was generally drier than normal. Light precipitation was observed in central and southern California, the Sierra Nevada, and the Great Basin. A low-pressure system interacting with hurricane remnants brought above normal precipitation to areas of southern Arizona, western New Mexico, and southern Colorado.
The Pacific Northwest saw steady precipitation throughout October as well as an atmospheric river event mid-month that brought copious precipitation to western Oregon, western Washington, and northwestern California. In south-central Oregon near the California border, the drought-stricken Klamath River Basin received above normal precipitation this month. Klamath Falls, Oregon, recorded 2.21 in (56 mm), 210% of normal and the 4th wettest October in a 67-year record. In northern California, Arcata logged 5.74 in (146 mm) this month, 200% of normal and the wettest October on record. Records for Arcata began in 1945. This month's precipitation in northern California and Oregon, though beneficial, was not sufficient to break the persistent drought affecting these regions and they remain categorized as extreme to exceptional drought. Elsewhere in the West, remnants of Hurricane Simon interacted with a cold front to bring precipitation to southern Arizona, western New Mexico, and southern Colorado on the 9th and 10th. Colorado Springs received 2.96 in (75 mm) precipitation for the month over these two days, 2.14 in (54 mm) above normal and the second wettest October in a 66-year record.
Along Alaska's North Slope, Barrow reported an average temperature of 21.3 F (-5.9 C) this month. This is 4.1 F (2.3 C) above normal and the 13th consecutive October that Barrow has observed October temperatures significantly above the long-term average. The persistence of open water through the end of October due to reduced sea ice in the Beaufort and Chukchi Seas is the main factor keeping October North Slope temperatures above normal. Elsewhere in the state, temperatures were generally slightly warmer than normal in the Southeast and slightly cooler than normal in the Interior, South-central, and Southwest regions. Precipitation totals in the state, excepting the Southeast region, were generally under 2.5 inches (64 mm) and highly variable in percentages of normal. In the Southeast, Annette, received 14.39 in (366 mm) of rainfall, 103% of normal. Along the North Slope, Barrow received 1.12 in (28 mm) of precipitation, which was 273% of normal. Further south, much of Hawaii observed above normal precipitation this month due to Hurricane Ana passing to the southwest of the island chain. The highest precipitation totals associated with Ana were generally in the range of 4-7 in (101-178 mm) on Big Island and Oahu, with stations on each of these islands reporting 10+ in (254+ mm). Honolulu, Oahu, recorded 5.51 in (140 mm) for the month, 300% of normal and the 4th wettest October since records began in 1949. Most of this rain fell over the 18th-19th in association with Ana.
Pacific Islands: According to reports from National Weather Service offices, the Pacific ENSO Applications Climate Center (PEAC), and partners, conditions varied across the Pacific Islands.
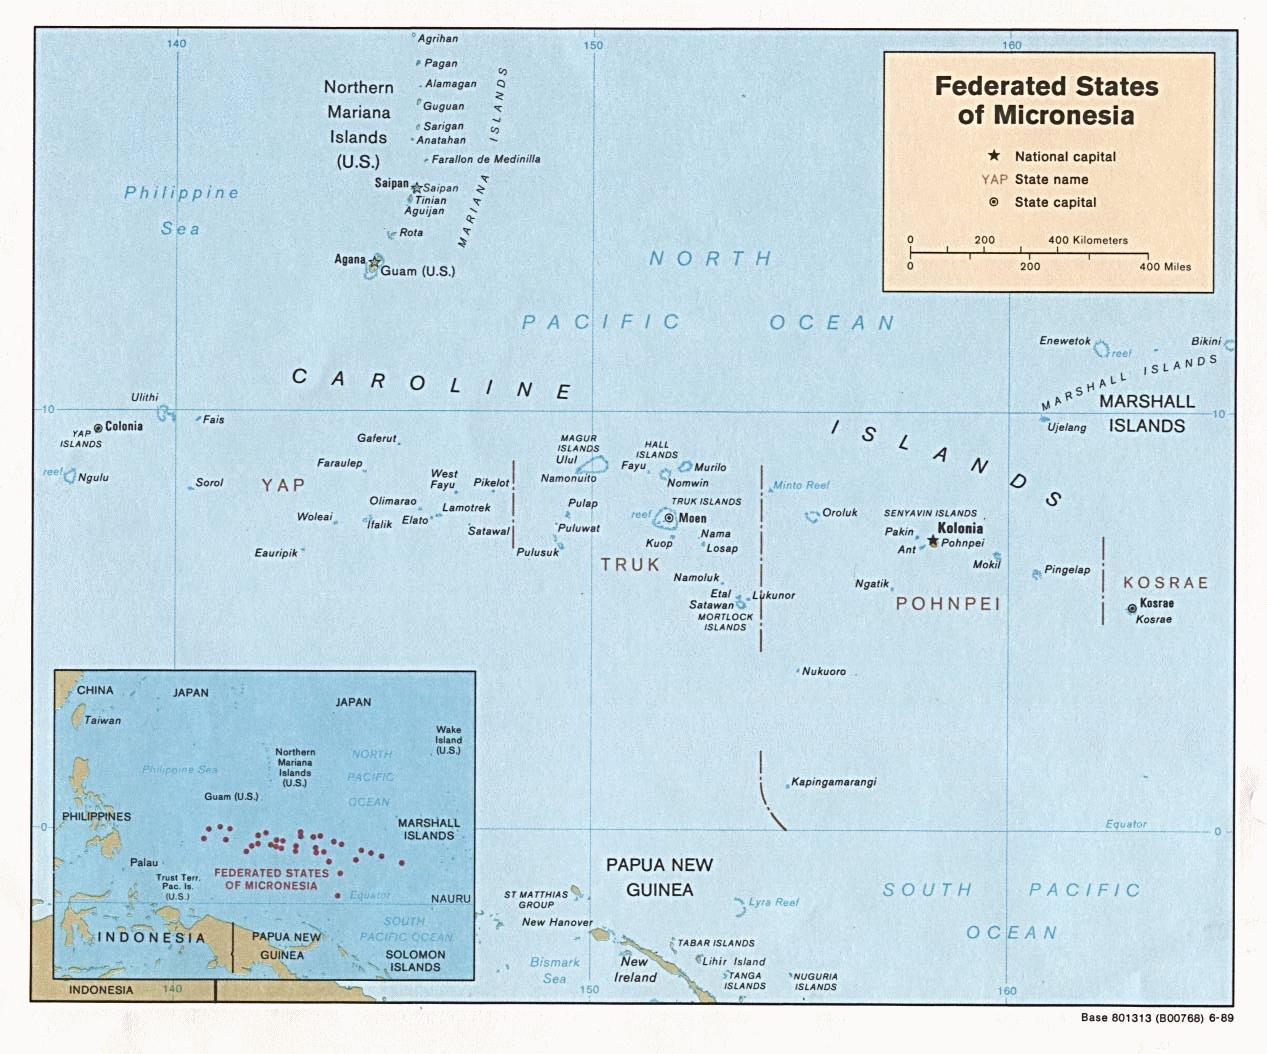
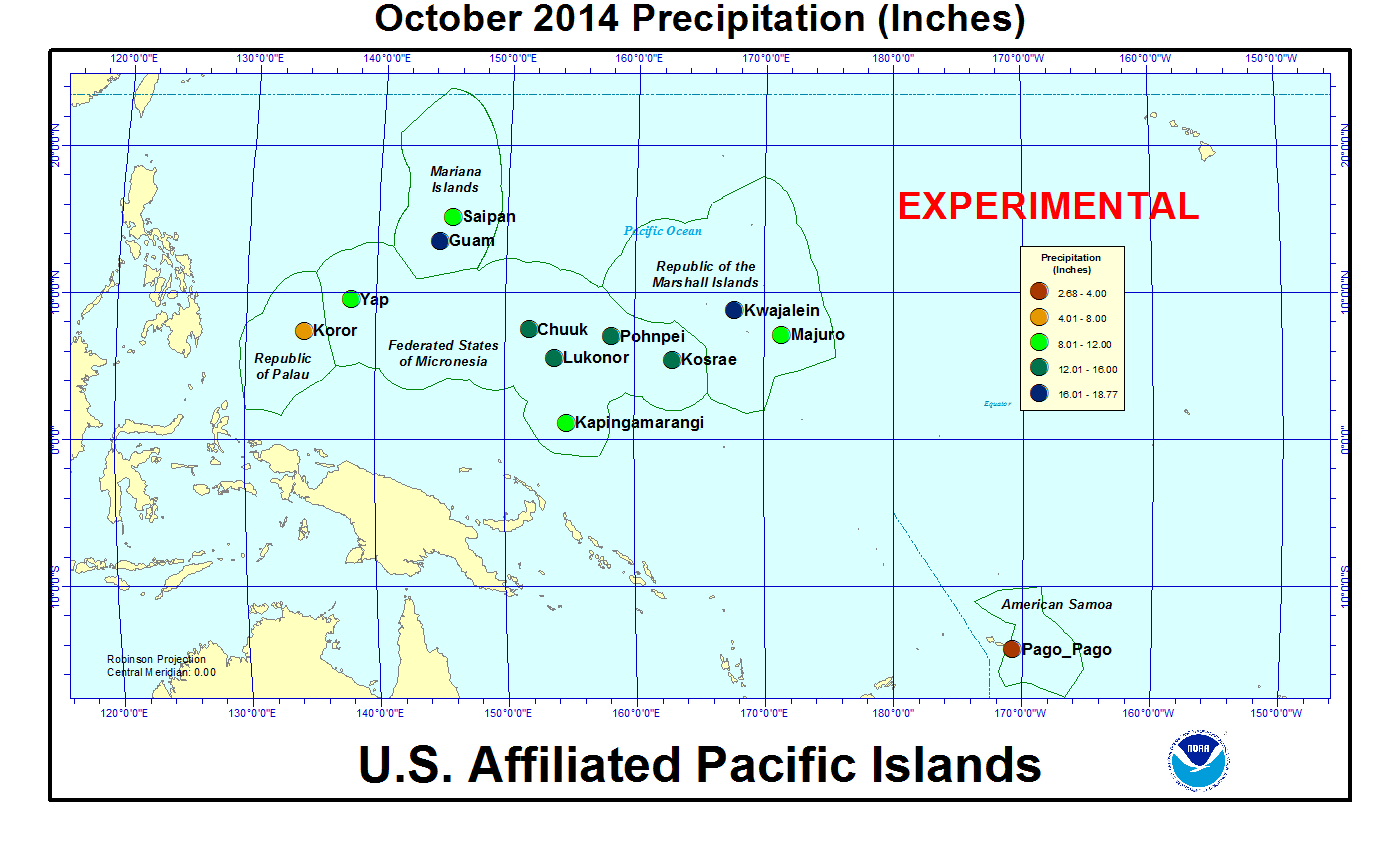
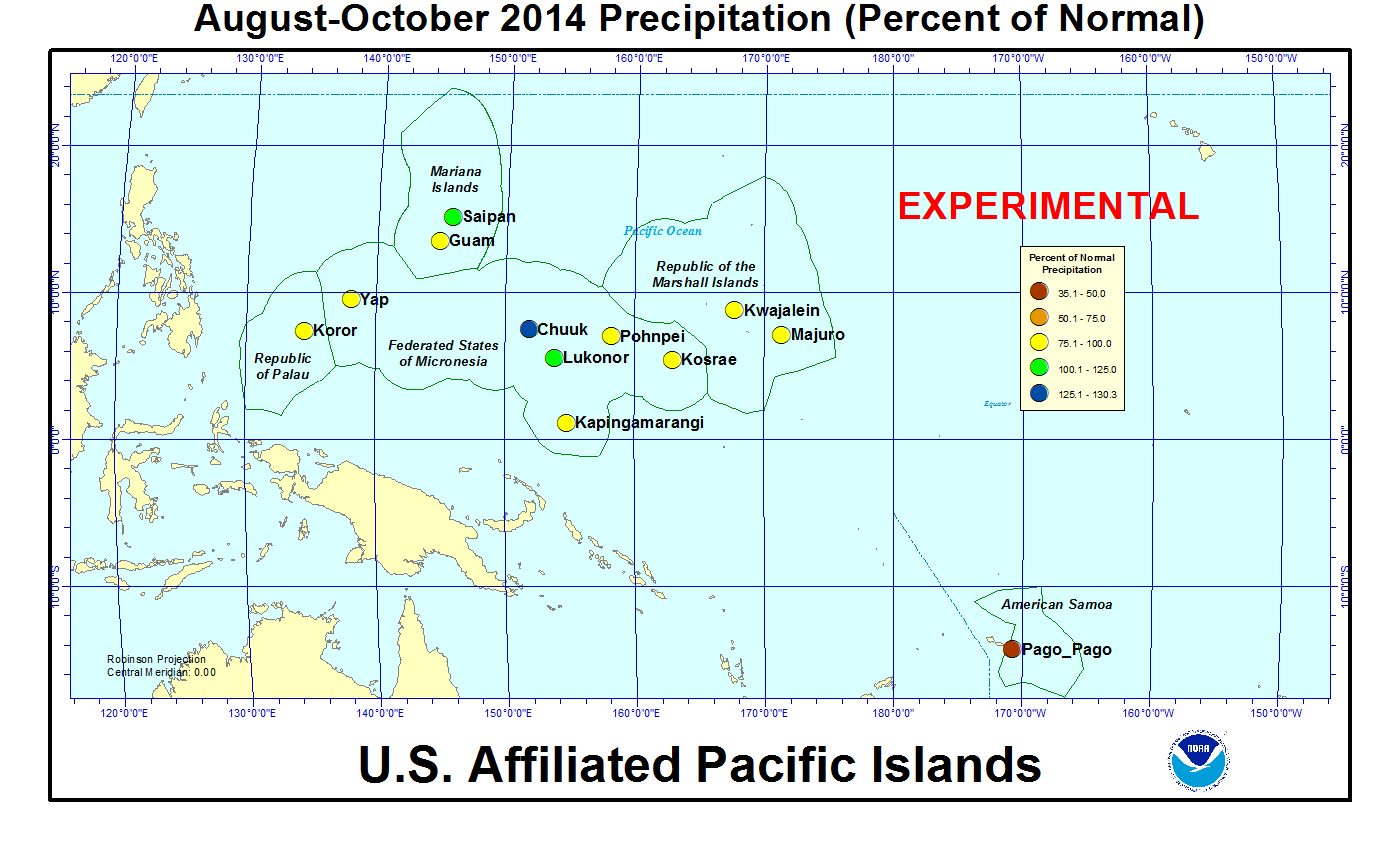
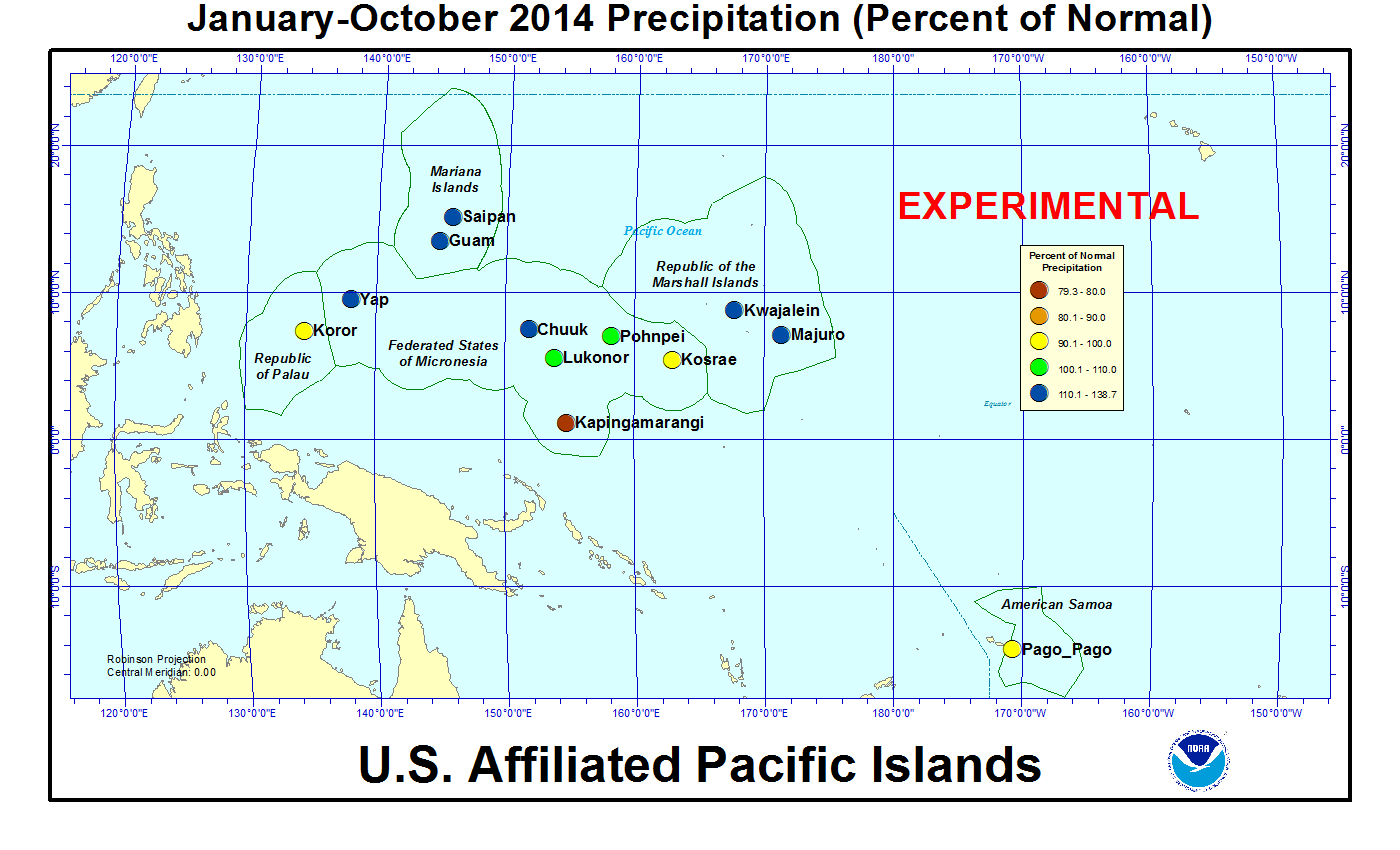
In the U.S. Affiliated Pacific Islands (maps — Micronesia, Marshall Islands, basinwide), October 2014 was wetter than normal at a little more than half of the reporting stations and drier than normal at the rest. The rainfall amounts at most stations were above the minimum thresholds (4 or 8 inches) required to meet most monthly water needs. The 4- and 8-inch thresholds are important because, if monthly precipitation falls below the threshold, then drought becomes a concern. Pago Pago, with 2.68 inches, was below the 8-inch threshold. October marks the third consecutive month that Pago Pago was drier than both the 8-inch and 4-inch thresholds. The persistent lack of rain prompted the Power Authority in American Samoa to begin implementing drought protocols in an effort to reduce water pressure. Koror had 7.45 inches of rain during October, which was just barely below the threshold, but previous months have been well above the threshold. Most of the stations were drier than normal at the three-month time scale (August-October).
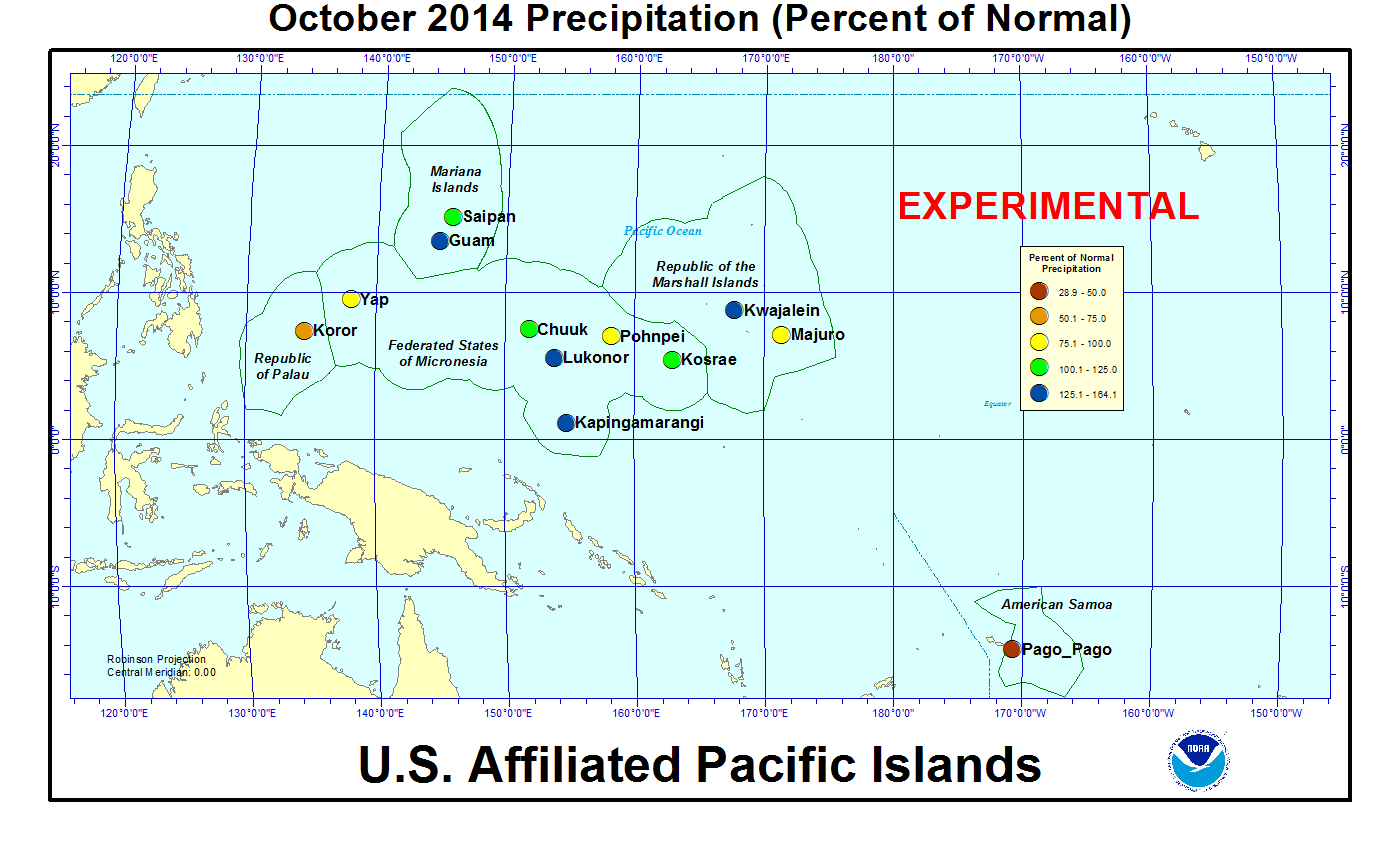
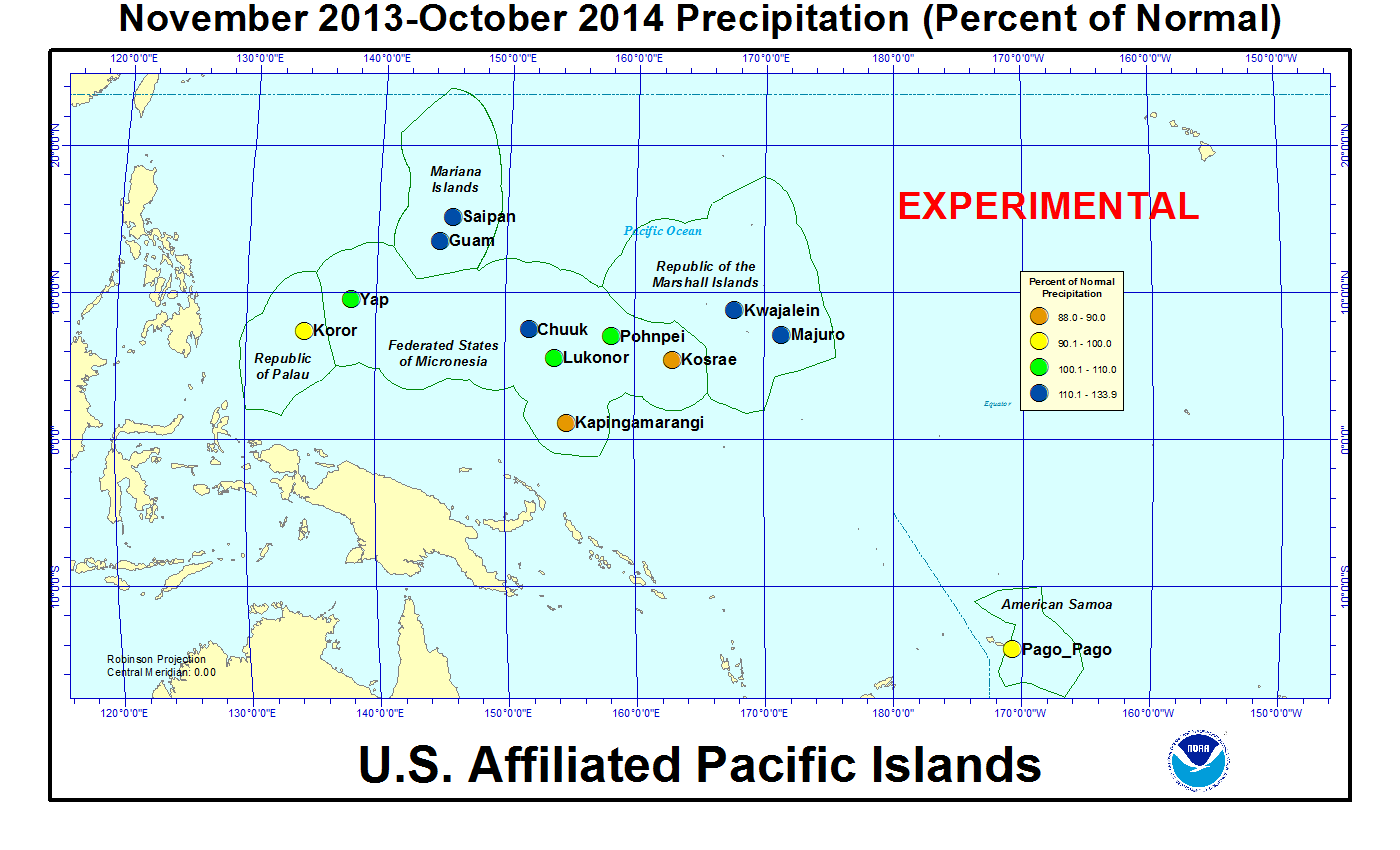
As measured by percent of normal precipitation, Majuro and Yap have been drier than normal for recent months (October and August-October) but wetter than normal at the longer time periods (year to date [YTD] [January-October] and last 12 months [November 2013-October 2014]). Koror and Pago Pago were drier than normal at all four of the time scales. Guam and Kwajalein were wetter than normal for October, drier than normal at the 3-month time scale, and wetter than normal at the longer time scales. Kapingamarangi and Kosrae were wetter than normal for October but drier than normal for the other time periods. Chuuk, Lukonor, and Saipan were wetter than normal at all four of these time scales, while Pohnpei has been near normal (within 5%) at all four time scales.
| Station Name | Nov 2013 | Dec 2013 | Jan 2014 | Feb 2014 | Mar 2014 | Apr 2014 | May 2014 | Jun 2014 | Jul 2014 | Aug 2014 | Sep 2014 | Oct 2014 | Nov- Oct |
|---|---|---|---|---|---|---|---|---|---|---|---|---|---|
| Chuuk | 111% | 75% | 59% | 492% | 89% | 111% | 116% | 76% | 125% | 121% | 166% | 120% | 123% |
| Guam NAS | 56% | 65% | 421% | 170% | 141% | 108% | 99% | 98% | 290% | 62% | 108% | 164% | 117% |
| Kapingamarangi | 38% | 254% | 168% | 112% | 81% | 43% | 83% | 56% | 86% | 96% | 109% | 130% | 88% |
| Koror | 115% | 64% | 170% | 91% | 68% | 224% | 63% | 57% | 121% | 77% | 137% | 63% | 92% |
| Kosrae | 112% | 87% | 86% | 104% | 82% | 150% | 93% | 117% | 175% | 59% | 77% | 114% | 88% |
| Kwajalein | 121% | 39% | 121% | 523% | 475% | 366% | 80% | 104% | 120% | 58% | 88% | 154% | 134% |
| Lukonor | 125% | 90% | 257% | 206% | 138% | 72% | 116% | 110% | 78% | 77% | 146% | 138% | 107% |
| Majuro | 96% | 51% | 125% | 177% | 91% | 246% | 75% | 90% | 201% | 82% | 134% | 88% | 116% |
| Pago Pago | 58% | 99% | 146% | 97% | 65% | 152% | 81% | 154% | 333% | 60% | 40% | 29% | 91% |
| Pohnpei | 142% | 36% | 78% | 225% | 112% | 87% | 87% | 121% | 108% | 74% | 128% | 100% | 100% |
| Saipan | 52% | 71% | 546% | 55% | 167% | 168% | 205% | 92% | 113% | 71% | 191% | 105% | 123% |
| Yap | 74% | 65% | 340% | 91% | 153% | 226% | 39% | 83% | 110% | 65% | 125% | 77% | 103% |
| Station Name | Nov 2013 | Dec 2013 | Jan 2014 | Feb 2014 | Mar 2014 | Apr 2014 | May 2014 | Jun 2014 | Jul 2014 | Aug 2014 | Sep 2014 | Oct 2014 | Nov- Oct |
|---|---|---|---|---|---|---|---|---|---|---|---|---|---|
| Chuuk | 11.82" | 8.44" | 5.98" | 35.70" | 7.43" | 13.80" | 13.06" | 8.91" | 14.92" | 15.55" | 19.44" | 13.78" | 168.83" |
| Guam NAS | 4.13" | 3.33" | 16.89" | 5.14" | 2.91" | 2.74" | 3.36" | 6.08" | 29.39" | 9.08" | 13.66" | 18.77" | 115.48" |
| Kapingamarangi | 3.49" | 25.02" | 15.38" | 10.36" | 9.26" | 5.83" | 9.97" | 7.77" | 12.16" | 7.84" | 10.86" | 10.64" | 128.58" |
| Koror | 13.11" | 7.19" | 17.27" | 7.79" | 5.08" | 16.38" | 7.45" | 9.91" | 22.45" | 10.40" | 16.10" | 7.45" | 140.58" |
| Kosrae | 15.54" | 13.94" | 14.39" | 13.47" | 13.12" | 26.29" | 16.59" | 17.08" | 26.06" | 8.32" | 11.00" | 12.51" | 188.31" |
| Kwajalein | 13.63" | 2.62" | 3.81" | 13.82" | 11.17" | 19.24" | 5.36" | 7.22" | 11.88" | 5.61" | 9.49" | 17.17" | 121.02" |
| Lukonor | 11.38" | 10.11" | 21.65" | 18.42" | 12.76" | 8.18" | 13.58" | 12.85" | 12.50" | 10.80" | 14.79" | 15.57" | 162.59" |
| Majuro | 12.84" | 5.76" | 9.66" | 12.19" | 5.96" | 23.20" | 7.58" | 9.86" | 22.49" | 9.64" | 14.93" | 11.14" | 145.25" |
| Pago Pago | 5.91" | 12.71" | 19.54" | 11.65" | 6.95" | 14.29" | 7.84" | 8.22" | 18.48" | 3.22" | 2.60" | 2.68" | 114.09" |
| Pohnpei | 20.99" | 5.79" | 10.27" | 21.50" | 14.70" | 15.96" | 17.33" | 17.95" | 16.74" | 10.52" | 16.06" | 15.32" | 183.13" |
| Saipan | 2.91" | 2.74" | 13.81" | 1.43" | 3.16" | 4.41" | 4.87" | 3.32" | 10.04" | 9.33" | 19.31" | 11.15" | 86.48" |
| Yap | 6.56" | 5.56" | 21.74" | 4.72" | 6.99" | 12.72" | 3.07" | 9.95" | 16.62" | 9.58" | 16.89" | 9.34" | 123.74" |
| Station Name | Nov 2013 | Dec 2013 | Jan 2014 | Feb 2014 | Mar 2014 | Apr 2014 | May 2014 | Jun 2014 | Jul 2014 | Aug 2014 | Sep 2014 | Oct 2014 | Nov- Oct |
|---|---|---|---|---|---|---|---|---|---|---|---|---|---|
| Chuuk | 10.61" | 11.25" | 10.10" | 7.25" | 8.32" | 12.47" | 11.30" | 11.66" | 11.98" | 12.86" | 11.71" | 11.51" | 136.77" |
| Guam NAS | 7.38" | 5.11" | 4.01" | 3.03" | 2.07" | 2.53" | 3.40" | 6.18" | 10.14" | 14.74" | 12.66" | 11.44" | 99.09" |
| Kapingamarangi | 9.27" | 9.84" | 9.15" | 9.27" | 11.43" | 13.64" | 12.08" | 13.78" | 14.15" | 8.13" | 9.93" | 8.19" | 145.85" |
| Koror | 11.39" | 11.16" | 10.18" | 8.56" | 7.44" | 7.32" | 11.83" | 17.48" | 18.53" | 13.50" | 11.77" | 11.84" | 152.90" |
| Kosrae | 13.83" | 16.11" | 16.67" | 12.93" | 16.06" | 17.51" | 17.75" | 14.64" | 14.91" | 14.22" | 14.22" | 10.94" | 213.87" |
| Kwajalein | 11.28" | 6.66" | 3.16" | 2.64" | 2.35" | 5.26" | 6.72" | 6.93" | 9.87" | 9.74" | 10.74" | 11.18" | 90.41" |
| Lukonor | 9.08" | 11.27" | 8.41" | 8.93" | 9.26" | 11.31" | 11.69" | 11.65" | 15.93" | 14.04" | 10.15" | 11.32" | 151.36" |
| Majuro | 13.44" | 11.39" | 7.74" | 6.88" | 6.58" | 9.42" | 10.11" | 11.01" | 11.17" | 11.69" | 11.17" | 12.73" | 125.25" |
| Pago Pago | 10.14" | 12.84" | 13.34" | 12.00" | 10.68" | 9.39" | 9.66" | 5.33" | 5.55" | 5.38" | 6.53" | 9.26" | 125.57" |
| Pohnpei | 14.83" | 16.08" | 13.18" | 9.55" | 13.17" | 18.41" | 19.96" | 14.81" | 15.43" | 14.26" | 12.55" | 15.27" | 182.36" |
| Saipan | 5.61" | 3.85" | 2.53" | 2.59" | 1.89" | 2.63" | 2.38" | 3.62" | 8.91" | 13.13" | 10.09" | 10.62" | 70.25" |
| Yap | 8.83" | 8.51" | 6.39" | 5.19" | 4.56" | 5.63" | 7.85" | 12.04" | 15.08" | 14.82" | 13.50" | 12.18" | 120.31" |
[top]
State/Regional/National Moisture Status
A detailed review of drought and moisture conditions is available for all contiguous U.S. states, the nine standard regions, and the nation (contiguous U.S.):
| northeast u. s. | east north central u. s. | central u. s. |
| southeast u. s. | west north central u. s. | south u. s. |
| southwest u. s. | northwest u. s. | west u. s. |
| Contiguous United States |
[top]
Contacts & Questions