|
Contents Of This Report: |
|
Please note that the values presented in this report are based on preliminary data. They will change when the final data are processed, but will not be replaced on these pages.
National Drought Overview
|
|
[top]
Detailed Drought Discussion
Overview
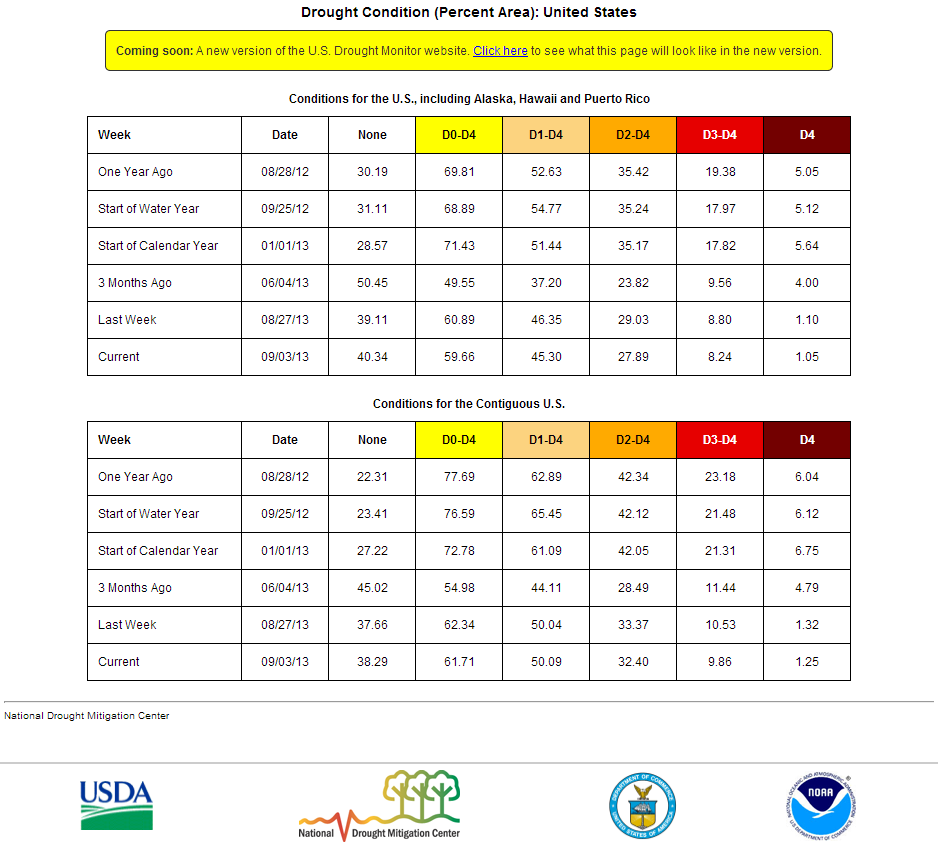
The August 2013 upper-level circulation flipped from a persistent abnormally strong cool trough over the central and eastern United States during the first 22 days of the month to a strong warm high pressure ridge over much of the country during the last week. Both patterns blocked moisture from reaching the Midwest, while a ridge prevailed over the West, bringing dry weather there. The trough funneled cool fronts into the country east of the Rockies. The frequent southerly flow ahead of the fronts brought abundant moisture to the eastern U.S., while storm systems developed along fronts which stalled from the east slopes of the Rockies to the Central Plains and Southeast, driving a wedge of wet weather between the dryness in the Midwest to the north and Lower Mississippi Valley and Southern Plains to the south. Monsoon showers brought moisture to the Southwest, complicating the precipitation pattern in the West. When the temperature and precipitation are averaged across the contiguous U.S. (CONUS) for the entire month, August 2013 ranked as the 28th warmest and 53rd driest August in the 119-year record. As a result of the complicated precipitation pattern, the intensity of drought decreased in most areas, especially the Great Plains, with the percentage of the U.S. in extreme to exceptional drought decreasing from 9.9 percent last month to 8.2 percent at the end of August, according to U.S. Drought Monitor statistics. However, dry conditions in Hawaii and the Southern Plains, and especially prolonged summer dryness in the Midwest, caused the overall area in drought to expand, from 41.5 percent of the U.S. in moderate to exceptional drought at the end of July to 45.3 percent at the end of this month. According to the Palmer Drought Index, which goes back to the beginning of the 20th century, 31.1 percent of the CONUS was in moderate to extreme drought at the end of August, a decrease of about 2 percent compared to last month.
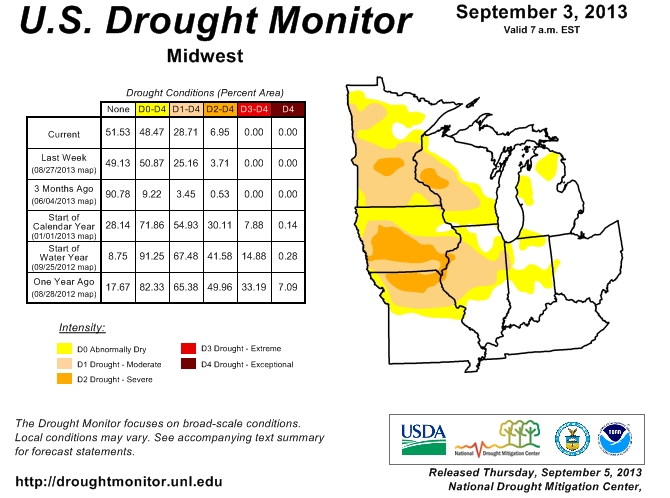
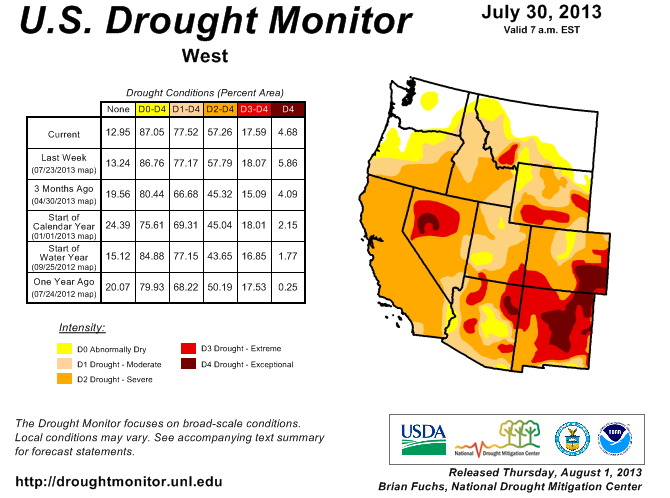
The U.S. Drought Monitor drought map valid September 3, 2013.
By the end of the month, the core drought areas in the U.S. included:
- a large area of moderate (D1) to severe (D2) drought, including spots of extreme (D3) to exceptional (D4) drought, stretching from the West, across the Central and Southern Plains, and into the Midwest and Lower Mississippi Valley, with a large area of intense extreme to exceptional drought lingering from the Southwest to the Central Plains states;
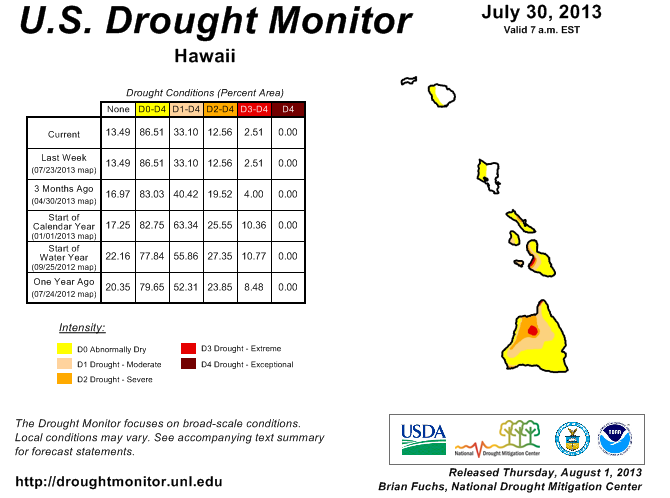
- Hawaii, where moderate to extreme drought persisted; and
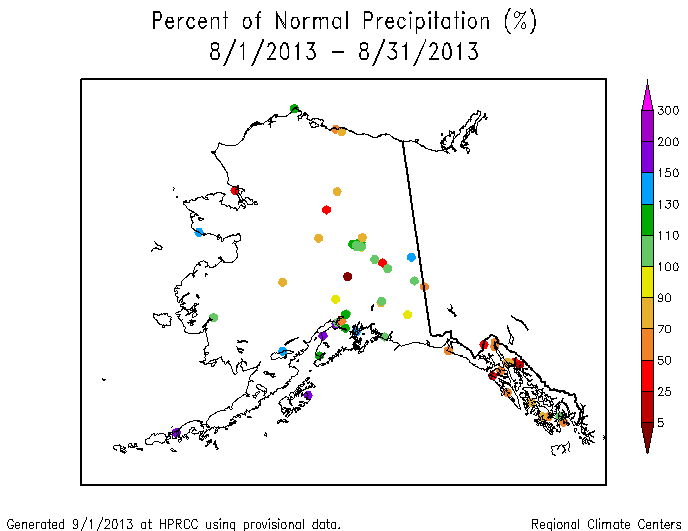
- Alaska, where moderate to severe drought continued.
Palmer Drought Index
The Palmer drought indices measure the balance between moisture demand (evapotranspiration driven by temperature) and moisture supply (precipitation). The Palmer Z Index depicts moisture conditions for the current month, while the Palmer Hydrological Drought Index (PHDI) and Palmer Drought Severity Index (PDSI) depict the current month's cumulative moisture conditions integrated over the last several months.
|
 |
Used together, the Palmer Z Index and PHDI maps show that August short-term dry conditions occurred over long-term dry conditions that existed at the end of July across parts of the Pacific Northwest, Great Basin, Northern Rockies, and Central and Southern Plains, exacerbating the drought, while short-term wet conditions occurred over other parts of the Central to Northern Plains and Southwest, improving long-term drought. Short-term dry conditions again occurred over long-term wet conditions across much of the Midwest, neutralizing the wetness in some areas. Short-term wet conditions occurred over long-term wet conditions in the Southeast and parts of the Northeast, reinforcing the wet spell there.
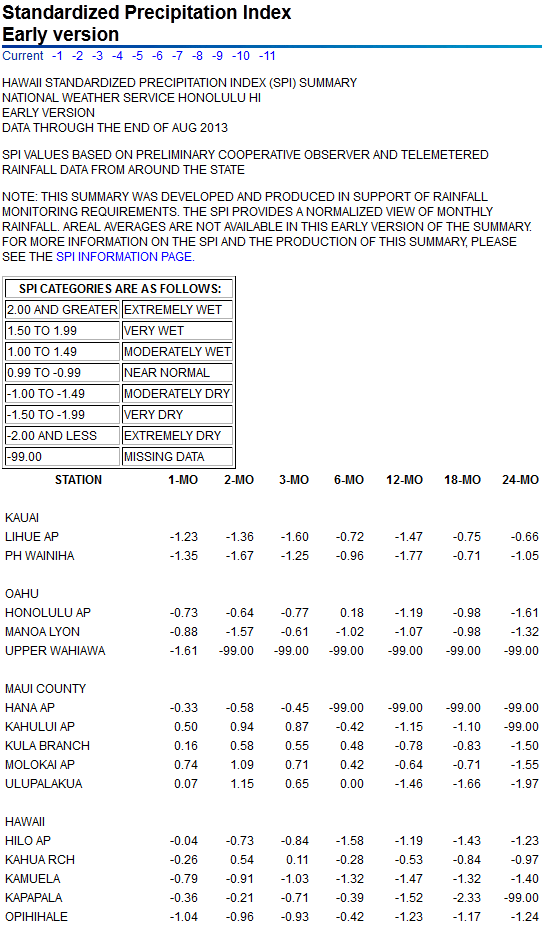
Standardized Precipitation Index
The Standardized Precipitation Index (SPI) measures moisture supply. The SPI maps here show the spatial extent of anomalously wet and dry areas at time scales ranging from 1 month to 24 months.
 |
 |
 |
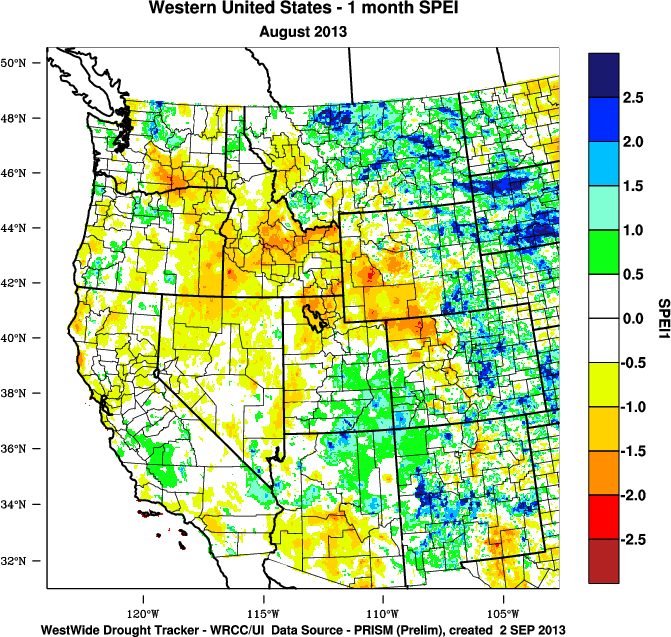
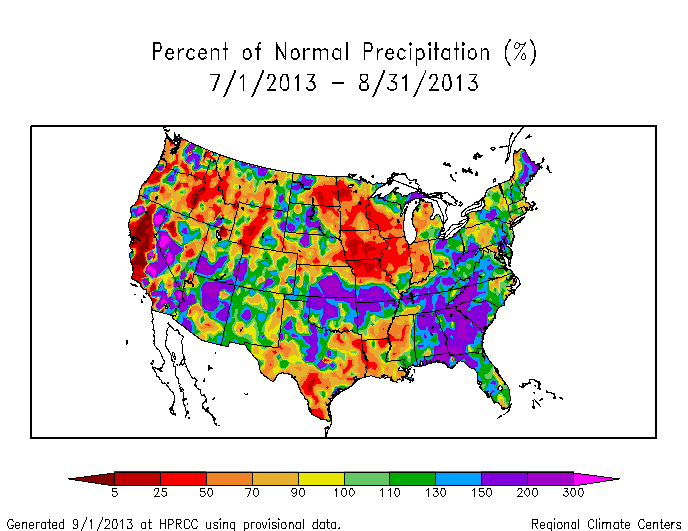
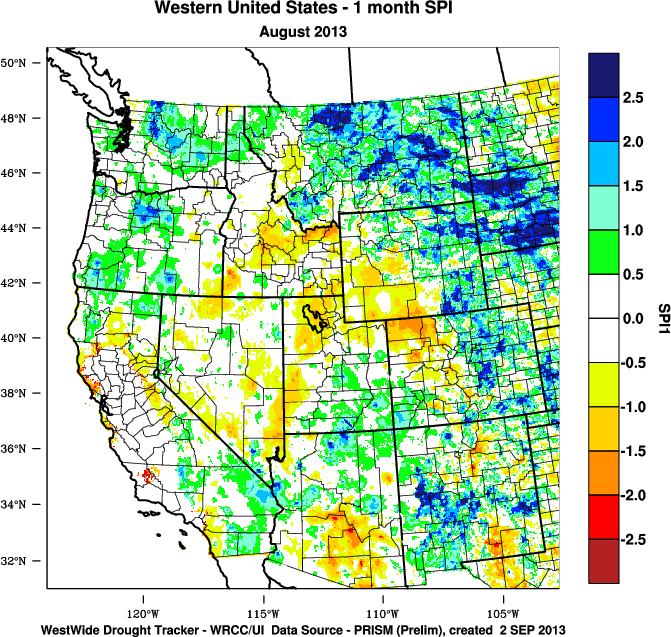
There was considerable spatial variability in the patterns of wetness and dryness during August 2013, but greater coherence was evident at longer time scales. The 1-month SPI map shows dryness in the Midwest from the Upper Mississippi Valley to Ohio Valley, across parts of the West, and from the Southern Plains to Lower Mississippi Valley. The dryness in parts of the Midwest and Lower Mississippi Valley extends out to 3 months, with the dryness especially acute in the Midwest at 2 months. Dryness is evident from the Central Rockies to Great Basin at 3 months, but spreads farther across the West at the 6 and 9-month time scales. The summer monsoon wetness in the Southwest during the last 2 to 3 months shows up as wet to neutral conditions across parts of the Southwest even out to 9 to 12 months, although the dryness in New Mexico reasserts itself beginning at 6 months. By 12 months, and especially 24 months, the dryness in the West connects with dryness in the Plains. Wet conditions in the East are most pronounced at 3 to 9 months, while longer-term dryness neutralizes the wetness at 24 months in the Southeast. The Midwest is wet at 6 to 12 months, but at 24 months the current and earlier dryness neutralizes the wetness.
 |
 |
 |
Agricultural, Hydrological, and Meteorological Indices and Impacts
 |
 |
Drought conditions were reflected in numerous agricultural, hydrological, and other meteorological indicators, both observed and modeled.
Agricultural:
According to the U.S. Department of Agriculture (USDA), as of September 3, 53 percent of cattle, 39 percent of hay, 52 percent of corn, and 42 percent of soybeans were in drought. These percentages are more than the corresponding percentages from a month ago. September 3 statistics reveal 34 percent of the nation's pasture and rangeland rated in poor to very poor condition, a continued increase compared to last month, with statewide values as high as 97 percent in California, 75 percent in Nevada, 61 percent in New Mexico, 57 percent in Oregon, 56 percent in Texas and Wisconsin, 52 percent in Arizona and Iowa, 51 percent in Colorado, 47 percent in Idaho and Wyoming, and 45 percent in Minnesota. Crop condition was rated poor to very poor for 23 percent of the nation's cotton, 16 percent of corn, and 15 percent of soybeans. Topsoil continued to dry out in the Northern Plains and Midwest, with two-thirds or more of topsoil rated short or very short of moisture in Iowa (78%), Illinois (77%), Missouri (73%), and Minnesota (66%). The value was greater than 50 percent across the West, Great Plains, Upper Midwest, and into the Ohio Valley.
Map showing NOAA/NWS Leaky Bucket Model monthly soil moisture percentiles.
- USDA (U.S. Department of Agriculture) observed soil moisture conditions, comparison to 5-year average and 10-year average, percentiles, and departure from median;
- the Palmer Crop Moisture Index (CMI), which reflected worsening drought in the Midwest and Lower Mississippi Valley as the month progressed (weeks 1, 2, 3, 4, 5);
- NOAA Climate Prediction Center (CPC) modeled soil moisture anomalies and percentiles for the end of the month, and soil moisture anomaly change compared to previous month;
- CPC's Leaky Bucket model soil moisture percentiles;
- NLDAS (North American Land Data Assimilation System) modeled soil moisture percentiles for the top soil layer and total soil layer;
- VIC (University of Washington Variable Infiltration Capacity macroscale hydrologic model) modeled soil moisture percentiles, and soil moisture percentile change compared to previous month;
- USDA percent of pasture and rangeland in poor to very poor condition and comparison to average (anomalies, percentiles);
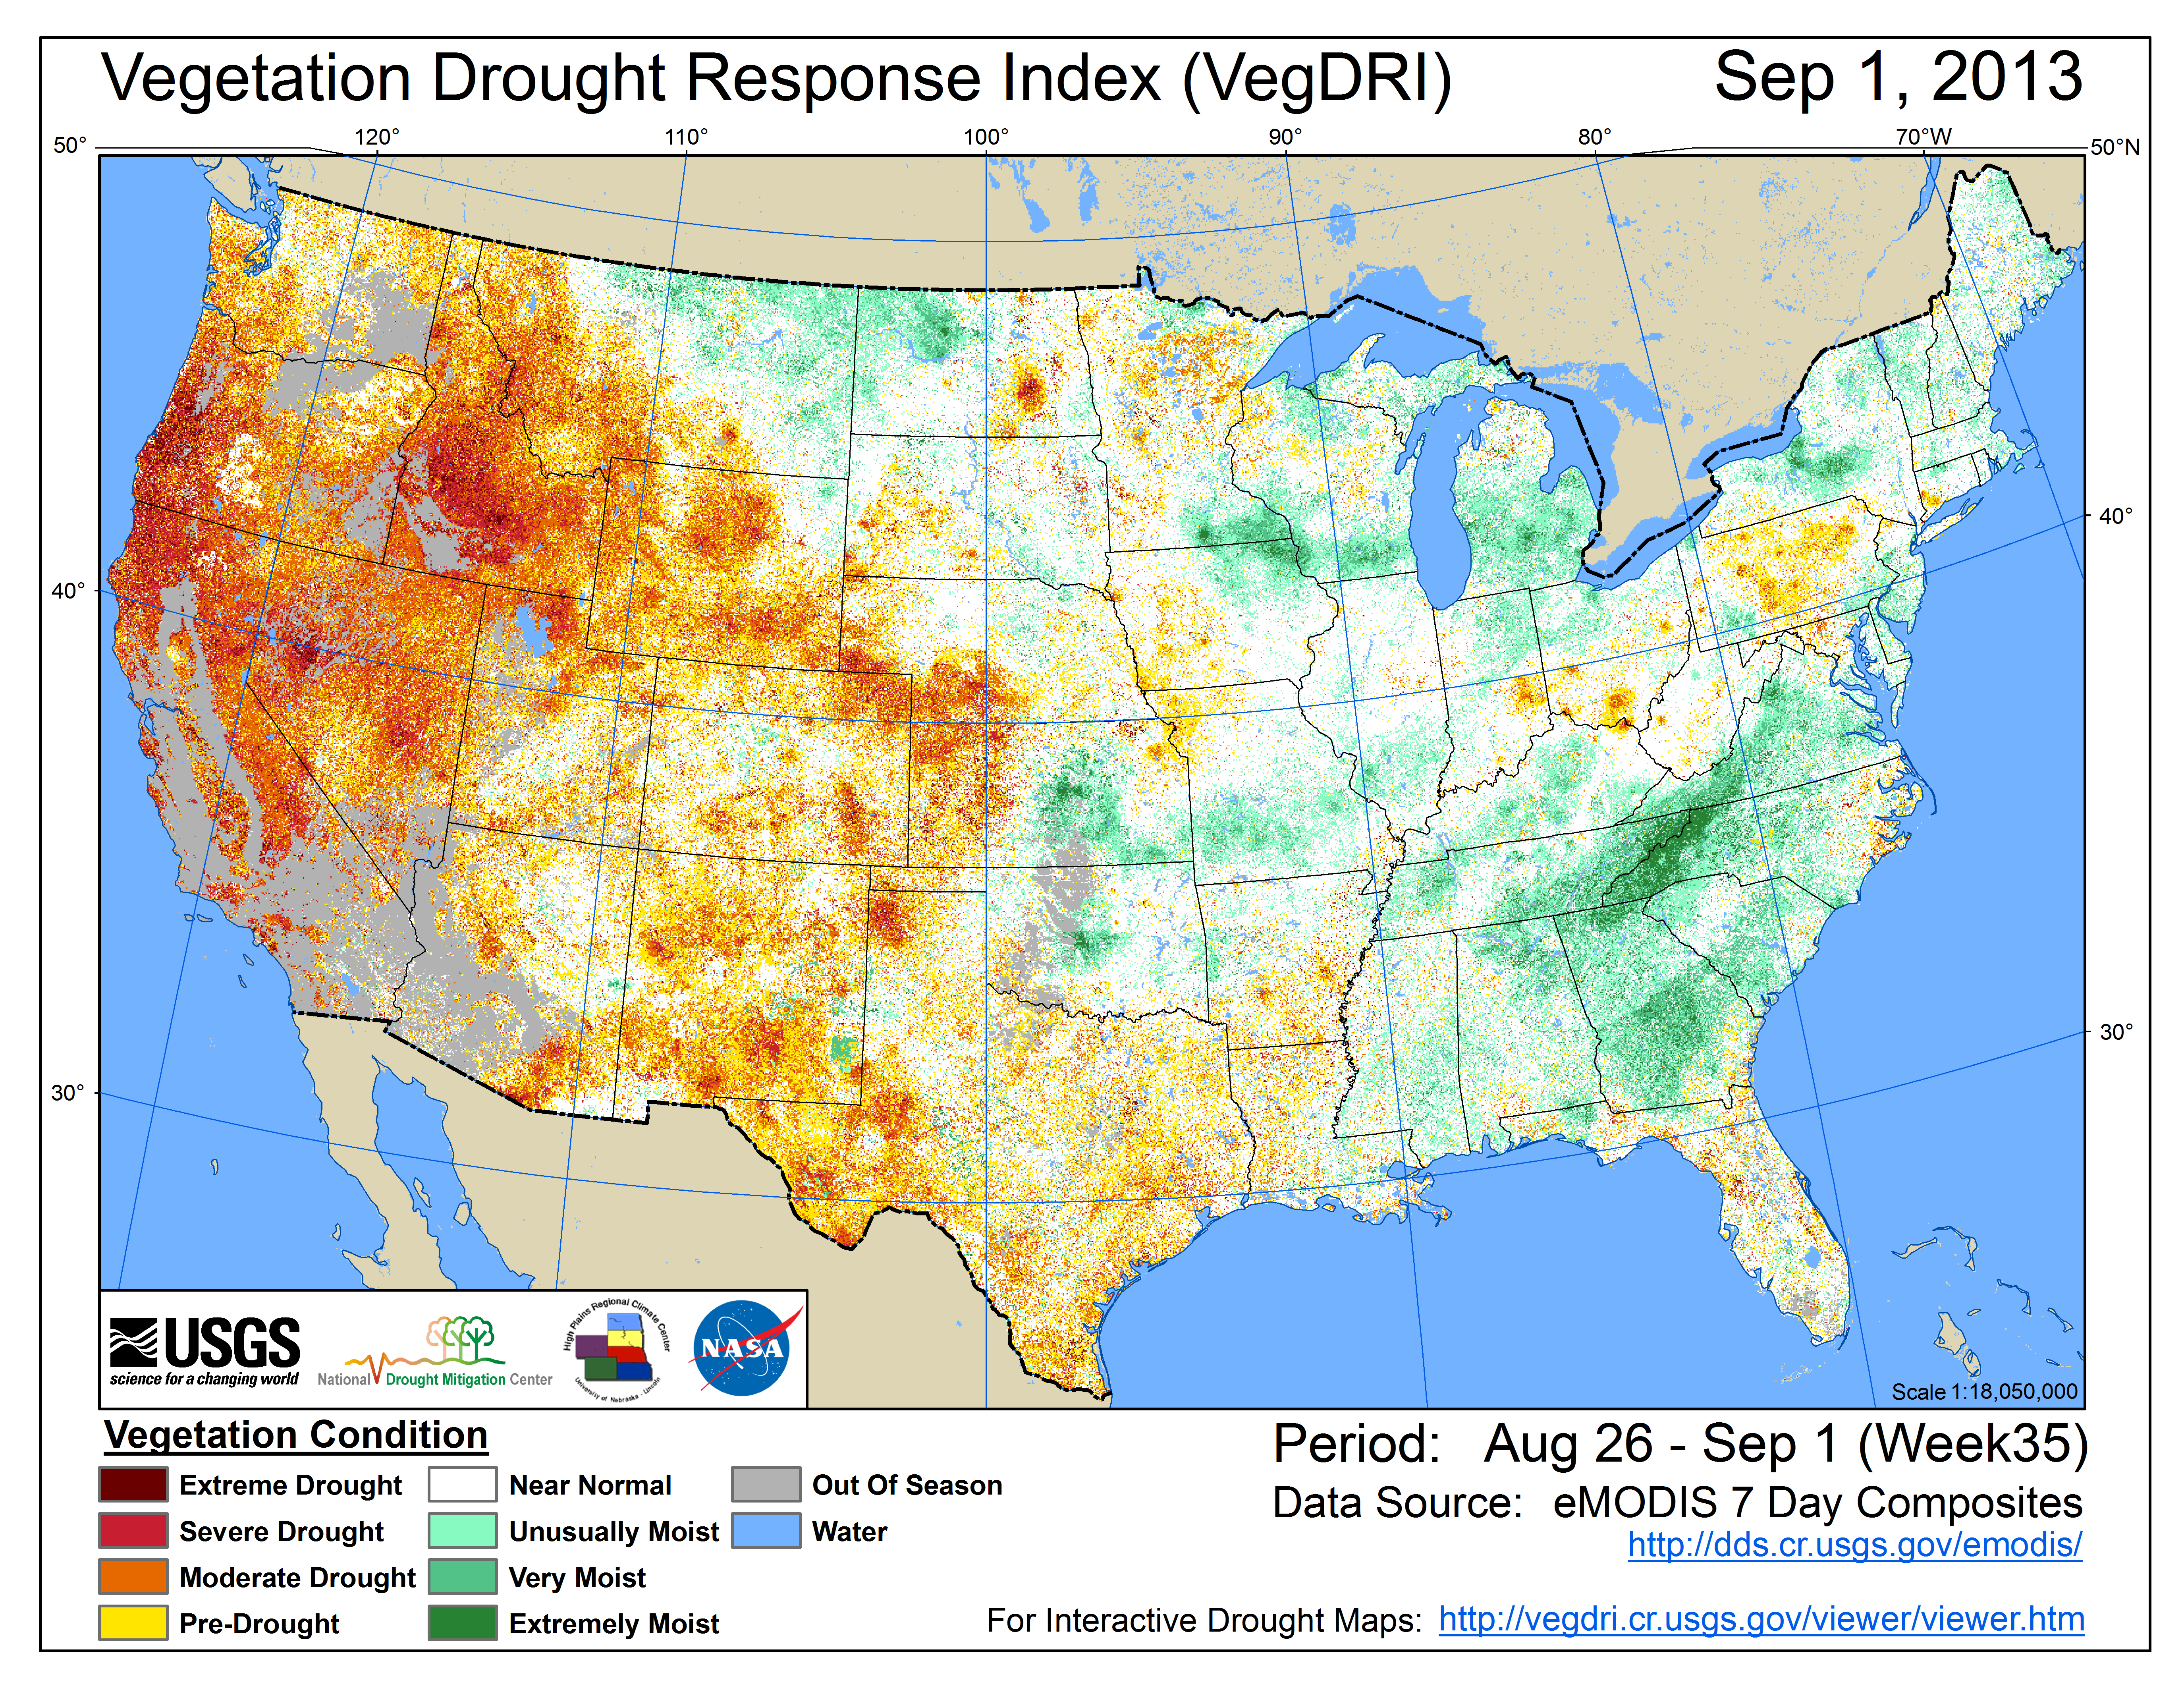
- Vegetation Drought Response Index (VegDRI);
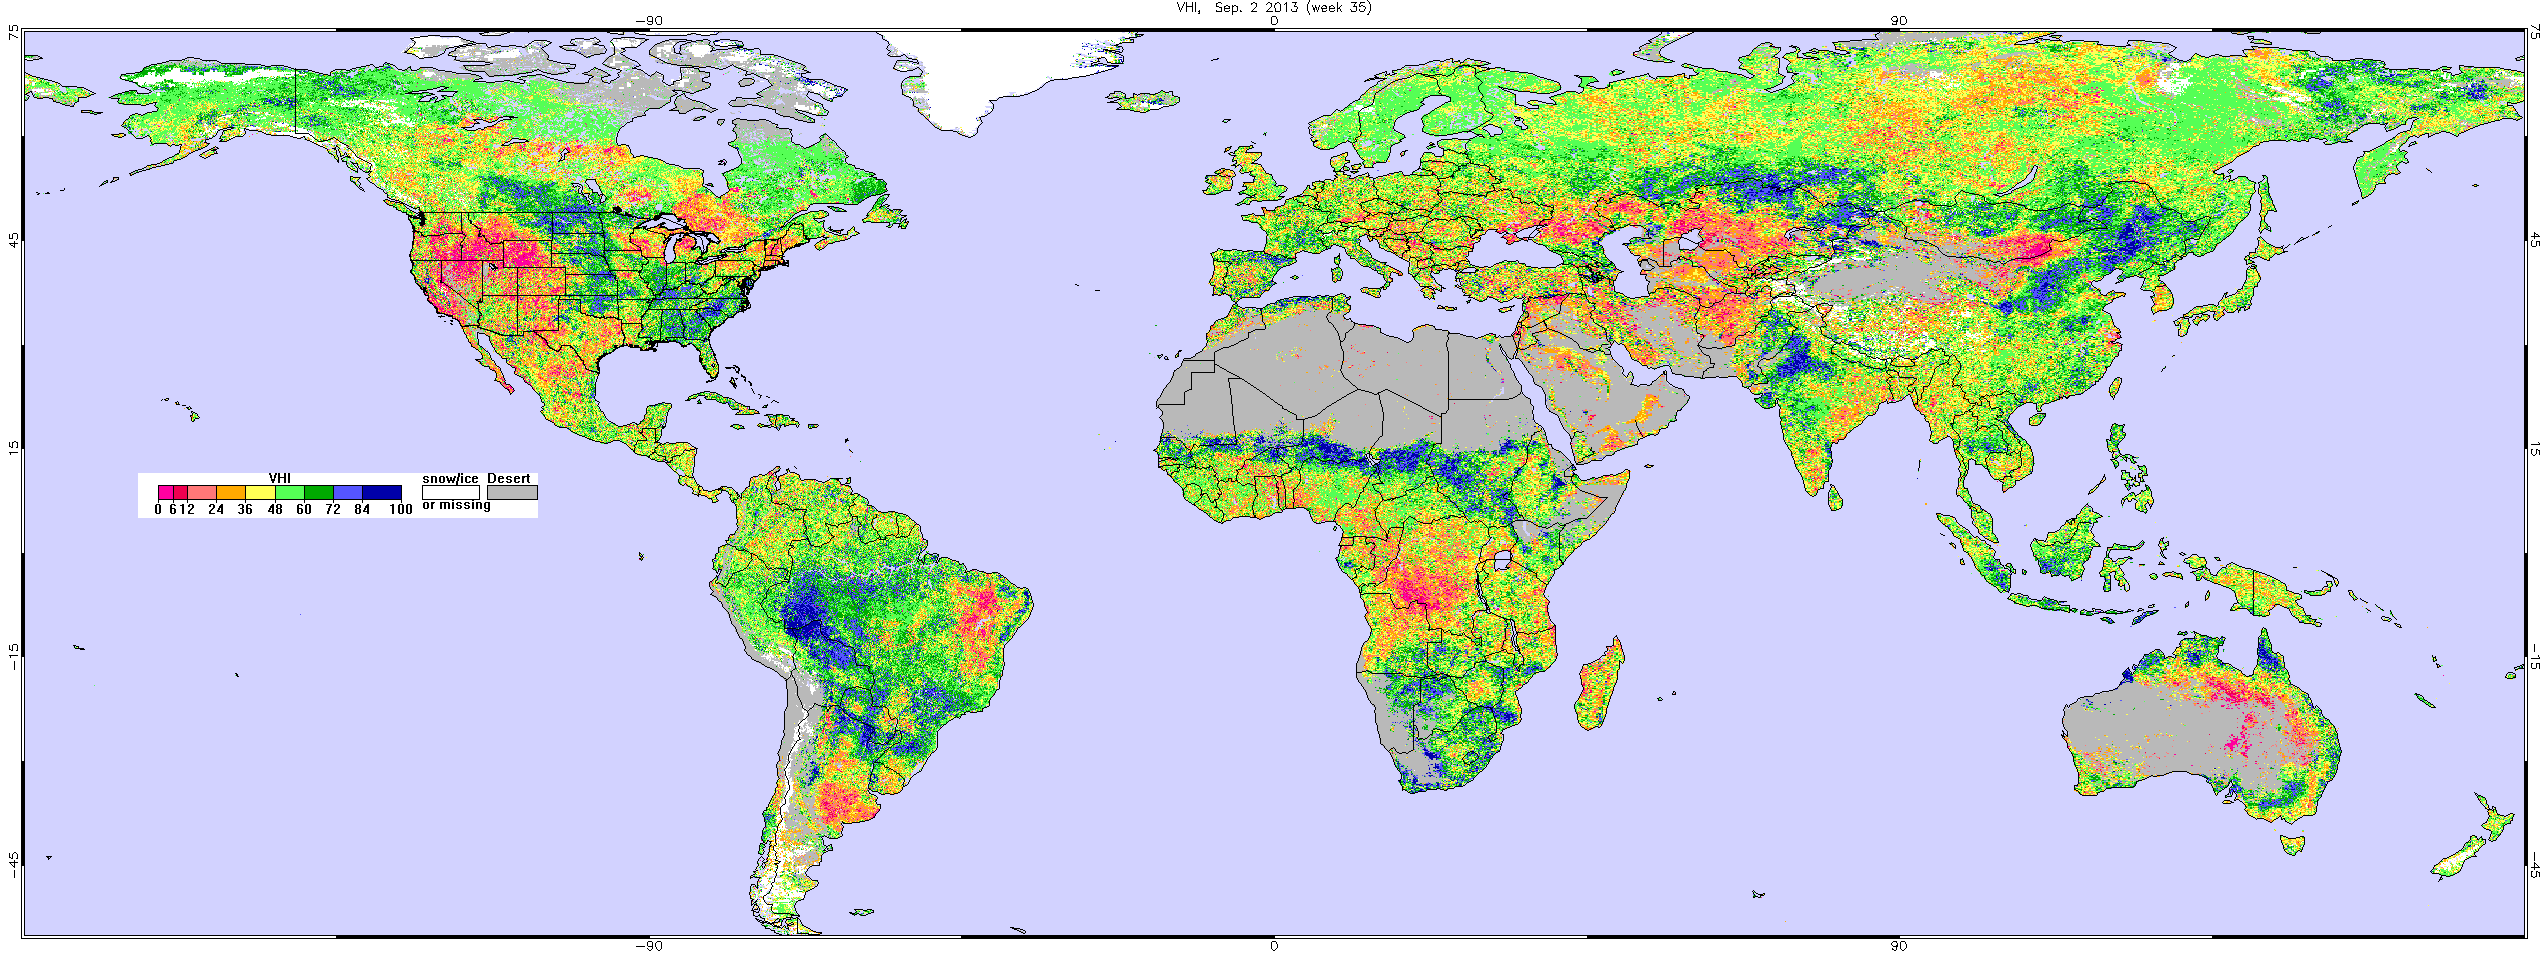
- the NOAA/NESDIS satellite-based Vegetation Health Index (VHI);
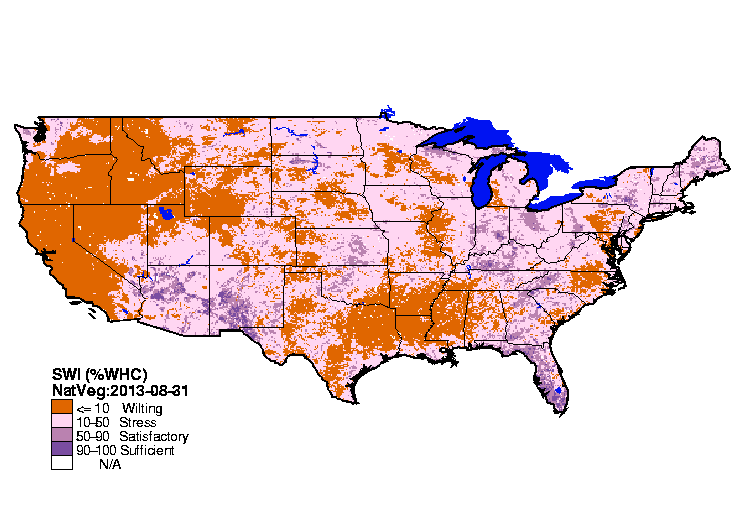
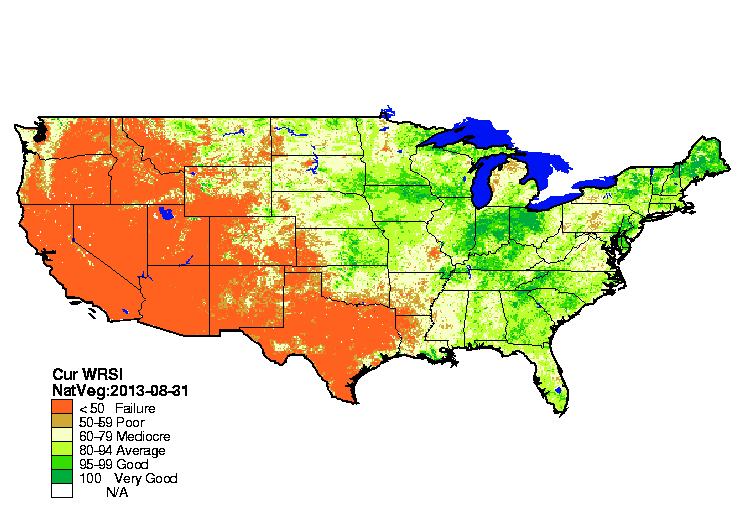
- the USGS agro-hydrologic model (Soil Water Index, Water Requirement Satisfaction Index);
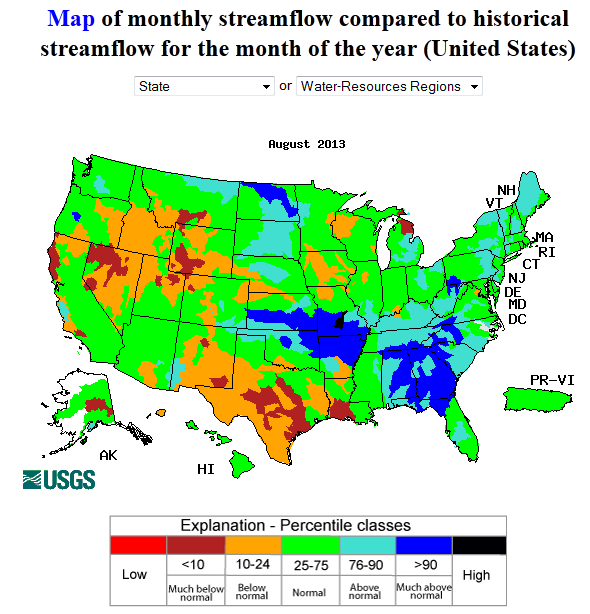
Hydrological:
Map showing NOAA NLDAS model streamflow percentiles.
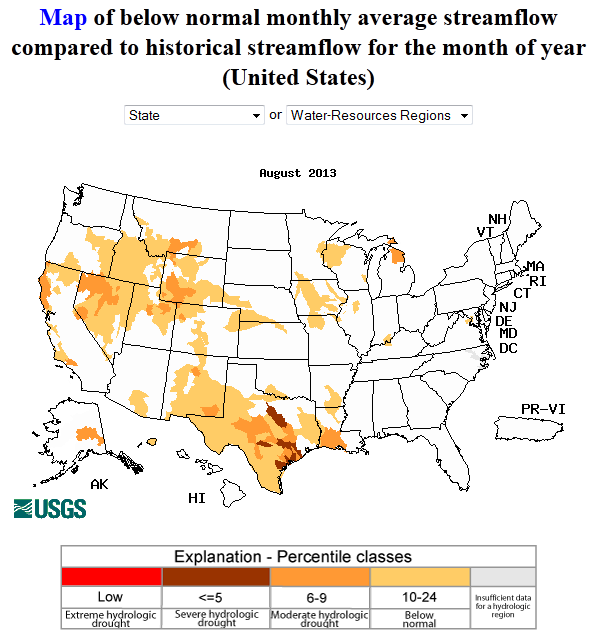
- USGS (U.S. Geological Survey) observed streamflow percentiles (just those basins below average);
- VIC 1-, 2-, 3-, and 6-month runoff percentiles;
- NLDAS model runoff anomalies and percentiles;
- NLDAS modeled streamflow anomalies and percentiles;
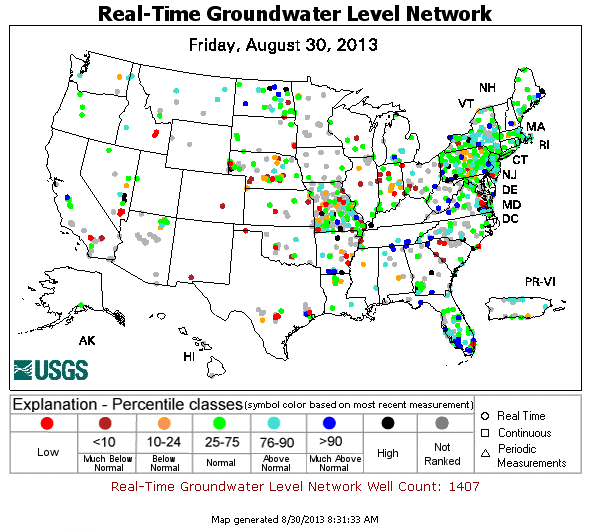
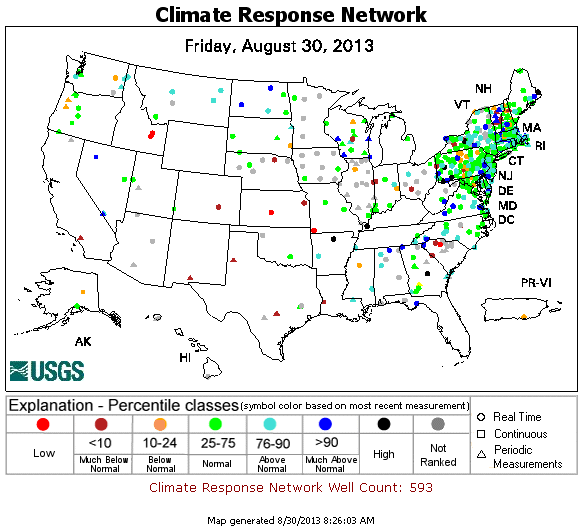
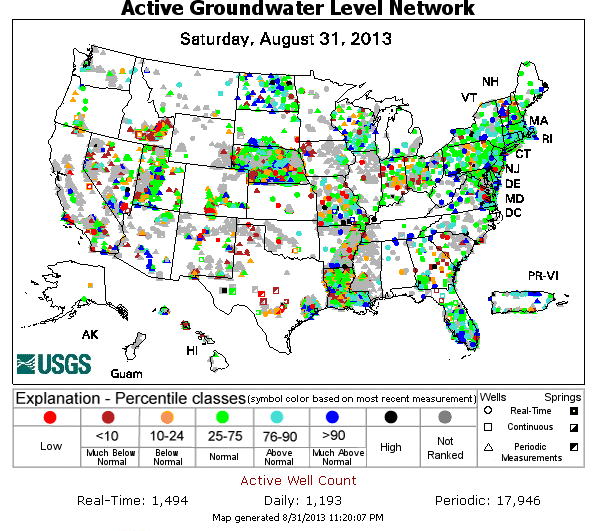
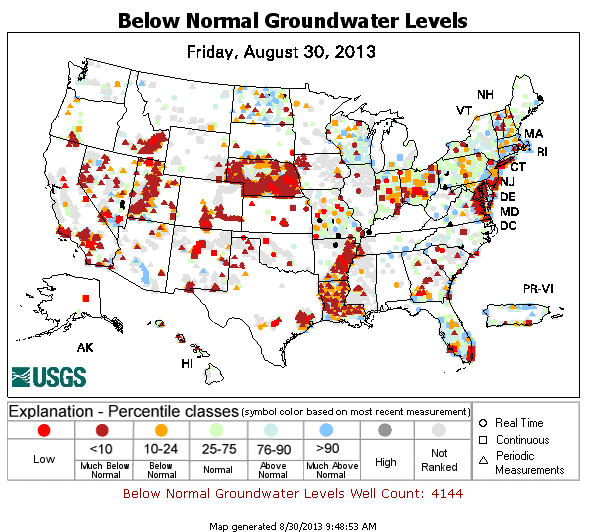
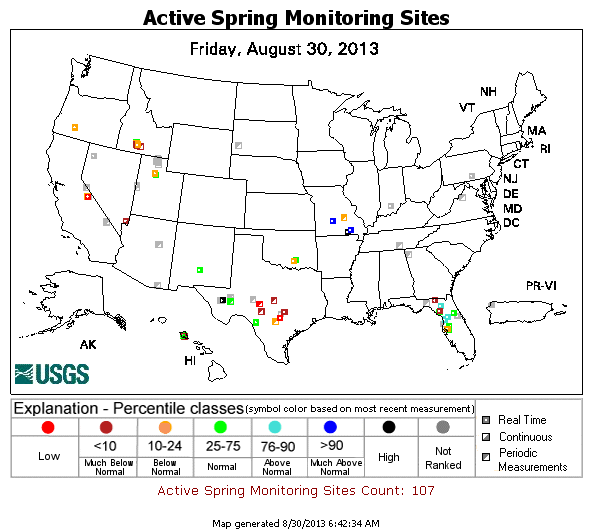
- USGS groundwater observations (real-time network, climate response network, total active network, just the below-normal observations) and spring water observations;
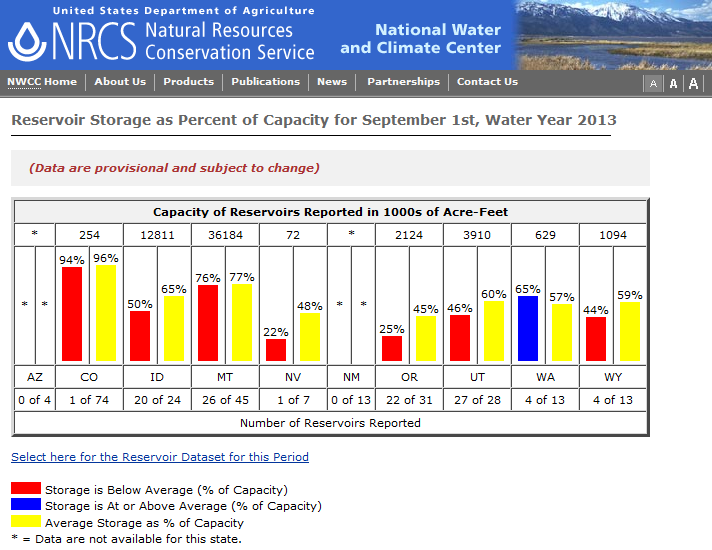
- USDA statewide reservoir storage as percent of capacity;
Meteorological:
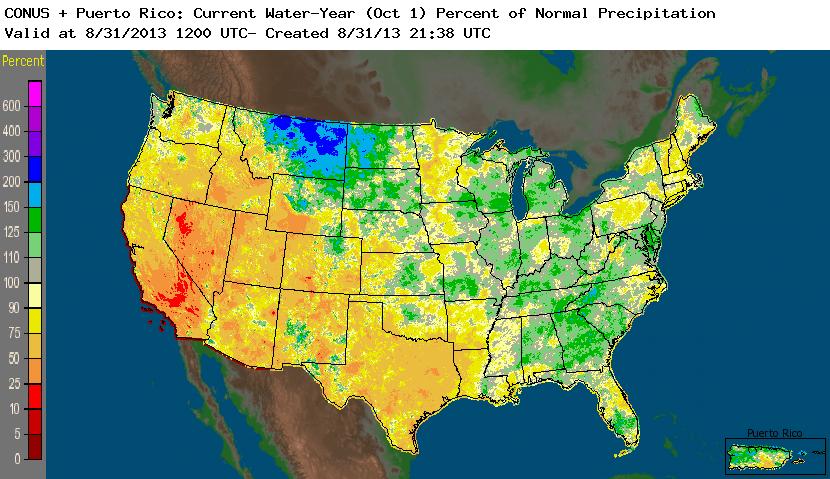
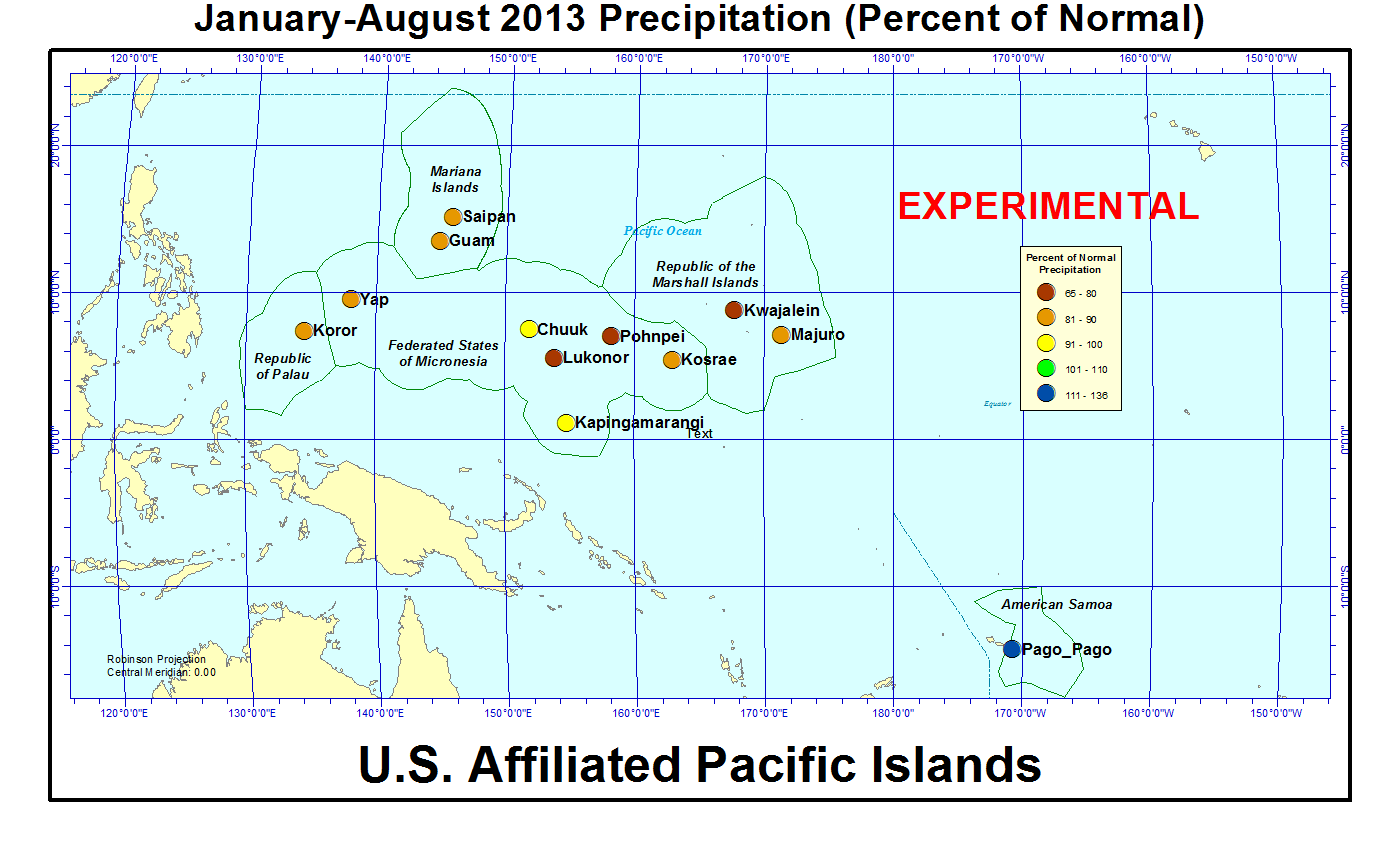
Map showing year-to-date percent of normal precipitation.
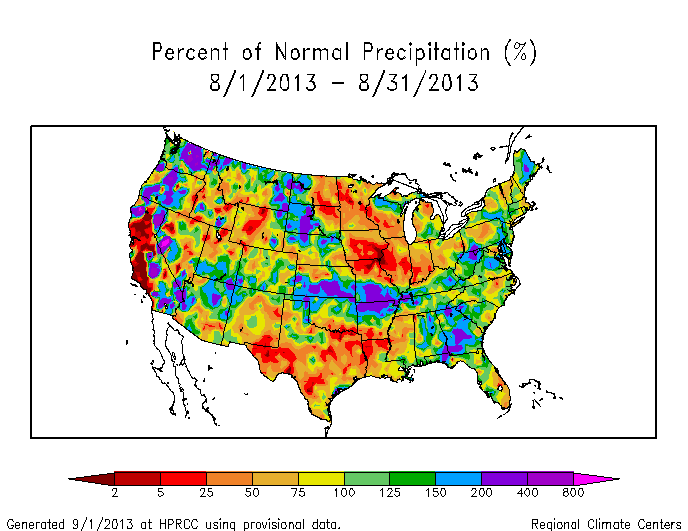
- monthly total precipitation (plotted by the USGS, Oregon State University PRISM Climate Group [preliminary], NOAA National Weather Service [NWS], and NOAA High Plains Regional Climate Center [HPRCC]);
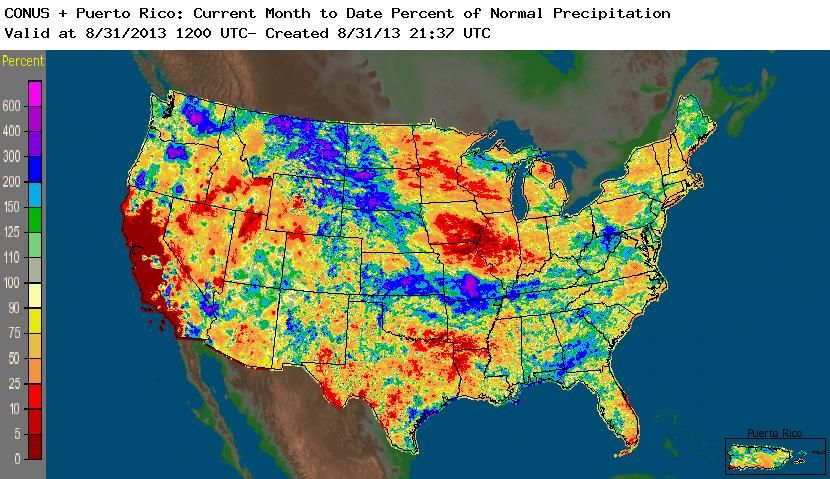
- monthly percent of normal precipitation and precipitation percentiles (NWS, HPRCC station observations, West SNOTEL and ACIS stations, West basins, Alaska SNOTEL stations, Leaky Bucket model, CPC, Oregon State University PRISM Climate Group [preliminary]) and precipitation anomalies (CPC);
- NCDC monthly statewide precipitation ranks;
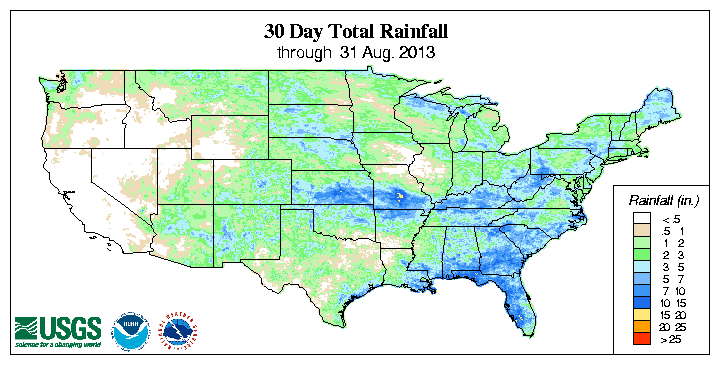
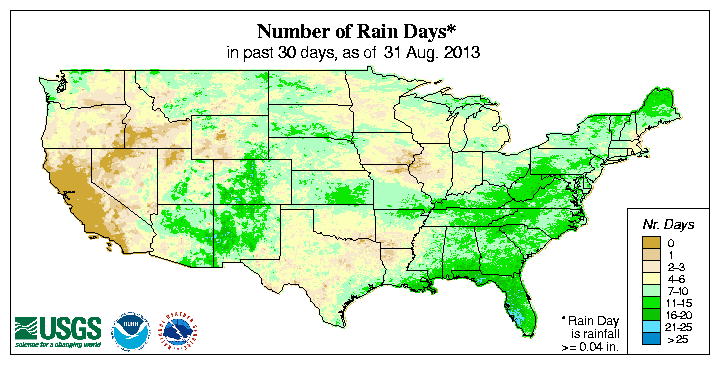
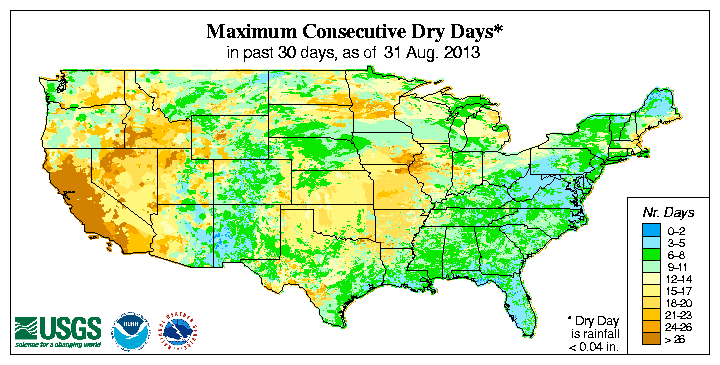
- USGS 30-day number of days with precipitation and maximum number of consecutive dry days;
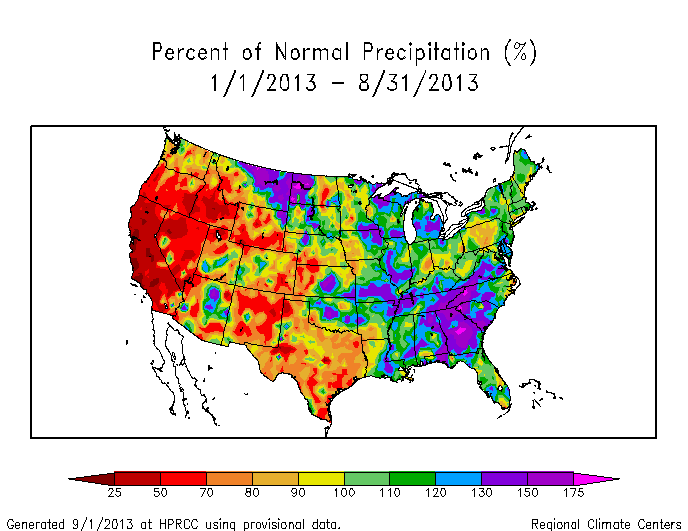
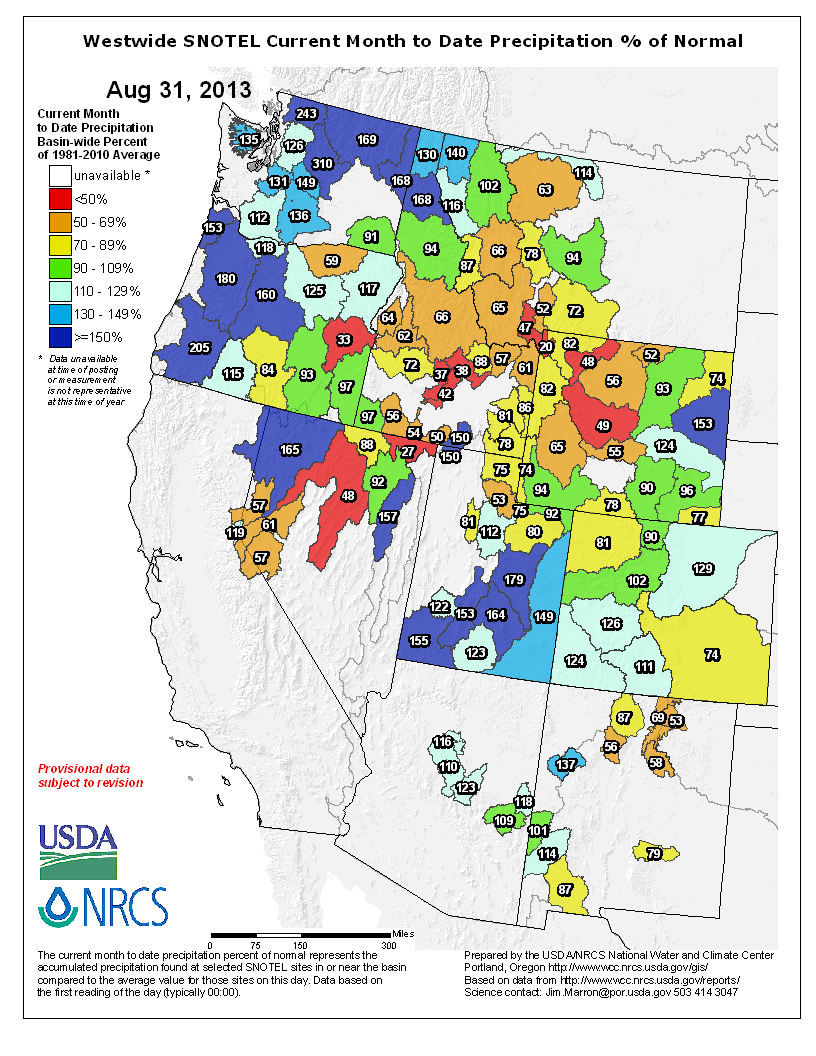
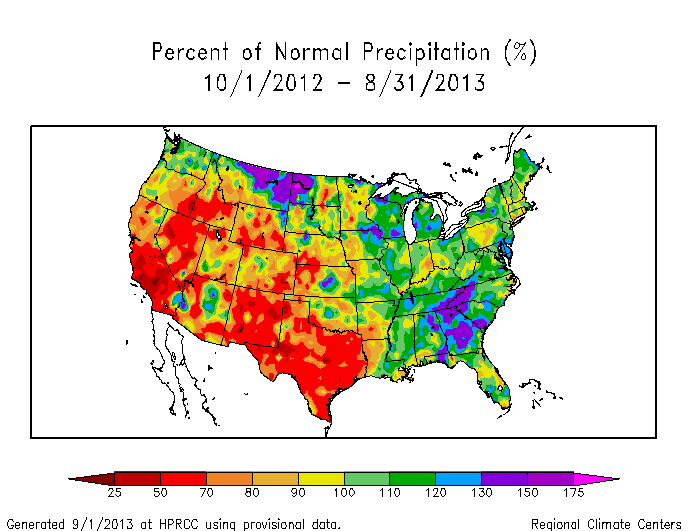
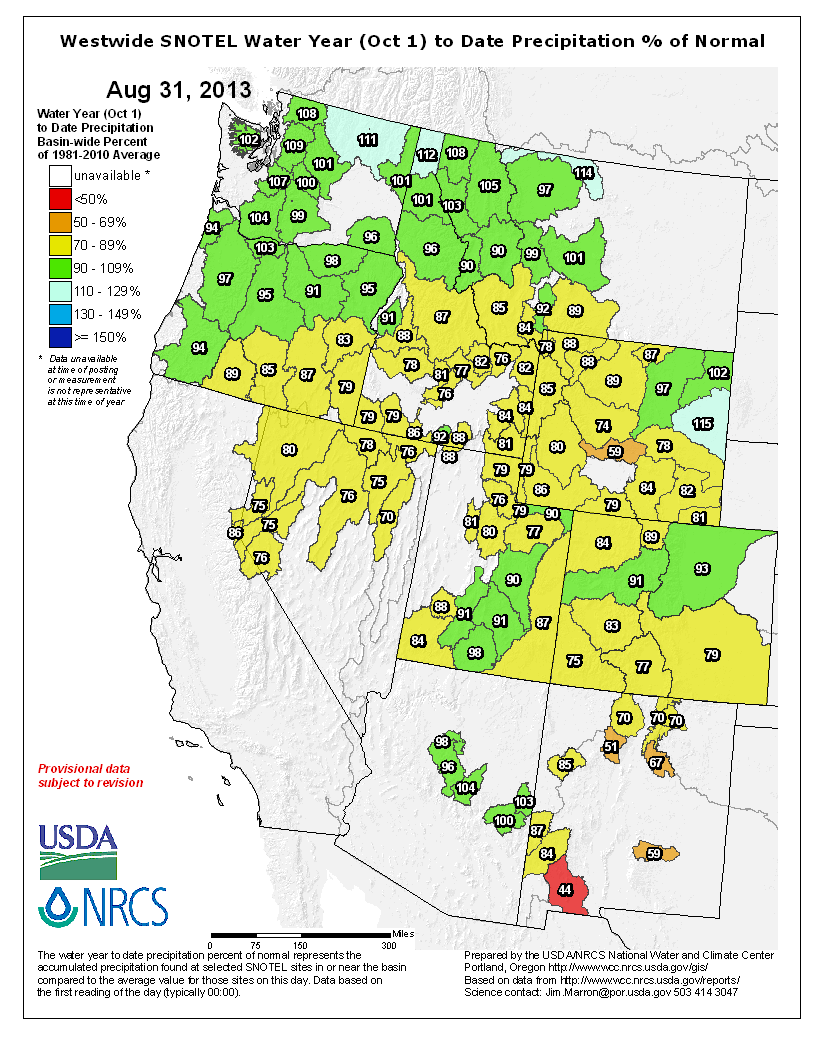
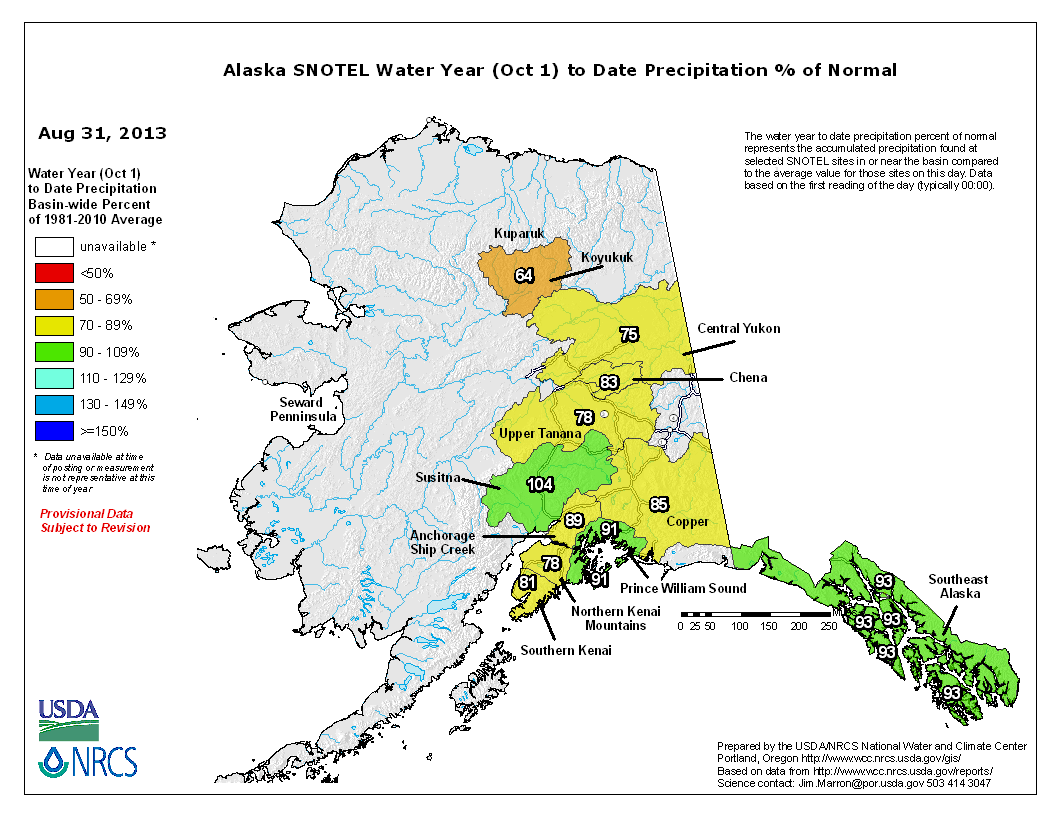
- water-year-to-date (October-present) percent of normal precipitation (NWS, HPRCC station observations, West SNOTEL and ACIS stations, West basins, Alaska stations, Alaska basins), percent of average (West basins), and precipitation percentiles (West SNOTEL stations);
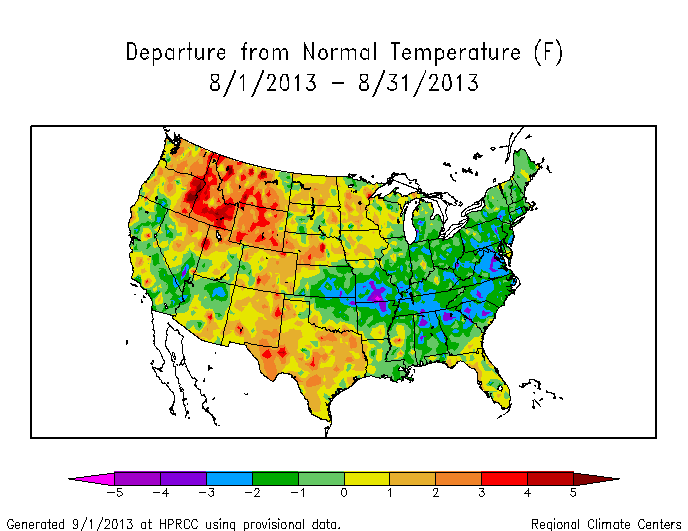
- monthly temperature departures from normal (CPC, HPRCC, Oregon State University PRISM Climate Group [preliminary]) and temperature percentiles (CPC, Leaky Bucket);
- NOAA Western Regional Climate Center monthly Standardized Precipitation Evaporation Index (SPEI);
- NCDC monthly standardized temperature departures and statewide temperature ranks; and
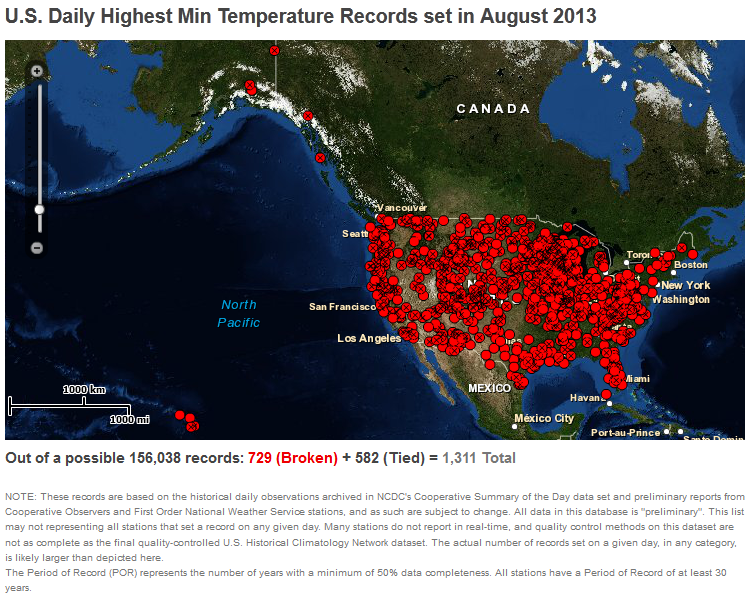
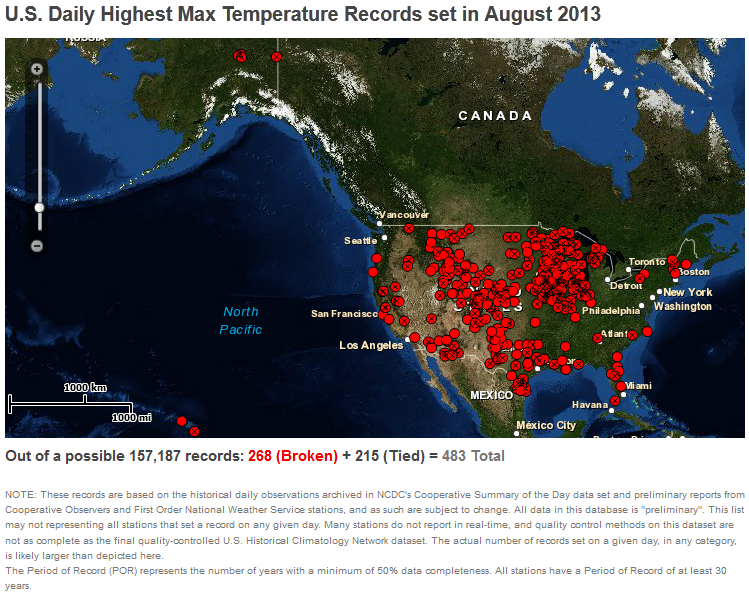
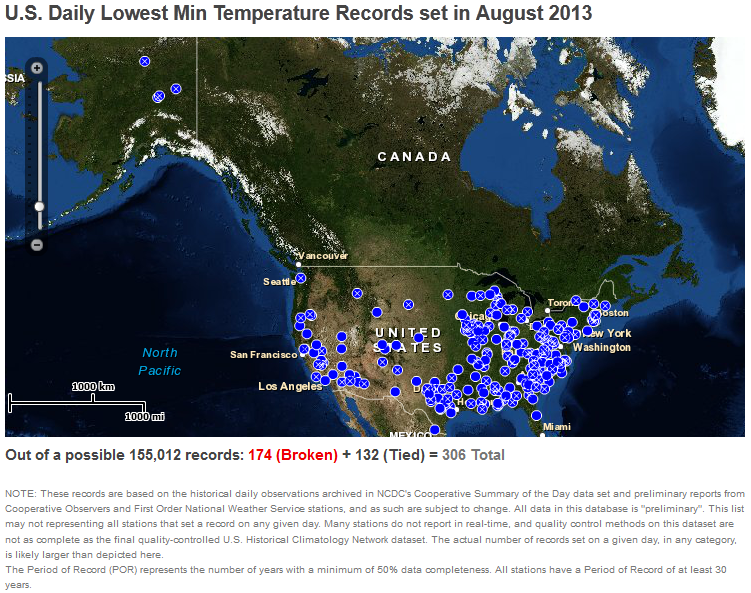
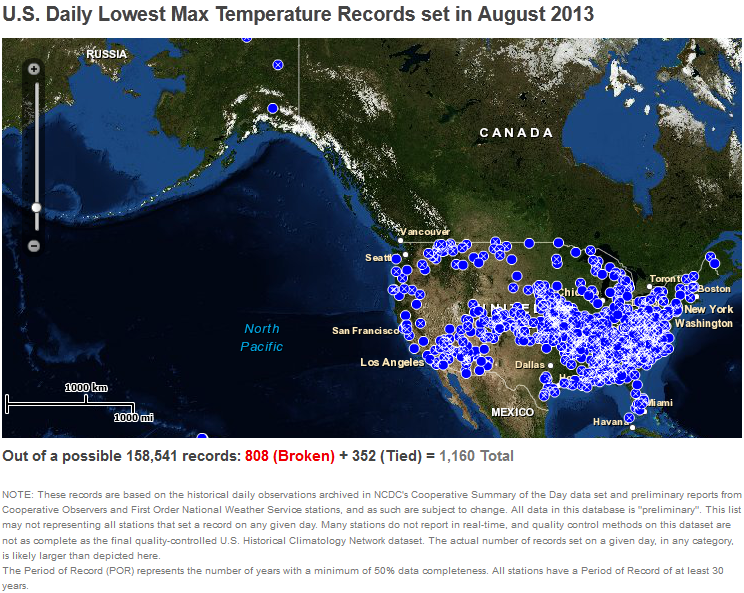
- number of record warm daily low temperatures, record daily high temperatures, record daily low temperatures, and record cool daily high temperatures, set during the month (from NCDC's daily records analysis) — slightly more record warm high and low temperatures occurred as record cool highs and lows (1.2 times as many).
![Oregon State University PRISM Climate Group [preliminary]](/monitoring-content/sotc/drought/2013/08/OSU-prism-pcp-amt-aug13-15pct.cai_ppt_us_us_30s_01m.png)
![NOAA National Weather Service [NWS]](/monitoring-content/sotc/drought/2013/08/noaa-nws-ahps-pcp-amt-us-mtd-0831.jpg)
![NOAA High Plains Regional Climate Center [HPRCC]](/monitoring-content/sotc/drought/2013/08/noaa-hprcc-pcp-amt-us-1m-0831.png)
![Oregon State University PRISM Climate Group [preliminary]](/monitoring-content/sotc/drought/2013/08/OSU-prism-pcp-pct-aug13-15pct.cai_ppt_us_us_30s_anom-2010-30y_01m.png)
![Oregon State University PRISM Climate Group [preliminary]](/monitoring-content/sotc/drought/2013/08/OSU-prism-tmp-dep-aug13-15pct.cai_tmean_us_us_30s_anom-2010-30y_01m.png)
Regional Discussion
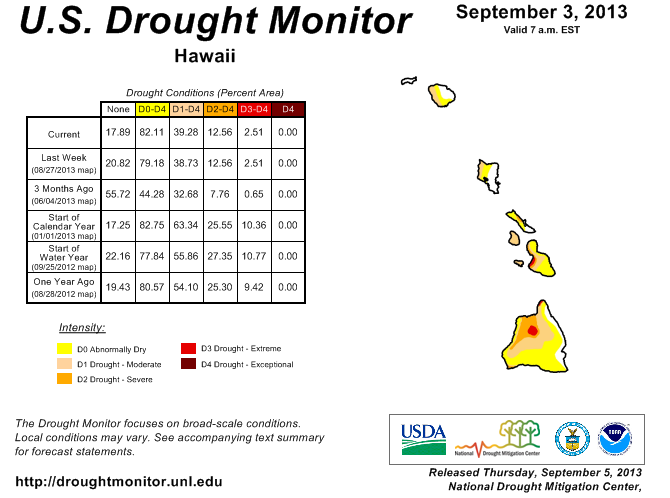
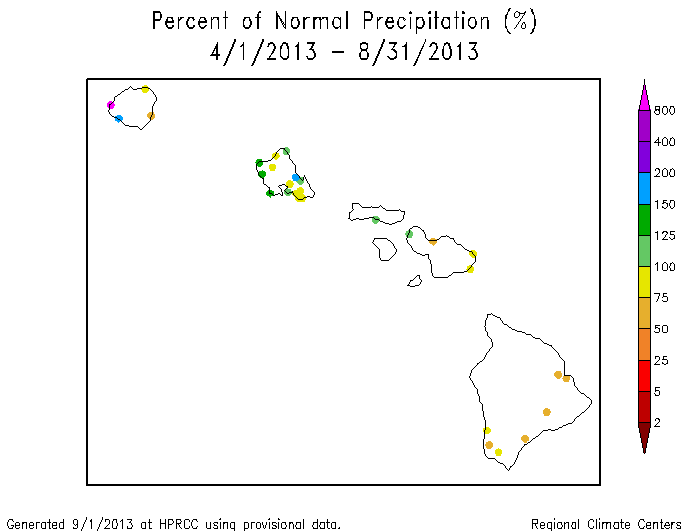
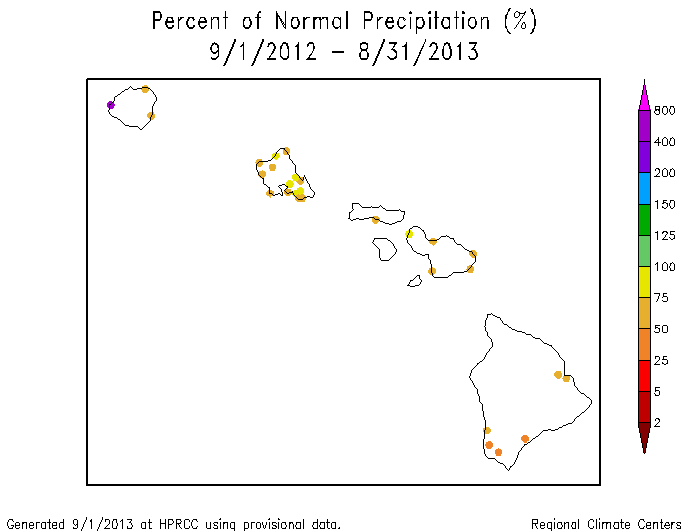
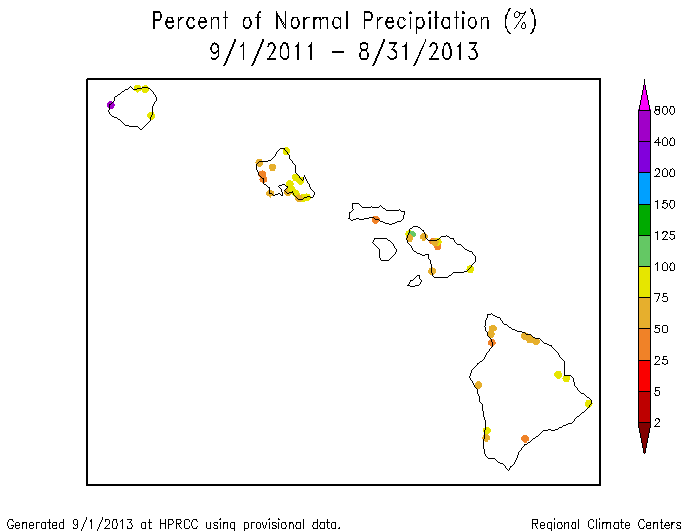
Hawaii: Precipitation for August 2013 and the last two months was below normal for most stations in the Hawaiian Islands. But when rainfall from previous months is considered, the precipitation pattern is mixed with the Big Island and Maui generally drier than normal (last 3, 5, 6, and 8 months). At longer time scales, dryness is more widespread across the islands (last 11, 12, and 24 months). Moderate to extreme drought expanded this month (to 39.3% of the state) compared to last month (33.1%).
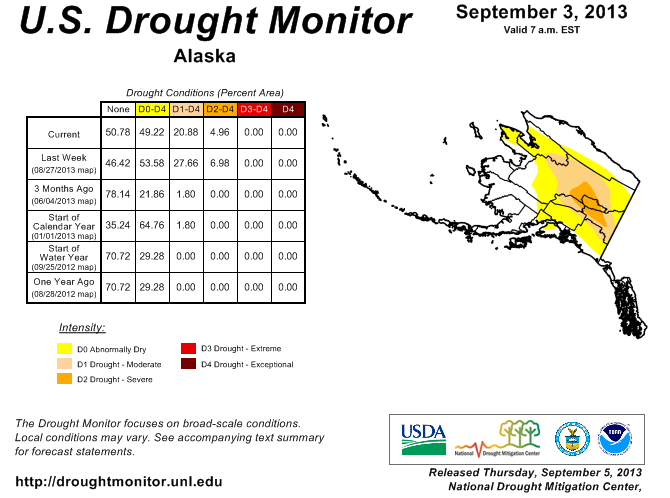
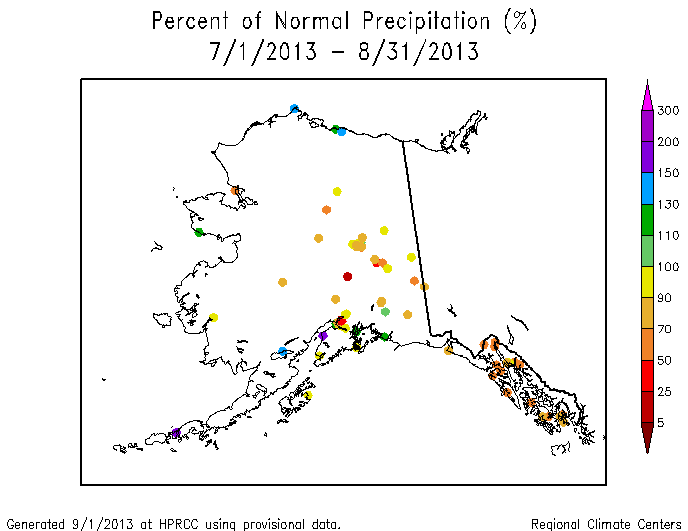
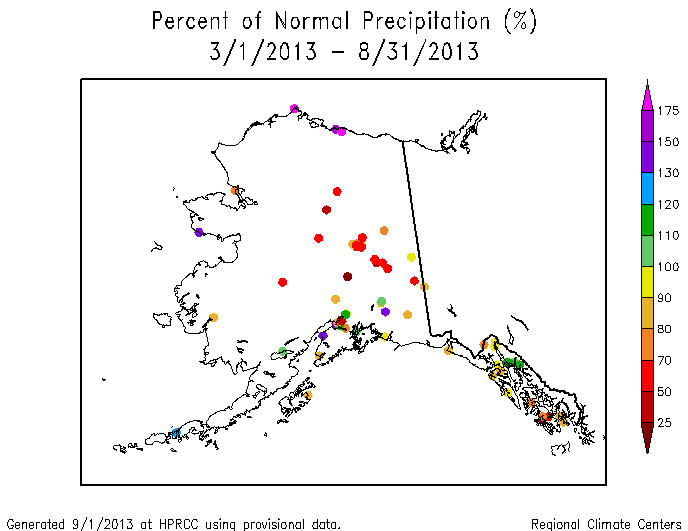
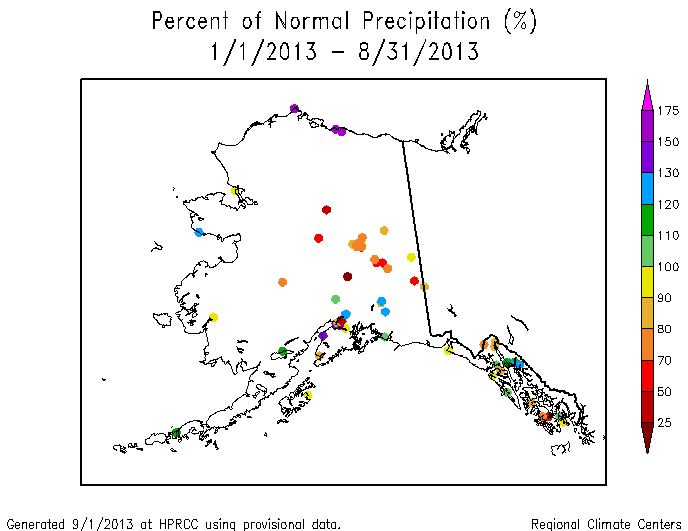
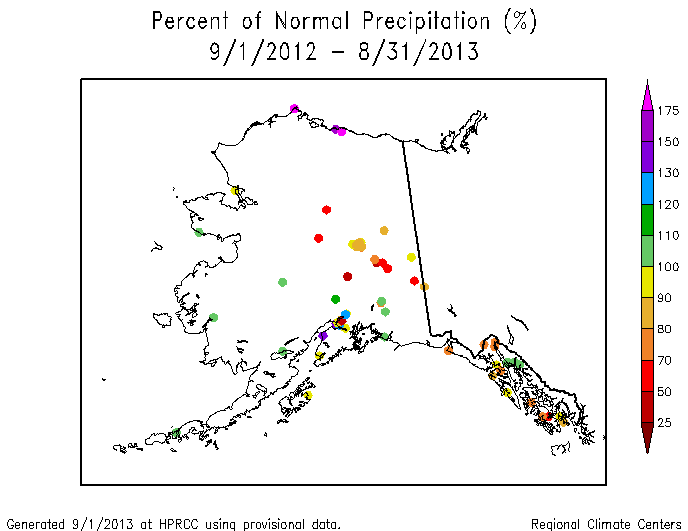
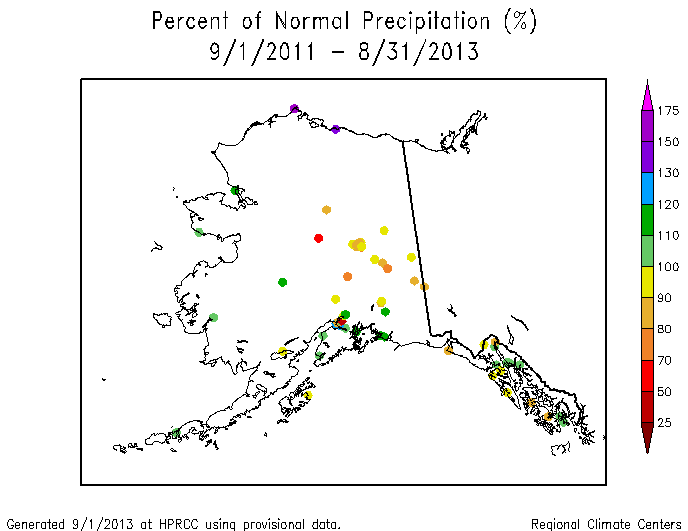
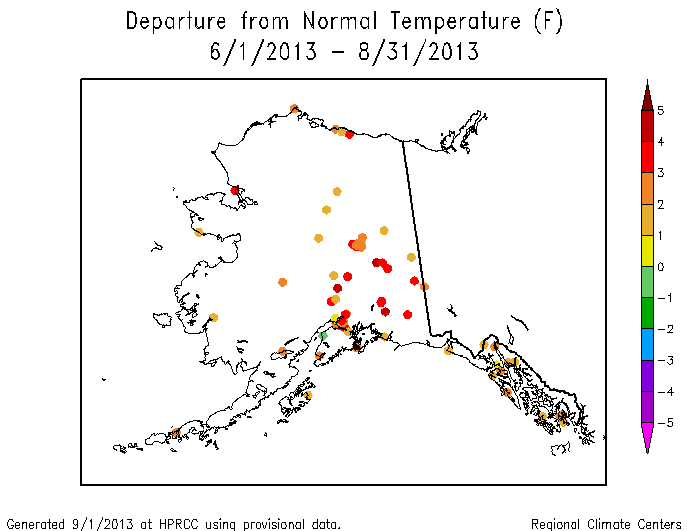
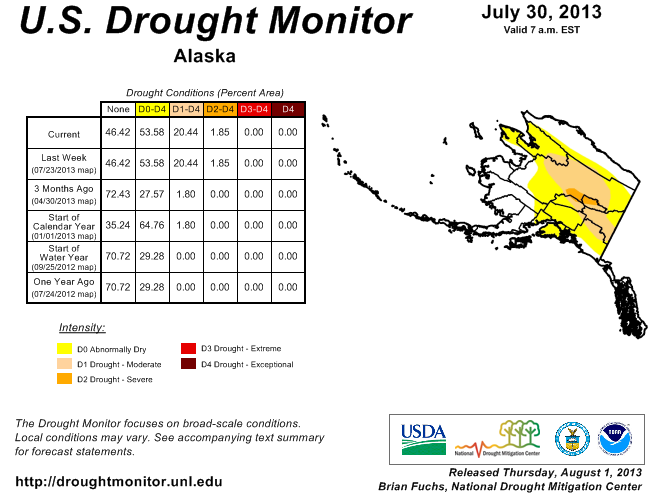
Alaska: The precipitation pattern across Alaska was mixed during August, but dryness dominated during the summer and for longer time scales during the last year (last 2, 3, 5, 6, 8, 11, and 12 months), especially in the interior regions, but is also evident at longer time scales. The dryness, coupled with unusually hot temperatures, set the stage for numerous wildfires, especially earlier in the month, and depleted soil moisture. At the beginning of the month, 60 percent of Alaska's topsoil and 60 percent of the subsoil was short or very short of moisture, with 40 percent of pasture, 30 percent of barley, and 20 percent of oats rated in poor or very poor condition. Conditions were especially dire in parts of the state. By the end of the month, soil moisture had improved slightly, with 40 percent of topsoil and 50 percent of subsoil short or very short, but 35 percent of barley and 25 percent of oats were rated poor or very poor, while 30 percent of pasture was so rated. Streamflow on interior rivers was much below normal. Extreme (D2) drought expanded on the USDM map by the end of this month, reaching about 5 percent compared to 1.9 percent last month, but the total percent area in moderate to extreme drought remained about the same (20.9%).
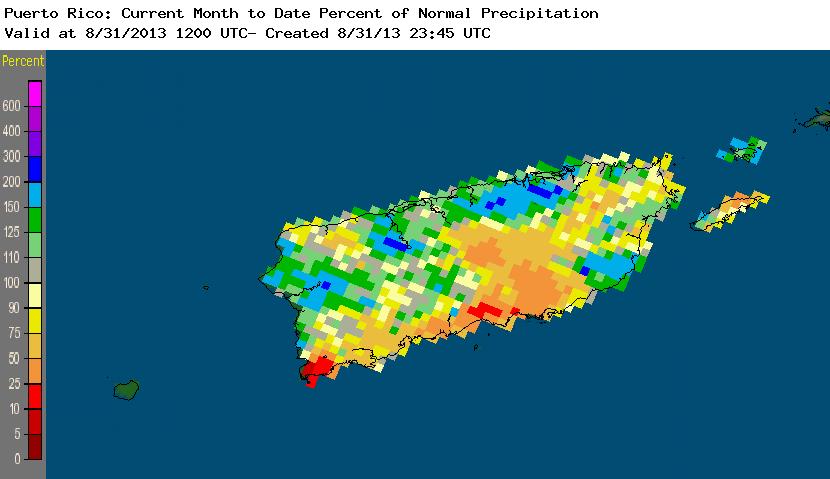
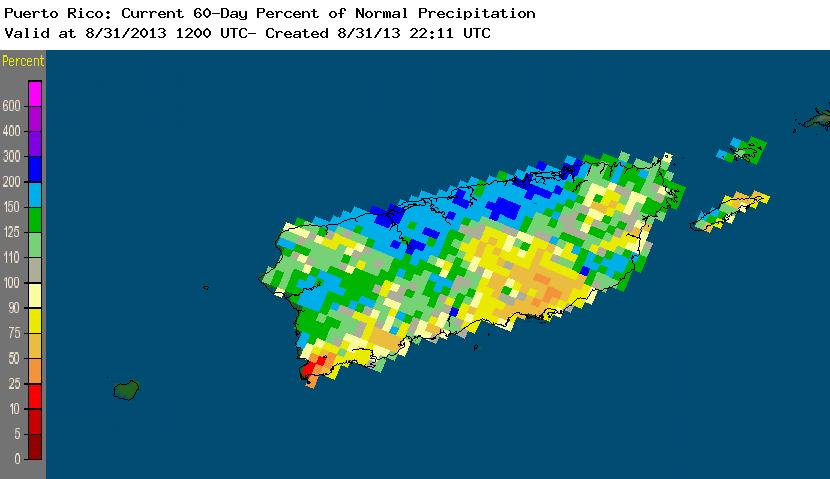
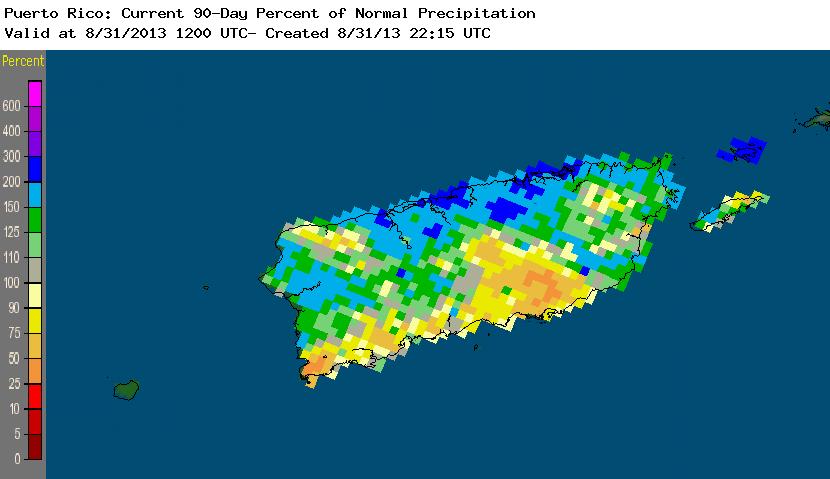
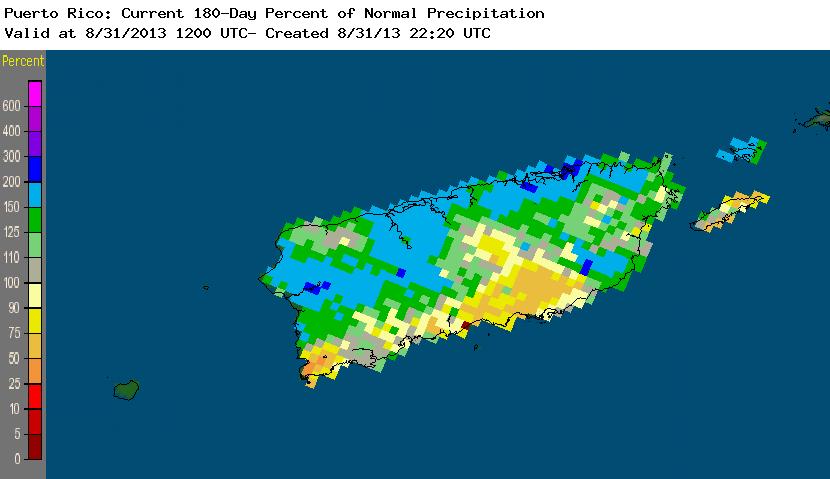
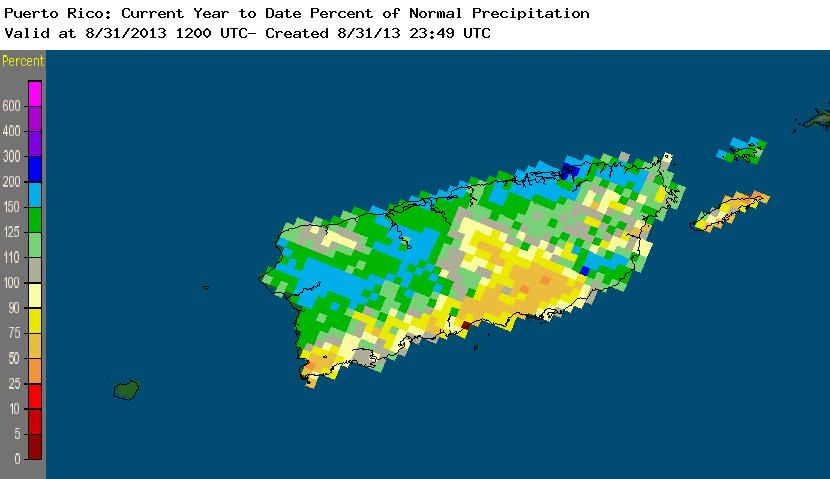
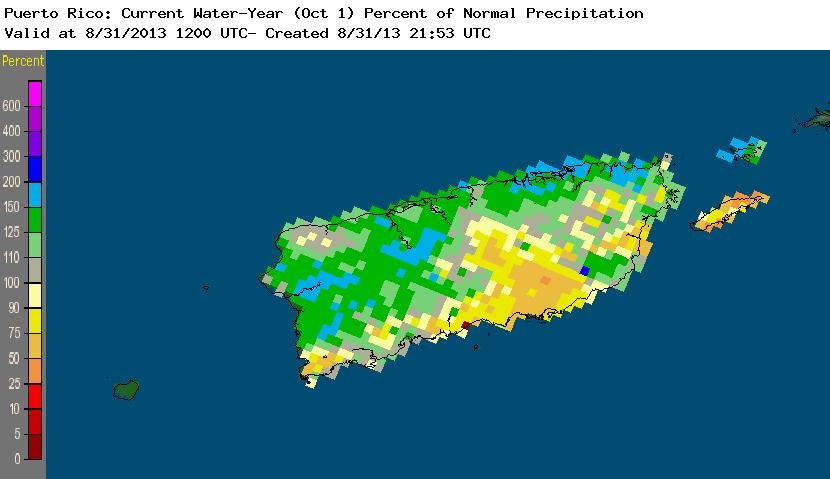
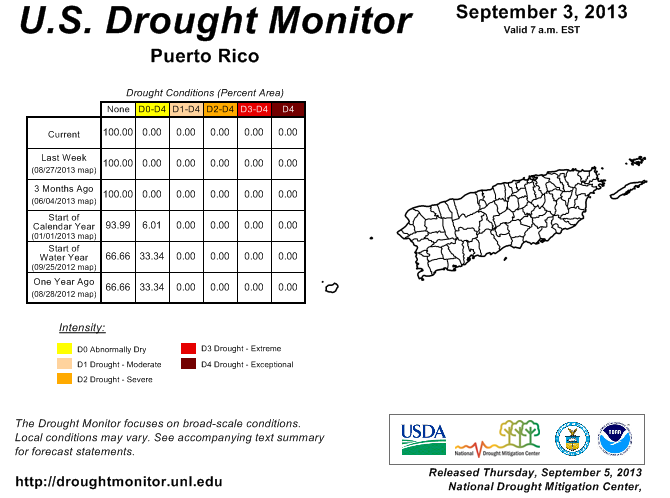
Puerto Rico: Parts of Puerto Rico had below-normal rainfall during August, mostly in the central and southern coastal regions. A pattern of below-normal precipitation in the central, and especially southern, regions is evident at longer time scales (2, 3, 6, 8, and 11 months). Streamflow averaged above normal and there was no drought or abnormal dryness on the USDM map.
 |
|
The August precipitation anomaly pattern of dryness in the Midwest, Southern Plains, and Lower Mississippi Valley was reflected in the state ranks, with Illinois, Indiana, Minnesota, and Iowa ranking in the top ten driest category, and six other states falling in the driest third of the historical record. Record dryness occurred in parts of western Illinois and eastern Iowa.
 |
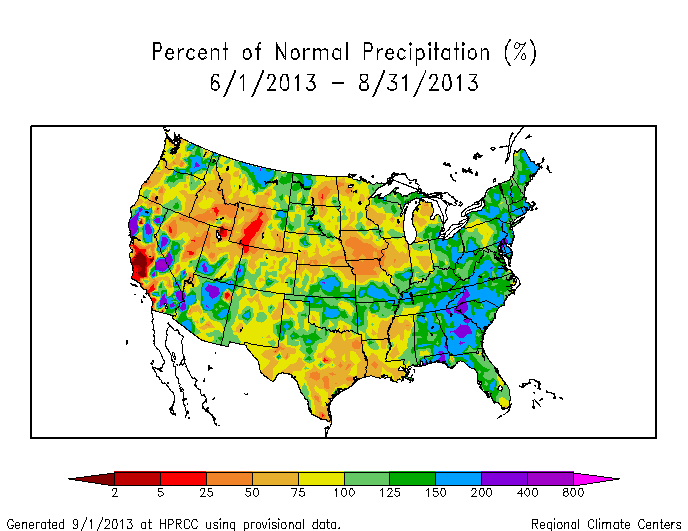
|
Summer (June-August 2013) was wetter than normal in the eastern U.S. (where four states — Florida, Georgia, New York, and South Carolina — had the wettest summer in the 1895-2013 record) and drier than normal in scattered states from the Midwest to Pacific Northwest, and in the Lower Mississippi Valley, where seven states ranked in the driest third of the historical record. But the wet June helps the summer precipitation ranks in the Midwest mask the extreme dryness which happened during the last two months. July-August 2013 ranked as the second driest July-August on record for Iowa, behind 1947; last year (July-August 2012) ranked eighth driest.
|
|
At the six-month time scale, dryness was widespread across the West and Southern Plains while wet conditions dominated the North Central to eastern United States. March-August 2013 ranked in the driest third of the historical record for eight states. Four western states (Idaho, Nevada, Oregon, and California) ranked in the top ten driest category for the year-to-date, with California having the driest January-August on record. Four other states ranked in the driest third of the historical record. The last twelve months (September 2012-August 2013) were drier than normal across much of the West and more of the Great Plains. While no state ranked in the top ten driest category, nine states fell in the driest third of the historical record.
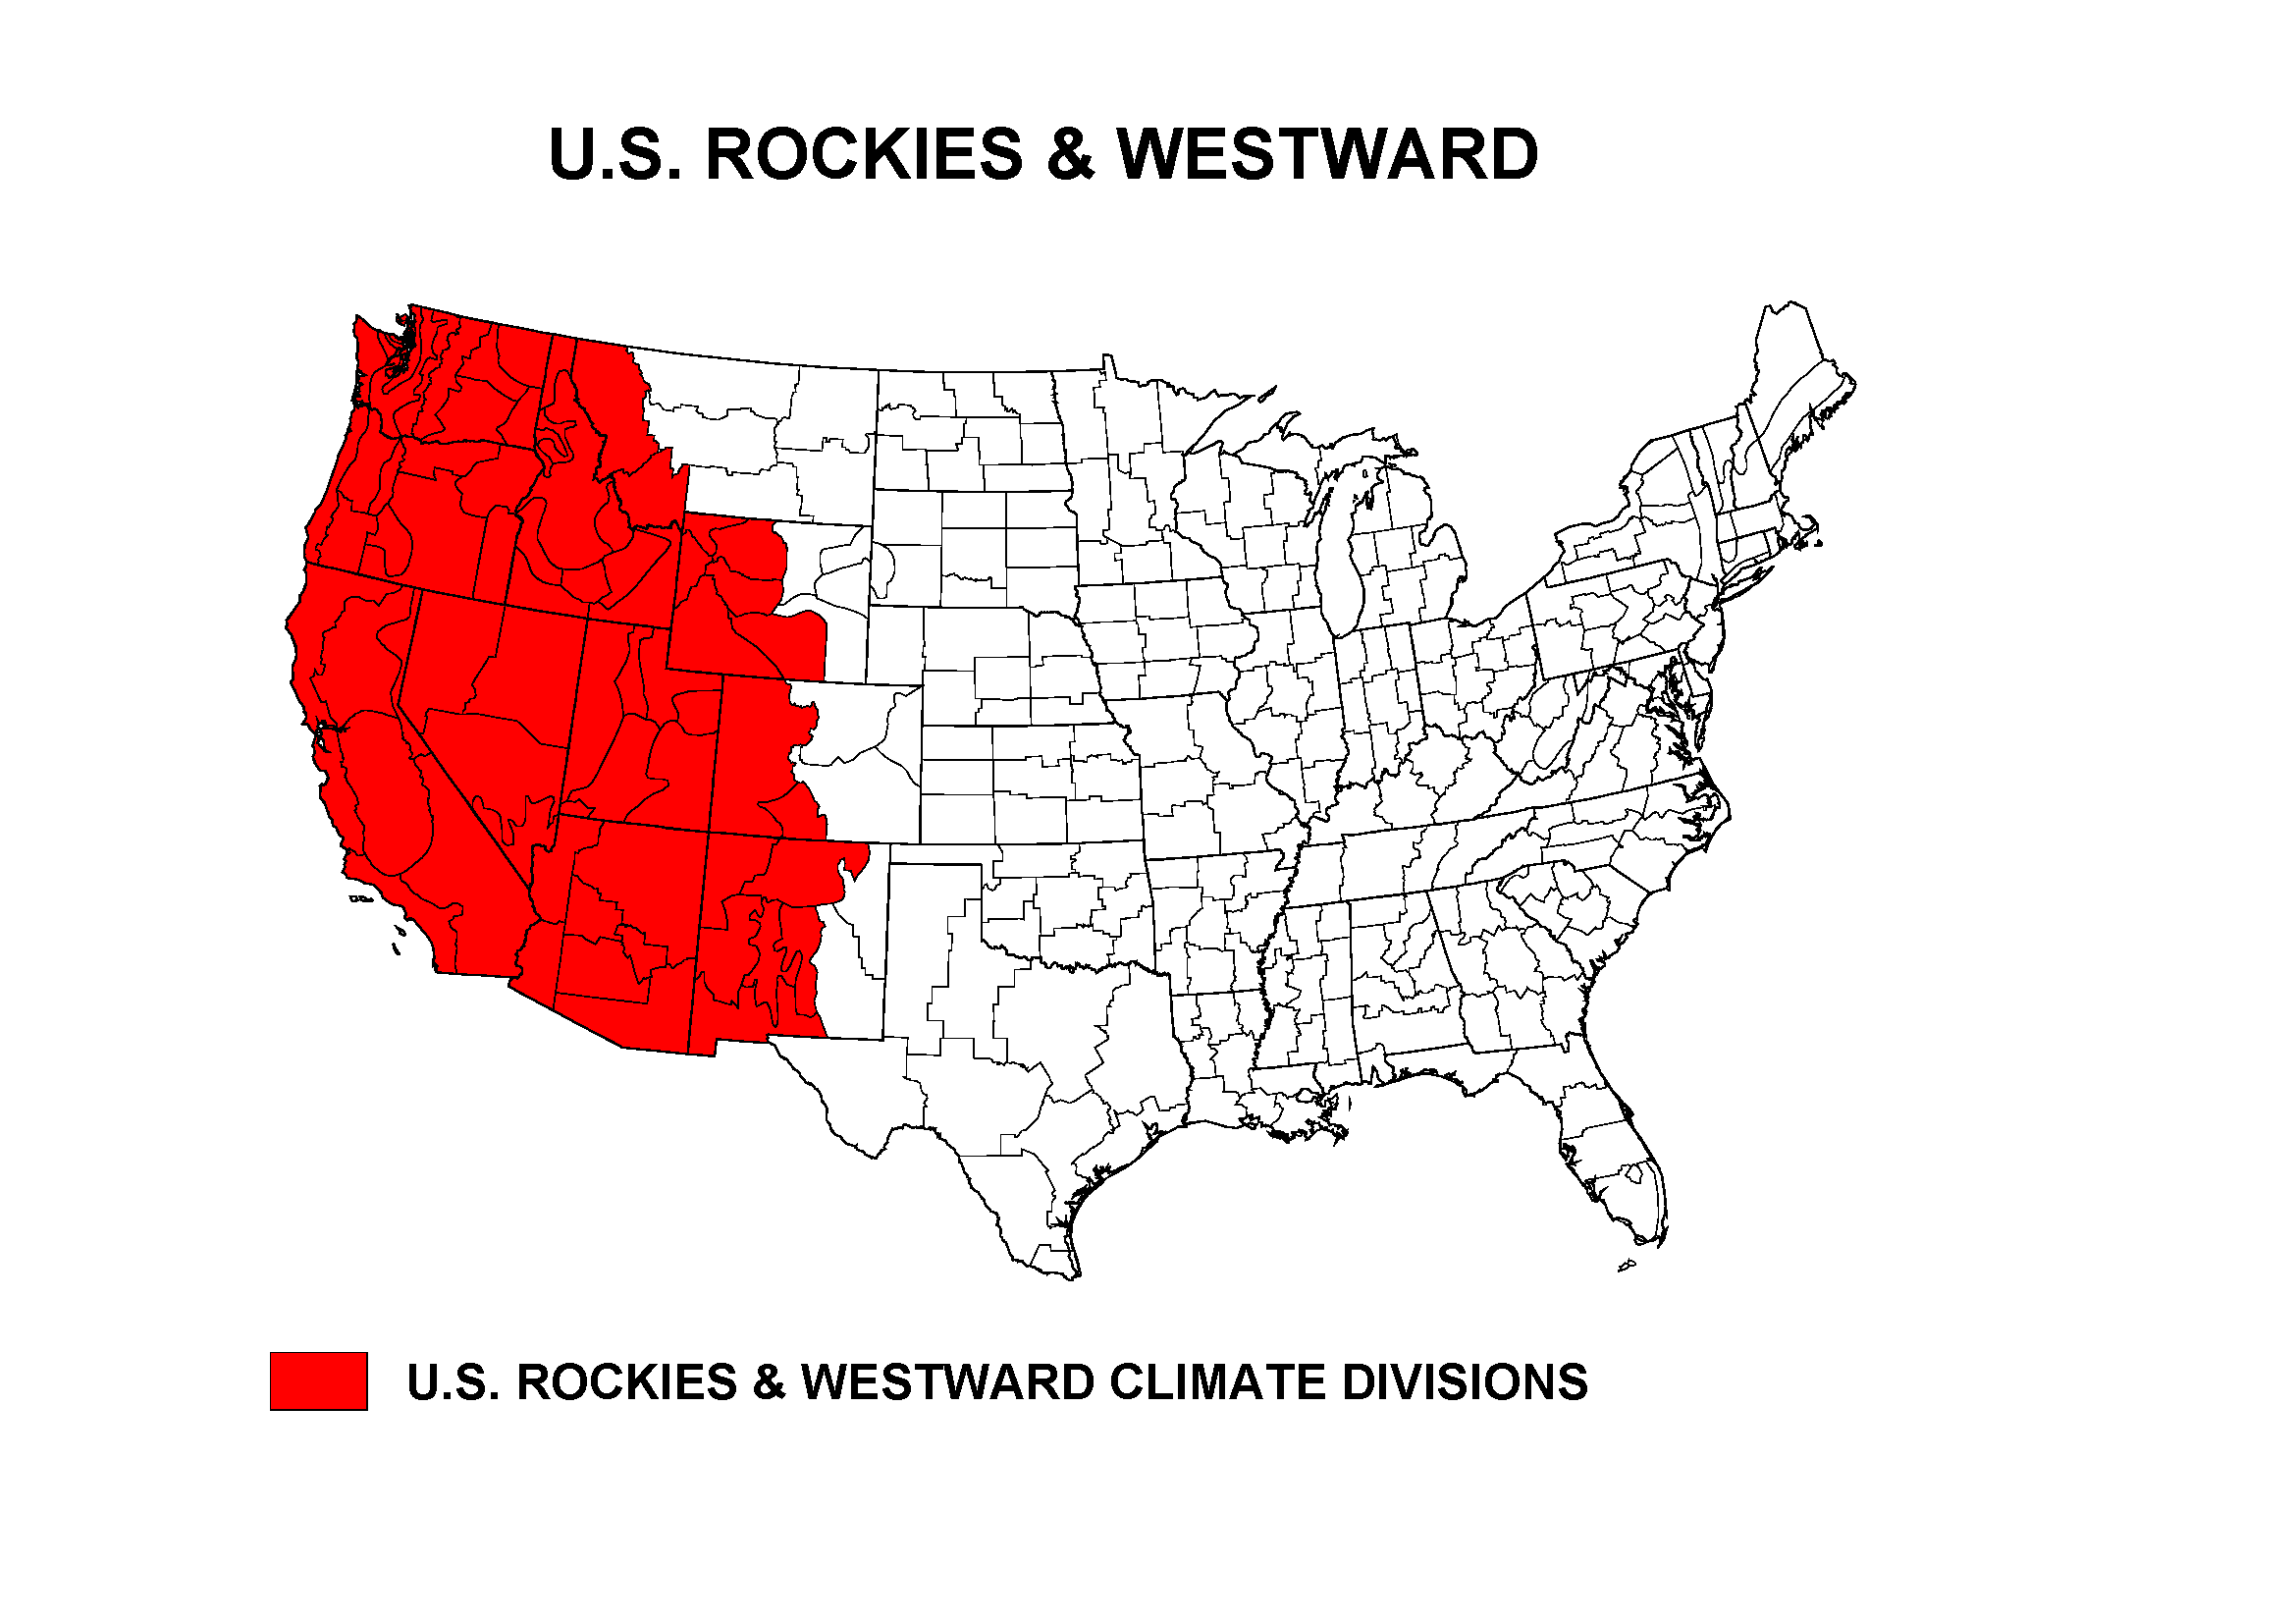
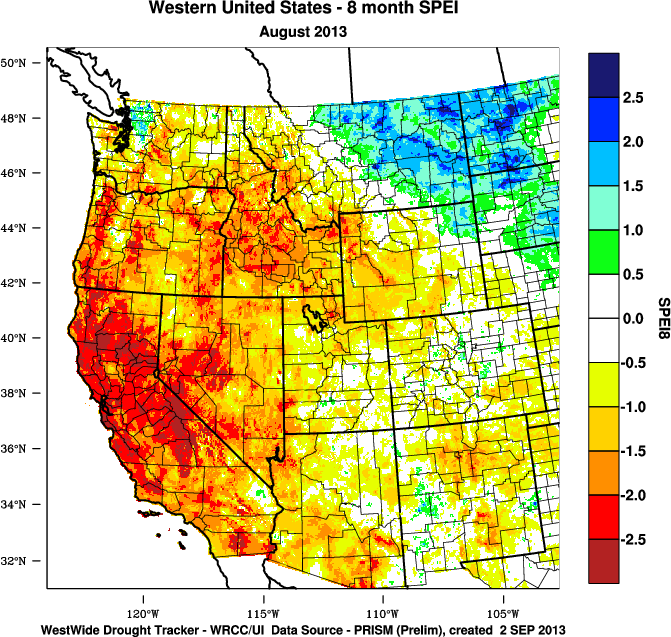
Percent area of the Western U.S. in moderate to extreme drought, January 1900 to present, based on the Palmer Drought Index.
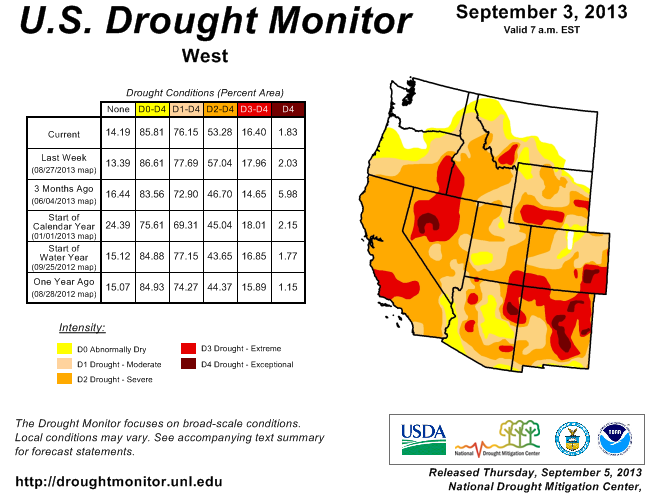
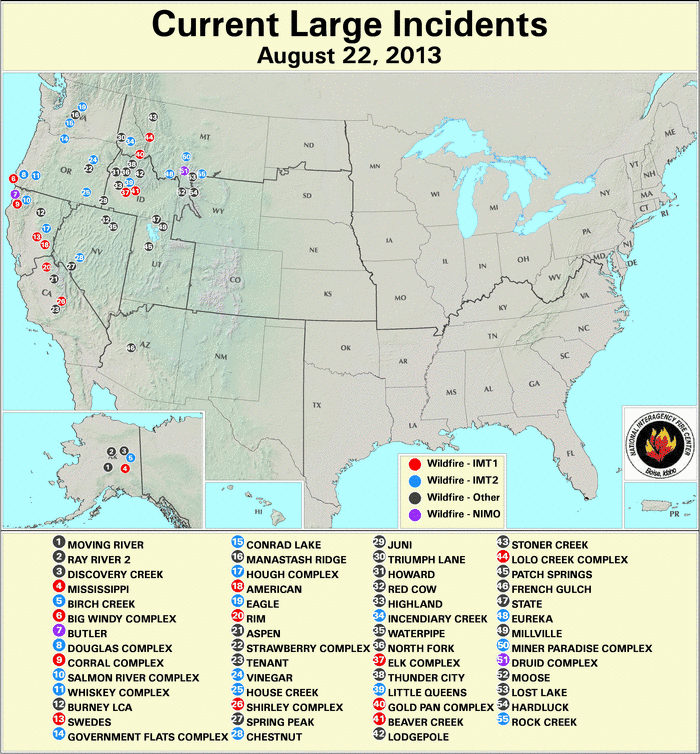
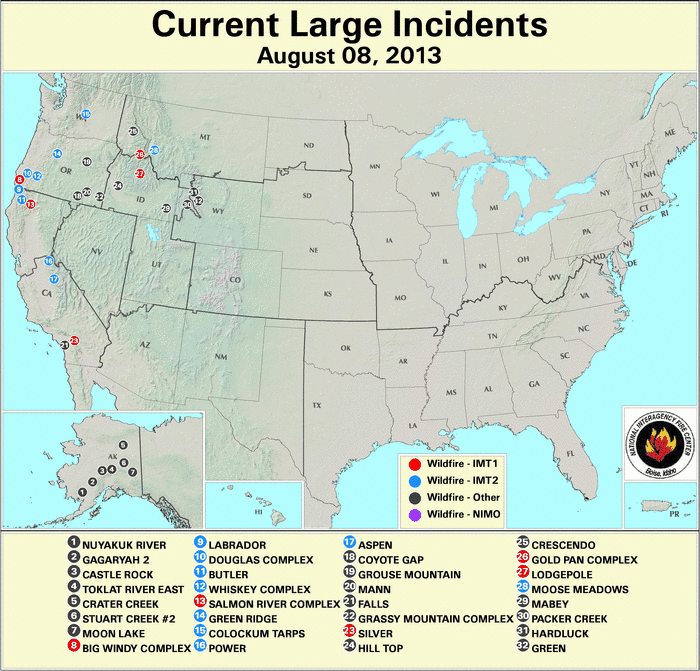
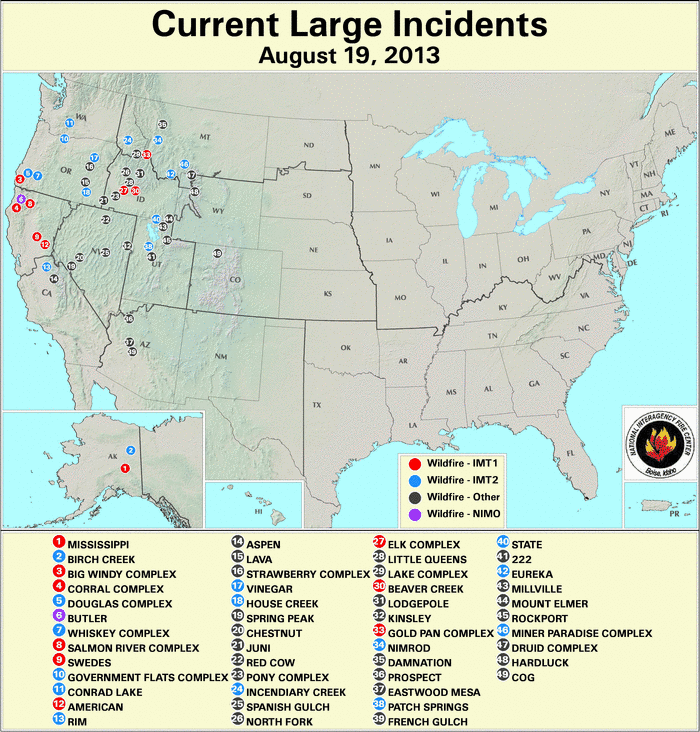
Monsoon showers brought above-normal precipitation to southern portions of the West during August 2013, and frontal rains brought above-normal precipitation to the coastal Northwest, but otherwise the northern portions were drier than normal. August temperatures were much above normal in northern portions of the West. The SPI measures water supply and indicated dry (stressful) moisture conditions in parts of the Northwest to Central Rockies. But when temperature is incorporated into the index (as the Standardized Precipitation Evaporation Index, or SPEI), moisture stress covers a slightly larger area and is more intense. The SPEI for January-August 2013 indicates most of the West has experienced stressful conditions. The last eight months have had record dry conditions, especially in California (as noted above). Water year-to-date (October-present) precipitation was below normal for much of the West, especially parts of the southern and interior portions. Some areas, mainly the northern basins, averaged near to above normal. This pattern is evident in both the high elevation (SNOTEL) station percentiles and basin averages, as well as in low elevation station observations. The monsoon showers were reflected in near-normal streamflows in some basins, but many other western basins had below to much below-normal streamflow. Reservoir storage was near to below average in most states. Integrated satellite and ground observations of vegetation condition (VegDRI), modeled vegetation condition (Soil Water Index, Water Requirement Satisfaction Index), and USDA observations indicated widespread stress on vegetation across the West, especially the Southwest. Several large wildfires developed across the West, especially during the middle of the month. According to the USDM, 76.2 percent of the West was experiencing moderate to exceptional drought at the end of July, slightly less than last month. The Palmer Drought Index percent area statistic was 55.8 percent, a decrease from last month.
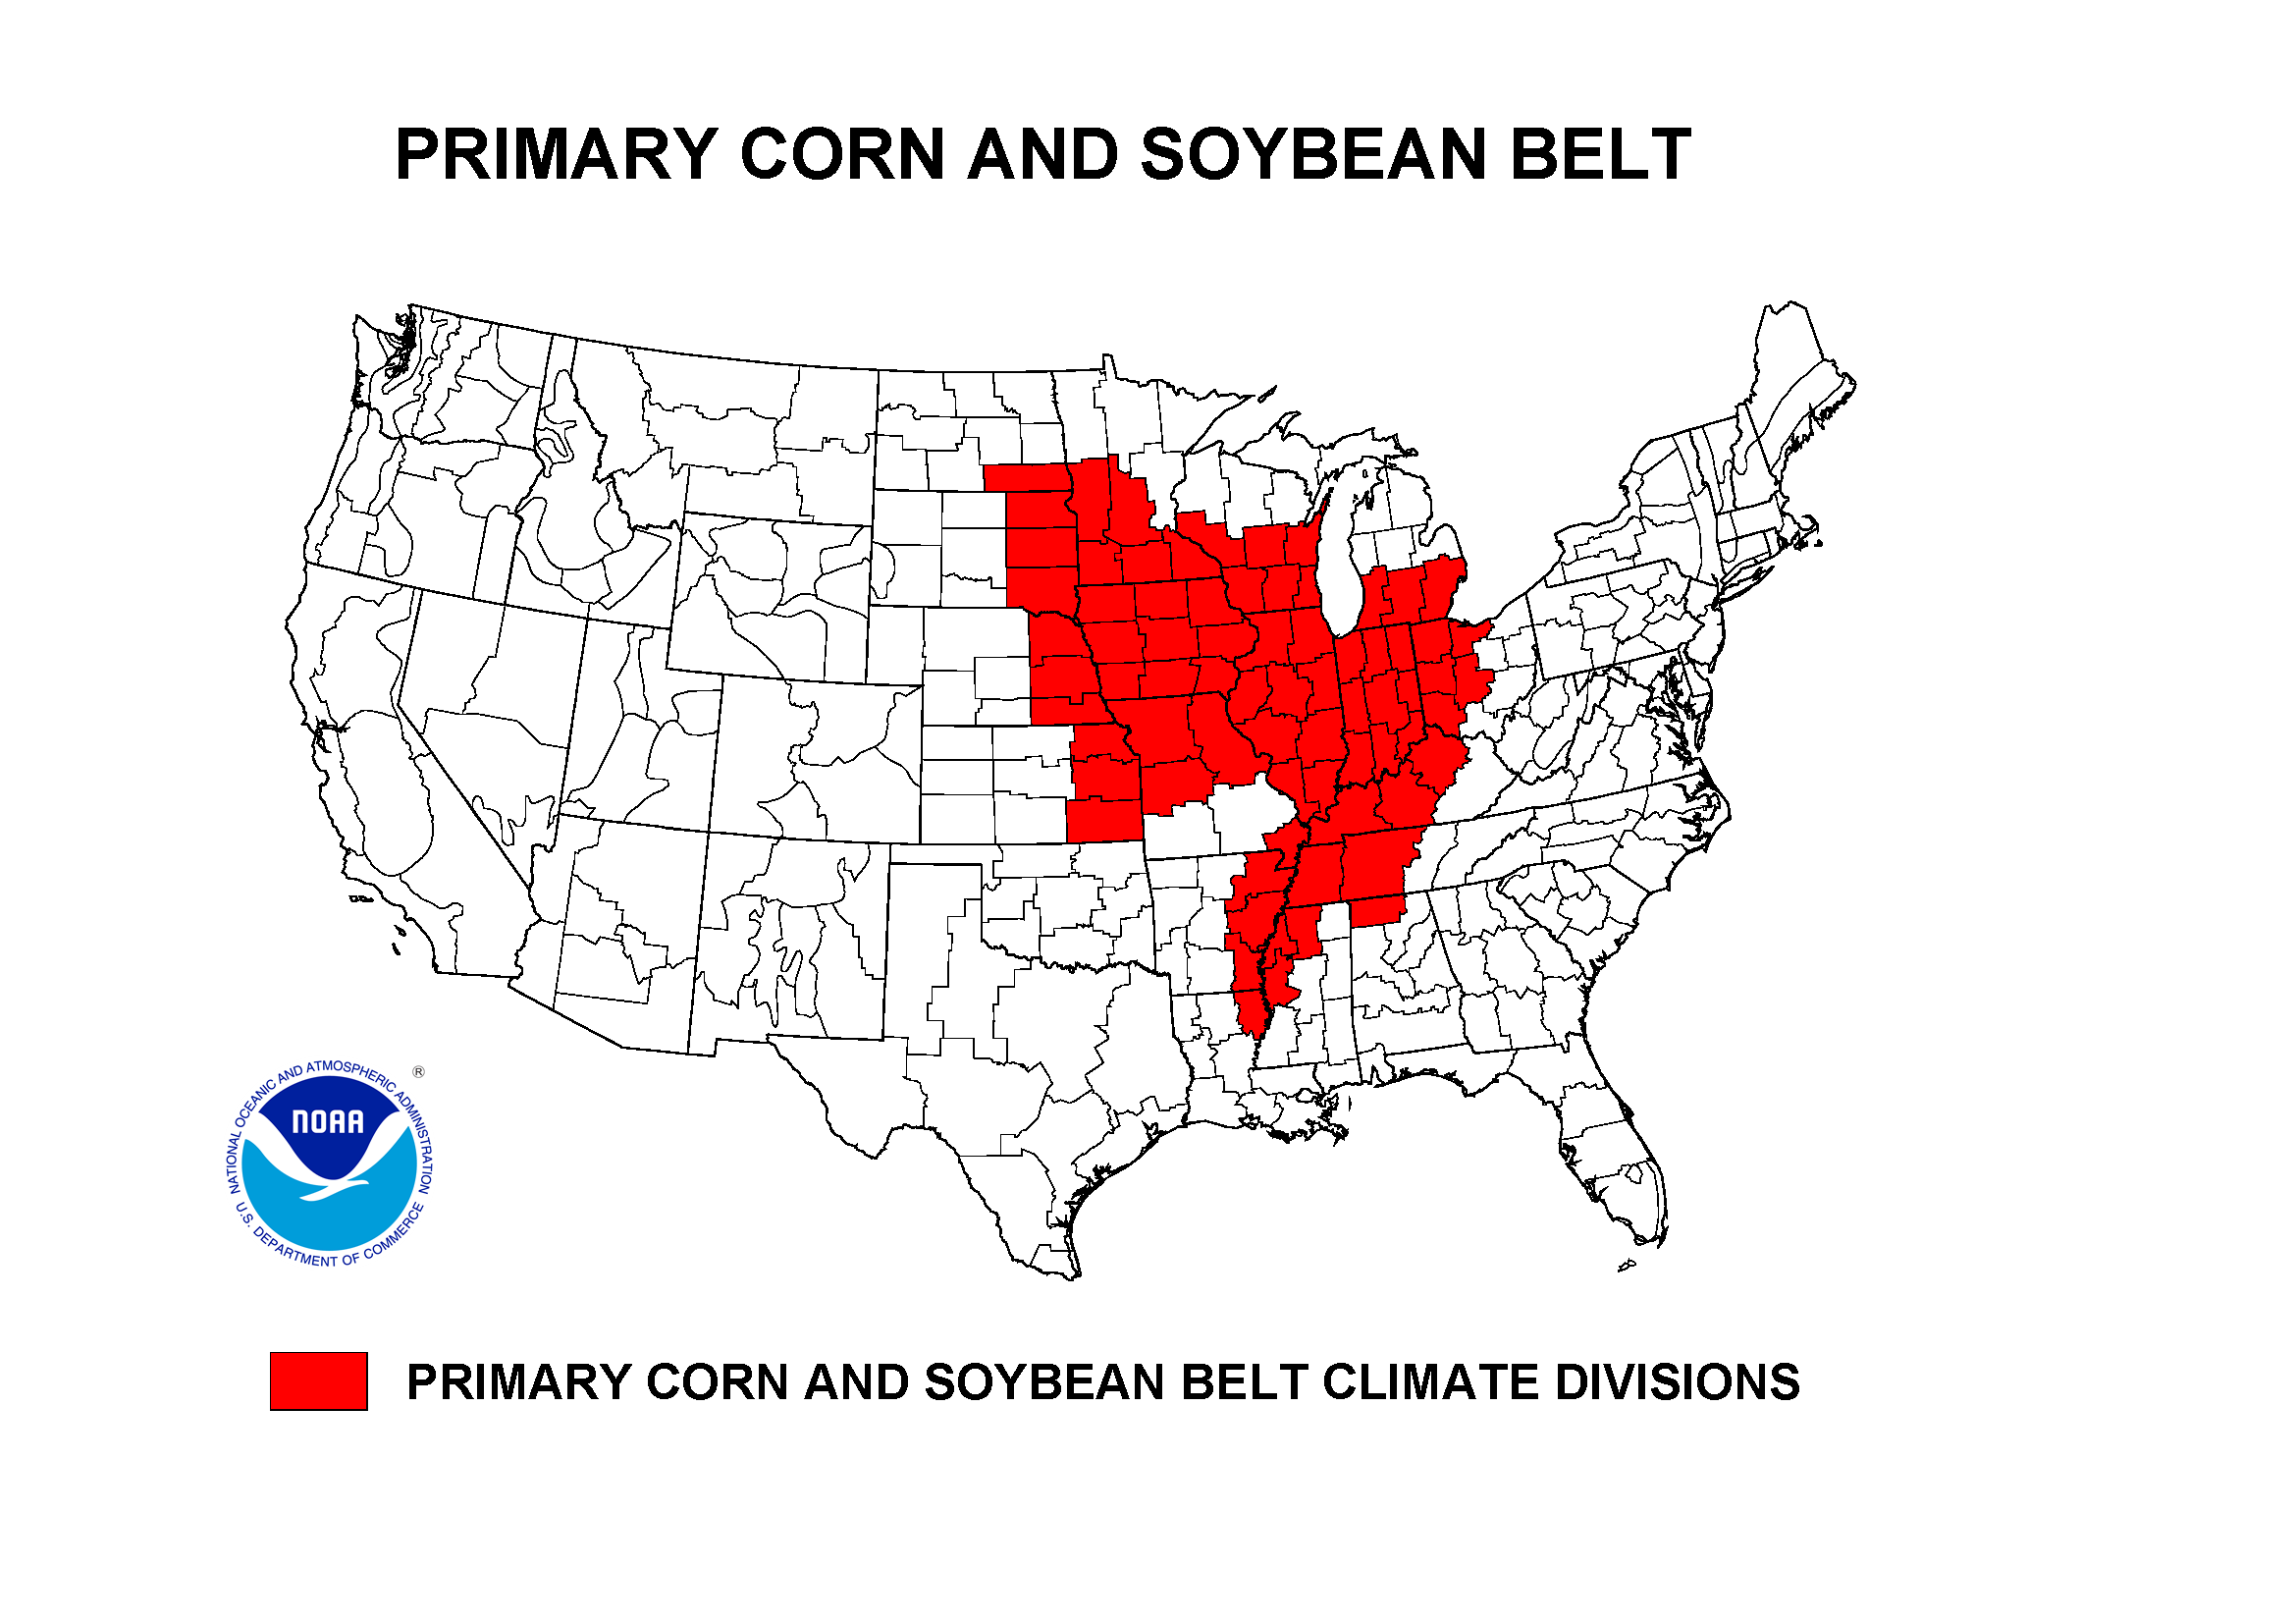
Corn and Soybean Agricultural Belt
|
 |
The Primary Corn and Soybean agricultural belt was drier than normal in eastern and northern sections this month, but wetter than normal along the western and southern edges. For the region as a whole, August 2013 ranked as the 21st driest and 47th coolest August in the 1895-2013 record. For the growing season thus far (March-August), the region ranked 12th wettest and 11th coolest. When just the last five months are examined, April-August 2013 ranks as the fourth wettest and 22nd coolest such five-month period. Summer 2013 ranked as the 48th driest and 39th coolest June-August, and the last two months ranked as the 21st driest and 24th coolest July-August. The last three Augusts and July-Augusts have averaged drier than normal, and the last three summers have averaged near to below average for precipitation.
NOAA Regional Climate Centers:
A more detailed drought discussion, provided by the NOAA Regional Climate Centers and others, can be found below.
West — Pacific Islands
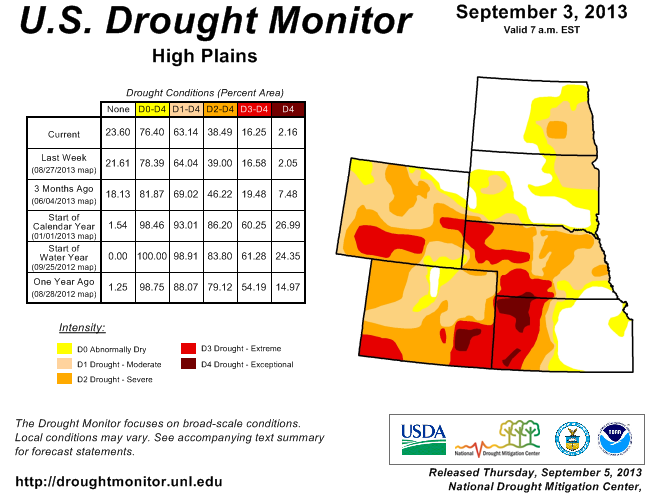
As described by the High Plains Regional Climate Center, spotty precipitation led to both improvements and degradations in drought conditions. Areas such as southern Kansas, western portions of the Dakotas, and northern Nebraska received up to 300 percent of normal precipitation. Meanwhile, large areas of central Wyoming, eastern and central North Dakota, and northeastern South Dakota missed out and received less than 50 percent of normal precipitation. Embedded areas received little to no precipitation and ended the month with less than 5 percent of normal precipitation. With the wide range in precipitation, there were stations which ranked in the top 10 driest or wettest Augusts on record. For instance, Aberdeen, South Dakota received only 0.34 inches (9 mm) of precipitation this month and ranked as the 4th driest on record (period of record 1893-2013). The driest August in Aberdeen occurred in 1947 when only 0.06 inches (2 mm) of precipitation fell. On the other end of the spectrum, Wichita, Kansas had its 2nd wettest August on record with 10.98 inches (279 mm) of precipitation, most of which occurred during the first half of the month.
Hit or miss precipitation was the theme this summer as precipitation was quite varied across the High Plains region. Monsoonal moisture brought much needed precipitation to Colorado in July and August which helped alleviate some long and short term drought conditions while also decreasing fire danger. Unfortunately, the rain was a double edged sword as some locations dealt with destructive flash flooding in and around recent burn scars. Southern Kansas also dealt with flooding after a dry start to the summer. For instance, while Wichita started the summer off on the dry side, this summer went down as the 3rd wettest on record with a total of 20.50 inches (521 mm). June precipitation was only 35 percent of normal, while the combined July and August precipitation was 265 percent of normal. The record of 23.61 inches (600 mm) occurred in 2005. To the north, Lincoln, Nebraska had its 6th driest summer on record with only 4.60 inches (117 mm) of precipitation. This was only 0.40 inches (10 mm) off of last year - the 4th driest summer. The 1936 record of 2.84 inches (72 mm) held (period of record 1887-2013). The Dakotas were divided with eastern areas generally below normal and western areas above normal. Meanwhile, Wyoming was dry except for the northeast corner.
The first half of August was quite cool across the High Plains region with temperature departures of 4.0-10.0 degrees F (2.2-5.6 degrees C) below normal in the Dakotas and 2.0-6.0 degrees F (1.1-3.3 degrees C) below normal in Nebraska and Kansas. During this time, a ridge of high pressure was off to the west, allowing cool, dry air to flow south from Canada. However, toward the end of the month, the ridge shifted to the east and southerly flow dominated bringing some of the hottest temperatures of the summer. For instance, Bismarck, North Dakota set a record high on the 20th with a temperature of 102 degrees F (38.9 degrees C). The old record of 100 degrees F (37.8 degrees C) was set in 1976 (period of record 1874-2013). With lower than normal temperatures the first half of the month and higher than normal temperatures the last half, much of the region ended the month near normal.
Temperatures have played an important role this summer as many of the impacts of dryness were staved off by cooler conditions. Unlike last year, a ridge of high pressure was just to the west of most of the Plains states which resulted in cooler, drier northerly flow for the Dakotas, Nebraska, and Kansas for much of the summer. These cooler temperatures slowed crop development — development which was already behind in many places due to either a late snowpack or wet field conditions. While crop progress was lagging, however, the cooler conditions helped with crop stress in the drier areas. By the middle of the month, there was even concern about whether or not crops would reach maturity before the first freeze of the season. But, the heat settled in for the latter half of the month and this had mixed impacts on crops. In the areas that had adequate moisture, the heat was helpful in crop development, however in the dry areas, the heat caused stress.
According to the USDM, there were numerous changes in drought conditions over the past month. Significant improvements were made in Kansas and Colorado where beneficial rains fell. The exceptional drought (D4) coverage in Kansas was reduced from 25 percent to about 9 percent, while the D4 coverage in Colorado went from 15 percent to 2 percent. Unfortunately, other areas of the region did not fare as well. Cool conditions for the first half of the month gave way to hot and dry weather which caused drought conditions to emerge and/or deteriorate rapidly in parts of eastern North Dakota, South Dakota, and Nebraska. For instance, North Dakota started the month free of drought, but ended the month with over 30 percent of the state in at least moderate drought (D1).
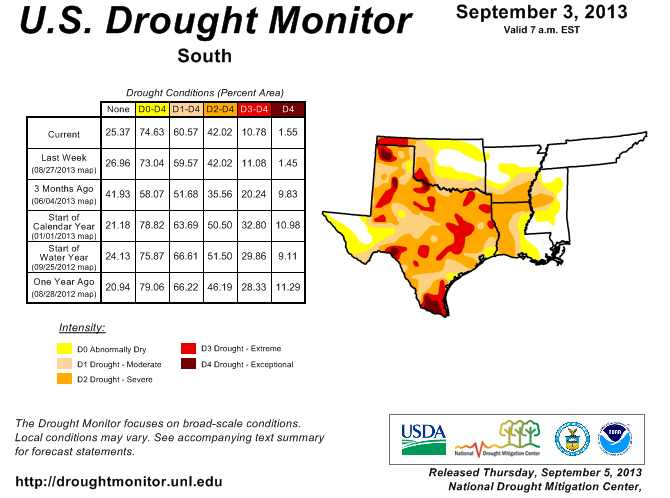
As explained by the Southern Regional Climate Center, precipitation totals in the month of August varied significantly over the Southern region. Central portions of the region received, on average, less than half the expected precipitation. This was also the case for the western and west central counties of Texas. In Arkansas, southern counties experienced an extremely dry month, with many stations reporting less than twenty-five percent of normal rainfall. In contrast, the northern counties in Arkansas experienced a much wetter than normal month, with many stations reporting between one and a half to two times of normal. With the exception of Texas, August was slightly cooler than normal month across the region.
Drought conditions changed significantly over the month of August. Much of western and northern Louisiana is now experiencing severe drought. This is also the case for southern Arkansas, and west central Mississippi, which also saw little in the way of precipitation. In Texas, the central counties of the state saw a one category deterioration, while the north western corner of the state experienced some improvements. Despite this, much of that portion of Texas is still under the severe grip of drought. Drought conditions throughout the month have been particularly taxing to Texas farmers. Cotton yields are expected to be only half of that planted due to dry conditions, while rice farmers along the coast will not see a second crop at all because of low water on the Brazos River. The middle of the month, however, did see some rainfall and cooler temperatures, but not without problems of their own. Storms dropped several inches of rain and hail in the Panhandle, ruining late season crops and possibly prompting disaster declaration, and caused over 100,000 customers in Houston to go without power on August 16, 2013. The high heat has compounded the already problematic hydrological drought with new short-term deficits, leading to high fire risks and poor crop moisture profiles, particularly in the eastern and southern parts of Texas. Burn bans are present in 190 counties with most cities seeing some sort of water restriction in place, including Pflugerville implementing new Stage 3 restrictions for the first time ever. Lake Travis has dropped low enough to prompt the shutdown of a new $140 million water treatment facility in Cedar Park. A recent $2 billion funding bill for water resources is even seeing controversy with rural residents concerned that their water supplies will be used for city-use only (Information provided by the Texas Office of State Climatology).
As summarized by the Midwest Regional Climate Center, August temperatures were within a couple degrees F (1 C) of normal across the Midwest, while August precipitation varied from no precipitation to more than 20 inches (508 mm). The highest and lowest values were both recorded in Missouri. Stations with no precipitation for the month occurred in Iowa, Illinois, and Missouri and dozens of other stations also set new records for lowest August precipitation. Four Midwest states ranked among the driest on record (since 1895) with Illinois the 3rd driest, Indiana 4th, and Iowa and Minnesota ranked 7th driest in the history of each state. In contrast, southern parts of the Midwest were much wetter than normal with heavy rains training along a stationary front. Despite the dry condition in northern Missouri, the heavy rains in the south brought the statewide total above normal for the month. The rains in the south gave summer totals in Kentucky (3rd) and Ohio (5th) 2hich ranked among the wettest summers in history while much of the Midwest was below normal, and much below normal in Iowa and northern Missouri. In Iowa, Illinois, and Wisconsin, record wet 2013 January to June precipitation switched to very dry conditions in July and August with the recent 2-month period (July-August 2013) ranking among the driest 10% on record in each state.
Dry conditions in July and early August across much of the Midwest were mitigated by cooler than normal temperatures keeping drought impacts minimal. The latter part of August however saw a continuation of the dry conditions along with much above normal temperatures and conditions quickly deteriorated over large areas. The heat was needed to help mature the crops; however, crop conditions worsened sharply due to the dryness. Drought expanded from just 2 percent of the region on July 30th to more than 28 percent on September 3rd. Severe drought expanded from 0 percent to almost 7 percent of the Midwest in the same time period.
As noted by the Southeast Regional Climate Center, precipitation in August was generally above normal across the Southeast, particularly across the western Panhandle of Florida, southern Alabama and Georgia, and northern South Carolina, where monthly totals exceeded 200 percent of normal. The driest locations in August were found across central and eastern portions of North Carolina, the southern shores of Puerto Rico, and much of South Florida, where monthly totals were less than 50 percent of normal. Vero Beach, FL recorded its second driest August on record (1942-2013) with only 1.47 inches (37 mm), which was more than 5 inches below normal. Mean temperatures were below average across much of the Southeast region in August, except across northern Florida, Puerto Rico, and coastal sections of the Carolinas.
The Southeast remained free of drought in August, marking the first calendar month without any drought designation since February 2010. The wet weather over the past several months continued to affect agricultural production across the region. Saturated fields delayed the harvest of many row crops, while those that were harvested returned generally low yields compared to their five year averages. Some crops also showed signs of disease, including yellowing of pastures and peanuts and fungus on pecans. Crop dusters saw a boom in business this summer since most fields have been too wet for heavy equipment. The extent of crop damage in South Carolina forced Governor Nikki Haley to request that the state be declared an agricultural disaster area. Heavy rains and saturated soils across southern parts of Alabama, Georgia, and northern Florida delayed the planting of fall crops, while periods of drier weather aided in the preparation of fall vegetables and fruits across parts of the Florida Peninsula. In addition, the excess rain this summer contributed to a 34 percent reduction in water bills in the Atlanta area.
As explained by the Northeast Regional Climate Center, for the fourth month in a row, the Northeast was wetter than normal. During August the region received 4.23 inches (107.44 mm) of precipitation, 108 percent of normal. While overall the region was wetter than normal, the individual states were split. In the six dry states, departures ranged from 97 percent of normal in New York to 71 percent of normal in Vermont. While August started with no areas of dryness in the Northeast, an area of abnormal dryness was introduced in north central Pennsylvania in the USDM released on August 29 due to precipitation deficits over the past 90 days. For summer, the Northeast received 16.56 inches (420.62 mm) of rain, 134 percent of normal, making it the wettest summer since recordkeeping began.
As summarized by the Western Regional Climate Center, following a wet July, August precipitation totals were lackluster in southern Arizona and New Mexico. Tucson, Phoenix, and Yuma, Arizona all reported below normal precipitation for the month. After receiving nearly 200% of normal precipitation in July, Albuquerque, New Mexico, received 0.42 in (11 mm), a scant 30% of its normal August precipitation. This summer's precipitation did help to improve drought conditions throughout the state. After a drier than normal summer, severe drought continued for much of western Wyoming. Riverton reported only 0.05 in (1 mm) for the month, 10% of normal. Some improvements in drought conditions were seen in the northeastern portion of the state where normal rainfall totals were received this summer.
Many locations in the West experienced wetter than normal conditions this month as an active monsoon pattern and slow-moving low-pressure systems enhanced thunderstorm activity. Persistent low pressure over the coast and frequent thunderstorms in the Southwest acted to moderate temperatures in these areas. Strong high pressure over the central and southern Rockies brought record high temperatures to the inland Northwest. Several large fires burned throughout the West, impacting air quality and visibility, although year-to-date the nationwide number of fires is 64% of the 10-year average and acres burned stands at 63% of the 10-year normal.
On the heels of one of the driest Julys on record, August brought scattered heavy precipitation to the Northwest. Areas of Nevada also experienced heavy monsoonal precipitation. Significant monsoon moisture also reached northern Arizona, southern Utah, and parts of Colorado. Areas of near-normal summer rainfall helped to alleviate some of the exceptional drought in southeastern Colorado.
August wrapped up a warmer than normal summer for much of Alaska. On August 8th, Fairbanks hit its 36th day in a calendar year with a high over 80 F (26.7 C). This breaks the record of 30 days set in 2004. However, on the last day Bettles fell to a frosty record 15 F / -9.4 C. Southern Alaska was wetter than normal with Kodiak and Cold Bay both logging their second wettest August on record at 9.3 in (236 mm) and 6.49 in (165 mm), respectively. Further south, dry conditions continued to dominate throughout Hawaii with most stations across the state reporting less than 50% of normal rainfall. A few locations, such as Molokai and Kaneohe, Oahu logged above normal precipitation.
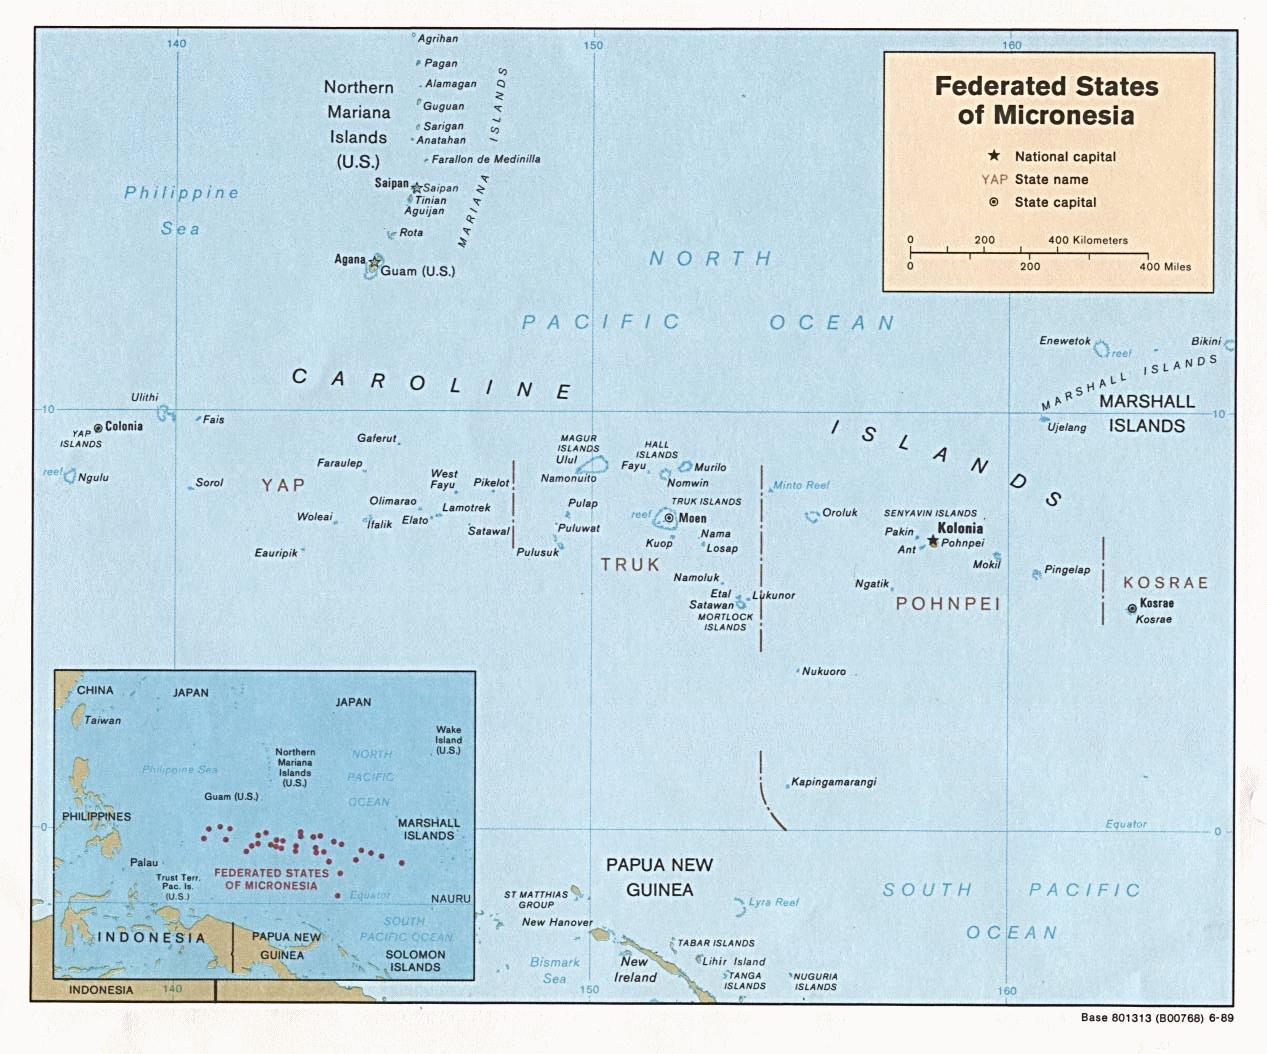
Pacific Islands: According to reports from National Weather Service offices, the Pacific ENSO Applications Climate Center (PEAC), and partners, conditions varied across the Pacific Islands.
As noted by the National Weather Service office in Honolulu, aside from three days of enhanced showers from the remnant moisture of Tropical Cyclone Gil, August was yet another drier than normal month for many areas of the state. Record-breaking dryness over portions of leeward Oahu and Kauai resulted in the return of moderate drought, or the D1 category in the USDM map. Moderate drought coverage also spread farther into upcountry Maui due to decreasing reservoir supply levels for public consumption. The overall dryness meant that extreme drought, or the D3 category, remained unchanged over portions of leeward Maui and the Big Island. For Maui, this includes the lower southwest slope of Haleakala from Kaonoulu to Ulupalakua Ranch. Big Island D3 conditions covered the Pohakuloa region of the Hamakua district and the lower leeward elevations of the north Kohala district south of Hawi. Severe drought, or the D2 category, also remained unchanged in several locations. On Molokai, long term restrictions to irrigation water use kept D2 coverage in place over the Hoolehua area of the island. Maui?s severe drought area maintained its presence along the lower leeward slopes of the west Maui Mountains from Lahaina to Maalaea. Severe drought coverage on the Big Island included the lower elevations of the southern Kau district near south point as well as portions of the north Kona and south Kona districts.
Some drought impacts impacts in Hawaii include the following:
KAUAI.
PASTURES AND GENERAL VEGETATION OVER THE LOWER SLOPES OF SOUTHWEST
KAUAI WERE IN POOR CONDITION DUE TO THE LACK OF RAINFALL.

OAHU.
BRUSH FIRE ACTIVITY OVER LEEWARD AREAS HAS BEEN INCREASING IN RECENT
WEEKS AS PASTURES AND GENERAL VEGETATION DRY OUT WITH THE
RECORD-BREAKING LACK OF RAINFALL.

MOLOKAI.
THE STATE OF HAWAII DEPARTMENT OF AGRICULTURE MAINTAINED A
MANDATORY REDUCTION IN IRRIGATION WATER CONSUMPTION OF 20 PERCENT
FOR FARMERS SERVED BY THE KUALAPUU RESERVOIR. THE RESTRICTION WAS
REDUCED FROM 30 PERCENT TO 20 PERCENT ON APRIL 2 2013.

RAINFALL AND SATELLITE-BASED VEGETATION HEALTH DATA INDICATED SOME
DRYNESS OCCURRING BUT NO DROUGHT IMPACTS HAVE BEEN REPORTED SO FAR
OUTSIDE OF THE AREAS SERVICED BY THE KUALAPUU RESERVOIR.

LANAI.
SATELLITE-BASED VEGETATION HEALTH DATA SHOW LITTLE CHANGE IN
CONDITIONS OVER THE PAST MONTH. NO RECENT GROUND-BASED OBSERVATIONS
HAVE BEEN RECEIVED TO CONFIRM THIS.

MAUI.
BELOW AVERAGE RAINFALL OVER THE WINDWARD SLOPES OF HALEAKALA IN
RECENT WEEKS HAS REDUCED SUPPLY LEVELS FOR RESERVOIRS SERVICING THE
UPCOUNTRY AREA OF THE ISLAND. AS A RESULT...THE MAUI COUNTY
DEPARTMENT OF WATER SUPPLY HAS DECLARED A DROUGHT WATCH FOR AREA
RESIDENTS AND HAS REQUESTED A VOLUNTARY 10 PERCENT REDUCTION IN
WATER USE. THE DEPARTMENT OF WATER SUPPLY HAS ALSO MAINTAINED ITS
LONG STANDING REQUEST FOR CENTRAL AND SOUTH MAUI RESIDENTS TO
VOLUNTARILY REDUCE CONSUMPTION BY 10 PERCENT.

BIG ISLAND.
RANCHERS IN THE EXISTING DROUGHT AREAS CONTINUE TO SUPPLEMENT FEED
TO SUSTAIN HERDS. PRODUCERS IN THE LOWER SOUTH KOHALA DISTRICT HAVE
HAD TO IRRIGATE TO SUSTAIN CROPS AND THE U.S. DEPARTMENT OF
AGRICULTURE REPORTED THAT CITRUS TREES IN THE KAPOHO AREA WERE
SHOWING SIGNS OF STRESS DUE TO THE BELOW AVERAGE RAINFALL AND WARM
TEMPERATURES.
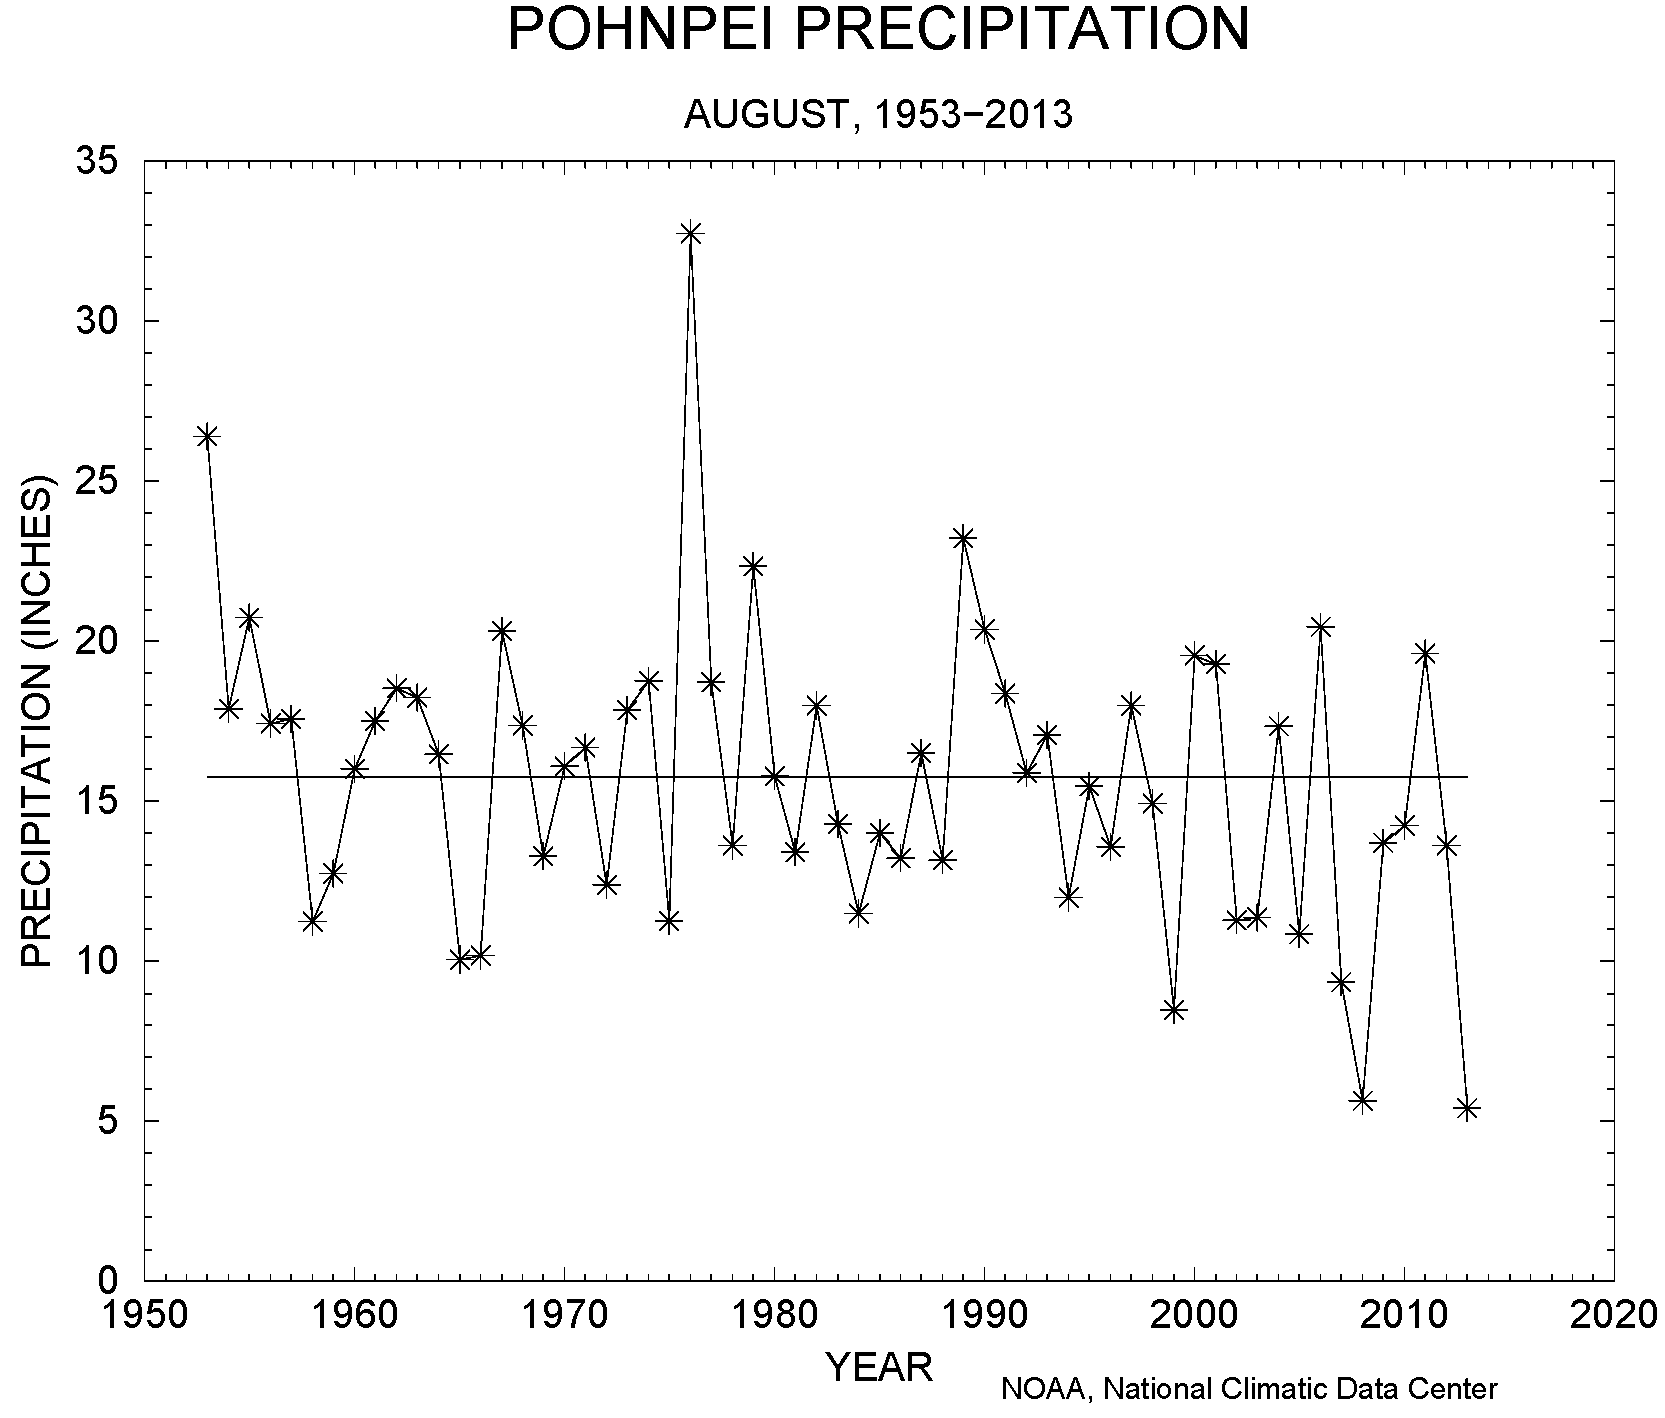
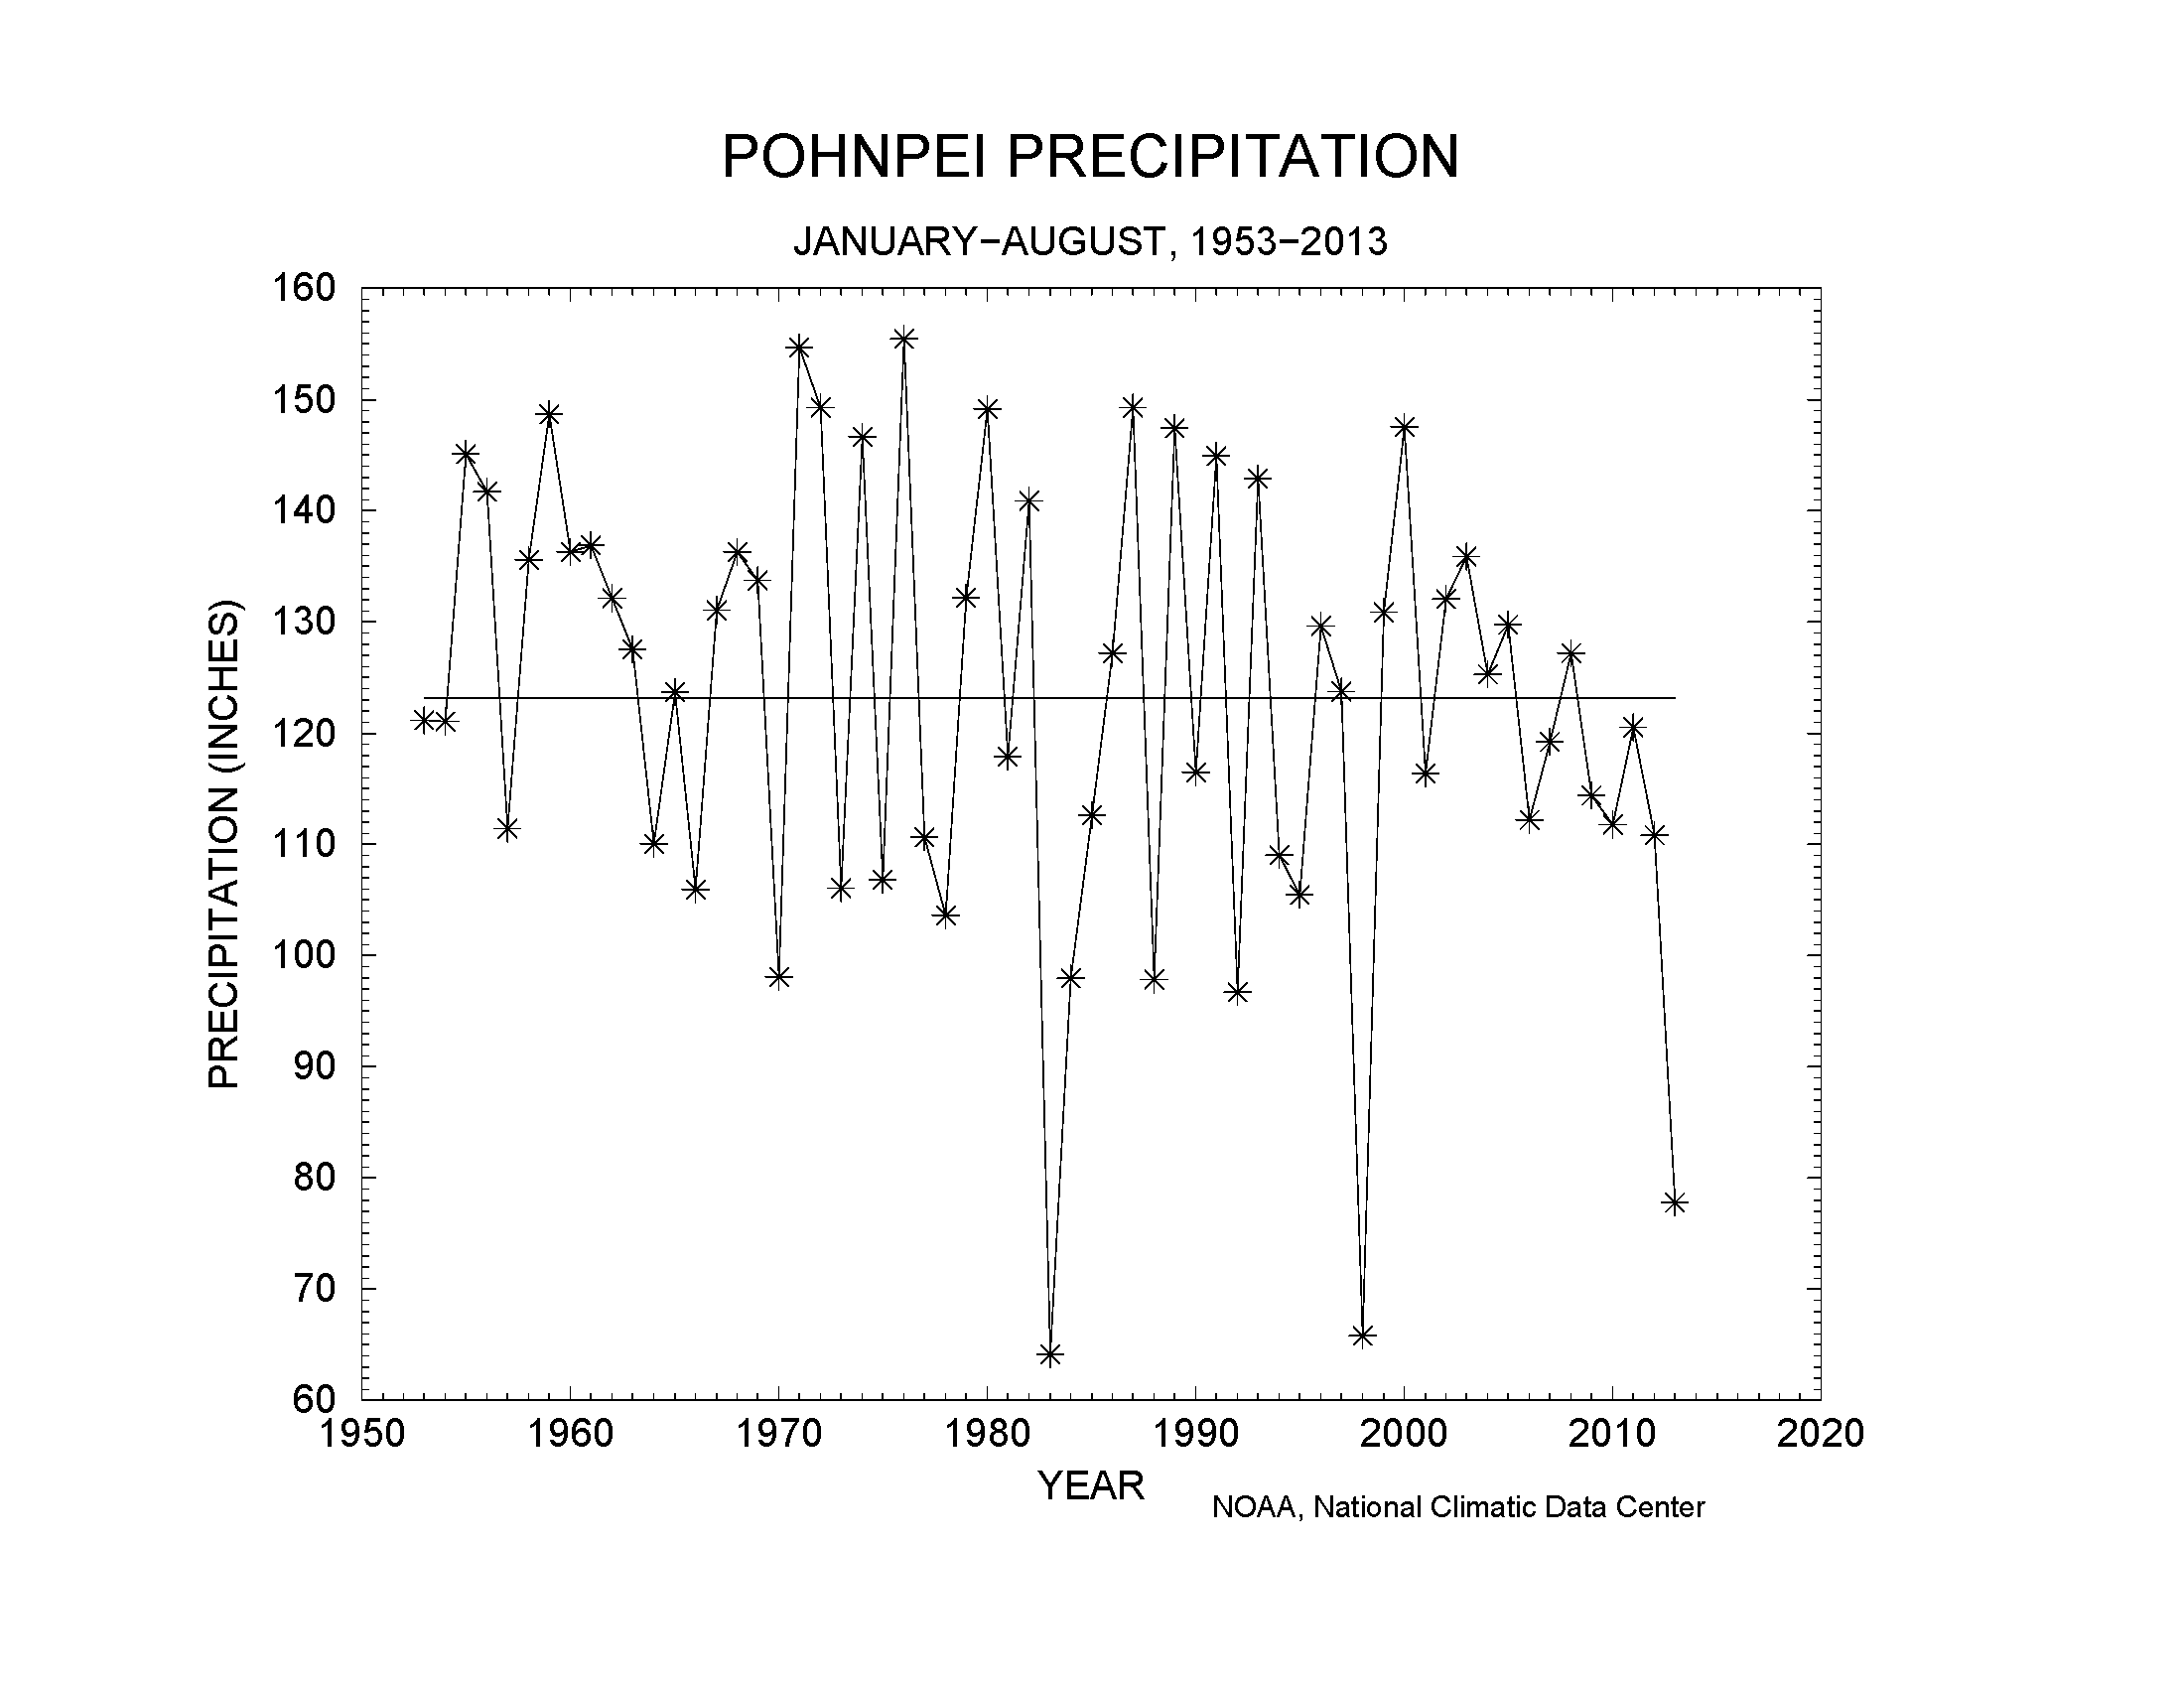
Pohnpei precipitation, August, 1953-2013.
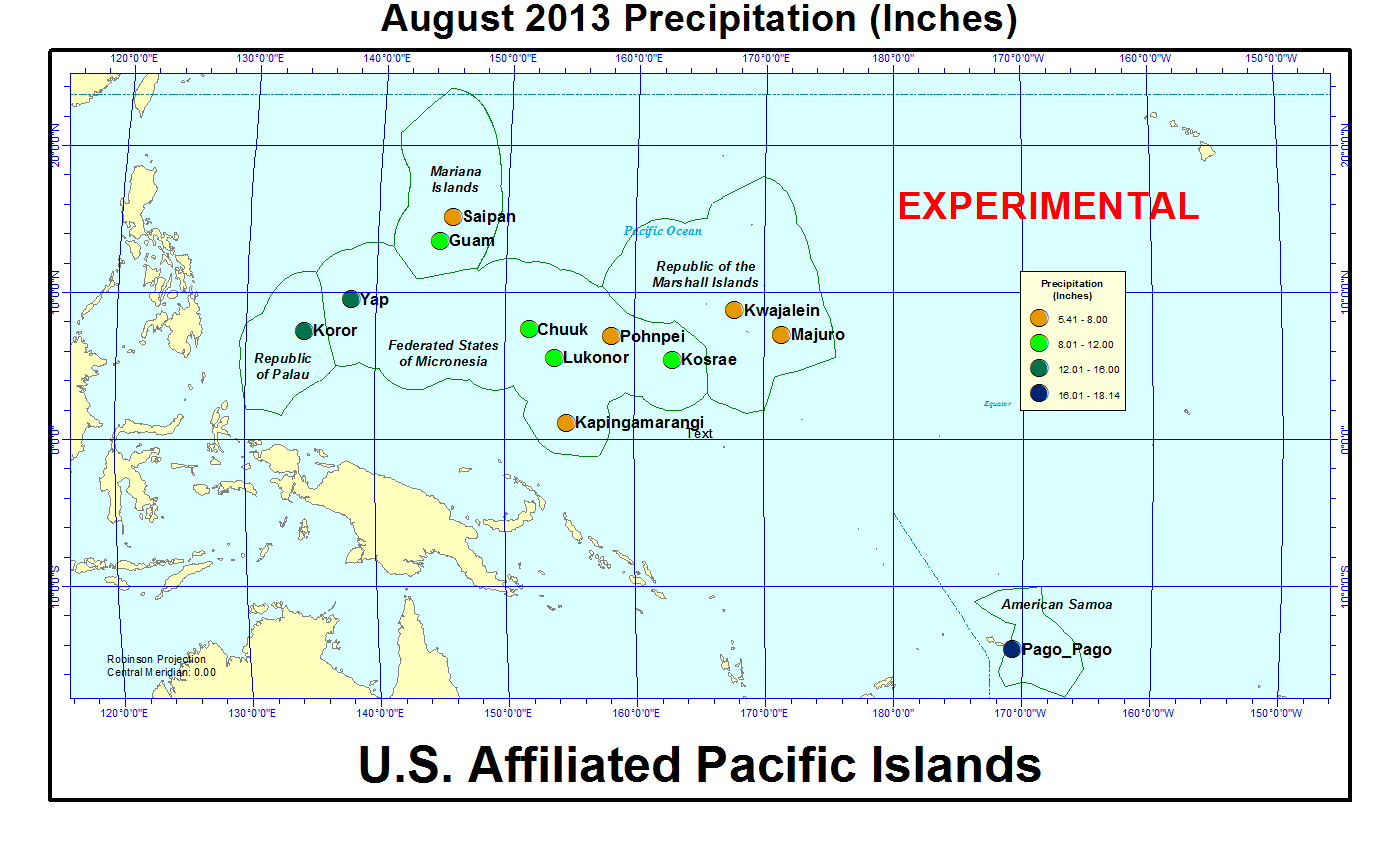
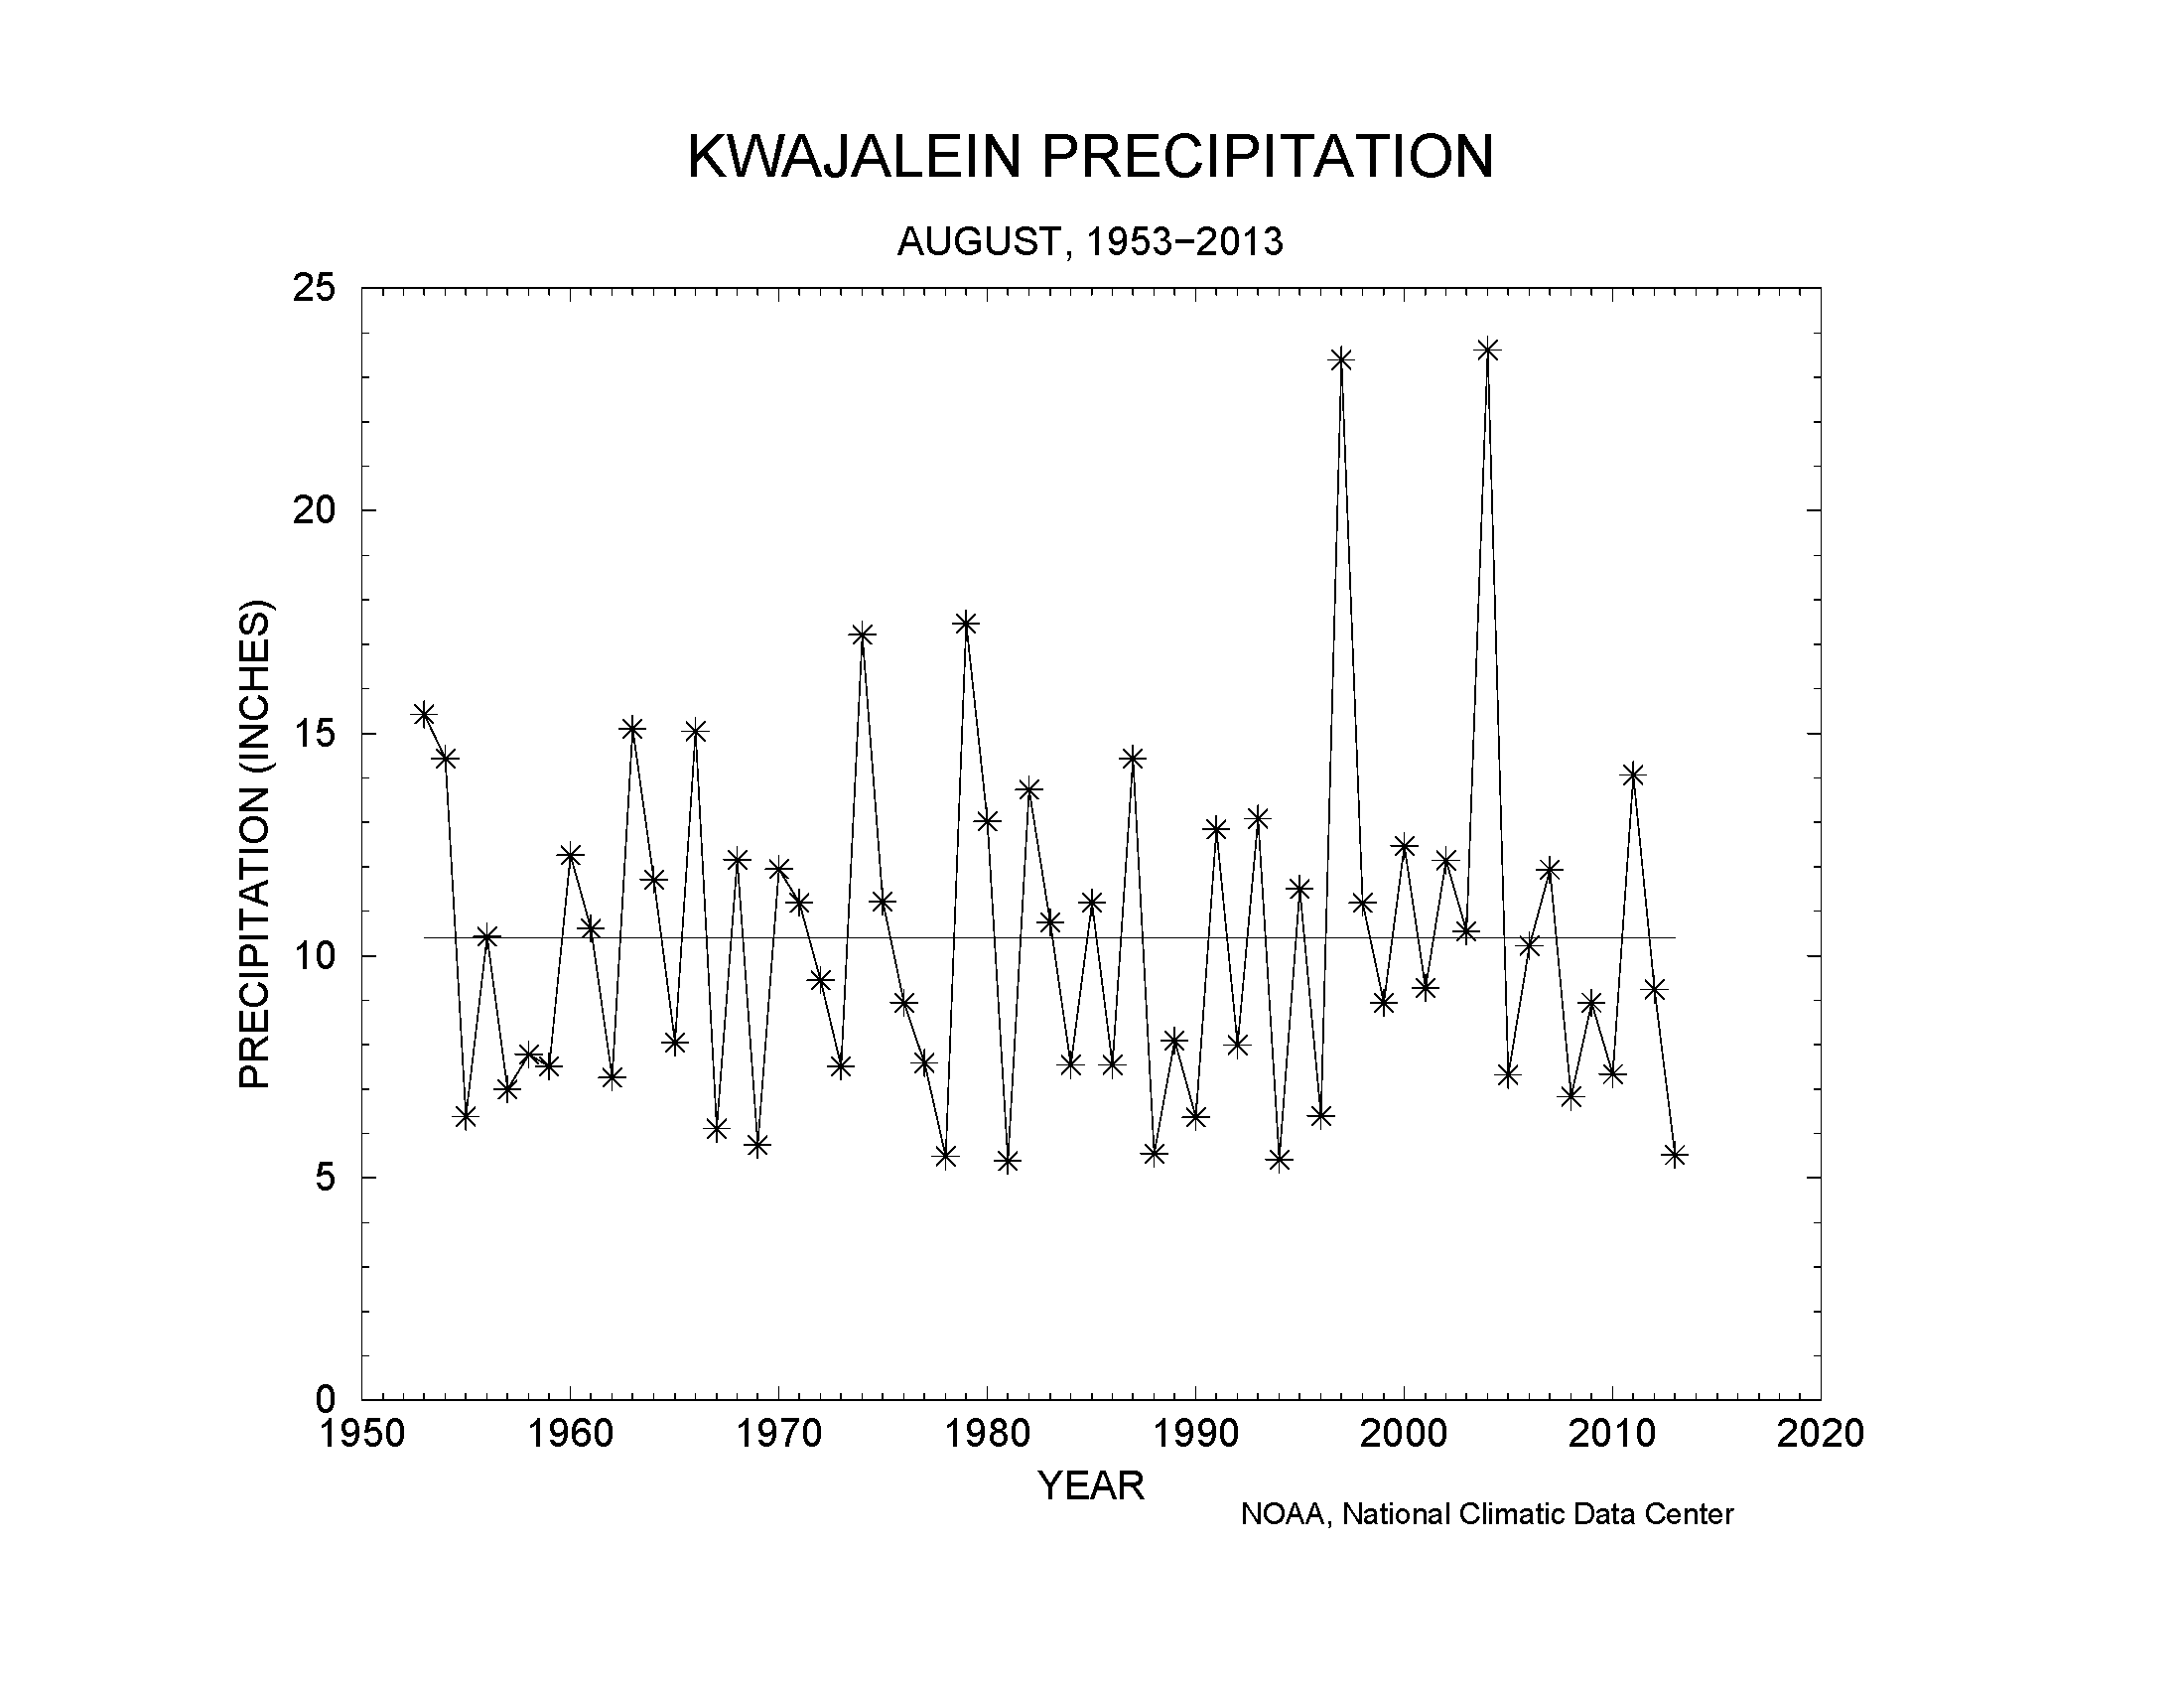
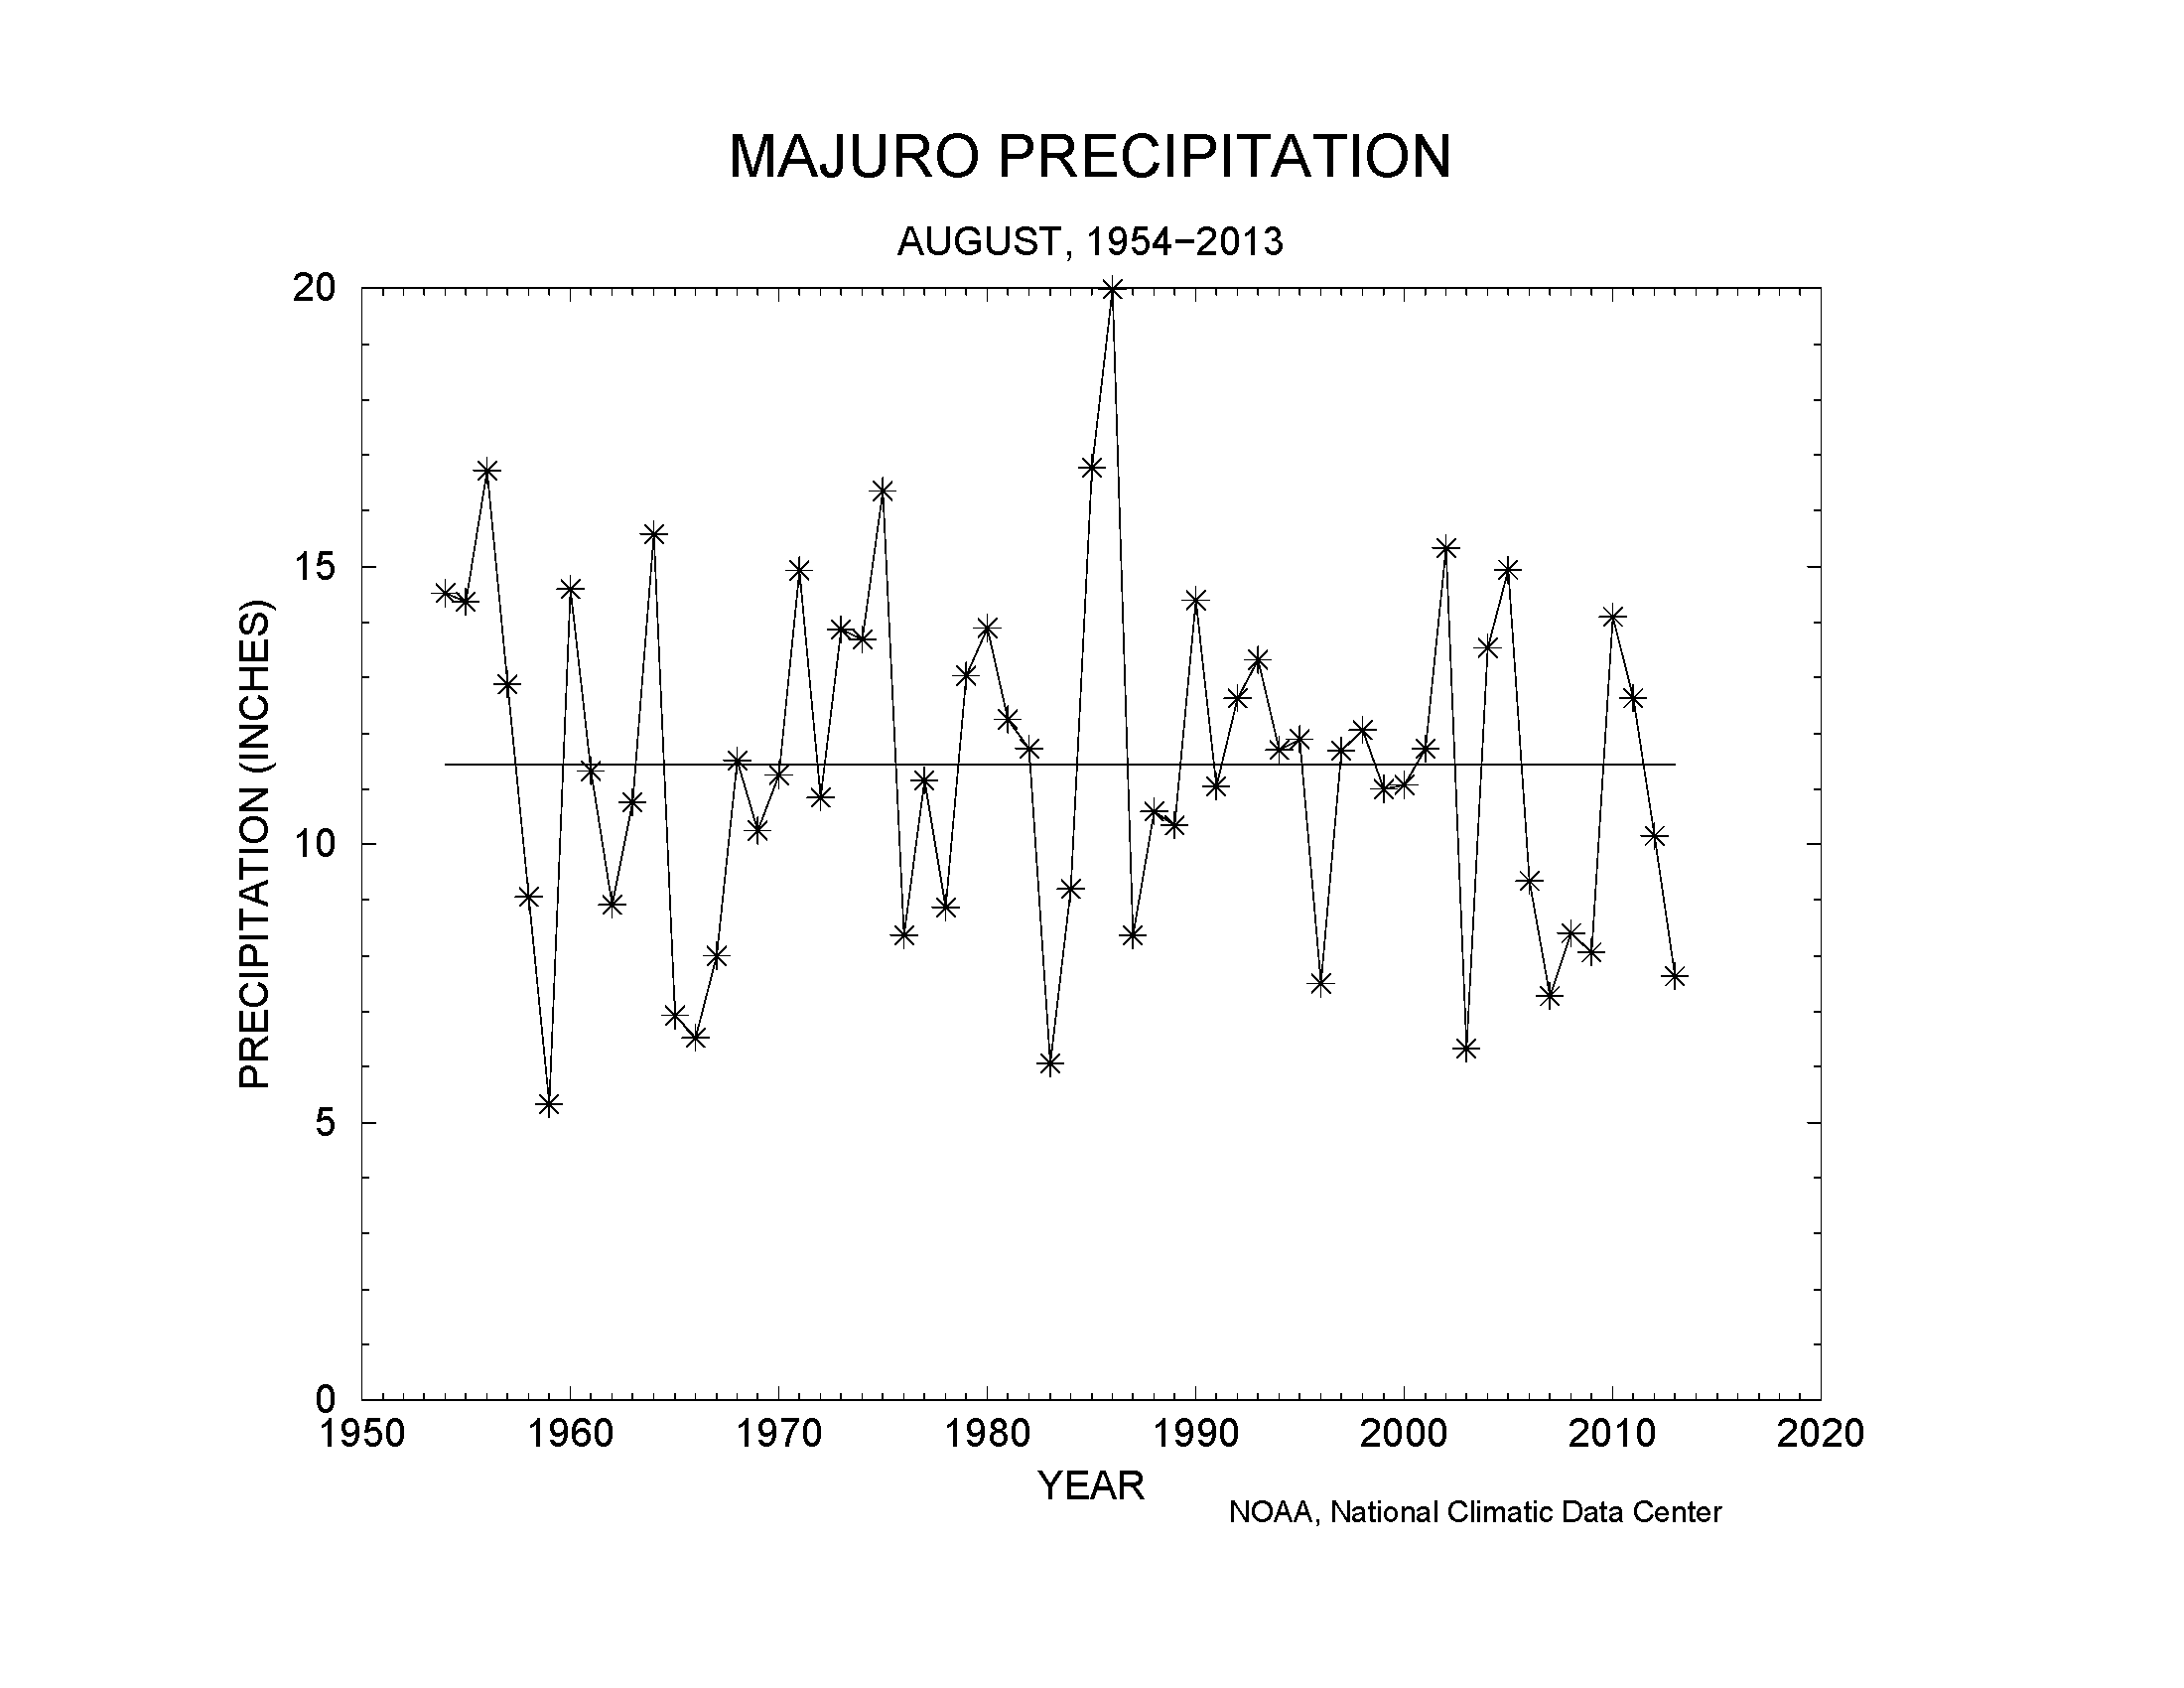
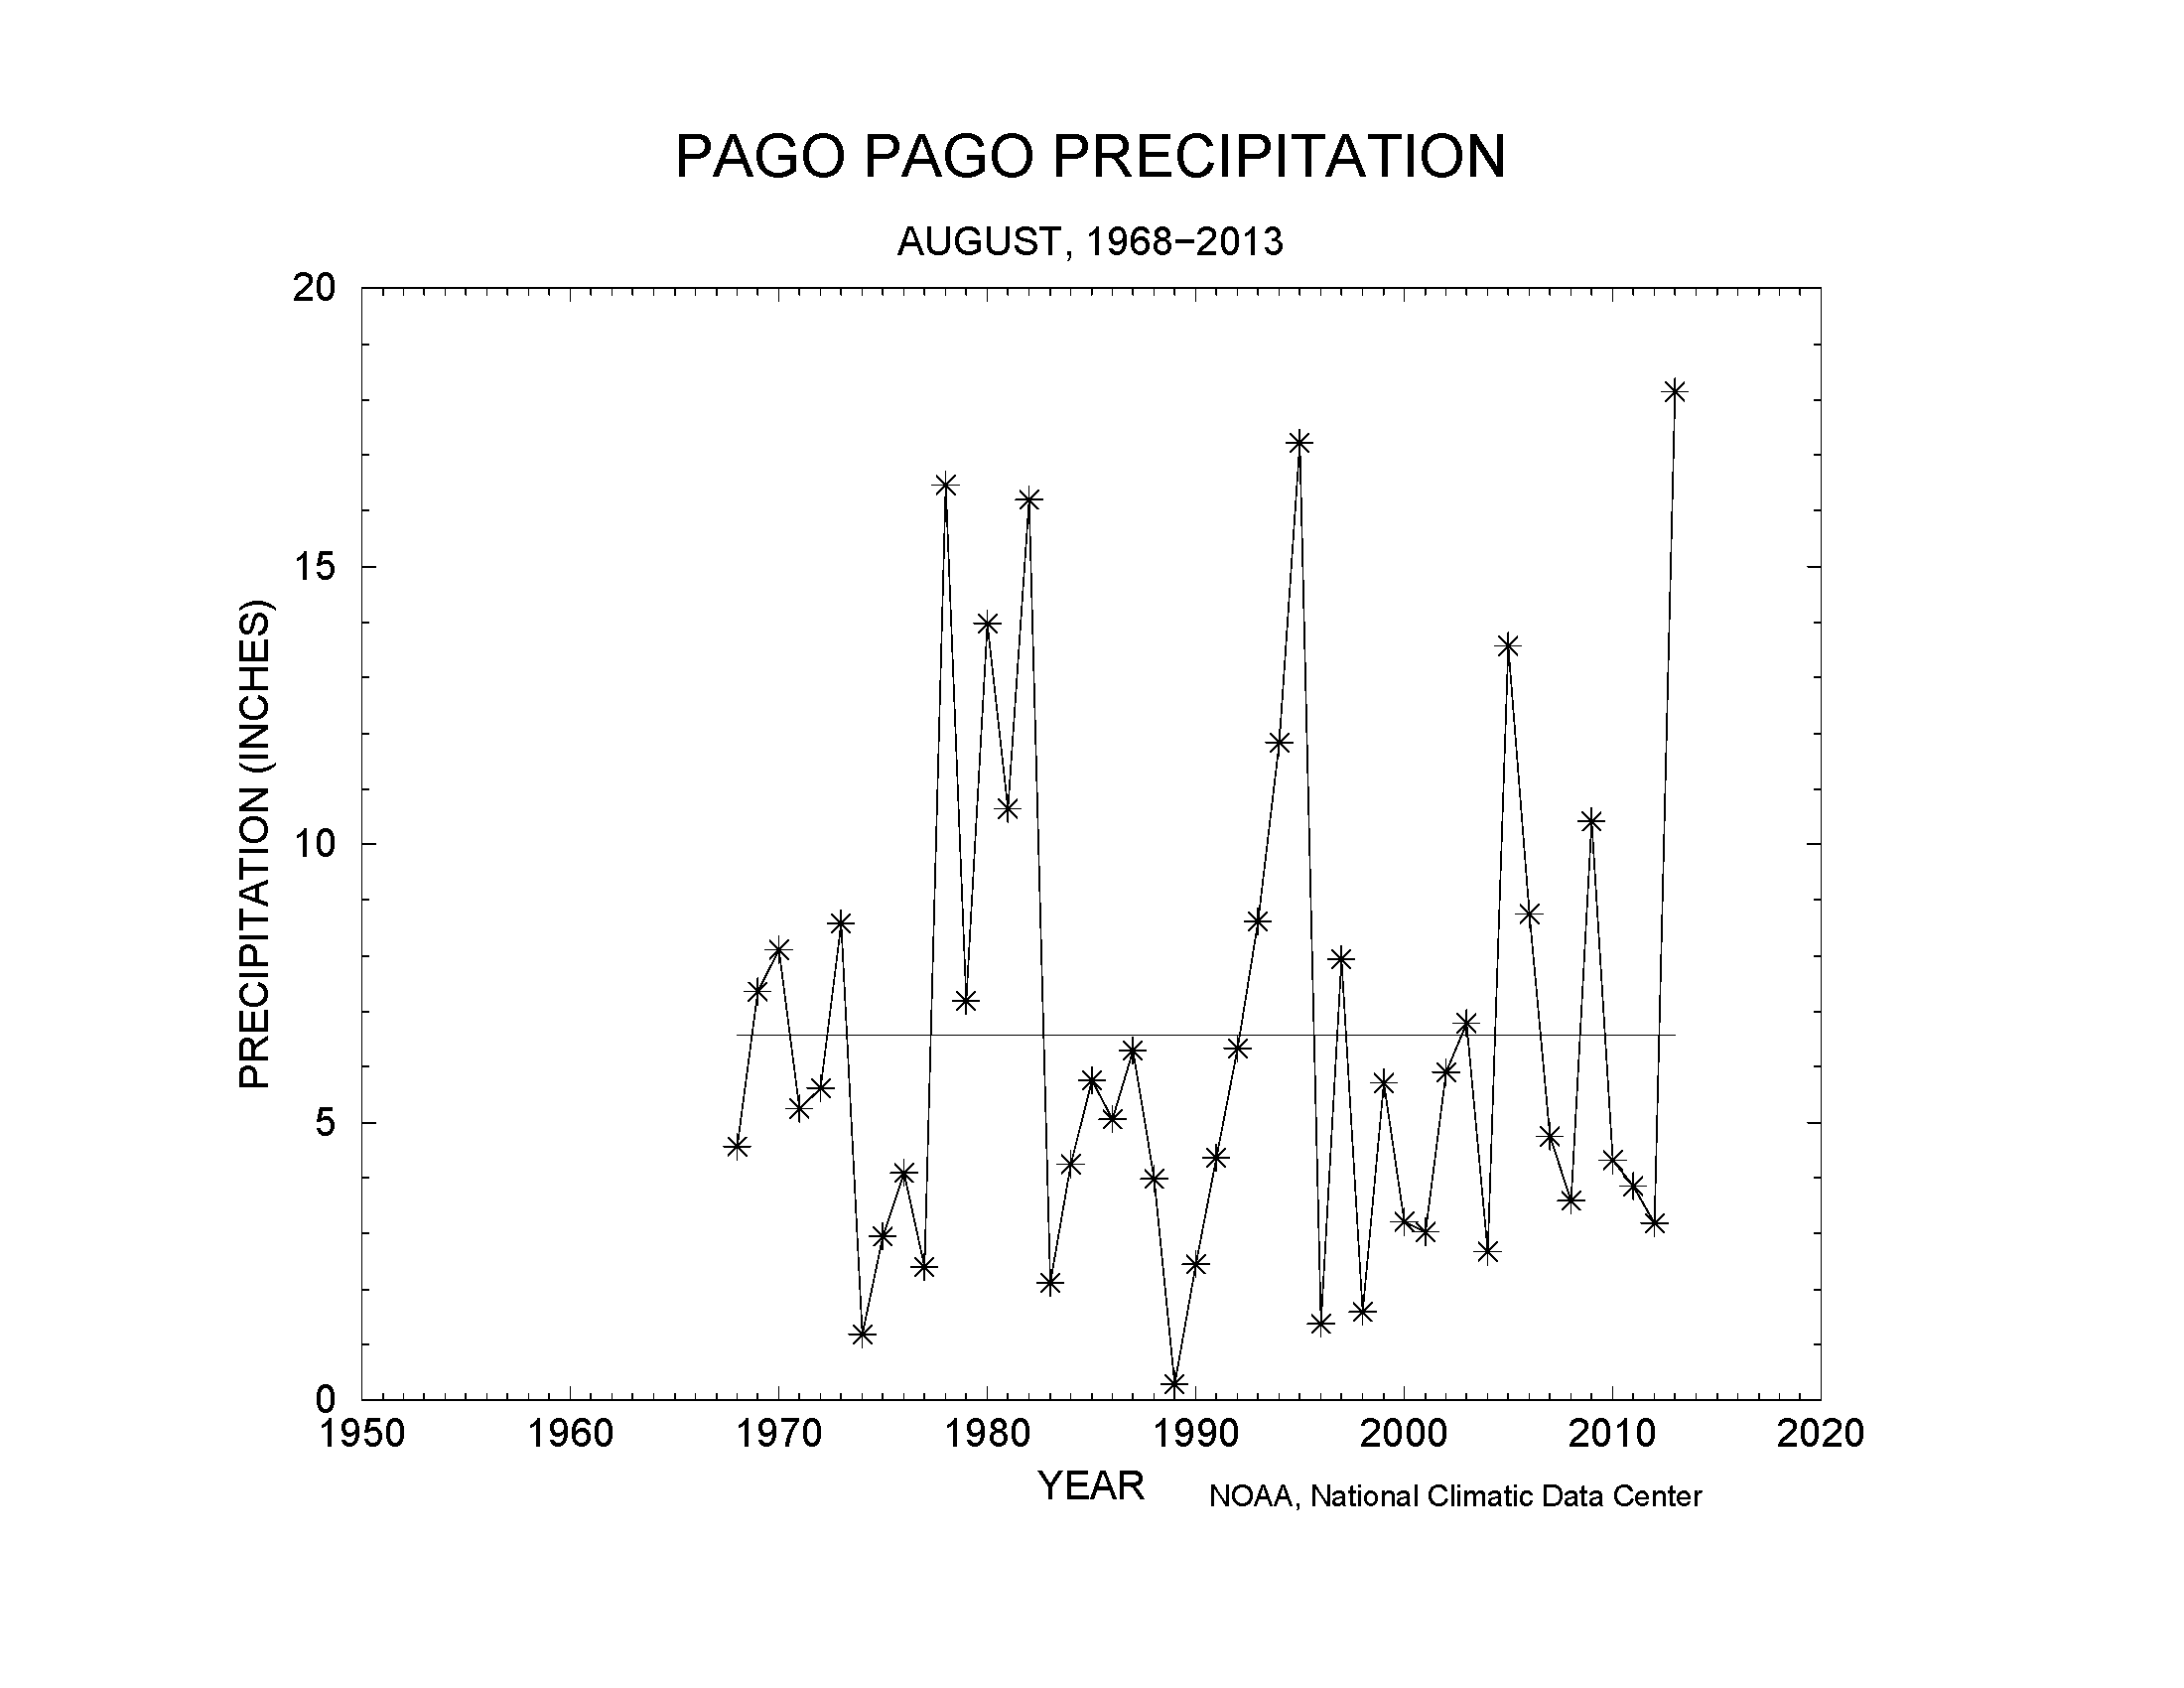
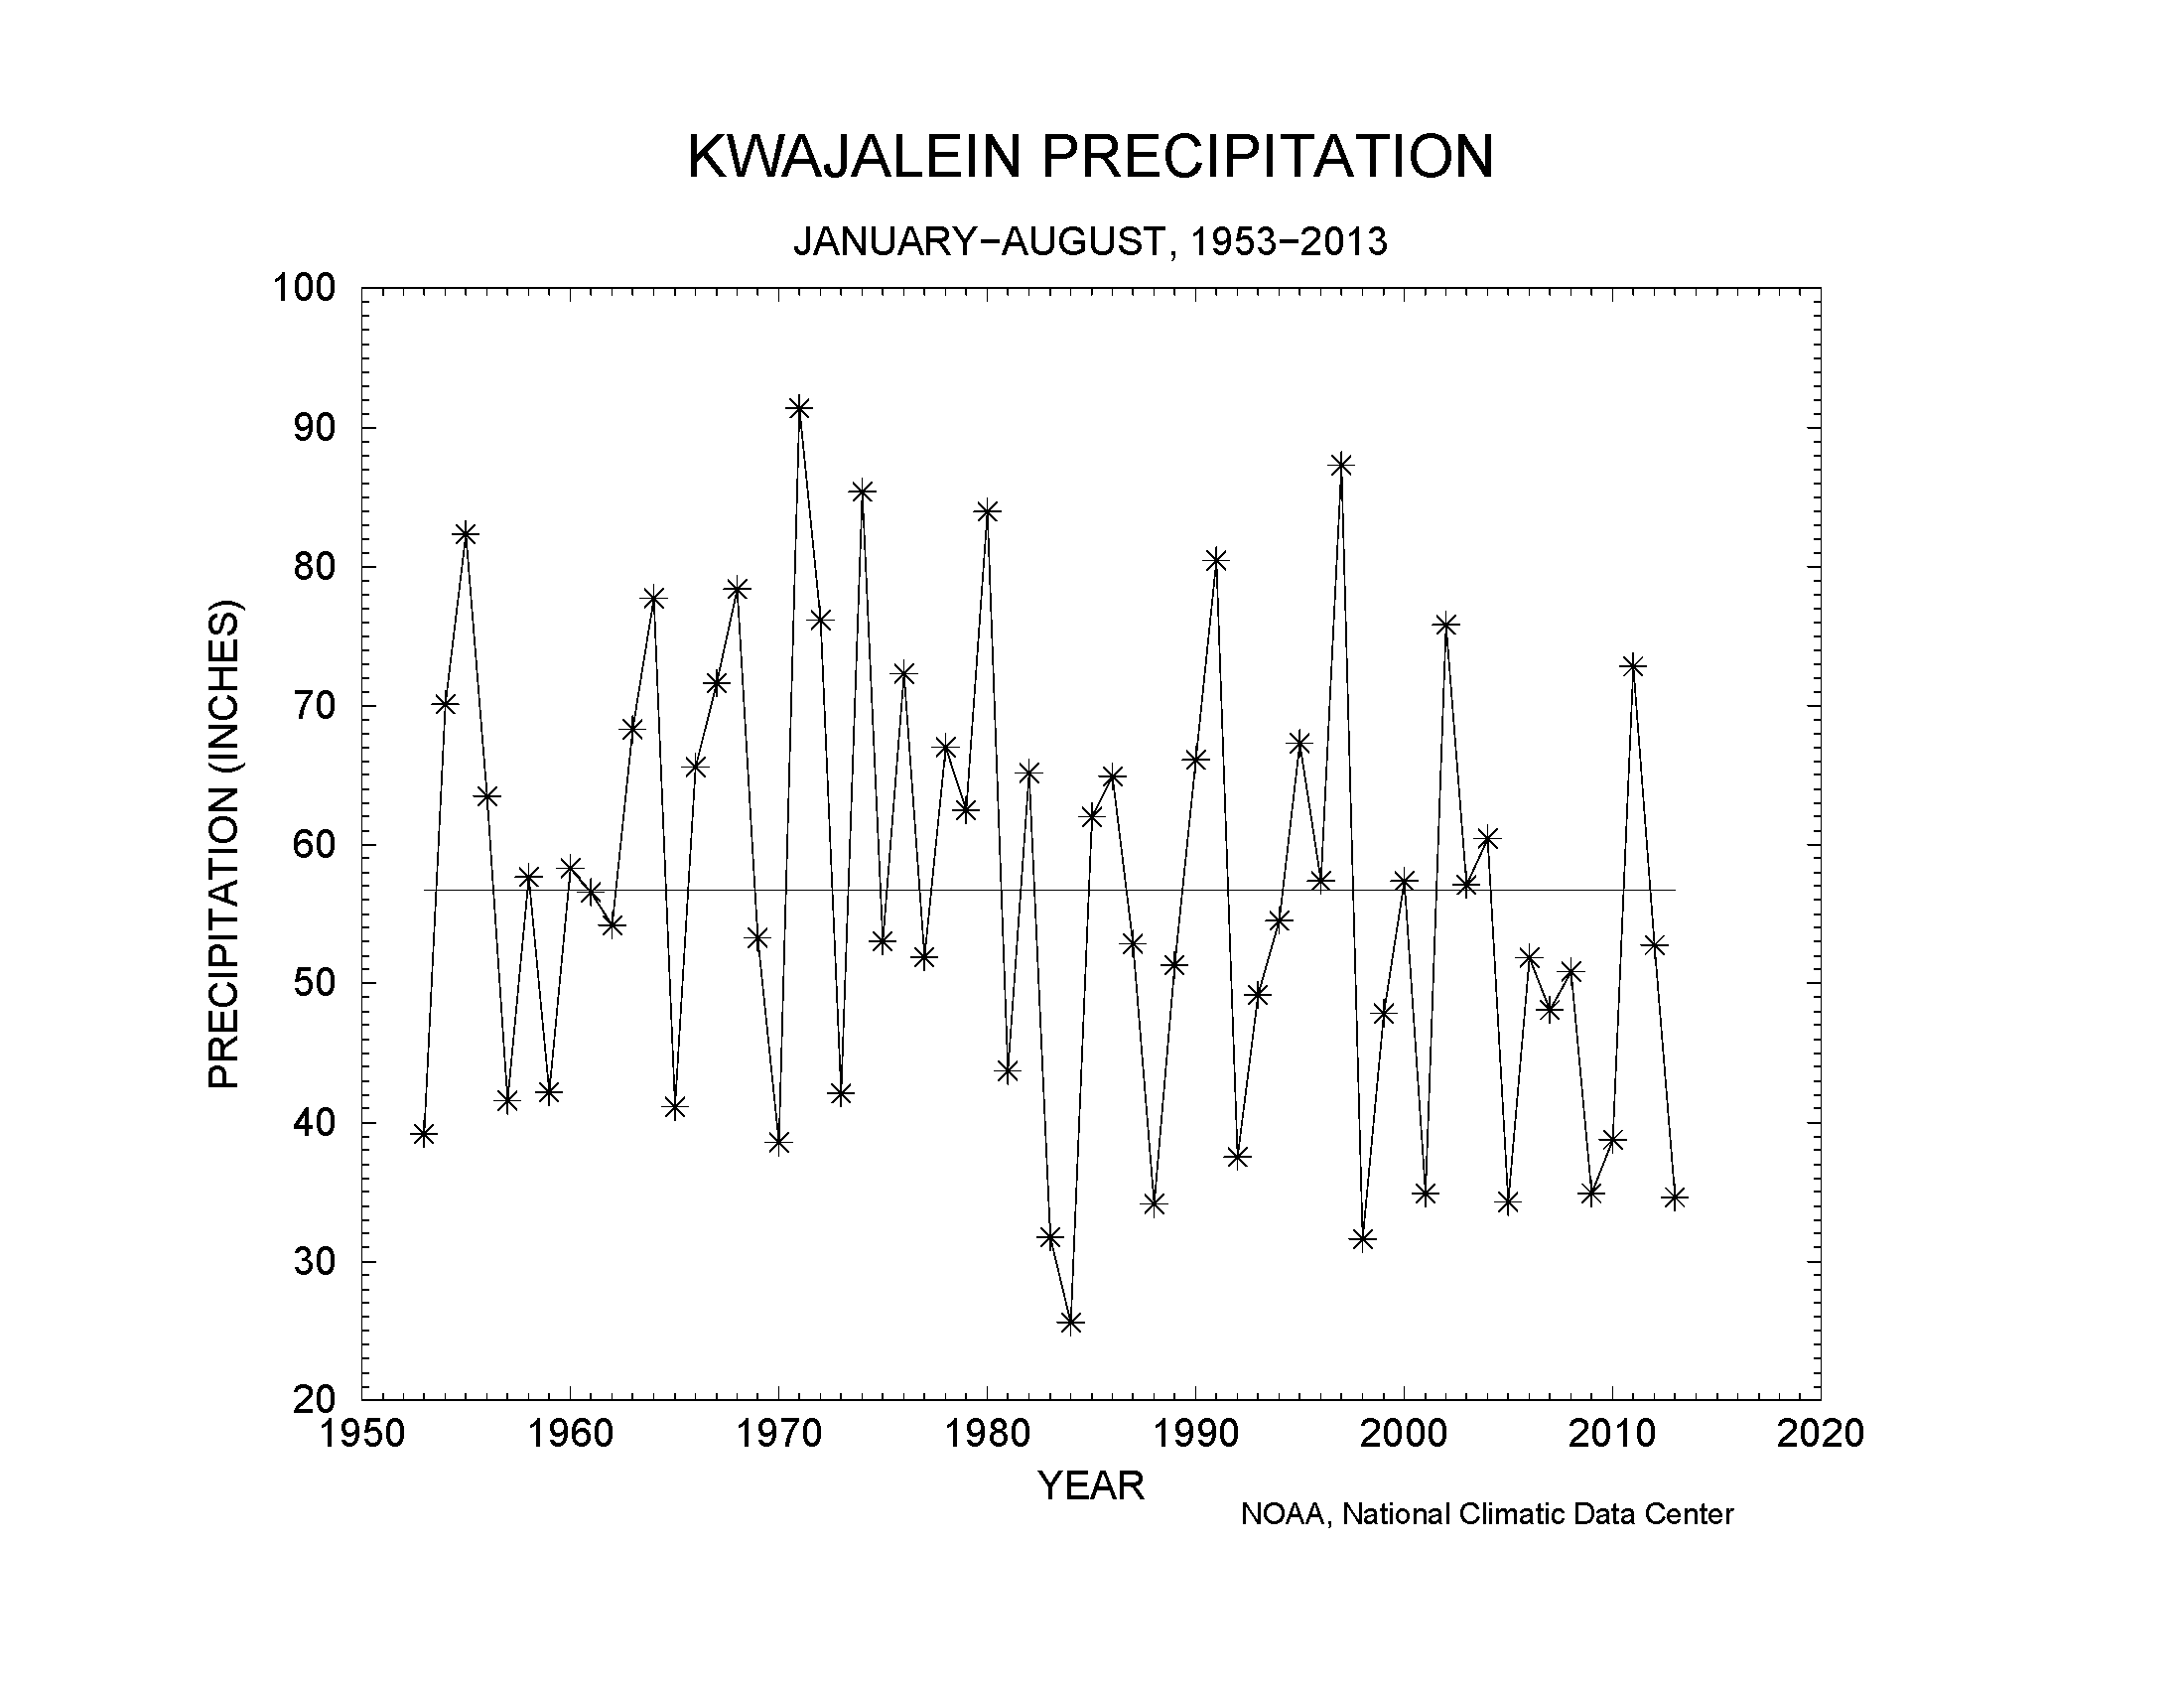
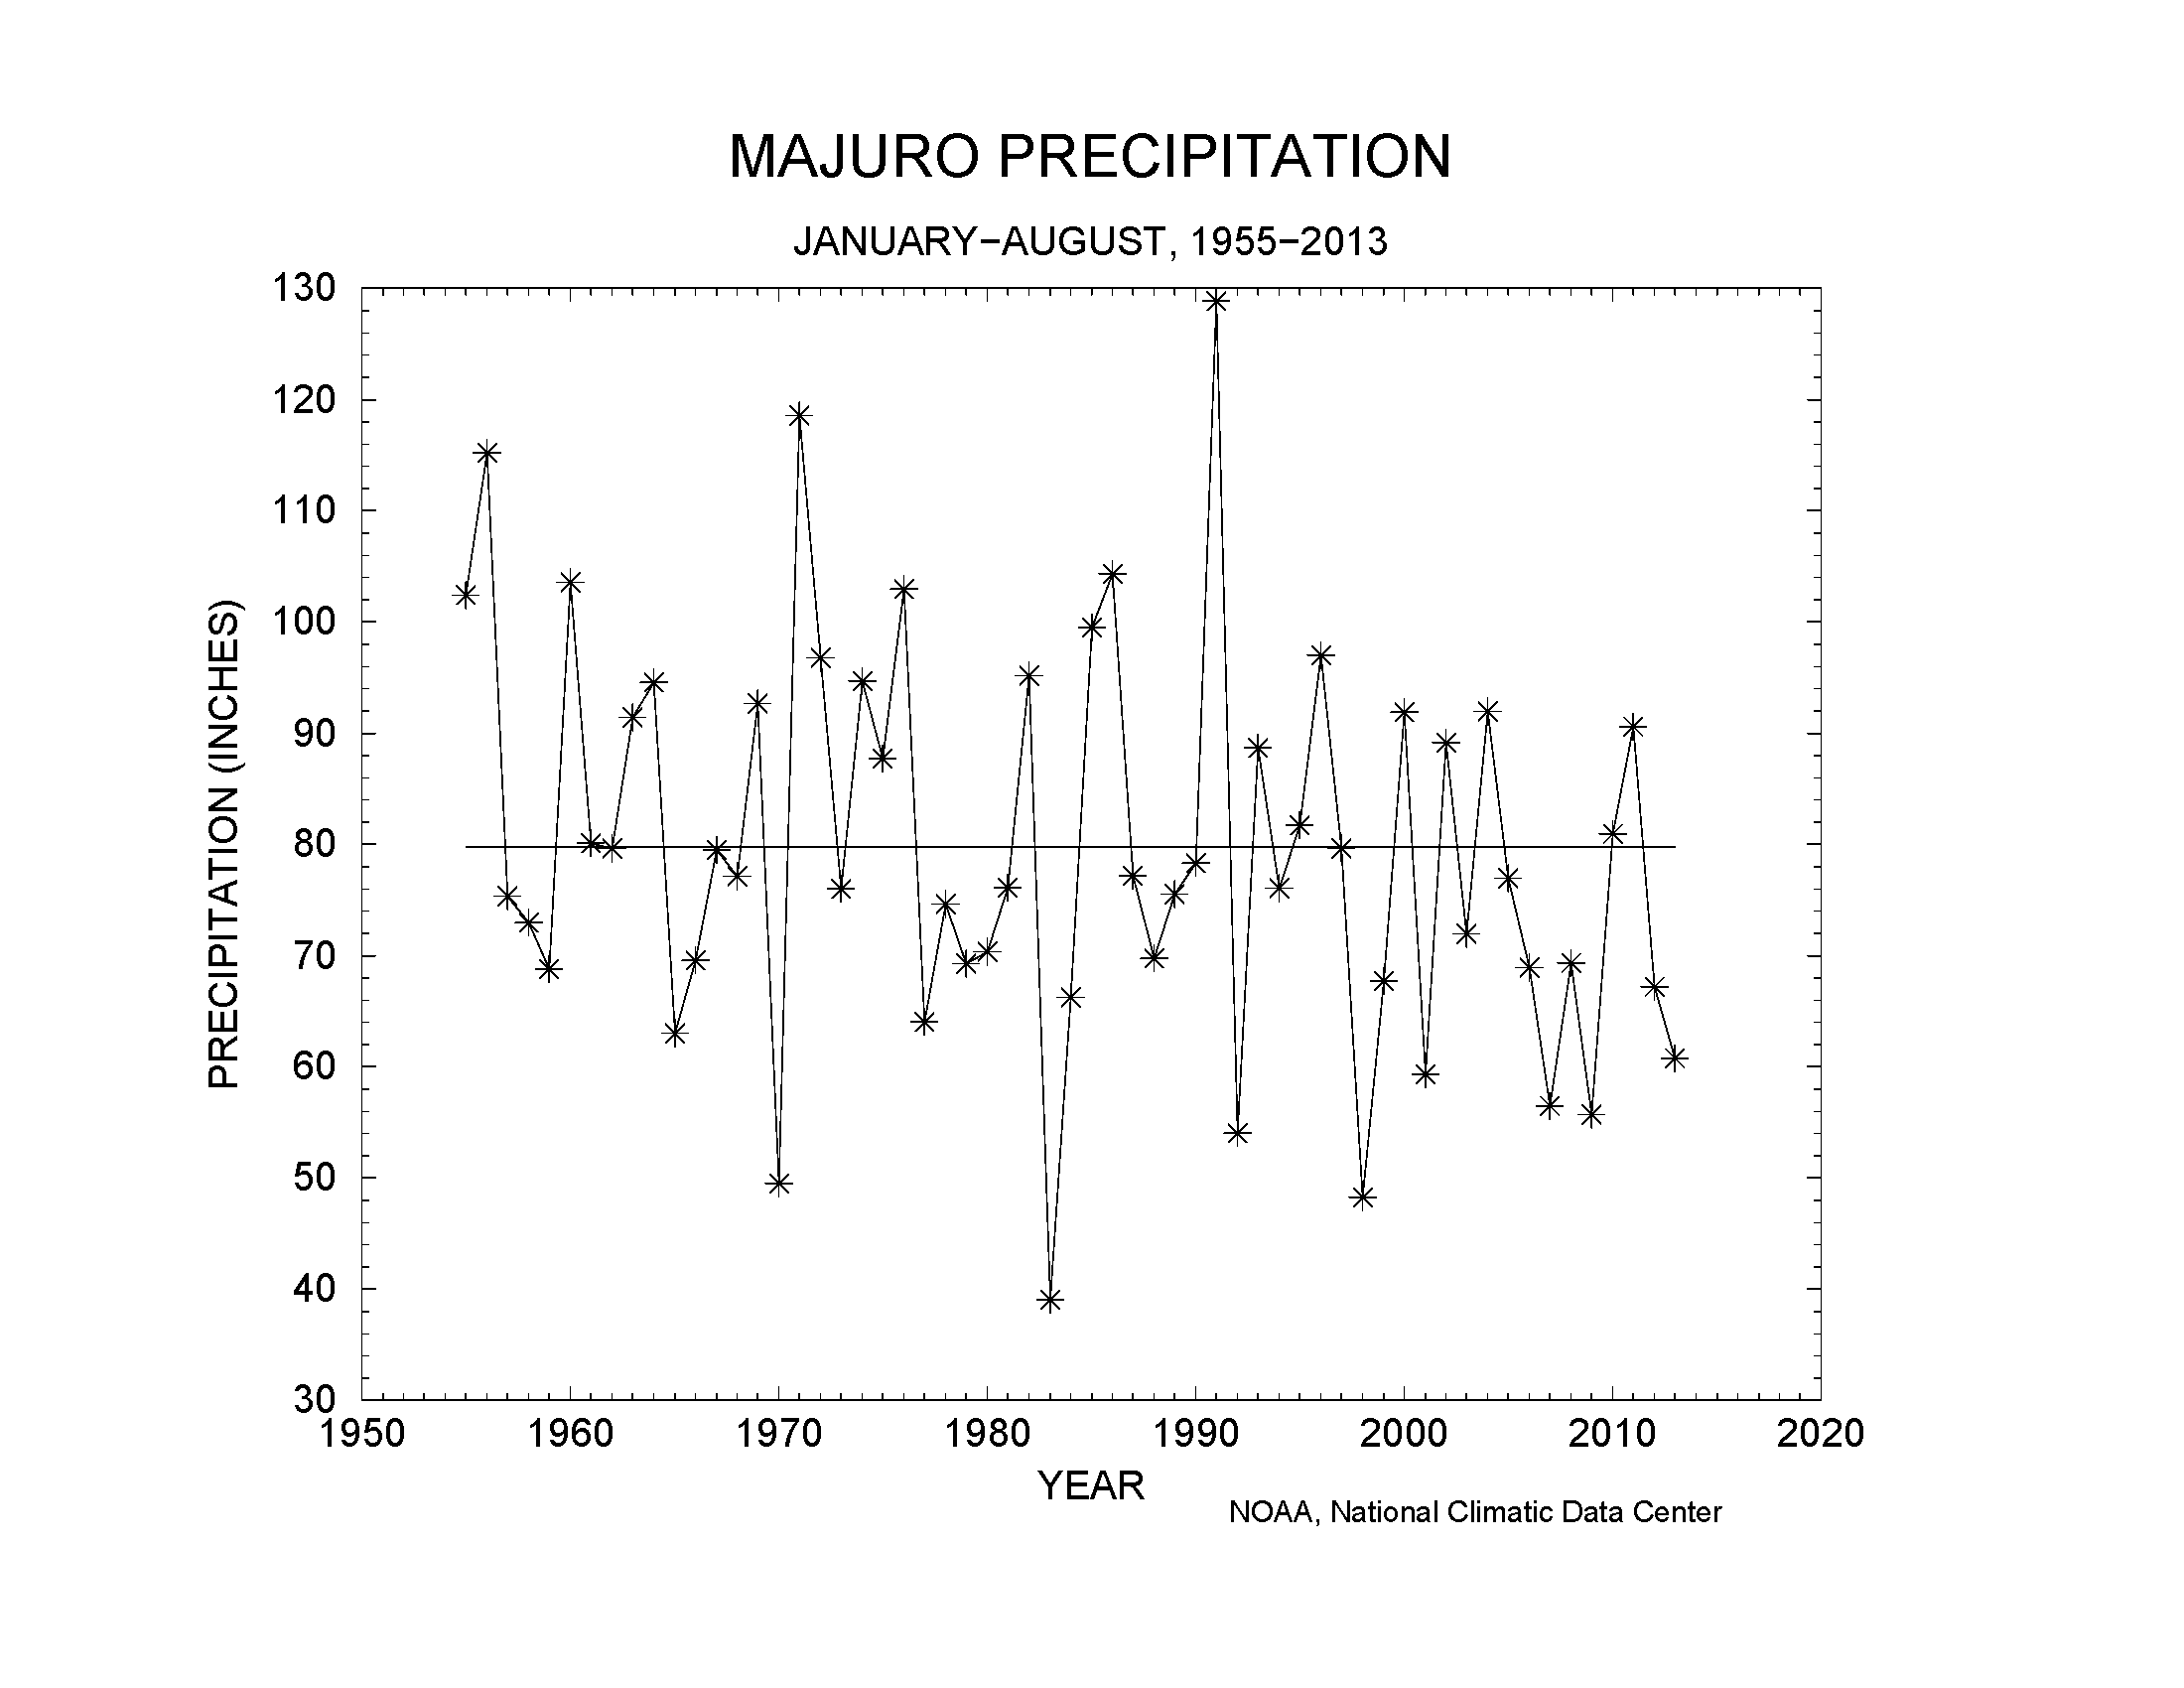
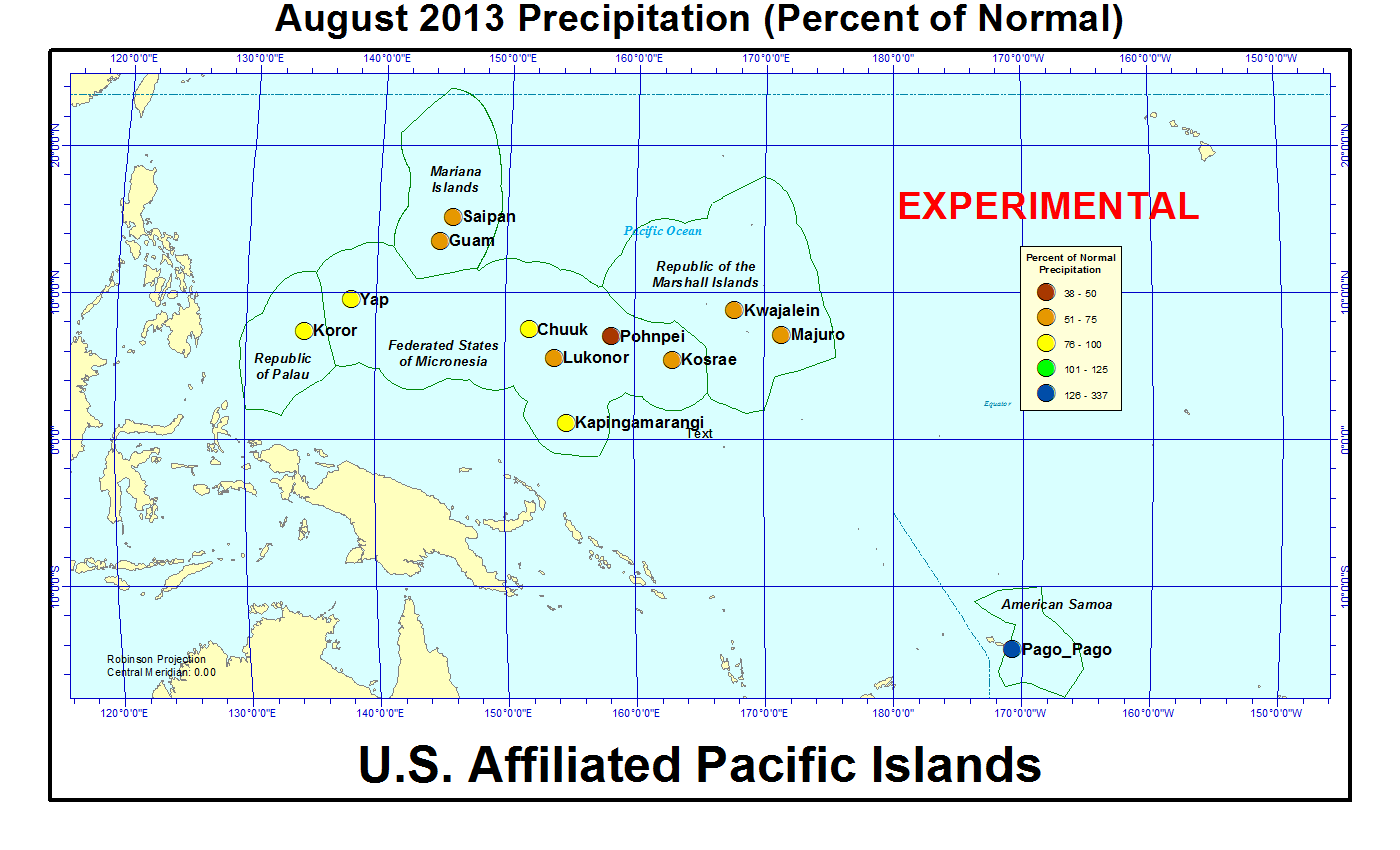
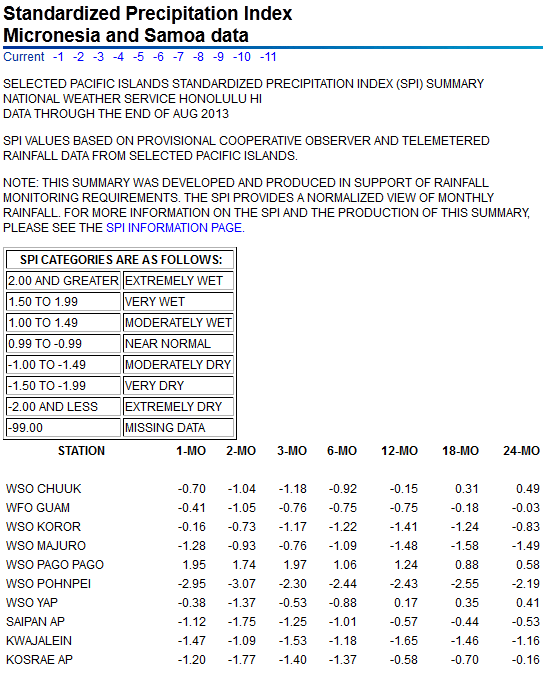
On other Pacific Islands (maps — Micronesia, Marshall Islands, basinwide), August was drier than normal at all of the primary regular-reporting stations except Koror (which was near normal) and Pago Pago (which was much wetter than normal), but this is the wet season at many of these stations when normals are usually high. The August rainfall amounts were above 4 inches (a critical threshold amount for islands in the Mariana chain) at Guam and Saipan, and above 8 inches (another critical threshold) at Chuuk, Koror, Kosrae, Lukonor, Pago Pago, and Yap, but below 8 inches at Kapingamarangi, Kwajalein, Majuro, and Pohnpei. In fact, August 2013 was the driest August in the 1953-2013 record for Pohnpei, fourth driest in the 1953-2013 record for Kwajalein, and eighth driest in the 1954-2013 record for Majuro. At the other end of the spectrum, August 2013 was the wettest August in the 1968-2013 record for Pago Pago.
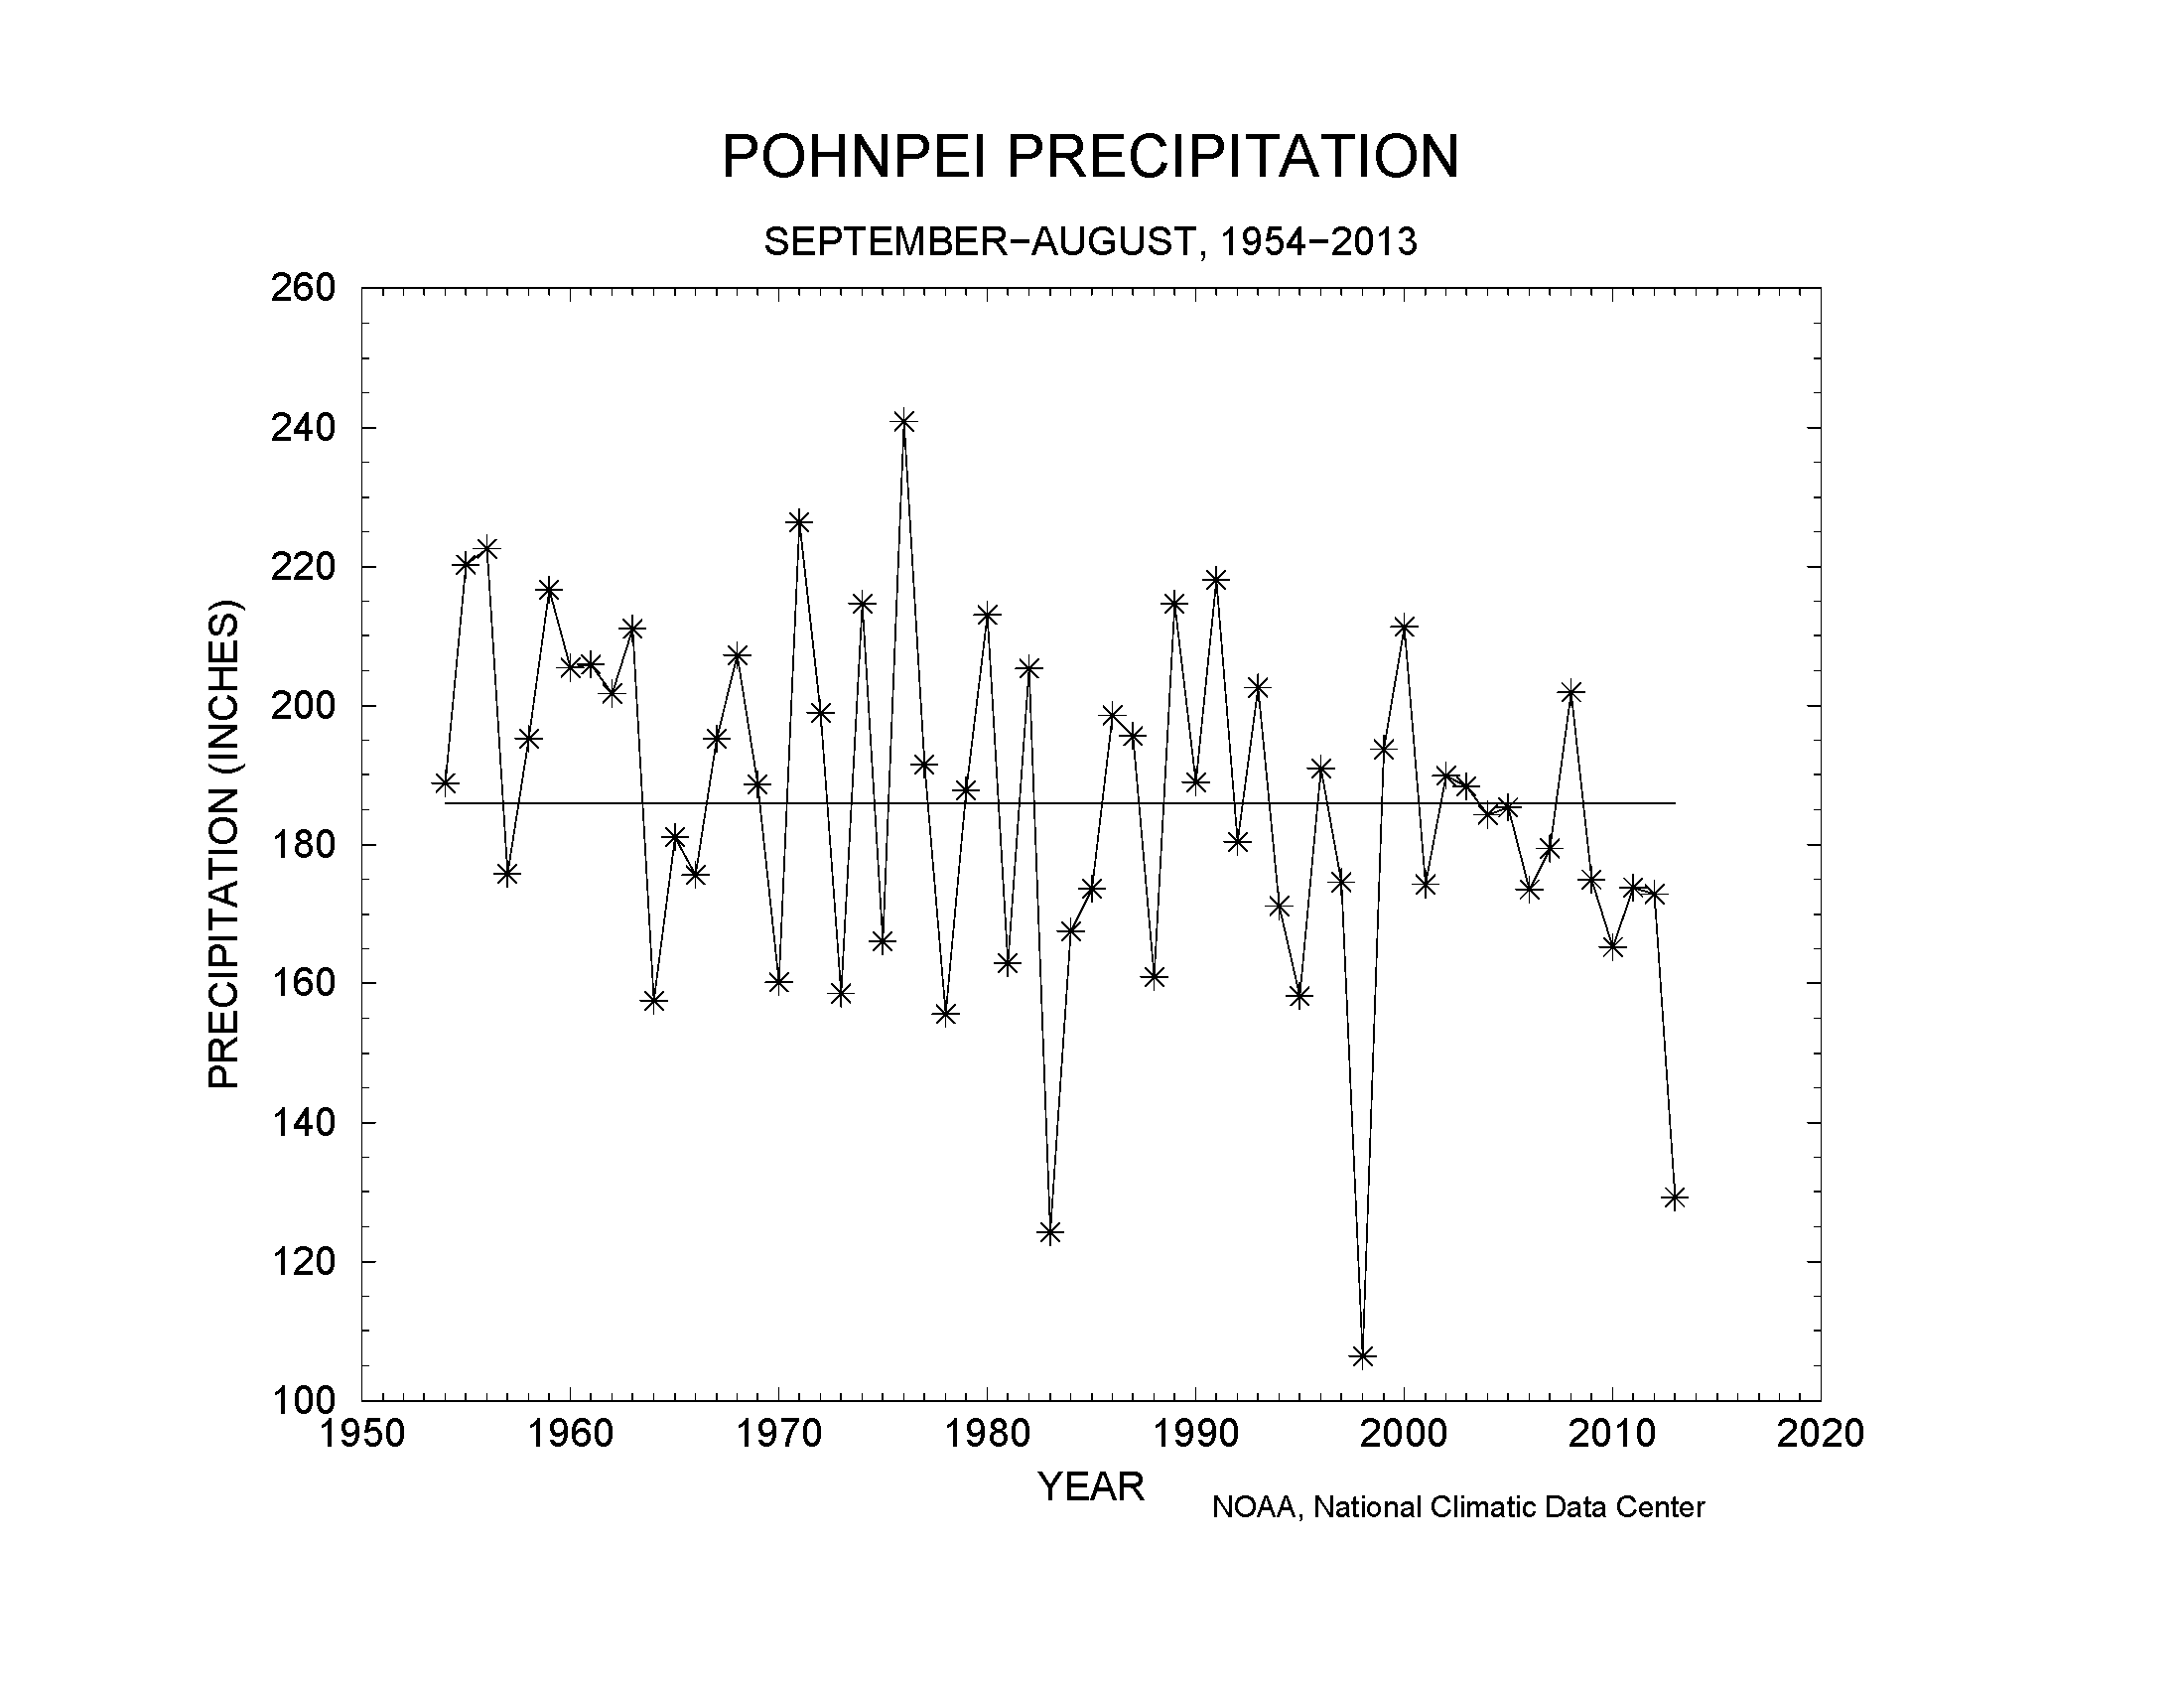
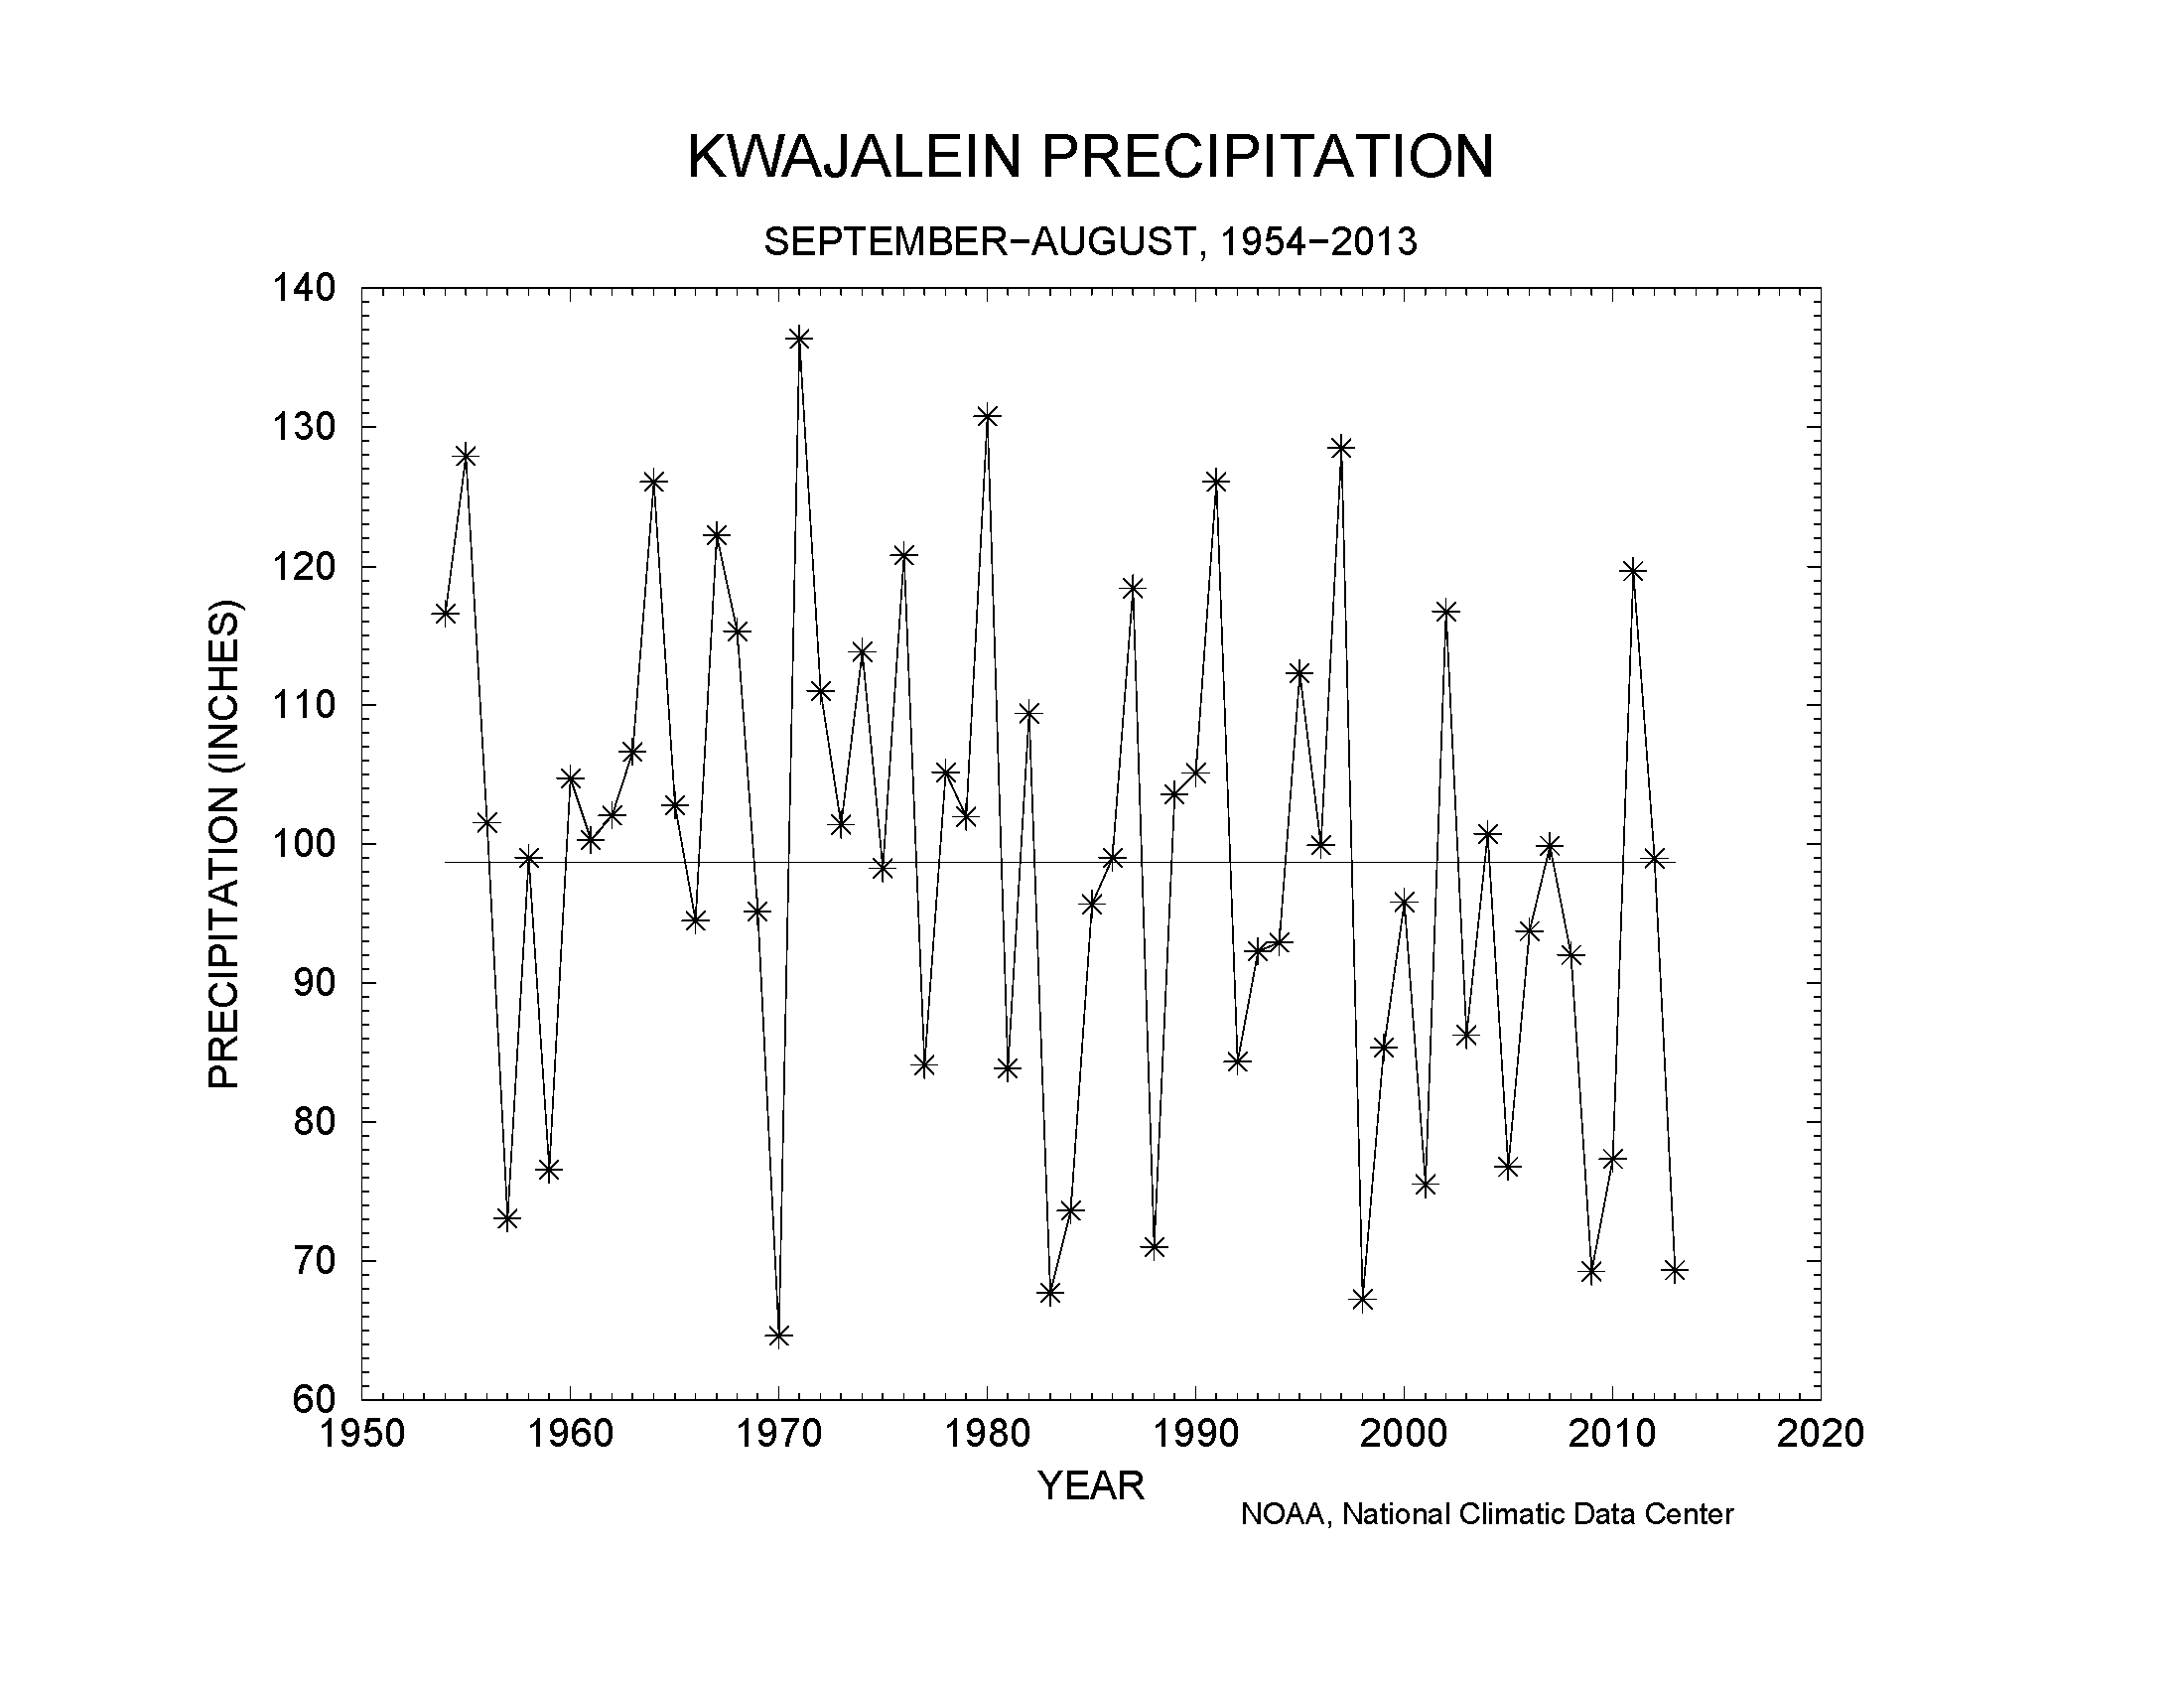
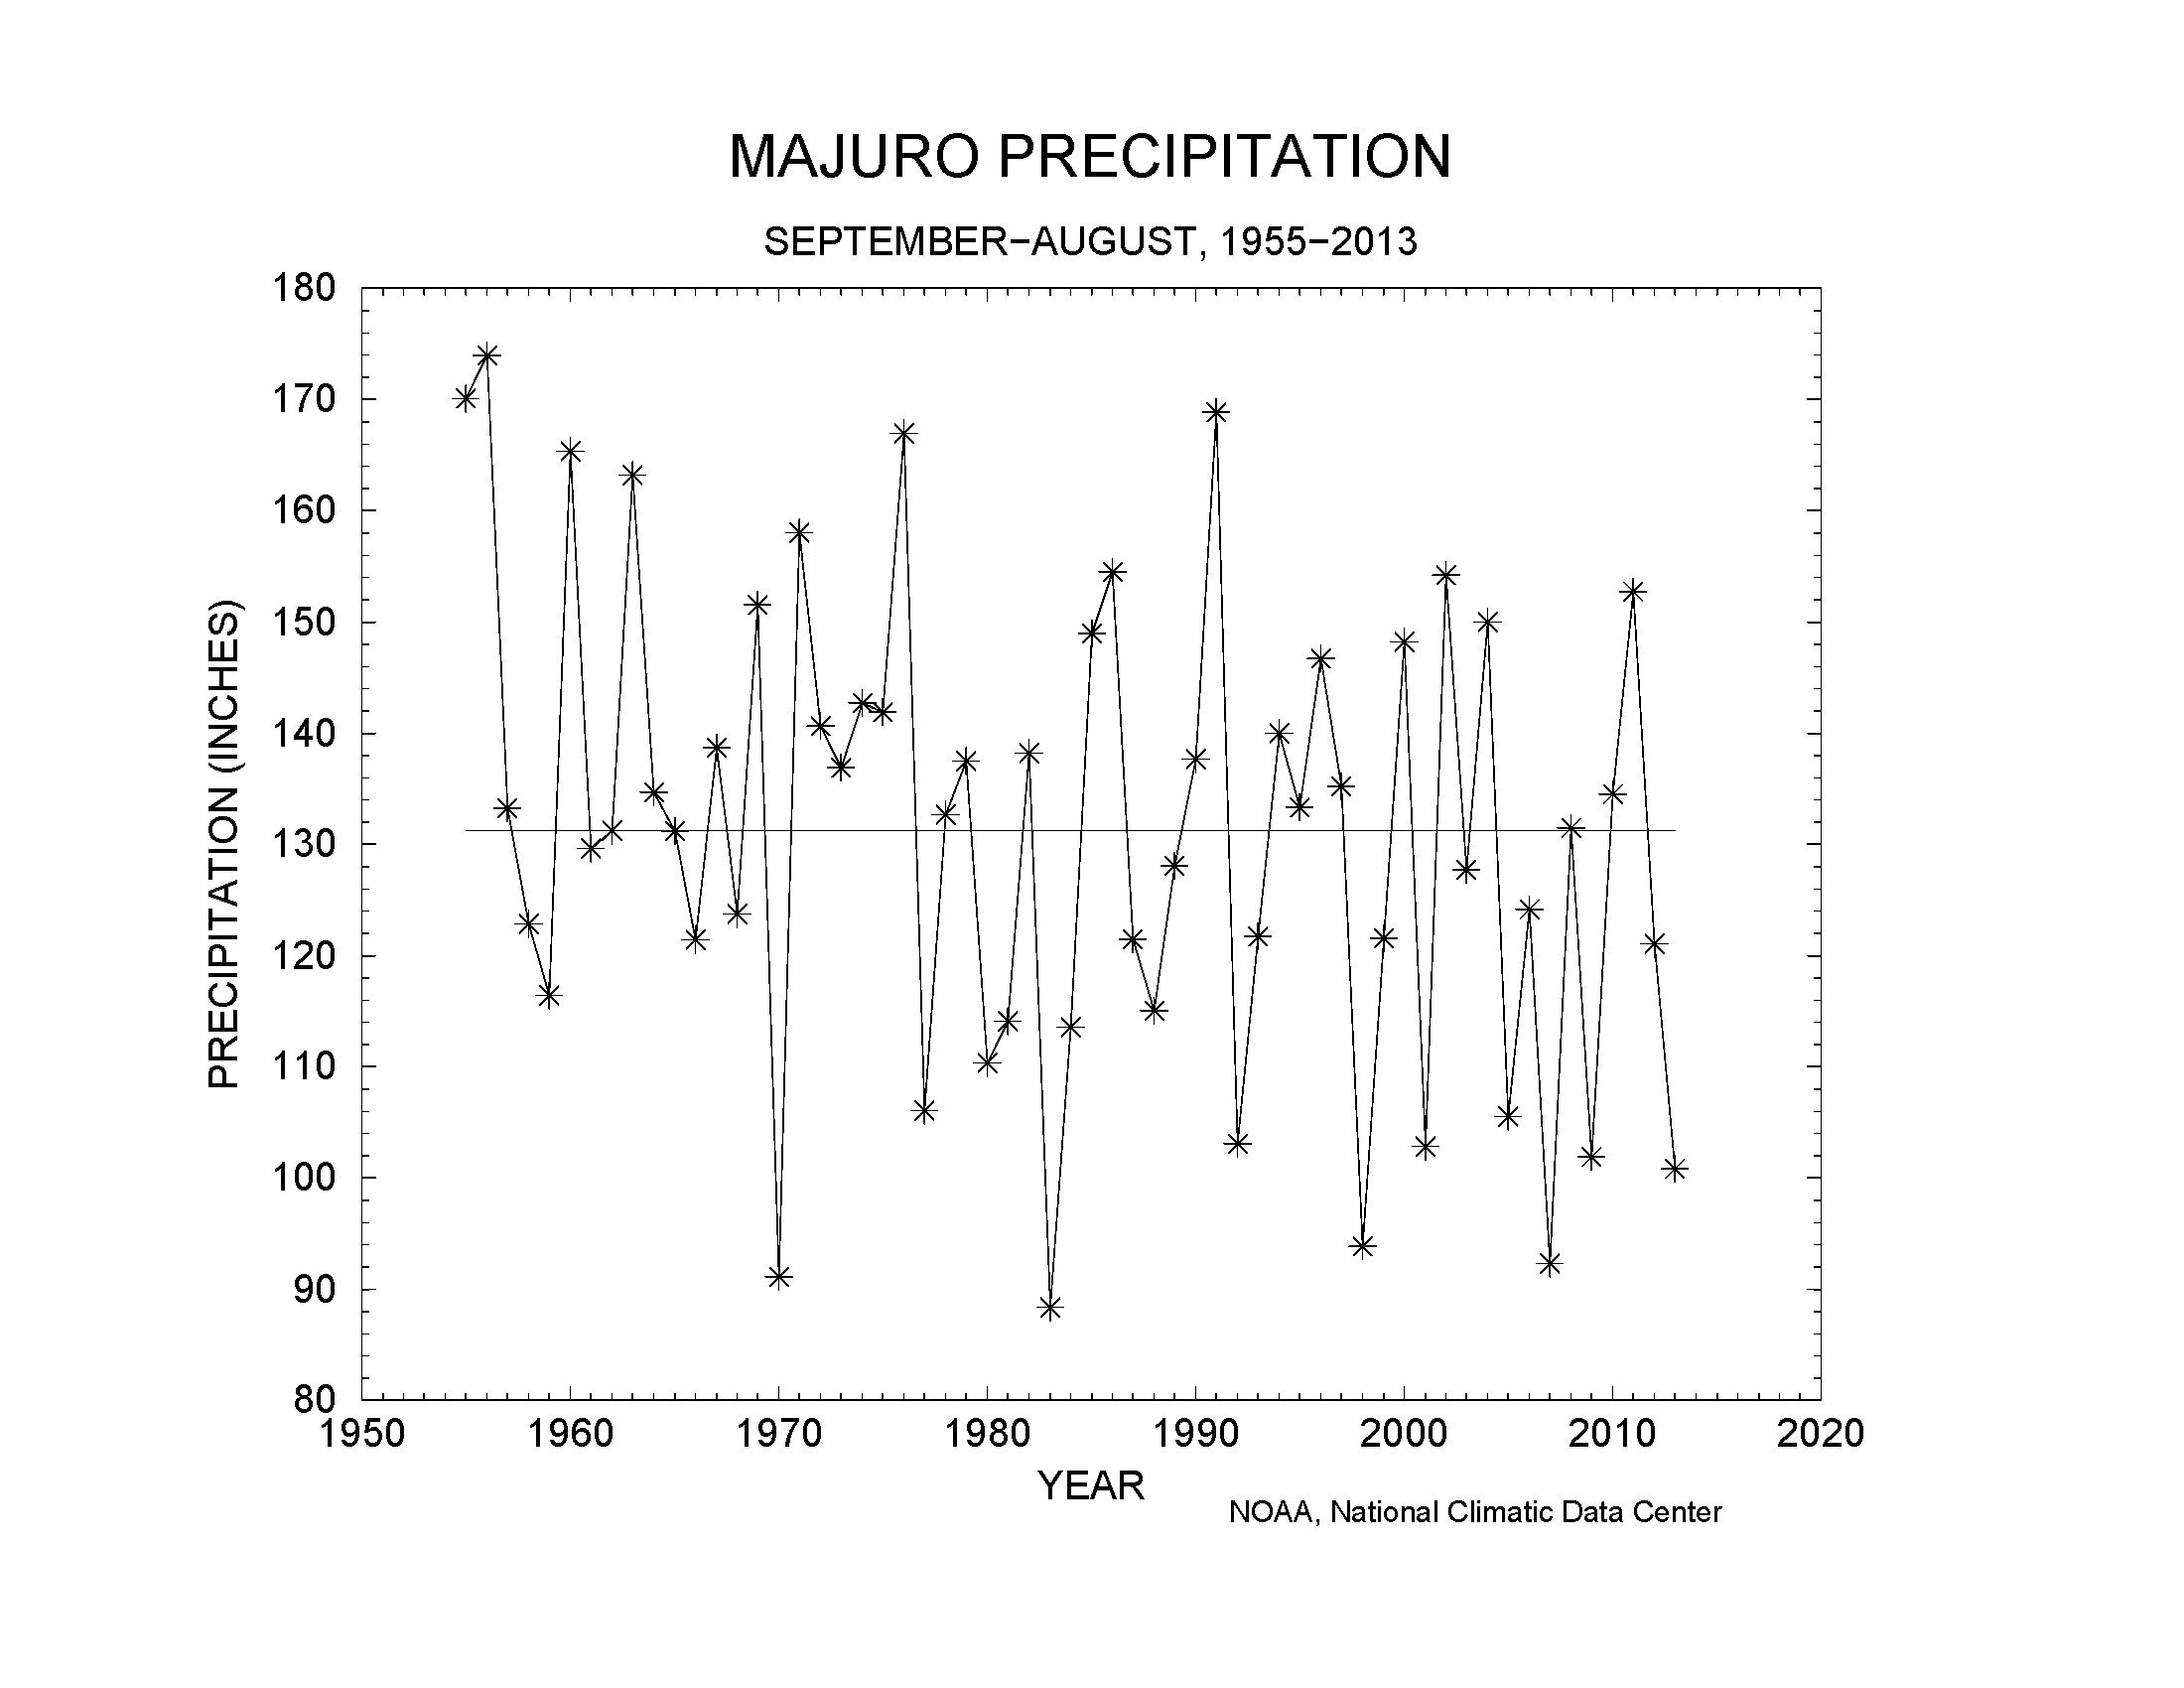
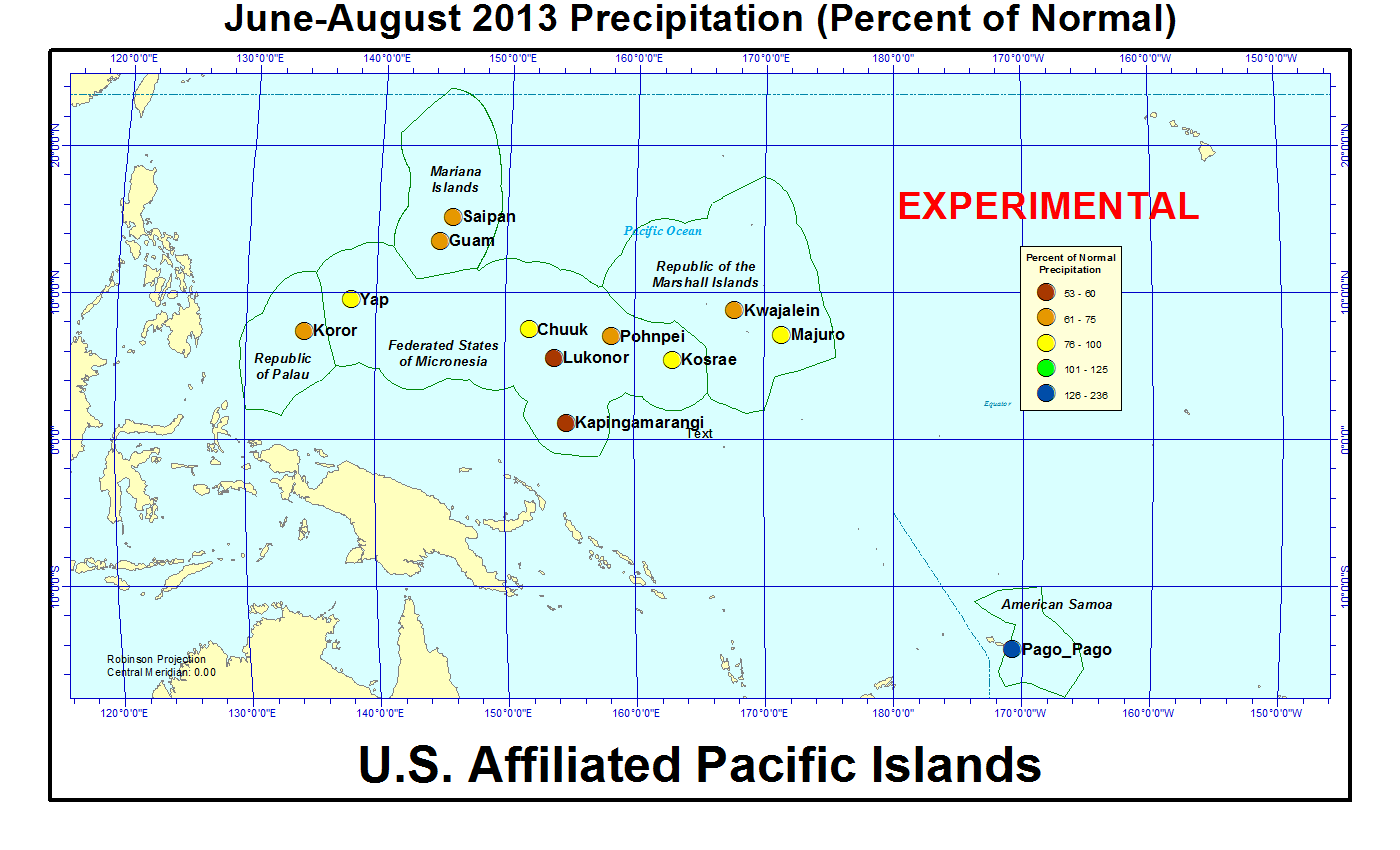
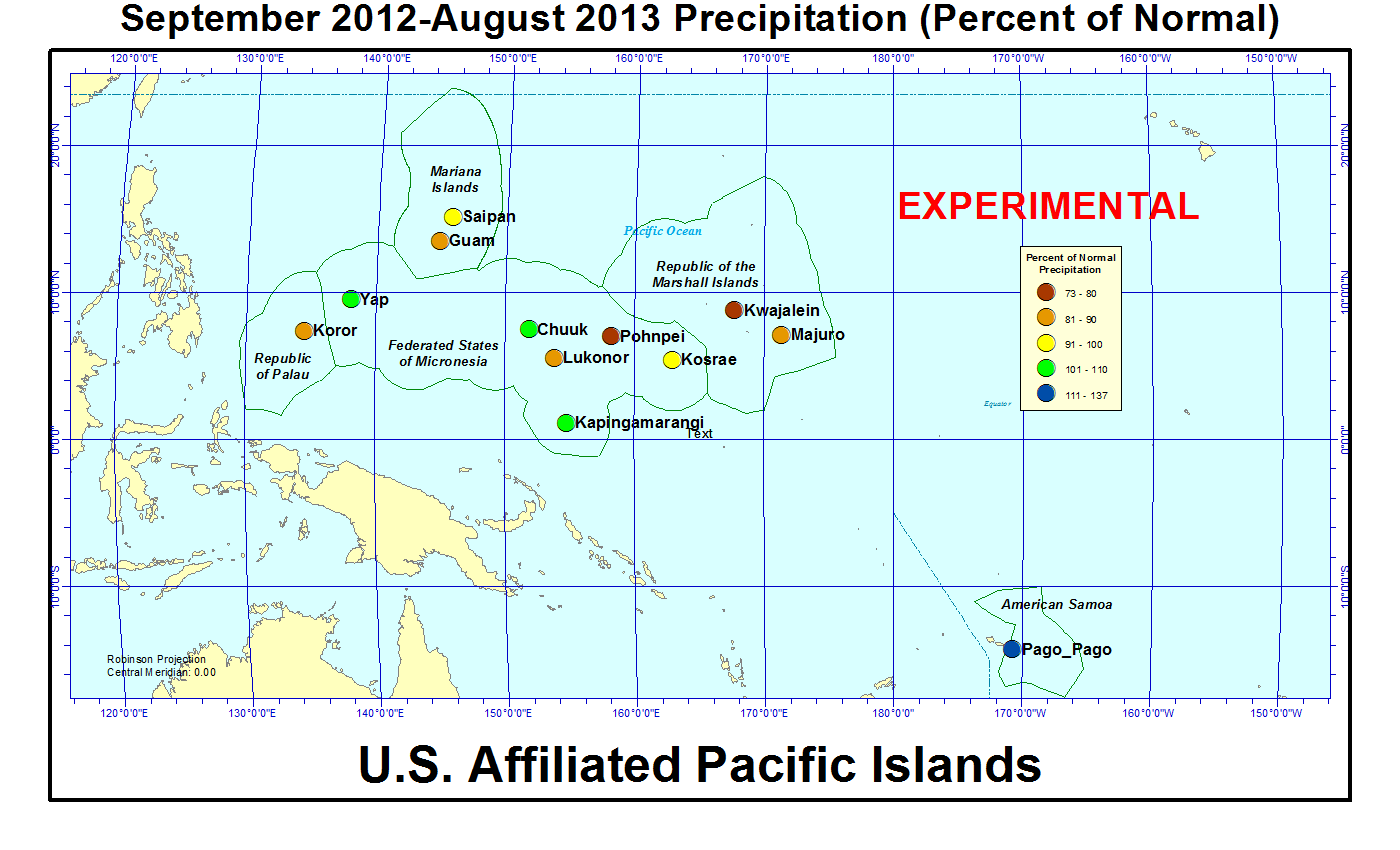
The weather pattern for much of 2013 and for much of the last twelve months has been very dry at some locations. The last three months (June-August 2013) were drier than normal at all of the primary regular-reporting stations except Pago Pago; the year to date (January-August 2013) was drier than normal at all of the stations except Pago Pago (which was much wetter than normal) and Kapingamarangi (which was near normal); and the last twelve months (September 2012-August 2013) were drier than normal at Koror, Guam, and Lukonor, and much drier than normal at Kwajalein, Majuro, and Pohnpei. Both January-August 2013 and September 2012-August 2013 were the third driest on record for Pohnpei, behind the El Niño years 1983 and 1998. January-August 2013 was the sixth driest on record for Kwajalein and eighth driest for Majuro, while September 2012-August 2013 ranked fifth driest for both Kwajalein and Majuro. The Republic of the Marshall Islands Cabinet on May 6 issued a state of disaster for the northern Republic of the Marshall Islands (RMI) where drought affected over 6,300 people, damaged or destroyed considerable agriculture on many atolls, and made well water too salty for human consumption. Seasonal trade-wind showers helped moderate the dry weather in June and July, but a full recovery is expected to take several months.
| Station Name | Sep 2012 | Oct 2012 | Nov 2012 | Dec 2012 | Jan 2013 | Feb 2013 | Mar 2013 | Apr 2013 | May 2013 | Jun 2013 | Jul 2013 | Aug 2013 | Sep- Aug |
|---|---|---|---|---|---|---|---|---|---|---|---|---|---|
| Chuuk | 86% | 128% | 144% | 116% | 99% | 146% | 192% | 49% | 79% | 84% | 84% | 80% | 99% |
| Guam NAS | 126% | 92% | 74% | 55% | 128% | 97% | 191% | 45% | 103% | 102% | 53% | 74% | 75% |
| Kapingamarangi | 147% | 138% | 167% | 74% | 197% | 154% | 199% | 77% | 48% | 47% | 50% | 83% | 96% |
| Koror | 111% | 78% | 67% | 103% | 72% | 92% | 56% | 103% | 109% | 67% | 64% | 99% | 77% |
| Kosrae | 109% | 113% | 119% | 110% | 98% | 146% | 64% | 95% | 76% | 122% | 69% | 62% | 82% |
| Kwajalein | 57% | 73% | 45% | 230% | 39% | 17% | 74% | 178% | 29% | 67% | 98% | 57% | 77% |
| Lukonor | 148% | 74% | 178% | 62% | 60% | 134% | 122% | 71% | 92% | 64% | 37% | 62% | 76% |
| Majuro | 67% | 46% | 154% | 53% | 31% | 152% | 78% | 69% | 65% | 96% | 103% | 65% | 80% |
| Pago Pago | 195% | 54% | 181% | 143% | 137% | 87% | 93% | 144% | 66% | 220% | 153% | 337% | 121% |
| Pohnpei | 90% | 82% | 109% | 71% | 83% | 54% | 67% | 59% | 52% | 113% | 61% | 38% | 71% |
| Saipan | 101% | 172% | 31% | 89% | 191% | 78% | 127% | 63% | 203% | 157% | 50% | 53% | 95% |
| Yap | 187% | 140% | 121% | 102% | 90% | 113% | 130% | 50% | 69% | 134% | 53% | 86% | 103% |
| Station Name | Sep 2012 | Oct 2012 | Nov 2012 | Dec 2012 | Jan 2013 | Feb 2013 | Mar 2013 | Apr 2013 | May 2013 | Jun 2013 | Jul 2013 | Aug 2013 | Sep- Aug |
|---|---|---|---|---|---|---|---|---|---|---|---|---|---|
| Chuuk | 10.04" | 14.68" | 15.30" | 13.09" | 10.00" | 10.60" | 16.00" | 6.11" | 8.93" | 9.85" | 10.04" | 10.25" | 134.89" |
| Guam NAS | 15.98" | 10.56" | 5.45" | 2.81" | 5.12" | 2.95" | 3.95" | 1.14" | 3.51" | 6.32" | 5.39" | 10.84" | 74.02" |
| Kapingamarangi | 14.56" | 11.32" | 15.44" | 7.25" | 18.02" | 14.25" | 22.79" | 10.51" | 5.84" | 6.45" | 7.11" | 6.72" | 140.26" |
| Koror | 13.01" | 9.23" | 7.68" | 11.52" | 7.29" | 7.91" | 4.13" | 7.57" | 12.87" | 11.70" | 11.94" | 13.35" | 118.2" |
| Kosrae | 15.52" | 12.33" | 16.49" | 17.75" | 16.27" | 18.89" | 10.20" | 16.71" | 13.41" | 17.89" | 10.33" | 8.80" | 174.59" |
| Kwajalein | 6.17" | 8.18" | 5.09" | 15.33" | 1.22" | 0.46" | 1.73" | 9.34" | 1.97" | 4.66" | 9.71" | 5.51" | 69.37" |
| Lukonor | 15.02" | 8.39" | 16.18" | 7.00" | 5.05" | 11.93" | 11.34" | 8.06" | 10.77" | 7.51" | 5.88" | 8.64" | 115.77" |
| Majuro | 7.47" | 5.84" | 20.69" | 6.09" | 2.42" | 10.44" | 5.13" | 6.46" | 6.60" | 10.55" | 11.51" | 7.62" | 100.82" |
| Pago Pago | 12.73" | 4.99" | 18.34" | 18.31" | 18.27" | 10.48" | 9.97" | 13.52" | 6.35" | 11.75" | 8.48" | 18.14" | 151.33" |
| Pohnpei | 11.27" | 12.59" | 16.18" | 11.37" | 10.88" | 5.14" | 8.78" | 10.92" | 10.44" | 16.79" | 9.42" | 5.41" | 129.19" |
| Saipan | 10.24" | 18.31" | 1.75" | 3.44" | 4.83" | 2.03" | 2.40" | 1.65" | 4.82" | 5.68" | 4.42" | 6.99" | 66.56" |
| Yap | 25.19" | 17.08" | 10.67" | 8.68" | 5.72" | 5.86" | 5.95" | 2.81" | 5.41" | 16.16" | 8.01" | 12.69" | 124.23" |
| Station Name | Sep 2012 | Oct 2012 | Nov 2012 | Dec 2012 | Jan 2013 | Feb 2013 | Mar 2013 | Apr 2013 | May 2013 | Jun 2013 | Jul 2013 | Aug 2013 | Sep- Aug |
|---|---|---|---|---|---|---|---|---|---|---|---|---|---|
| Chuuk | 11.71" | 11.51" | 10.61" | 11.25" | 10.10" | 7.25" | 8.32" | 12.47" | 11.30" | 11.66" | 11.98" | 12.86" | 136.77" |
| Guam NAS | 12.66" | 11.44" | 7.38" | 5.11" | 4.01" | 3.03" | 2.07" | 2.53" | 3.40" | 6.18" | 10.14" | 14.74" | 99.09" |
| Kapingamarangi | 9.93" | 8.19" | 9.27" | 9.84" | 9.15" | 9.27" | 11.43" | 13.64" | 12.08" | 13.78" | 14.15" | 8.13" | 145.85" |
| Koror | 11.77" | 11.84" | 11.39" | 11.16" | 10.18" | 8.56" | 7.44" | 7.32" | 11.83" | 17.48" | 18.53" | 13.50" | 152.90" |
| Kosrae | 14.22" | 10.94" | 13.83" | 16.11" | 16.67" | 12.93" | 16.06" | 17.51" | 17.75" | 14.64" | 14.91" | 14.22" | 213.87" |
| Kwajalein | 10.74" | 11.18" | 11.28" | 6.66" | 3.16" | 2.64" | 2.35" | 5.26" | 6.72" | 6.93" | 9.87" | 9.74" | 90.41" |
| Lukonor | 10.15" | 11.32" | 9.08" | 11.27" | 8.41" | 8.93" | 9.26" | 11.31" | 11.69" | 11.65" | 15.93" | 14.04" | 151.36" |
| Majuro | 11.17" | 12.73" | 13.44" | 11.39" | 7.74" | 6.88" | 6.58" | 9.42" | 10.11" | 11.01" | 11.17" | 11.69" | 125.25" |
| Pago Pago | 6.53" | 9.26" | 10.14" | 12.84" | 13.34" | 12.00" | 10.68" | 9.39" | 9.66" | 5.33" | 5.55" | 5.38" | 125.57" |
| Pohnpei | 12.55" | 15.27" | 14.83" | 16.08" | 13.18" | 9.55" | 13.17" | 18.41" | 19.96" | 14.81" | 15.43" | 14.26" | 182.36" |
| Saipan | 10.09" | 10.62" | 5.61" | 3.85" | 2.53" | 2.59" | 1.89" | 2.63" | 2.38" | 3.62" | 8.91" | 13.13" | 70.25" |
| Yap | 13.50" | 12.18" | 8.83" | 8.51" | 6.39" | 5.19" | 4.56" | 5.63" | 7.85" | 12.04" | 15.08" | 14.82" | 120.31" |
[top]
State/Regional/National Moisture Status
A detailed review of drought and moisture conditions is available for all contiguous U.S. states, the nine standard regions, and the nation (contiguous U.S.):
| northeast u. s. | east north central u. s. | central u. s. |
| southeast u. s. | west north central u. s. | south u. s. |
| southwest u. s. | northwest u. s. | west u. s. |
| Contiguous United States |
[top]
Contacts & Questions