|
Contents Of This Report: |
|
National Drought Overview
|
|
[top]
Detailed Drought Discussion
Overview
An unusually  active jet stream for June sent weather systems propagating across much of the country, while high pressure ridging dominated over the Southwest. Weather systems moving in the jet stream flow moderated temperatures in the eastern U.S. and tapped Gulf of Mexico and Atlantic moisture to bring above-normal precipitation, especially to the Upper Midwest and along the East Coast, improving drought conditions in those areas. But the month ended up hot and dry beneath the ridge in the West, especially for the Southwest and Alaska where drought expanded.
When the temperature and precipitation are averaged across the CONUS for the entire month, June 2013 ranked as the 15th warmest and 13th wettest June in the 119-year record.
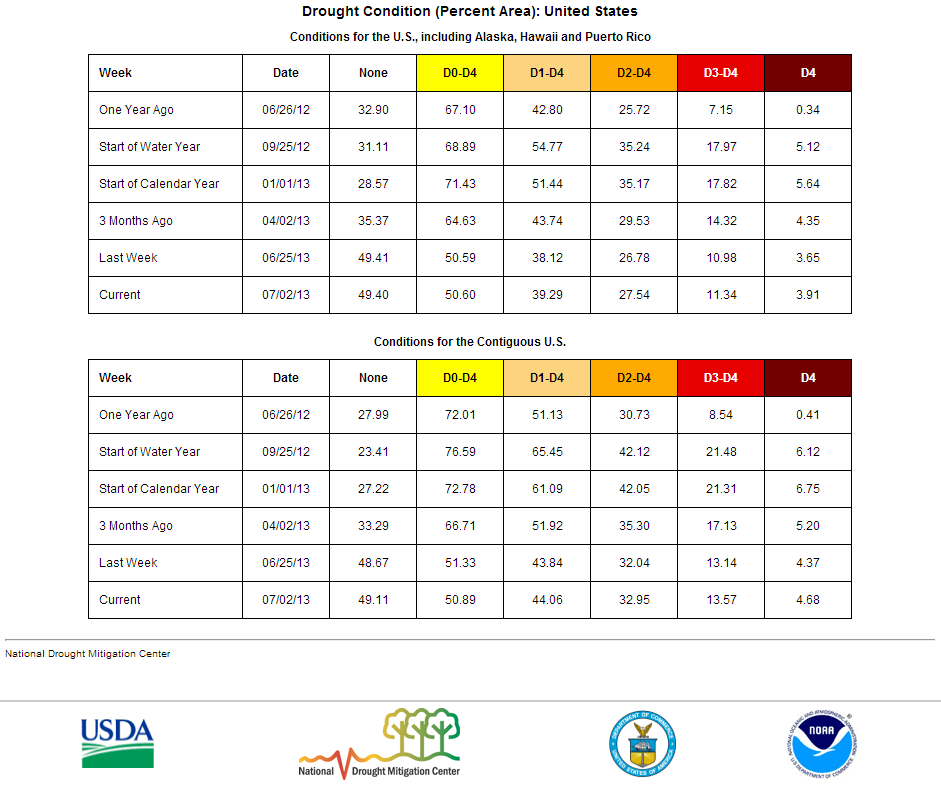
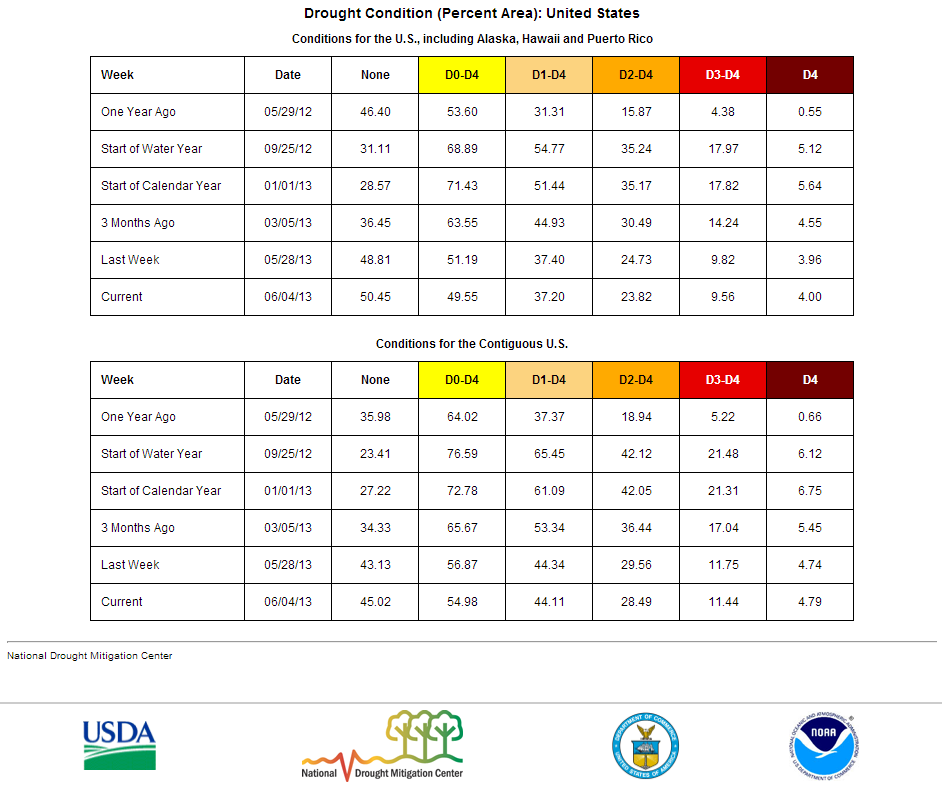
The lack of rain in the West and Alaska expanded the national (all of the U.S.) drought footprint from 37.2 percent in moderate to exceptional drought last month to 39.3 percent at the end of June, although the contiguous U.S. drought footprint remained about the same at 44.1 percent (per U.S. Drought Monitor statistics).
According to the Palmer Drought Index, which goes back to the beginning of the 20th century, 39.2 percent of the contiguous U.S. was in moderate to extreme drought at the end of June, an increase of about 1 percent compared to last month.
active jet stream for June sent weather systems propagating across much of the country, while high pressure ridging dominated over the Southwest. Weather systems moving in the jet stream flow moderated temperatures in the eastern U.S. and tapped Gulf of Mexico and Atlantic moisture to bring above-normal precipitation, especially to the Upper Midwest and along the East Coast, improving drought conditions in those areas. But the month ended up hot and dry beneath the ridge in the West, especially for the Southwest and Alaska where drought expanded.
When the temperature and precipitation are averaged across the CONUS for the entire month, June 2013 ranked as the 15th warmest and 13th wettest June in the 119-year record.
The lack of rain in the West and Alaska expanded the national (all of the U.S.) drought footprint from 37.2 percent in moderate to exceptional drought last month to 39.3 percent at the end of June, although the contiguous U.S. drought footprint remained about the same at 44.1 percent (per U.S. Drought Monitor statistics).
According to the Palmer Drought Index, which goes back to the beginning of the 20th century, 39.2 percent of the contiguous U.S. was in moderate to extreme drought at the end of June, an increase of about 1 percent compared to last month.
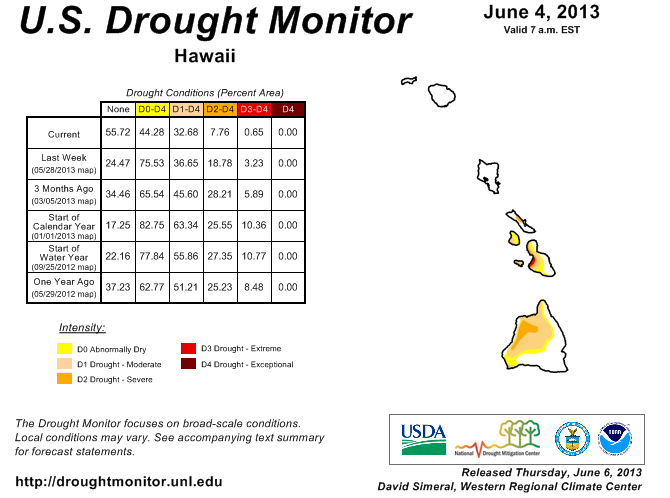
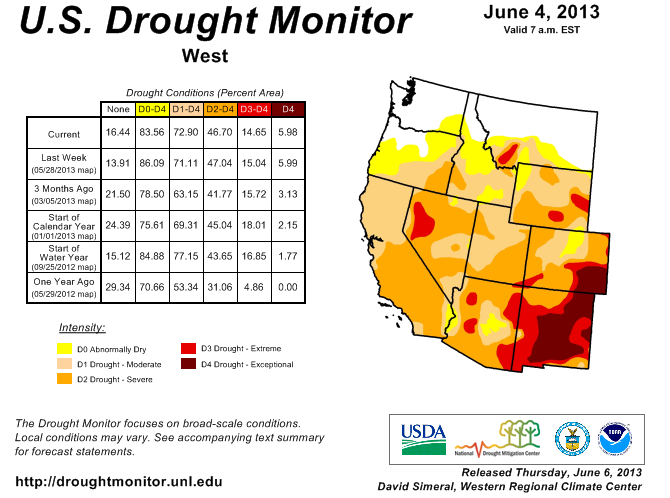
The U.S. Drought Monitor drought map valid June 4, 2013.
By the end of the month, the core drought areas in the U.S. included:
- a large area of moderate (D1) to severe (D2) drought, including spots of extreme (D3) to exceptional (D4) drought, stretching from the West into the Central and Southern Plains, with a large area of intense extreme to exceptional drought lingering from the Southwest to the Southern and Central Plains states;
- Hawaii, where moderate to extreme drought largely persisted; and
- Alaska, where moderate drought was expanding.
Palmer Drought Index
The Palmer drought indices measure the balance between moisture demand (evapotranspiration driven by temperature) and moisture supply (precipitation). The Palmer Z Index depicts moisture conditions for the current month, while the Palmer Hydrological Drought Index (PHDI) and Palmer Drought Severity Index (PDSI) depict the current month's cumulative moisture conditions integrated over the last several months.
|
 |
Used together, the Palmer Z Index and PHDI maps show that June short-term dry conditions occurred over long-term dry conditions that existed at the end of May across much of the West, exacerbating the drought, and short-term wet conditions occurred over much of the eastern U.S., eliminating pockets of long-term moderate drought that had developed by the end of May. Short-term wet conditions occurred over long-term wet conditions in the Midwest and extreme Northern Plains, reinforcing the wet spell there.
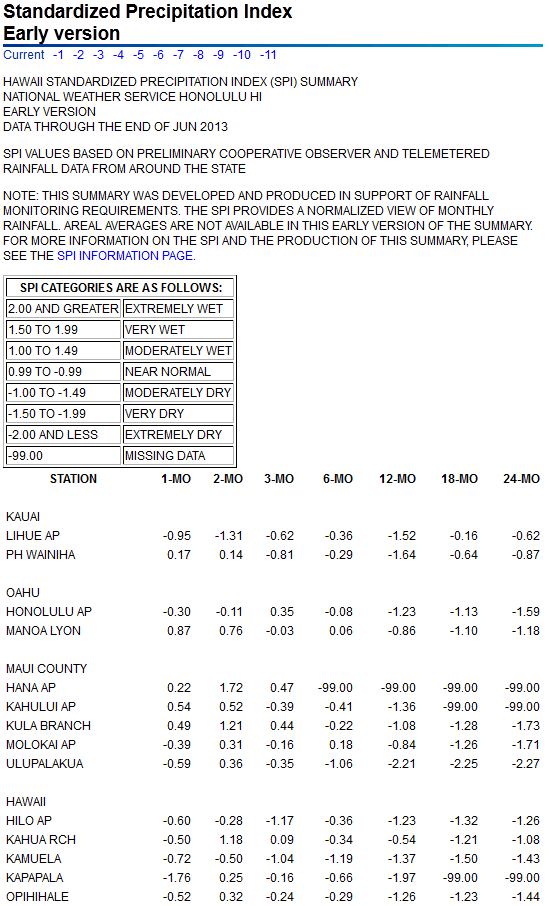
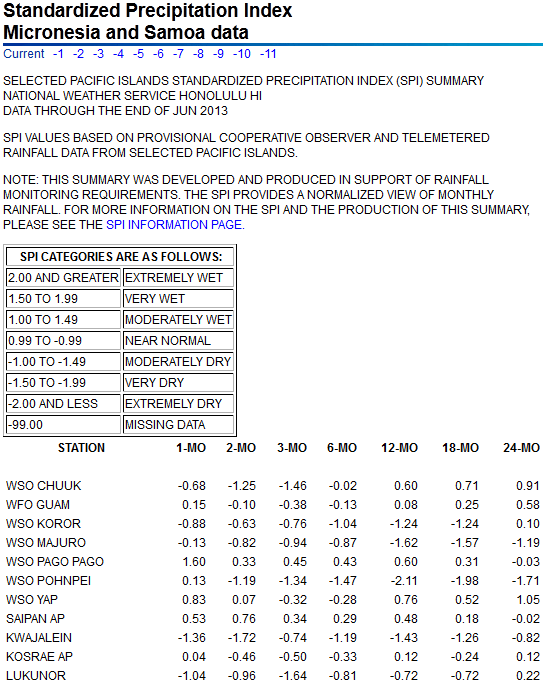
Standardized Precipitation Index
The Standardized Precipitation Index (SPI) measures moisture supply. The SPI maps here show the spatial extent of anomalously wet and dry areas at time scales ranging from 1 month to 24 months.
 |
 |
 |
The precipitation pattern during the last several months has resulted in SPI maps which show a fairly consistent spatial pattern of dryness and wetness across time. The 1-month SPI map shows dryness from the Southwest to Central Rockies and Central Plains with wet conditions all along the East Coast and from the Midwest to extreme Northern Plains as well as parts of the Northwest. The wetness from the Ohio Valley to Pennsylvania begins to disappear, and the Midwest wetness becomes more intense, starting at the 2-month time scale, with the Midwest wetness reaching a peak on the 6-month SPI map. In fact, it has been so wet here in recent months that the extreme drought of last summer does not show up on the 12-month SPI map. It is only on the 24-month SPI map that the earlier dryness in the Midwest and Southeast appears, and even then only as near normal conditions. On the other hand, drought across the West is evident at all time scales and is most intense at 6 months; Southern Plains dryness becomes evident on the 2-month SPI map and is most intense at 24 months; and drought in the Southwest to Central Plains is most noticeable at 12 and 24 months.
 |
 |
 |
Agricultural, Hydrological, and Meteorological Indices and Impacts
 |
 |
Drought conditions were reflected in numerous agricultural, hydrological, and other meteorological indicators, both observed and modeled.
Agricultural:
According to the U.S. Department of Agriculture (USDA), as of July 2, 48 percent of winter wheat, 45 percent of cattle, 31 percent of hay, 17 percent of corn, and 8 percent of soybeans were in drought. Except for winter wheat, these percentages are less than the corresponding percentages from a month ago. July 1 USDA statistics revealed that 42 percent of the U.S. winter wheat crop was rated in poor to very poor condition, with statewide percentages as high as 75 percent in Texas, 72 percent in Colorado, 55 percent in South Dakota, 53 percent in Oklahoma, and 50 percent in Nebraska. Less than half (43%) of the nation's winter wheat crop has been harvested, behind the 5-year average of 52 percent for this time of year. For other crops, 8 percent of the nation's corn and 7 percent of soybeans were in poor to very poor condition. June 30 statistics reveal 25 percent of the nation's pasture and rangeland rated in poor to very poor condition, about the same as last month, with statewide values as high as 98 percent in California, 96 percent in New Mexico, 86 percent in Arizona, 71 percent in Colorado, and 60 percent in Nevada. The statewide percentages were above average for this time of year from Texas to Nebraska, from Kansas to Washington, and from Oklahoma to California.
Map showing NOAA/NWS/CPC modeled monthly soil moisture percentiles.
- USDA (U.S. Department of Agriculture) observed soil moisture conditions, comparison to 5-year average and 10-year average, percentiles, and departure from median;
- the Palmer Crop Moisture Index (CMI), which reflected worsening drought in the West and Southern Plains as the month progressed (weeks 1, 2, 3, 4);
- NOAA Climate Prediction Center (CPC) modeled soil moisture anomalies and percentiles for the end of the month, and soil moisture anomaly change compared to previous month;
- CPC's Leaky Bucket model soil moisture percentiles;
- NLDAS (North American Land Data Assimilation System) modeled soil moisture percentiles for the top soil layer and total soil layer;
- VIC (University of Washington Variable Infiltration Capacity macroscale hydrologic model) modeled soil moisture percentiles, and soil moisture percentile change compared to previous month;
- USDA percent of pasture and rangeland in poor to very poor condition and comparison to average (anomalies, percentiles);
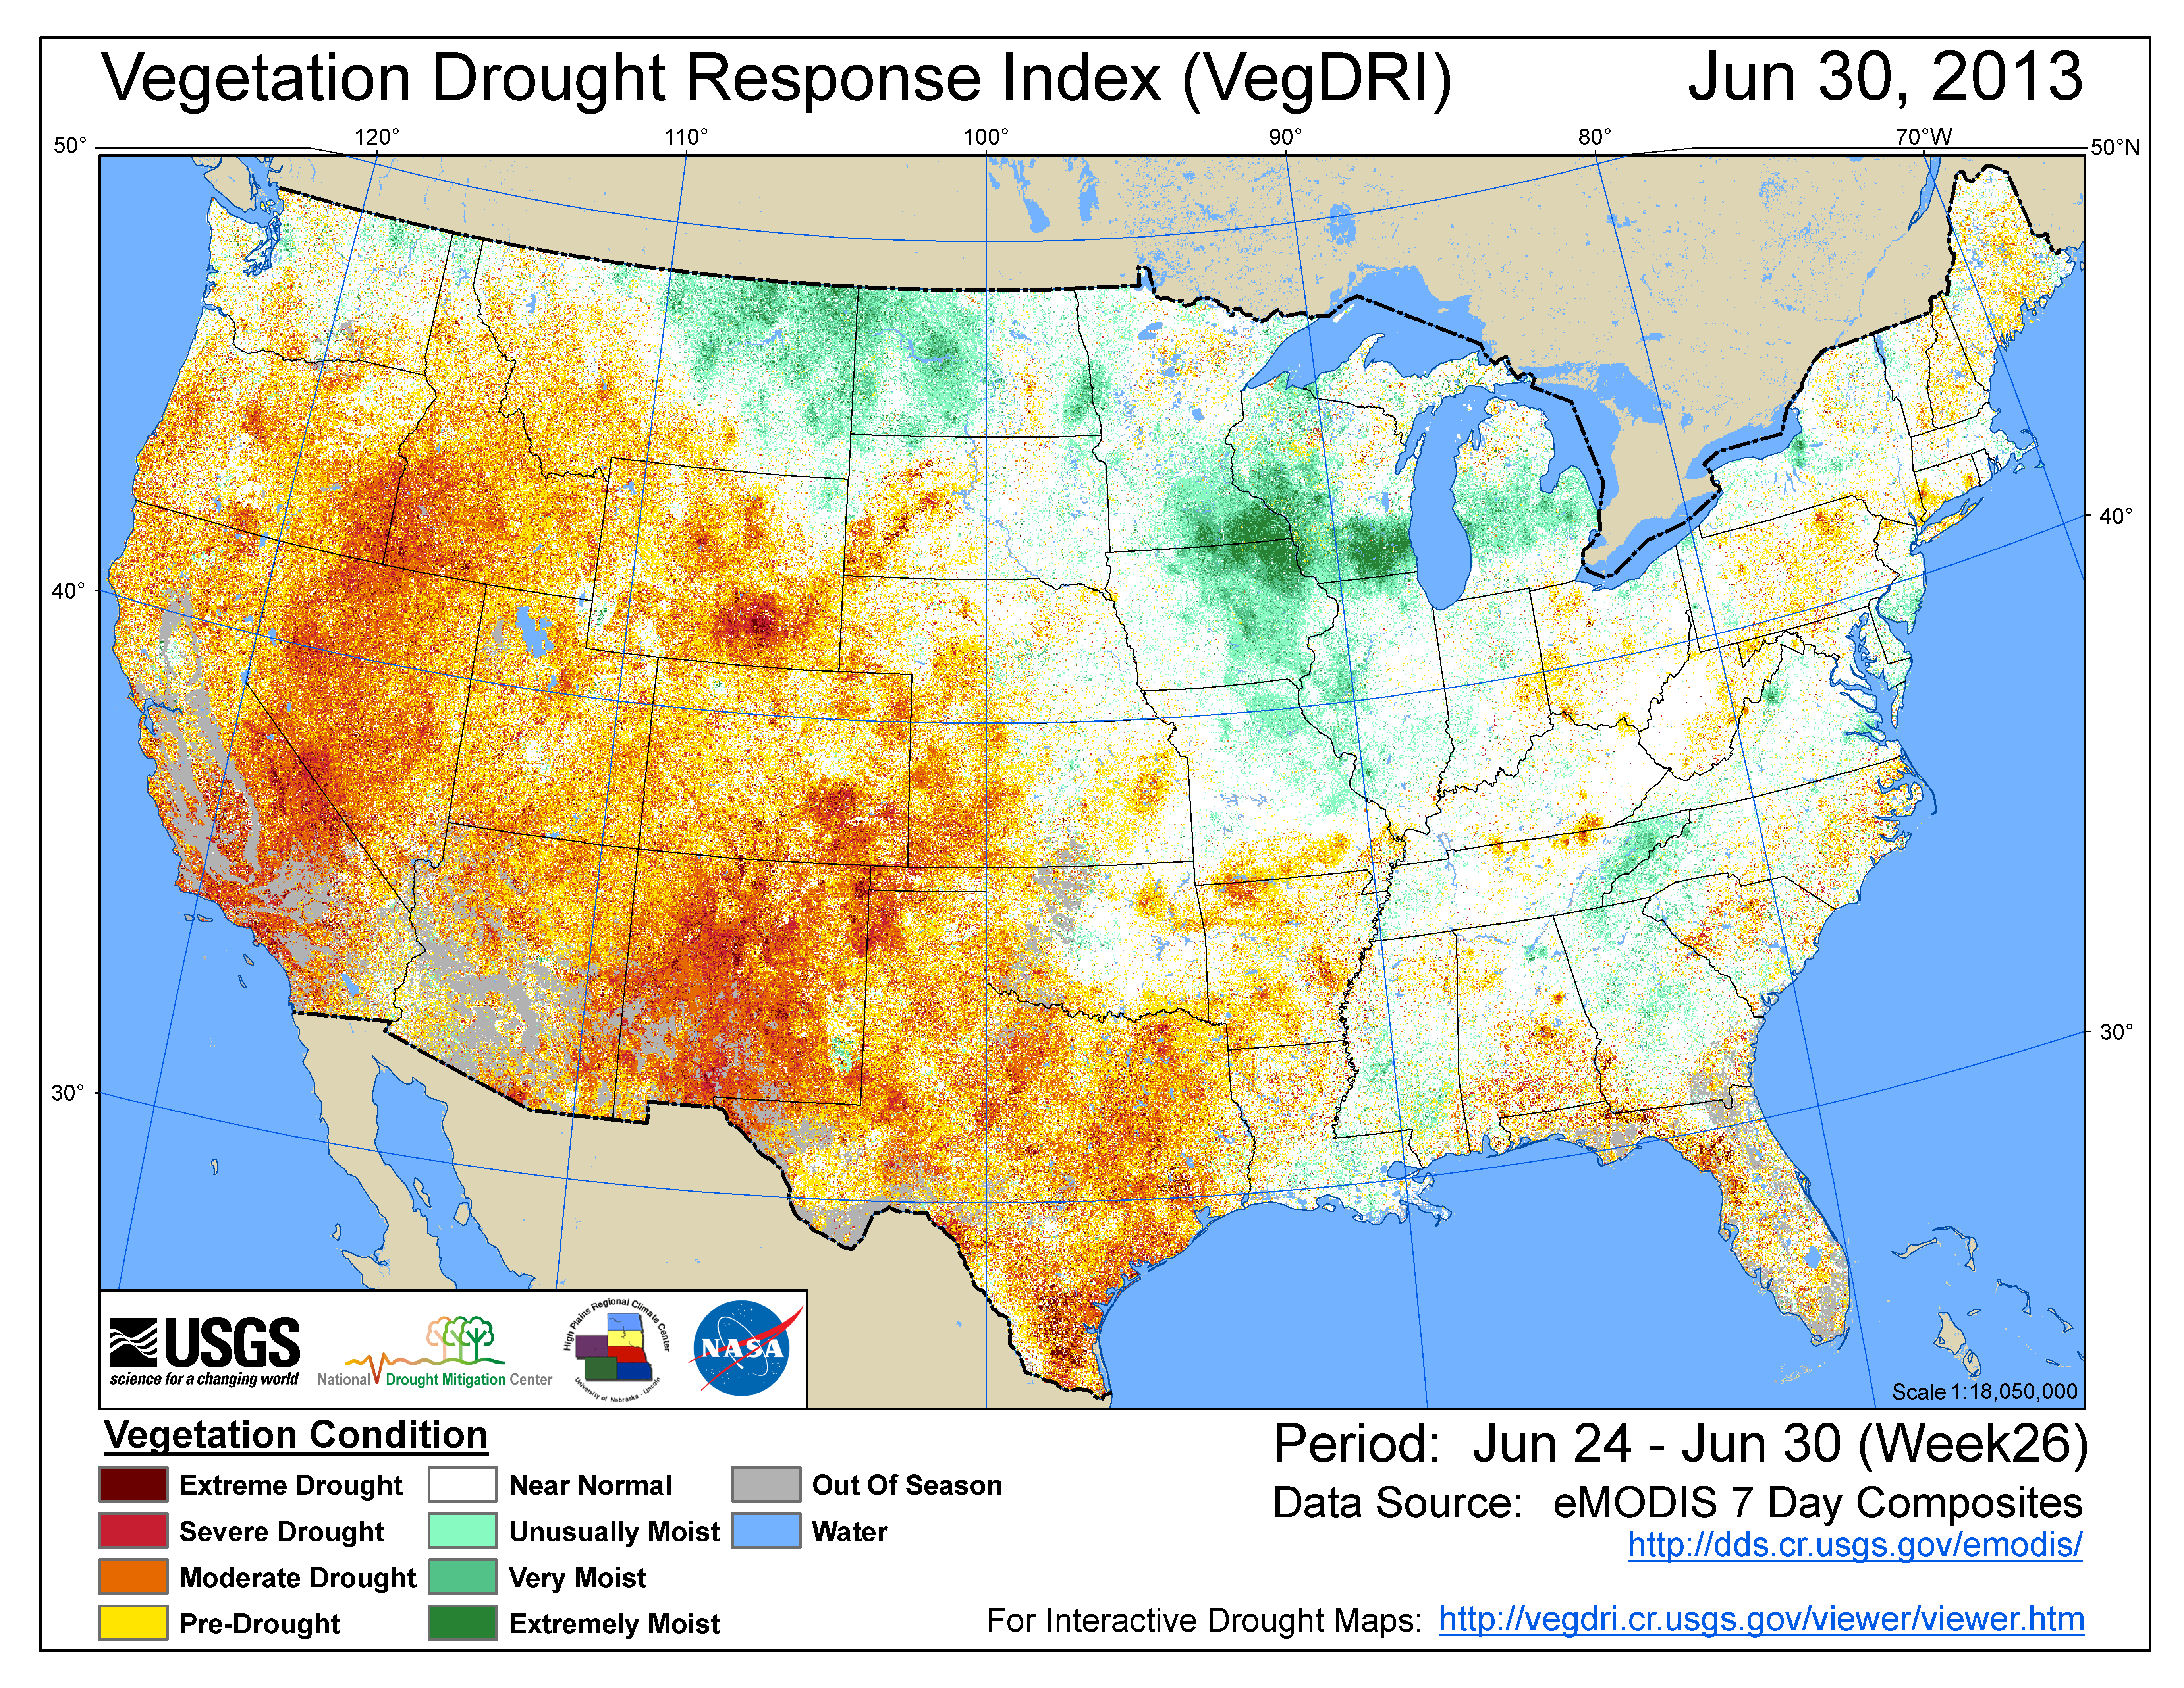
- Vegetation Drought Response Index (VegDRI);
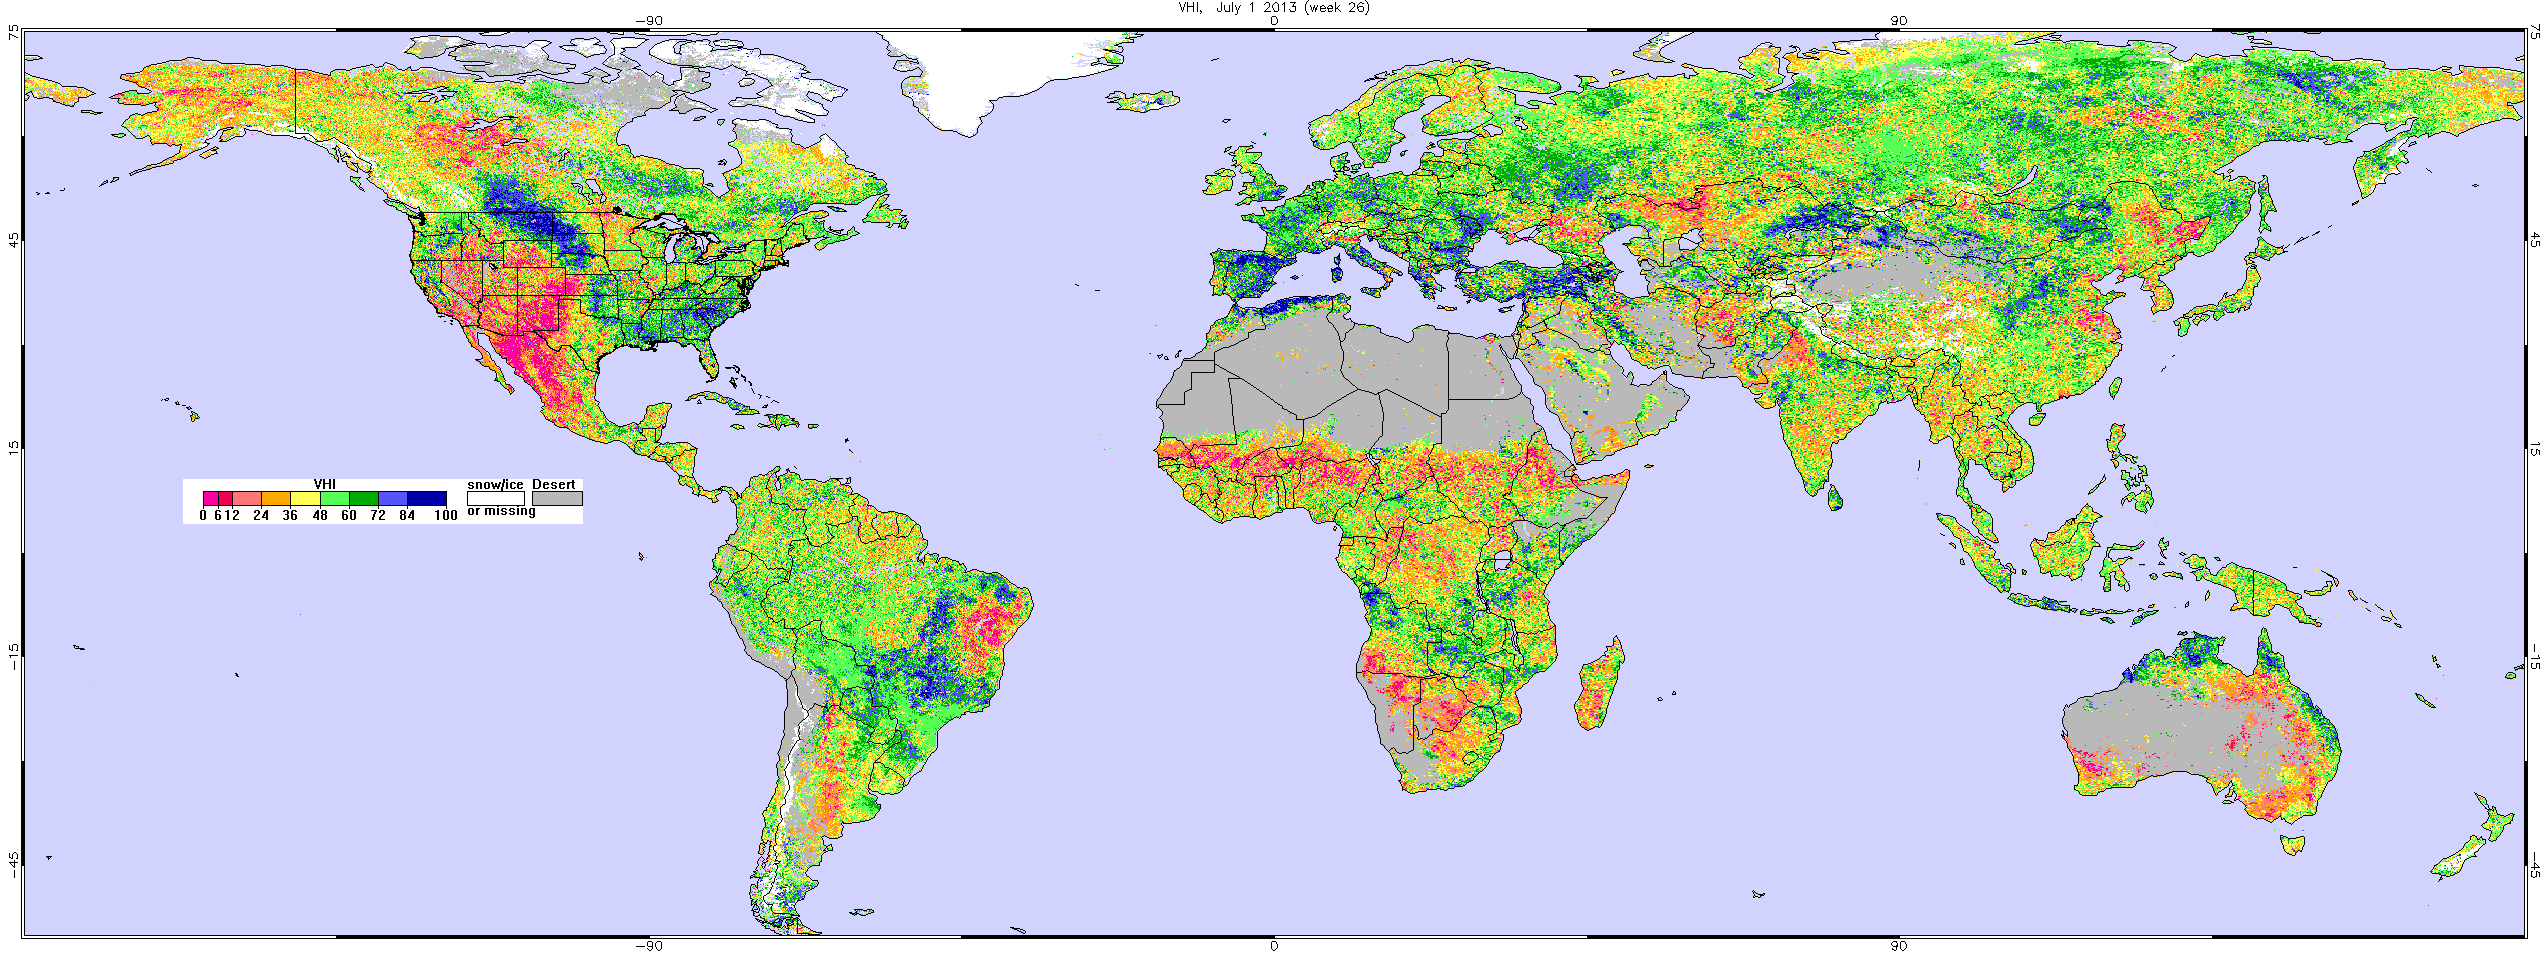
- the NOAA/NESDIS satellite-based Vegetation Health Index (VHI);
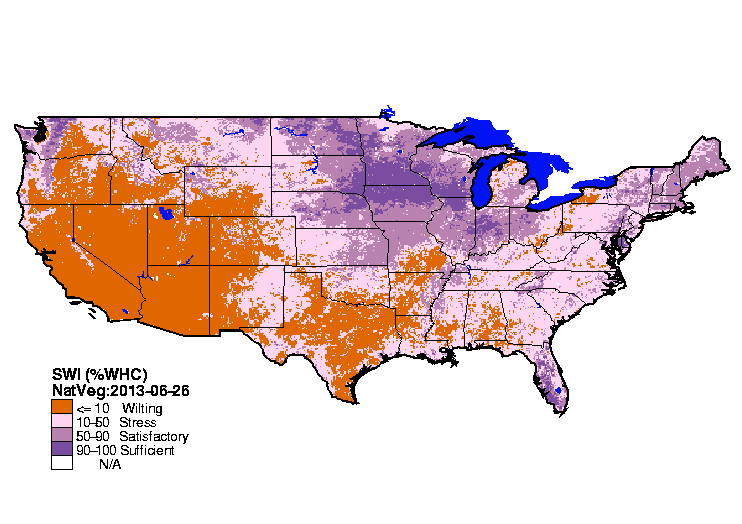
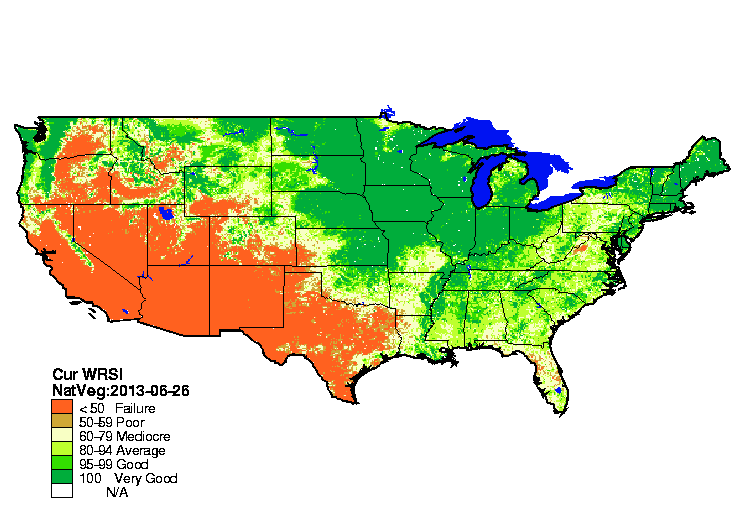
- the USGS agro-hydrologic model (Soil Water Index, Water Requirement Satisfaction Index);
Hydrological:
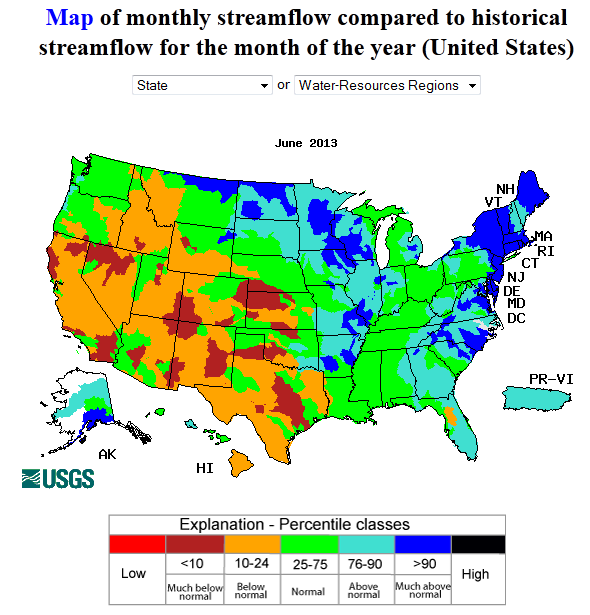
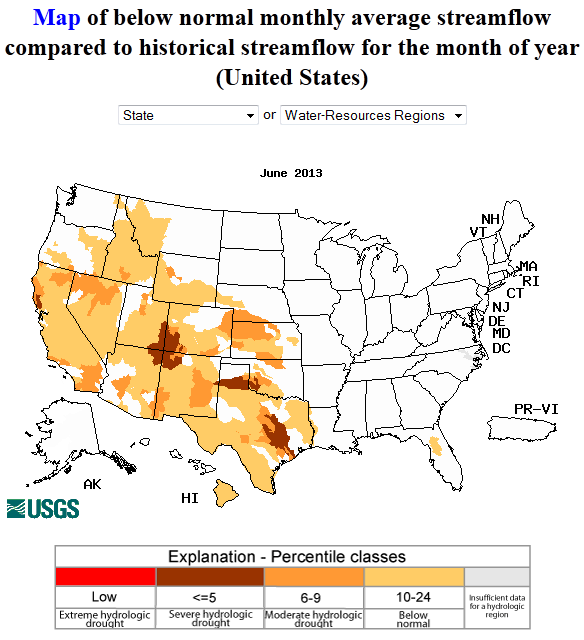
Map showing NOAA NLDAS model streamflow percentiles.
- USGS (U.S. Geological Survey) observed streamflow percentiles (just those basins below average);
- VIC 1-, 2-, 3-, and 6-month runoff percentiles;
- NLDAS model runoff anomalies and percentiles;
- NLDAS modeled streamflow anomalies and percentiles;
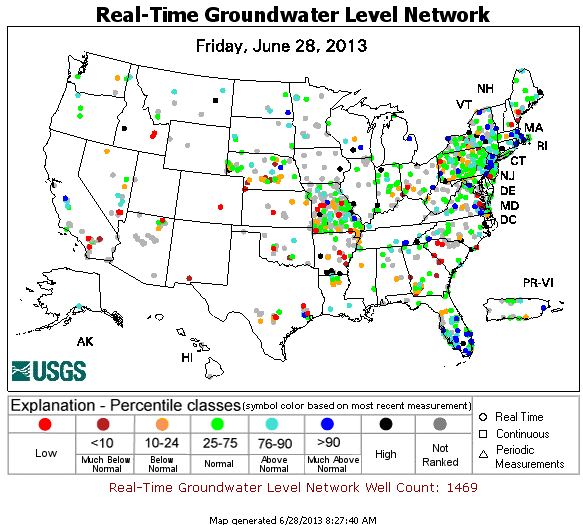
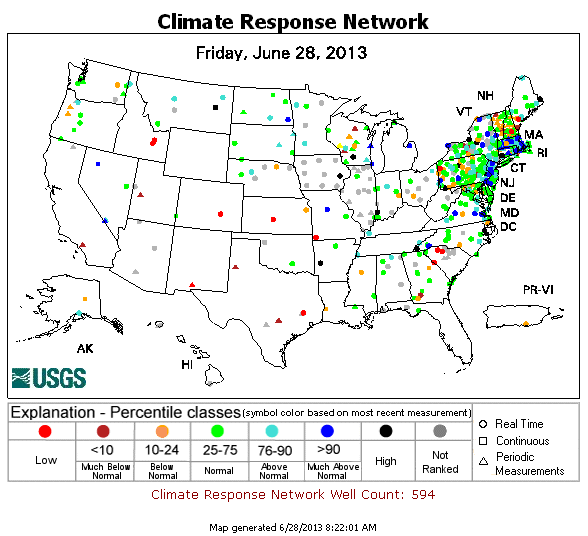
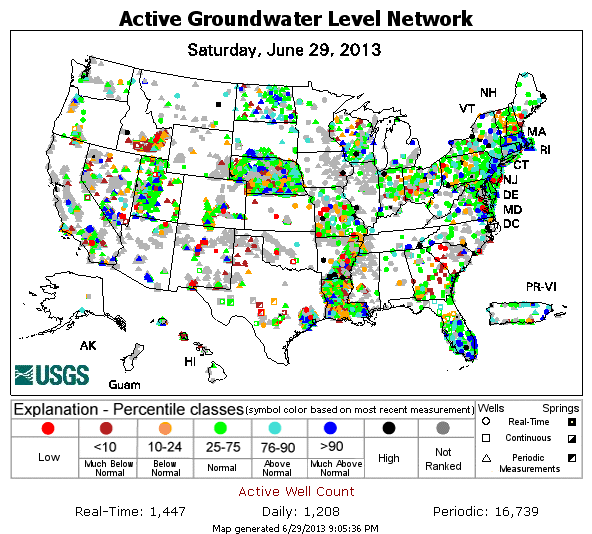
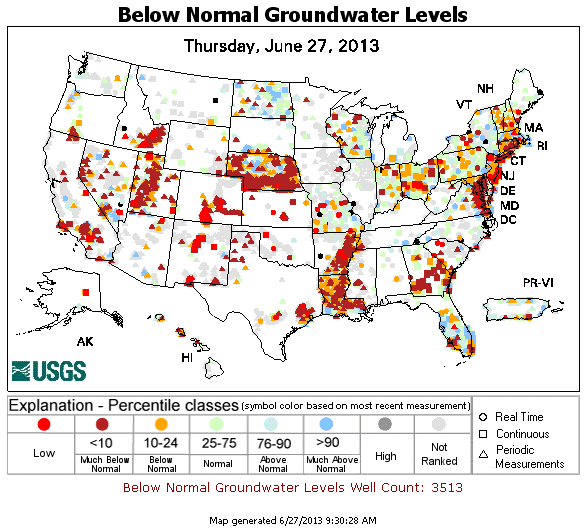
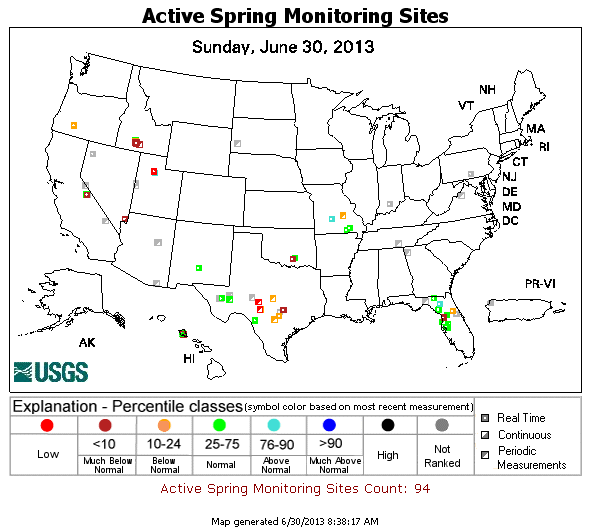
- USGS groundwater observations (real-time network, climate response network, total active network, just the below-normal observations) and spring water observations;
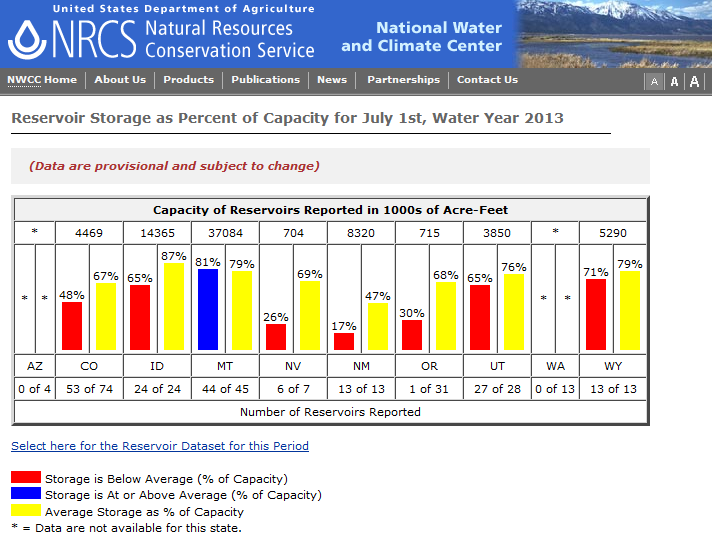
- USDA statewide reservoir storage as percent of capacity;
Meteorological:
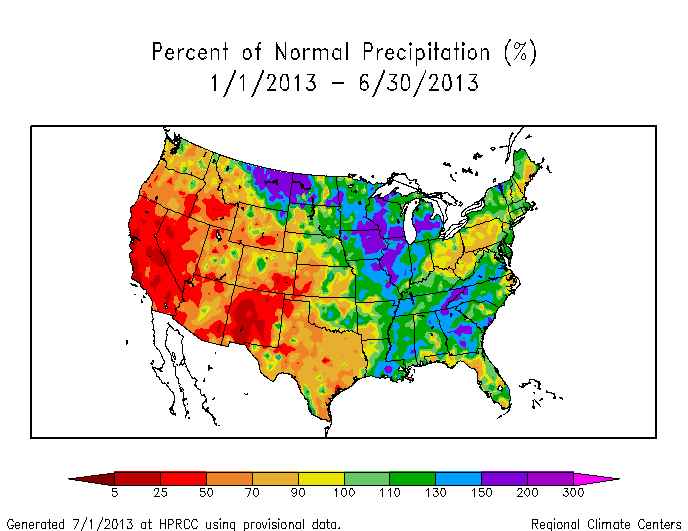
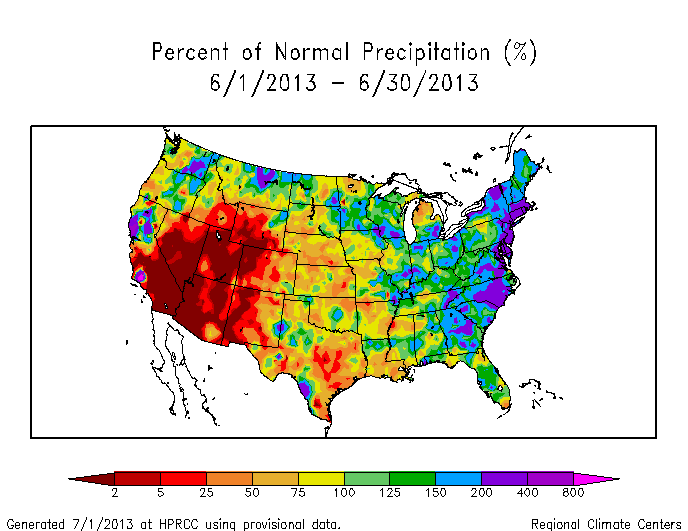
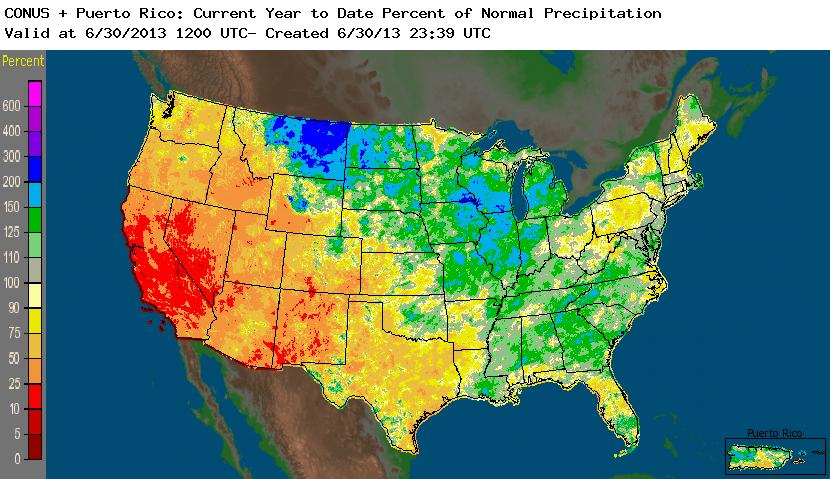
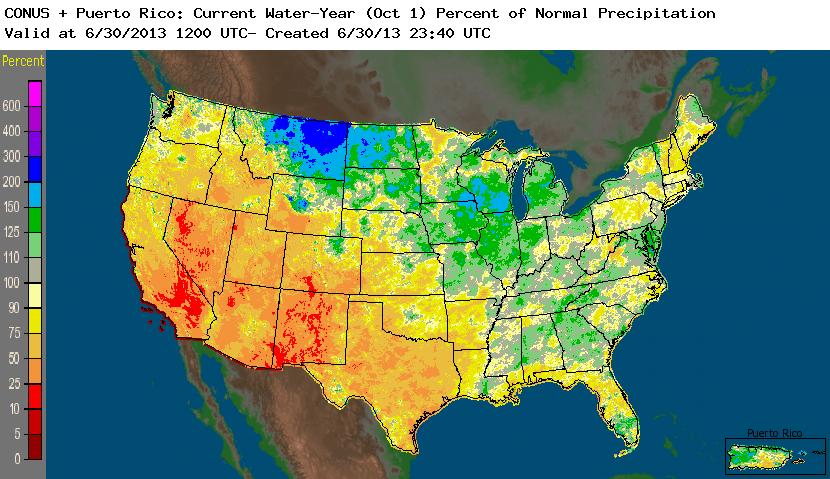
Map showing year-to-date percent of normal precipitation.
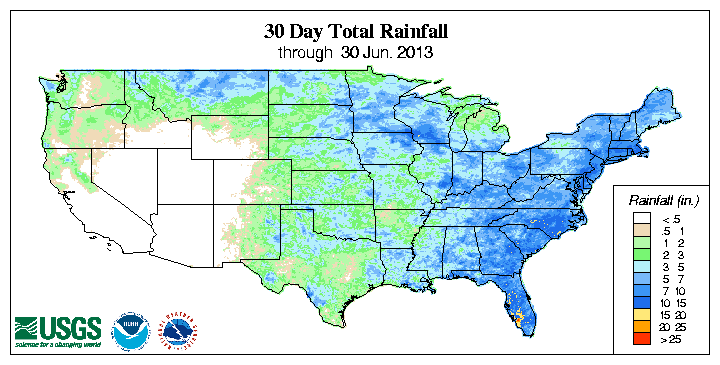
- monthly total precipitation (plotted by the USGS, NOAA National Weather Service [NWS], and NOAA High Plains Regional Climate Center [HPRCC]);
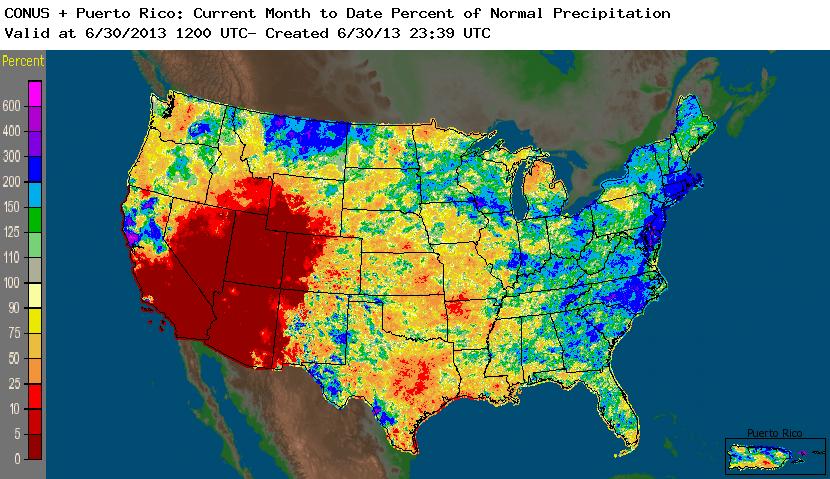
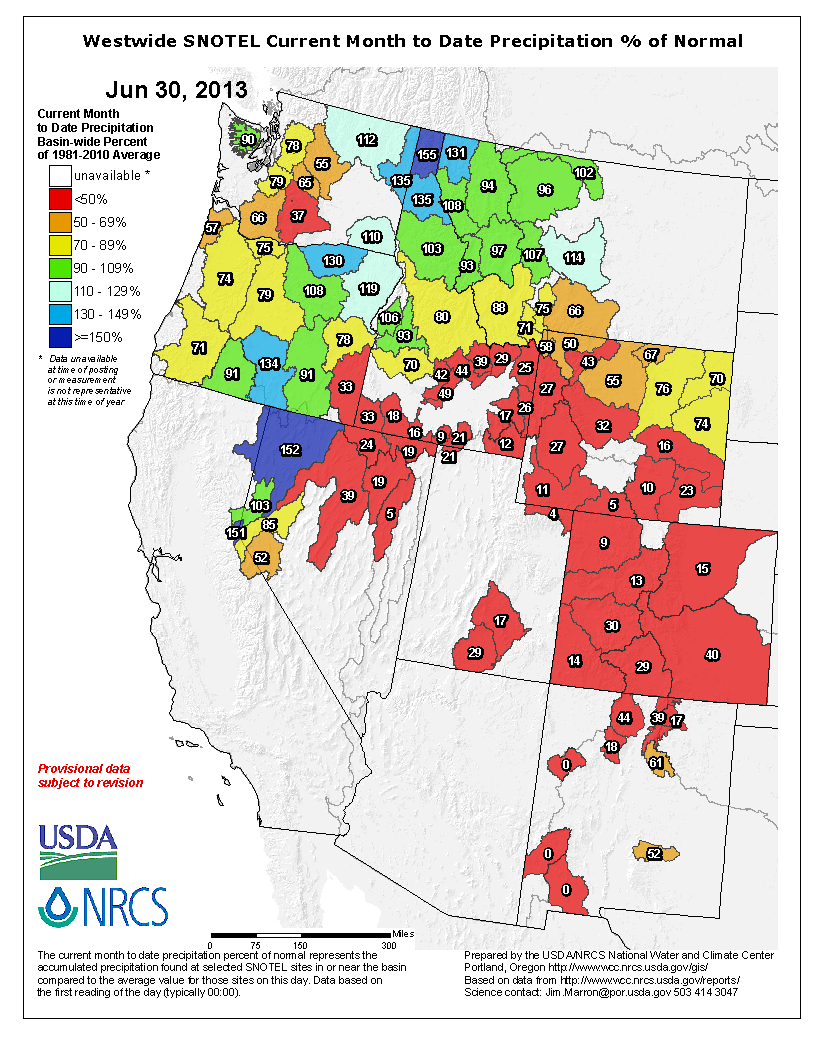
- monthly percent of normal precipitation and precipitation percentiles (NWS, HPRCC station observations, West SNOTEL and ACIS stations, West basins, Alaska SNOTEL stations, Leaky Bucket model, CPC) and precipitation anomalies (CPC);
- NCDC monthly statewide precipitation ranks;
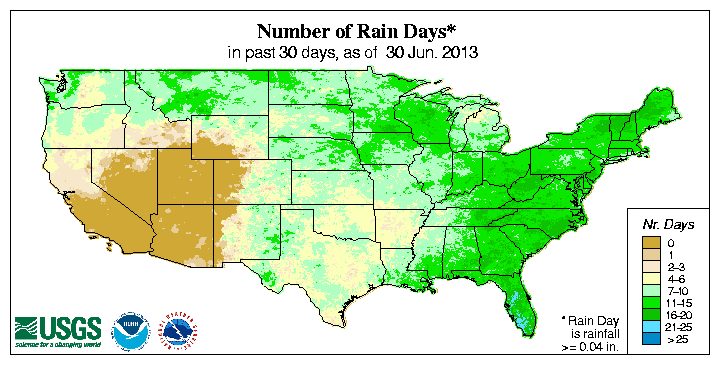
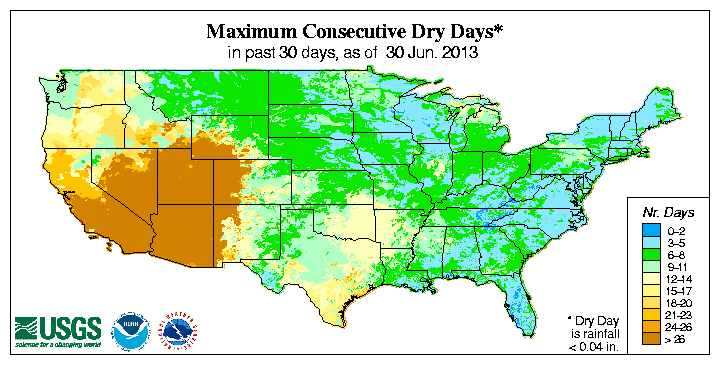
- USGS 30-day number of days with precipitation and maximum number of consecutive dry days;
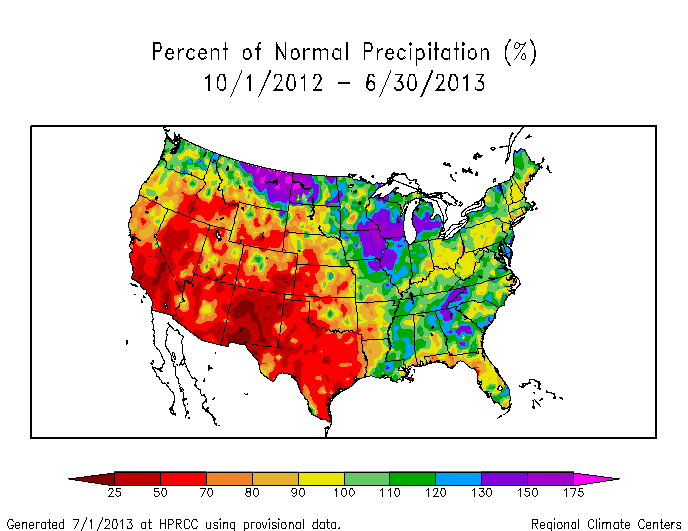
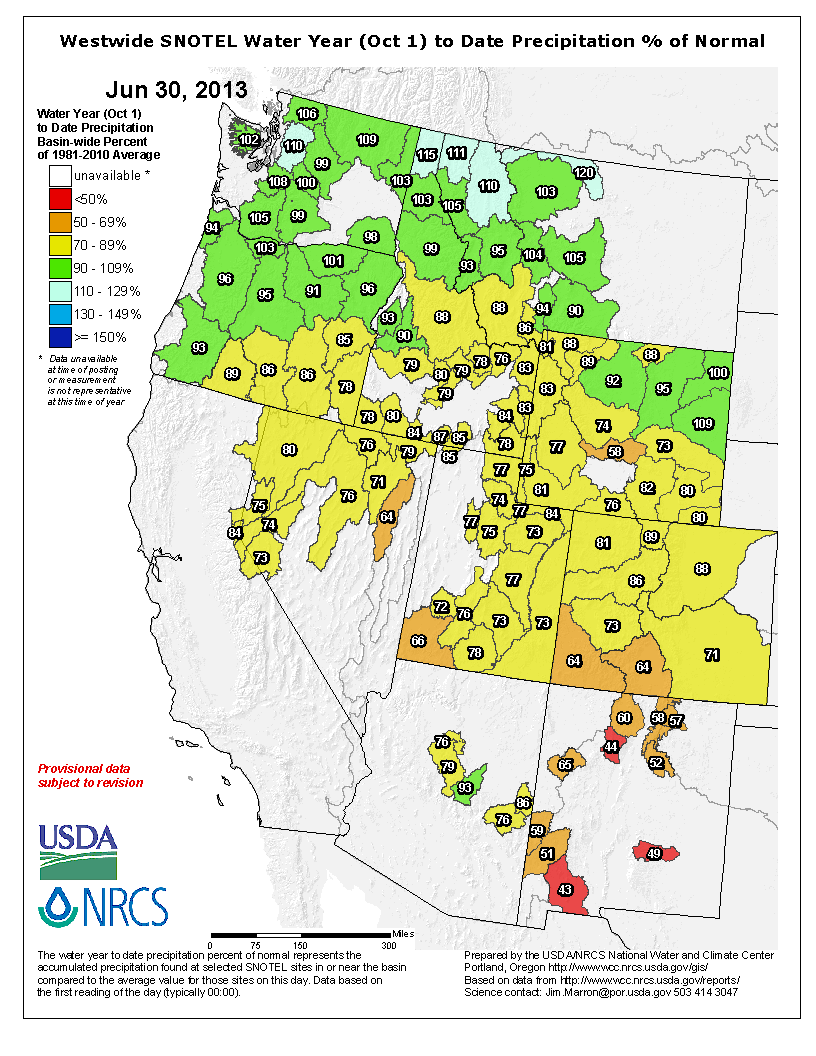
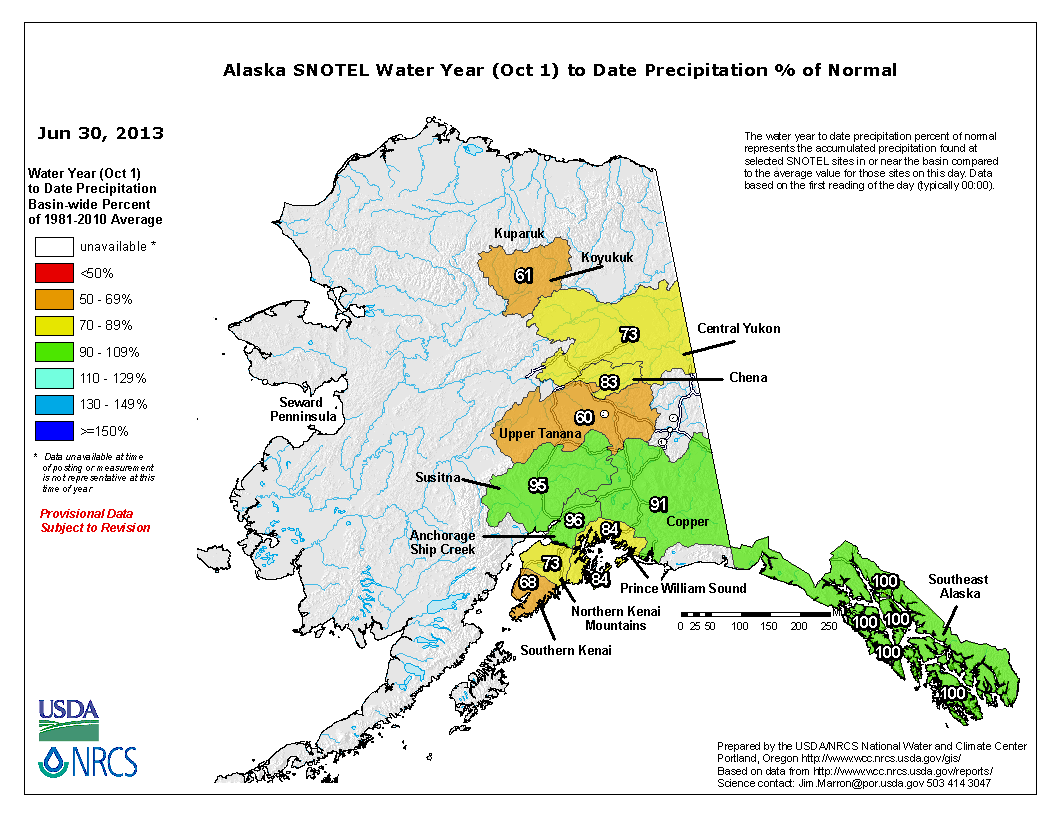
- water-year-to-date (October-present) percent of normal precipitation (NWS, HPRCC station observations, West basins, Alaska stations, Alaska basins), percent of average (West basins), and precipitation percentiles (West SNOTEL stations);
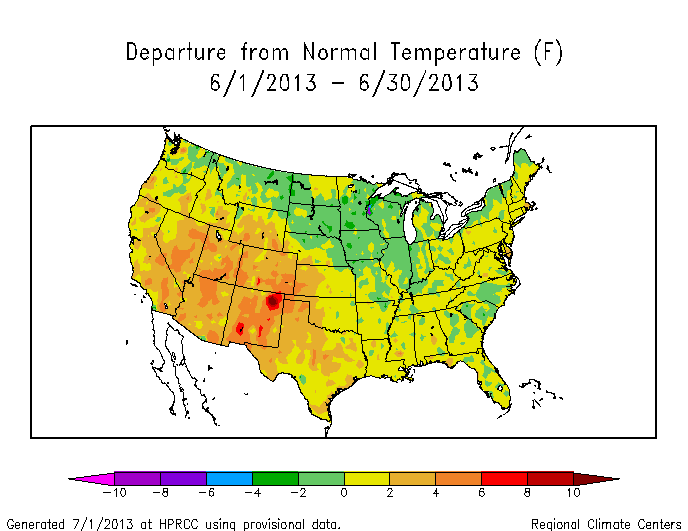
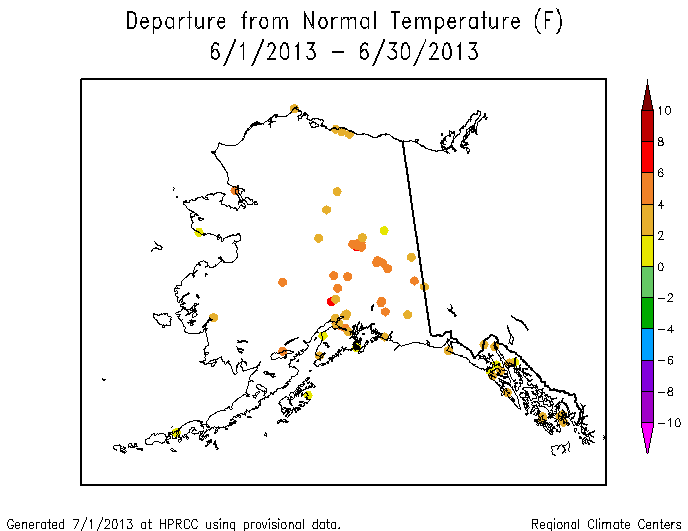
- monthly temperature departures from normal (CPC, HPRCC) and temperature percentiles (CPC, Leaky Bucket);
- NCDC monthly standardized temperature departures and statewide temperature ranks; and
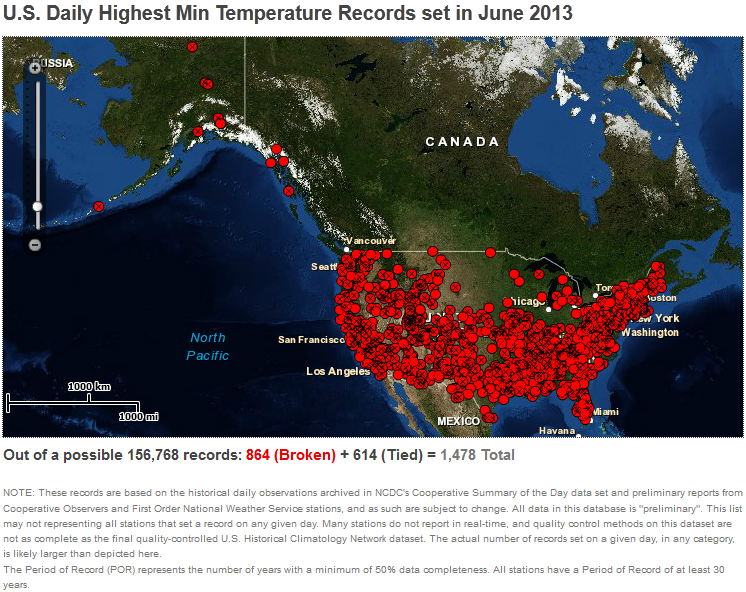
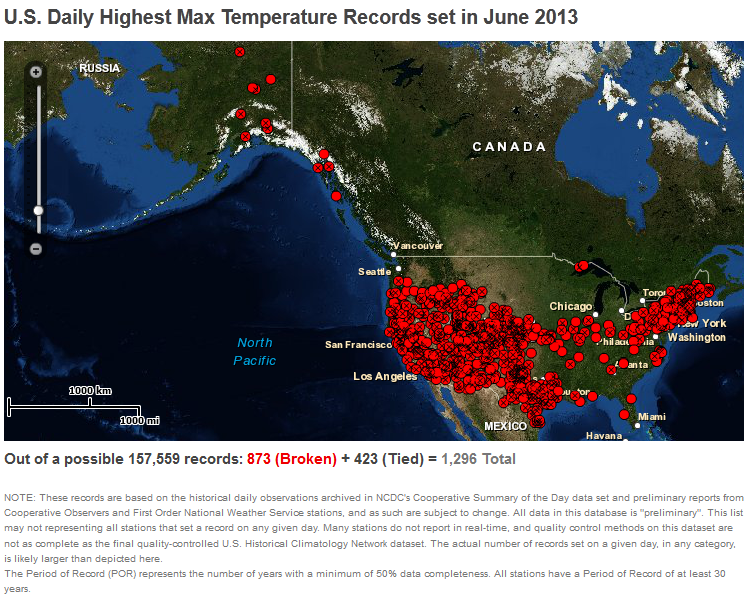
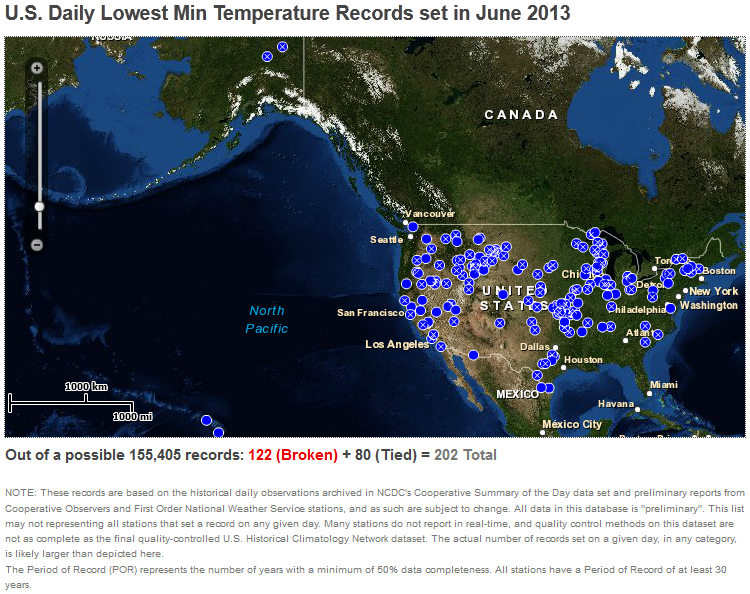
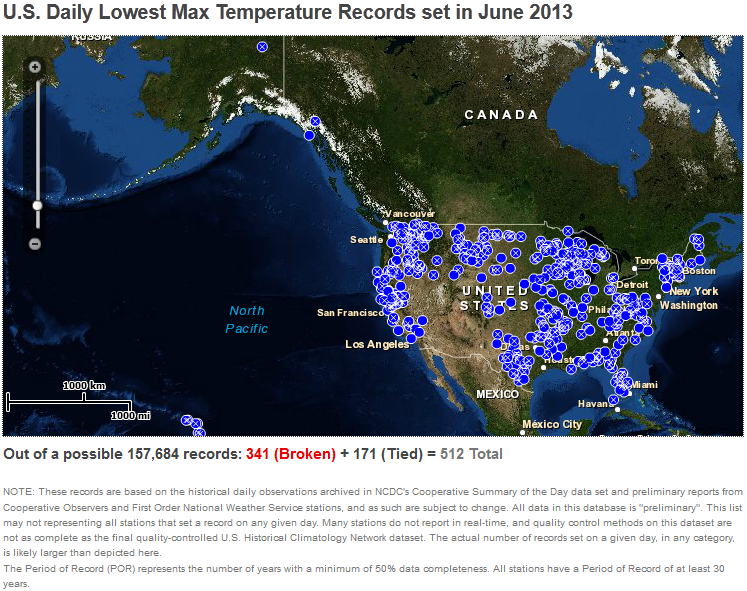
- number of record warm daily low temperatures, record daily high temperatures, record daily low temperatures, and record cool daily high temperatures, set during the month (from NCDC's daily records analysis) — almost four times as many record warm high and low temperatures occurred as record cool highs and lows.
![NOAA National Weather Service [NWS]](/monitoring-content/sotc/drought/2013/06/noaa-nws-ahps-pcp-amt-us-mtd-0630.jpg)
![NOAA High Plains Regional Climate Center [HPRCC]](/monitoring-content/sotc/drought/2013/06/noaa-hprcc-pcp-amt-us-1m-0630.png)
Regional Discussion
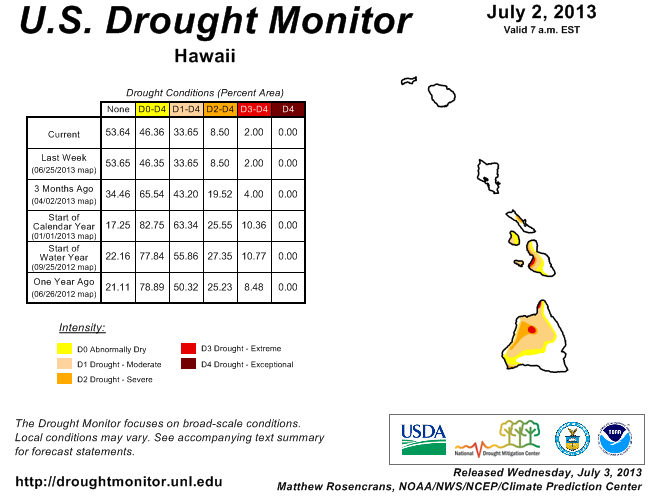
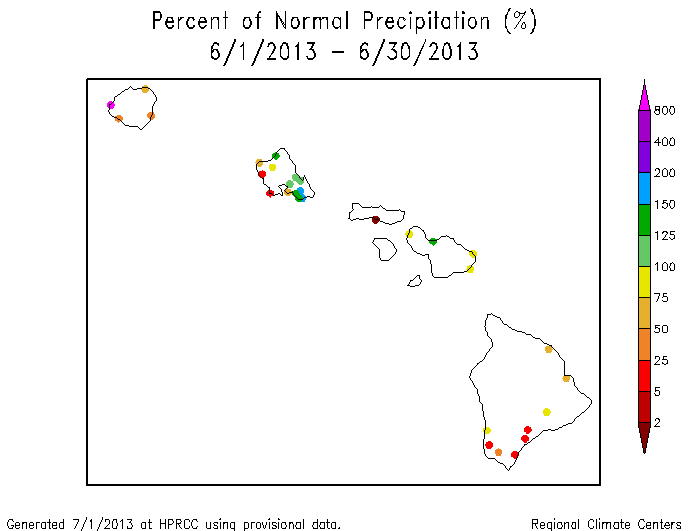
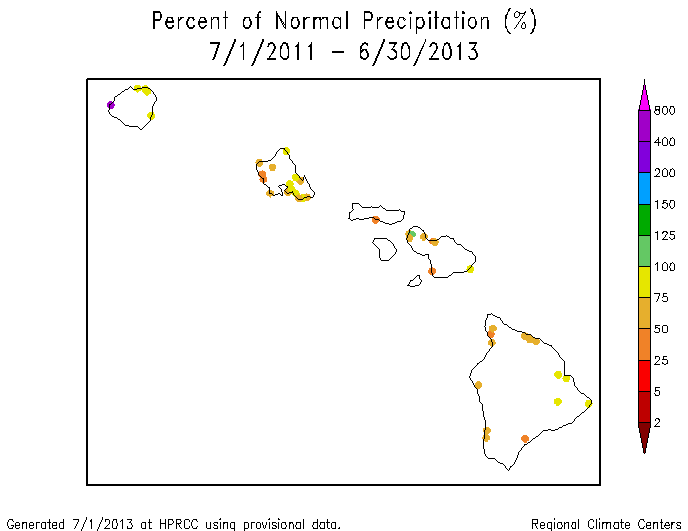
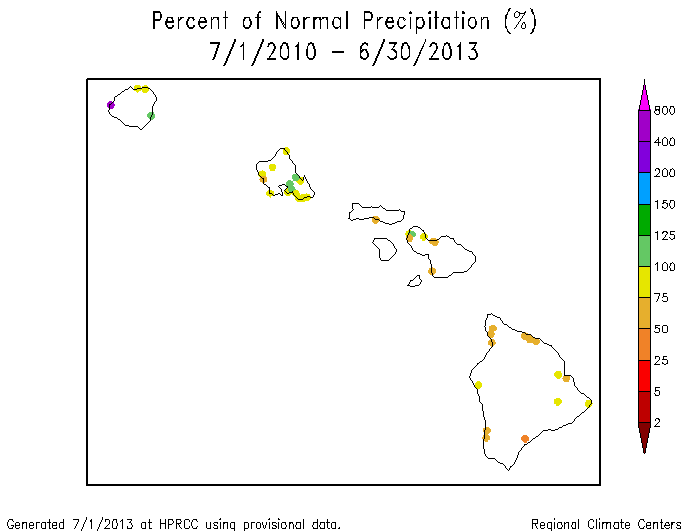
Hawaii: The Hawaiian Islands had a mixed pattern of rainfall during June 2013. The precipitation pattern for the last 2 months still reflected the beneficial rain from May, but dryness became evident at longer time scales (3 to 6 months for the southern islands, and the last 9, 12, 24, and 36 months statewide). Streamflow on the Big Island averaged below normal for June. The percent of the state experiencing moderate to extreme drought this month (33.7 percent) was about the same as last month.
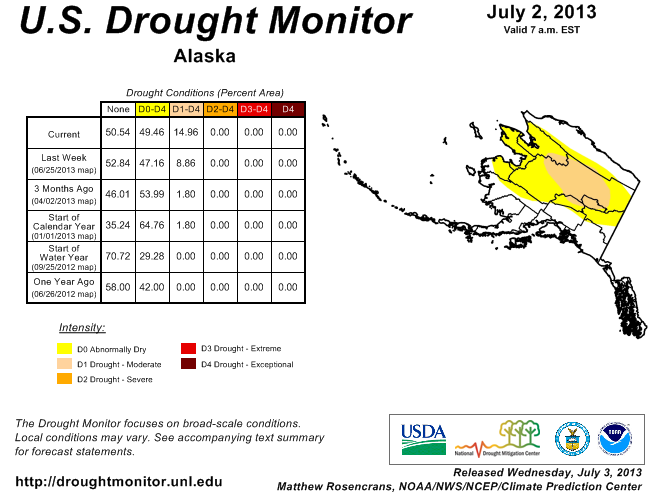
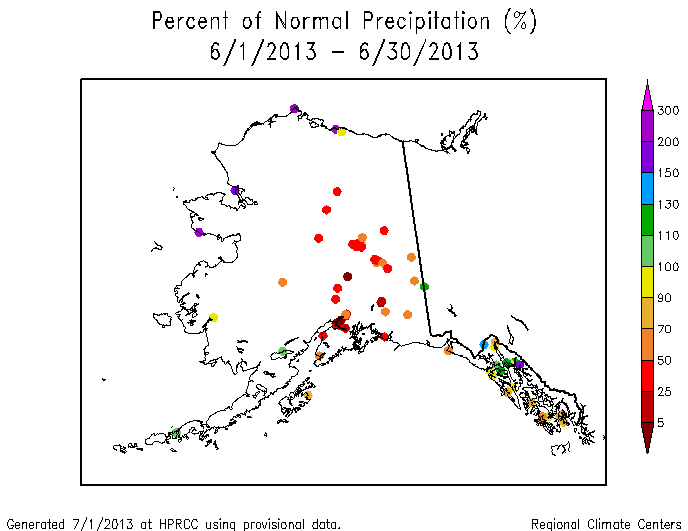
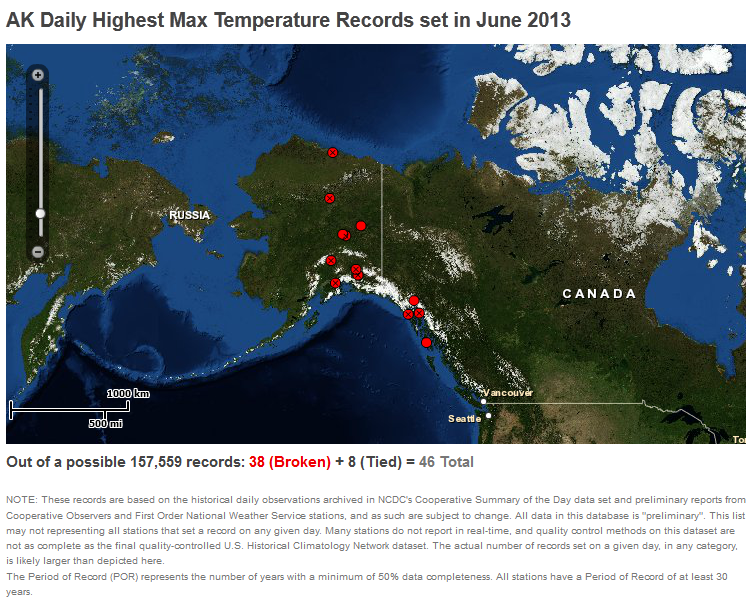
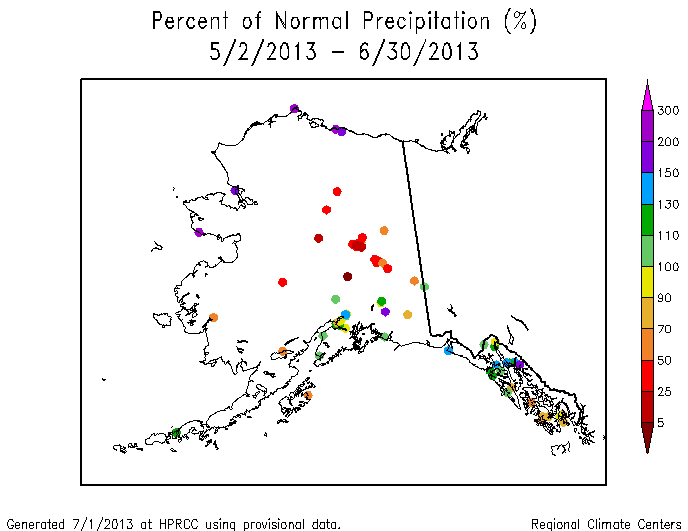
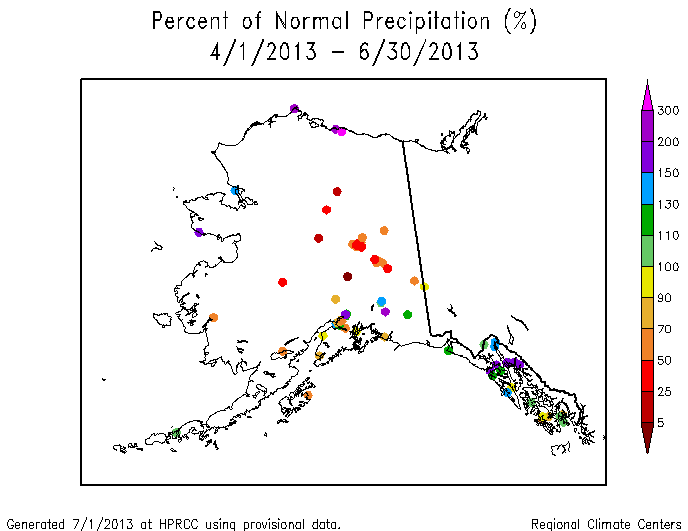
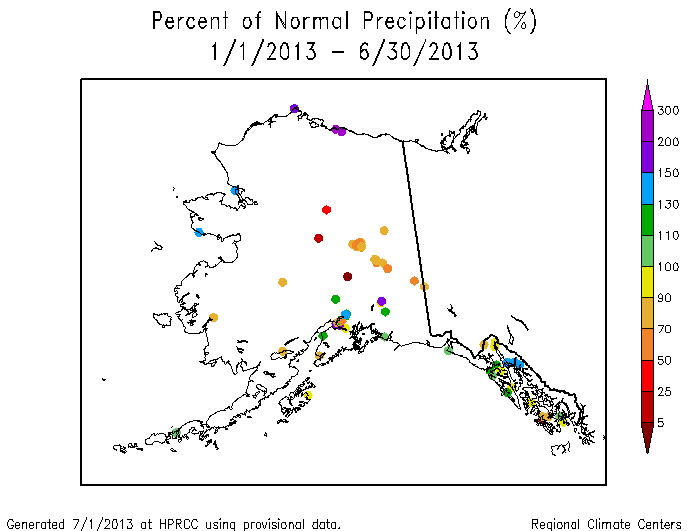
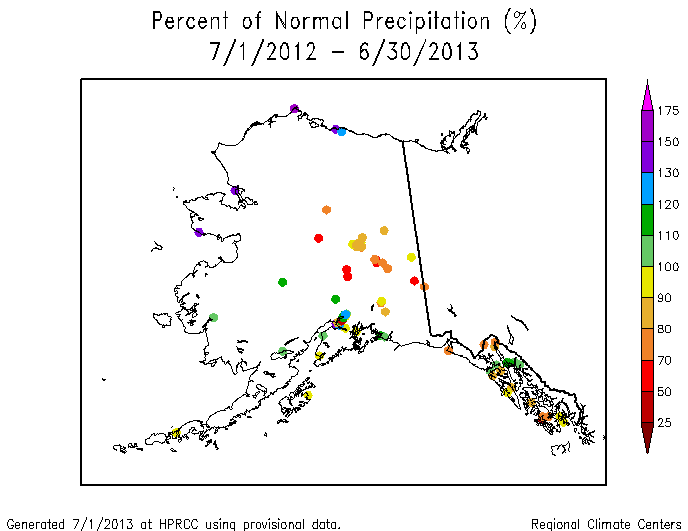
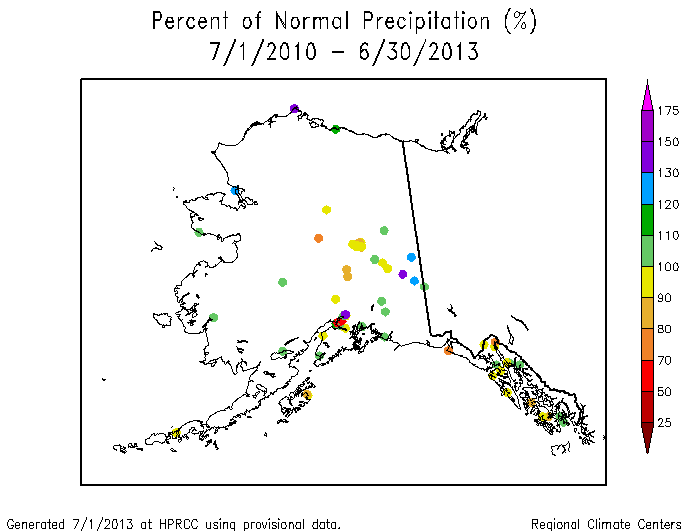
Alaska: Most of interior Alaska was much drier than normal during June. The dryness, coupled with record hot temperatures, set the stage for numerous wildfires, but the above-normal temperatures also enhanced melting of the remaining snowpack, resulting in above-normal streamflow. The pattern of interior dryness is evident at intermediate time scales (the last 2, 3, 6, 9, and 12 months), but the pattern becomes mixed at the 24- and 36-month time scales. Abnormal dryness covered about half of the state on the USDM map with moderate drought expanding to cover about 15 percent of the state's interior.
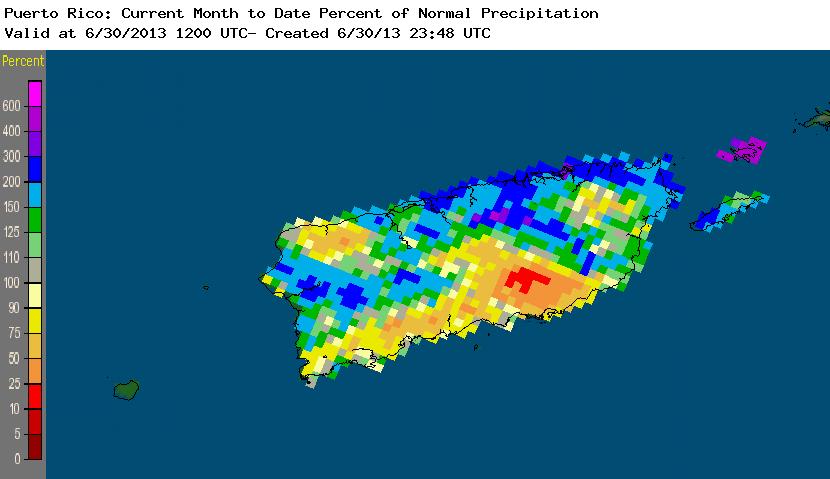
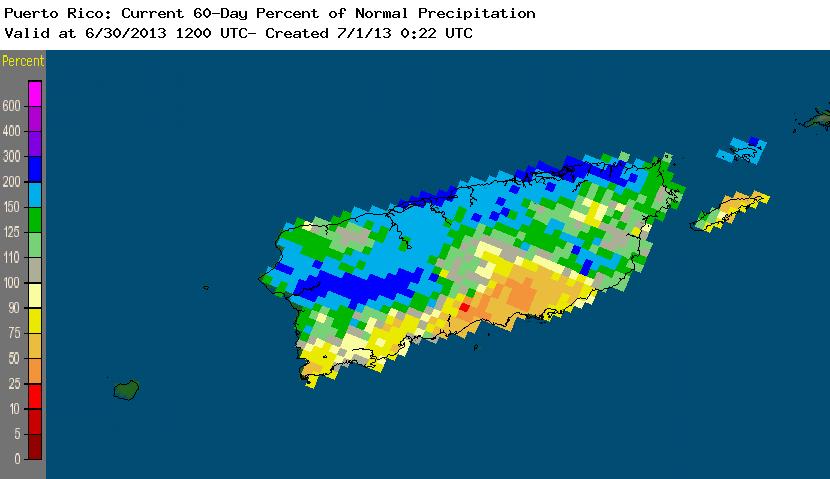
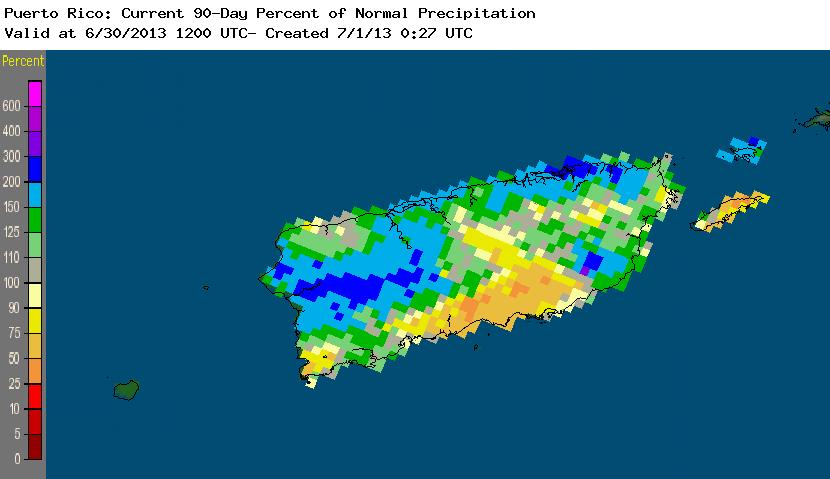
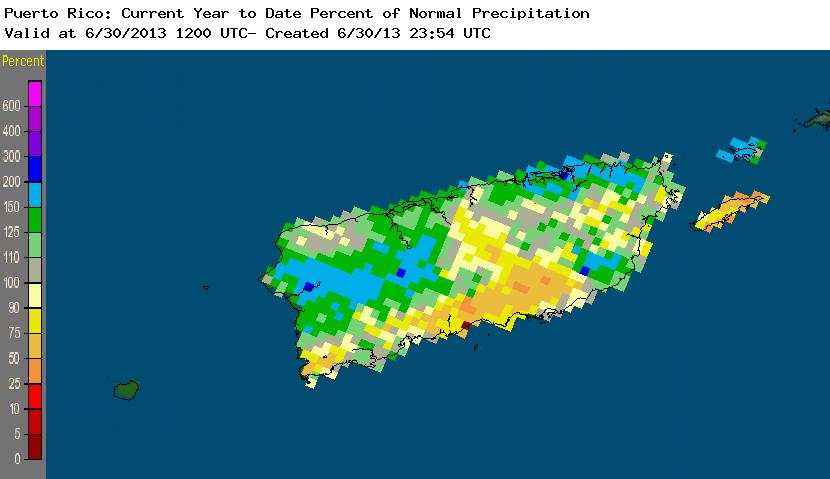
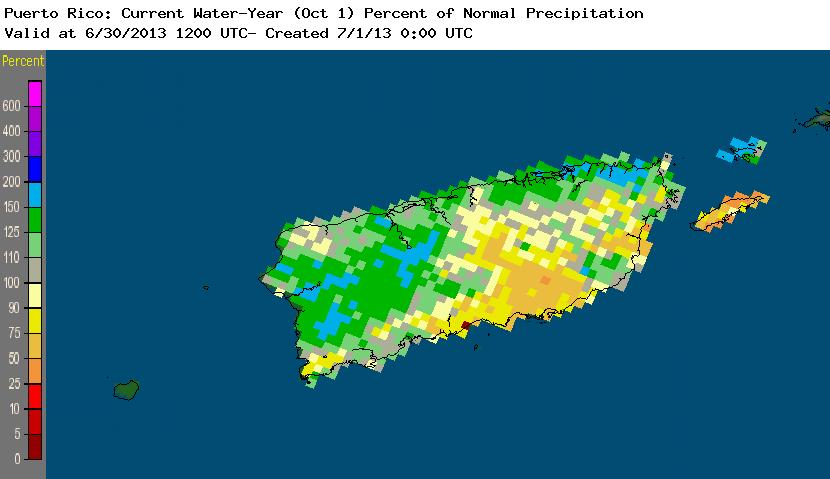
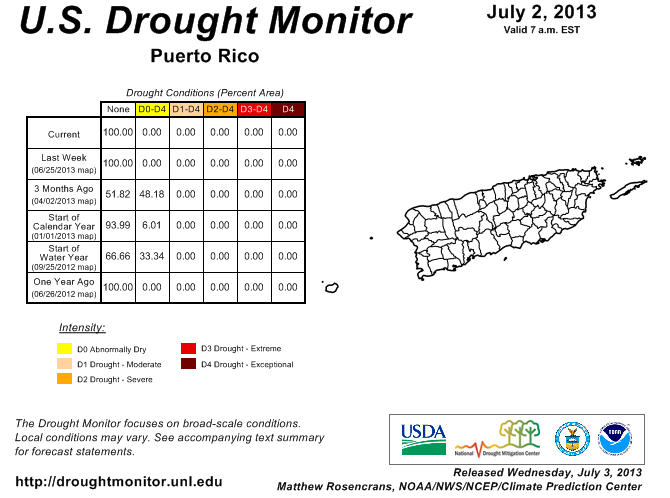
Puerto Rico: Above-normal precipitation fell over western and northern parts of Puerto Rico during June, with the south central coast drier than normal. This precipitation pattern was fairly consistent at longer time scales (2, 3, 6, and 9 months). Streamflow averaged above normal and there was no drought or abnormal dryness on the USDM map.
 |
|
The June precipitation anomaly pattern was characteristic of the pattern expected from an atmospheric circulation consisting of a dry ridge in the west and a wet trough in the east. On a statewide basis, June 2013 was dominated by wet conditions in the East Coast and Midwest states, with unusual dryness centered in the Four Corners area. Four states (Arizona, Colorado, Utah, and Wyoming) had a top ten dry June with Utah turning in the driest June in the 1895-2013 record. Four other states in the West and Central Plains ranked in the driest third of the historical record. Dryness for the last three months was centered in the West to Southern Plains, where nine states ranked in the driest third of the historical record — two of which (Arizona [fifth driest] and New Mexico [sixth driest]) had a top ten driest April-June.
|
|
At the six-month time scale, dryness was widespread across the West while wet conditions shifted to the Midwest and Southeast. January-June 2013 ranked in the top ten driest category for five states, including California which had the driest January-June on record. Five other states in the West and Southern Plains ranked in the driest third of the historical record. By contrast, four states in the Midwest (Iowa, Illinois, Michigan, and Wisconsin) had the wettest January-June in the 119-year record.
|
|
The last twelve months were the second driest July-June on record for New Mexico, third driest for Wyoming, and ranked in the top ten driest category for three other states (Nebraska [fourth driest], Colorado [seventh driest], and California [seventh driest]). An additional eight states in the West and Plains ranked in the driest third of the historical record.
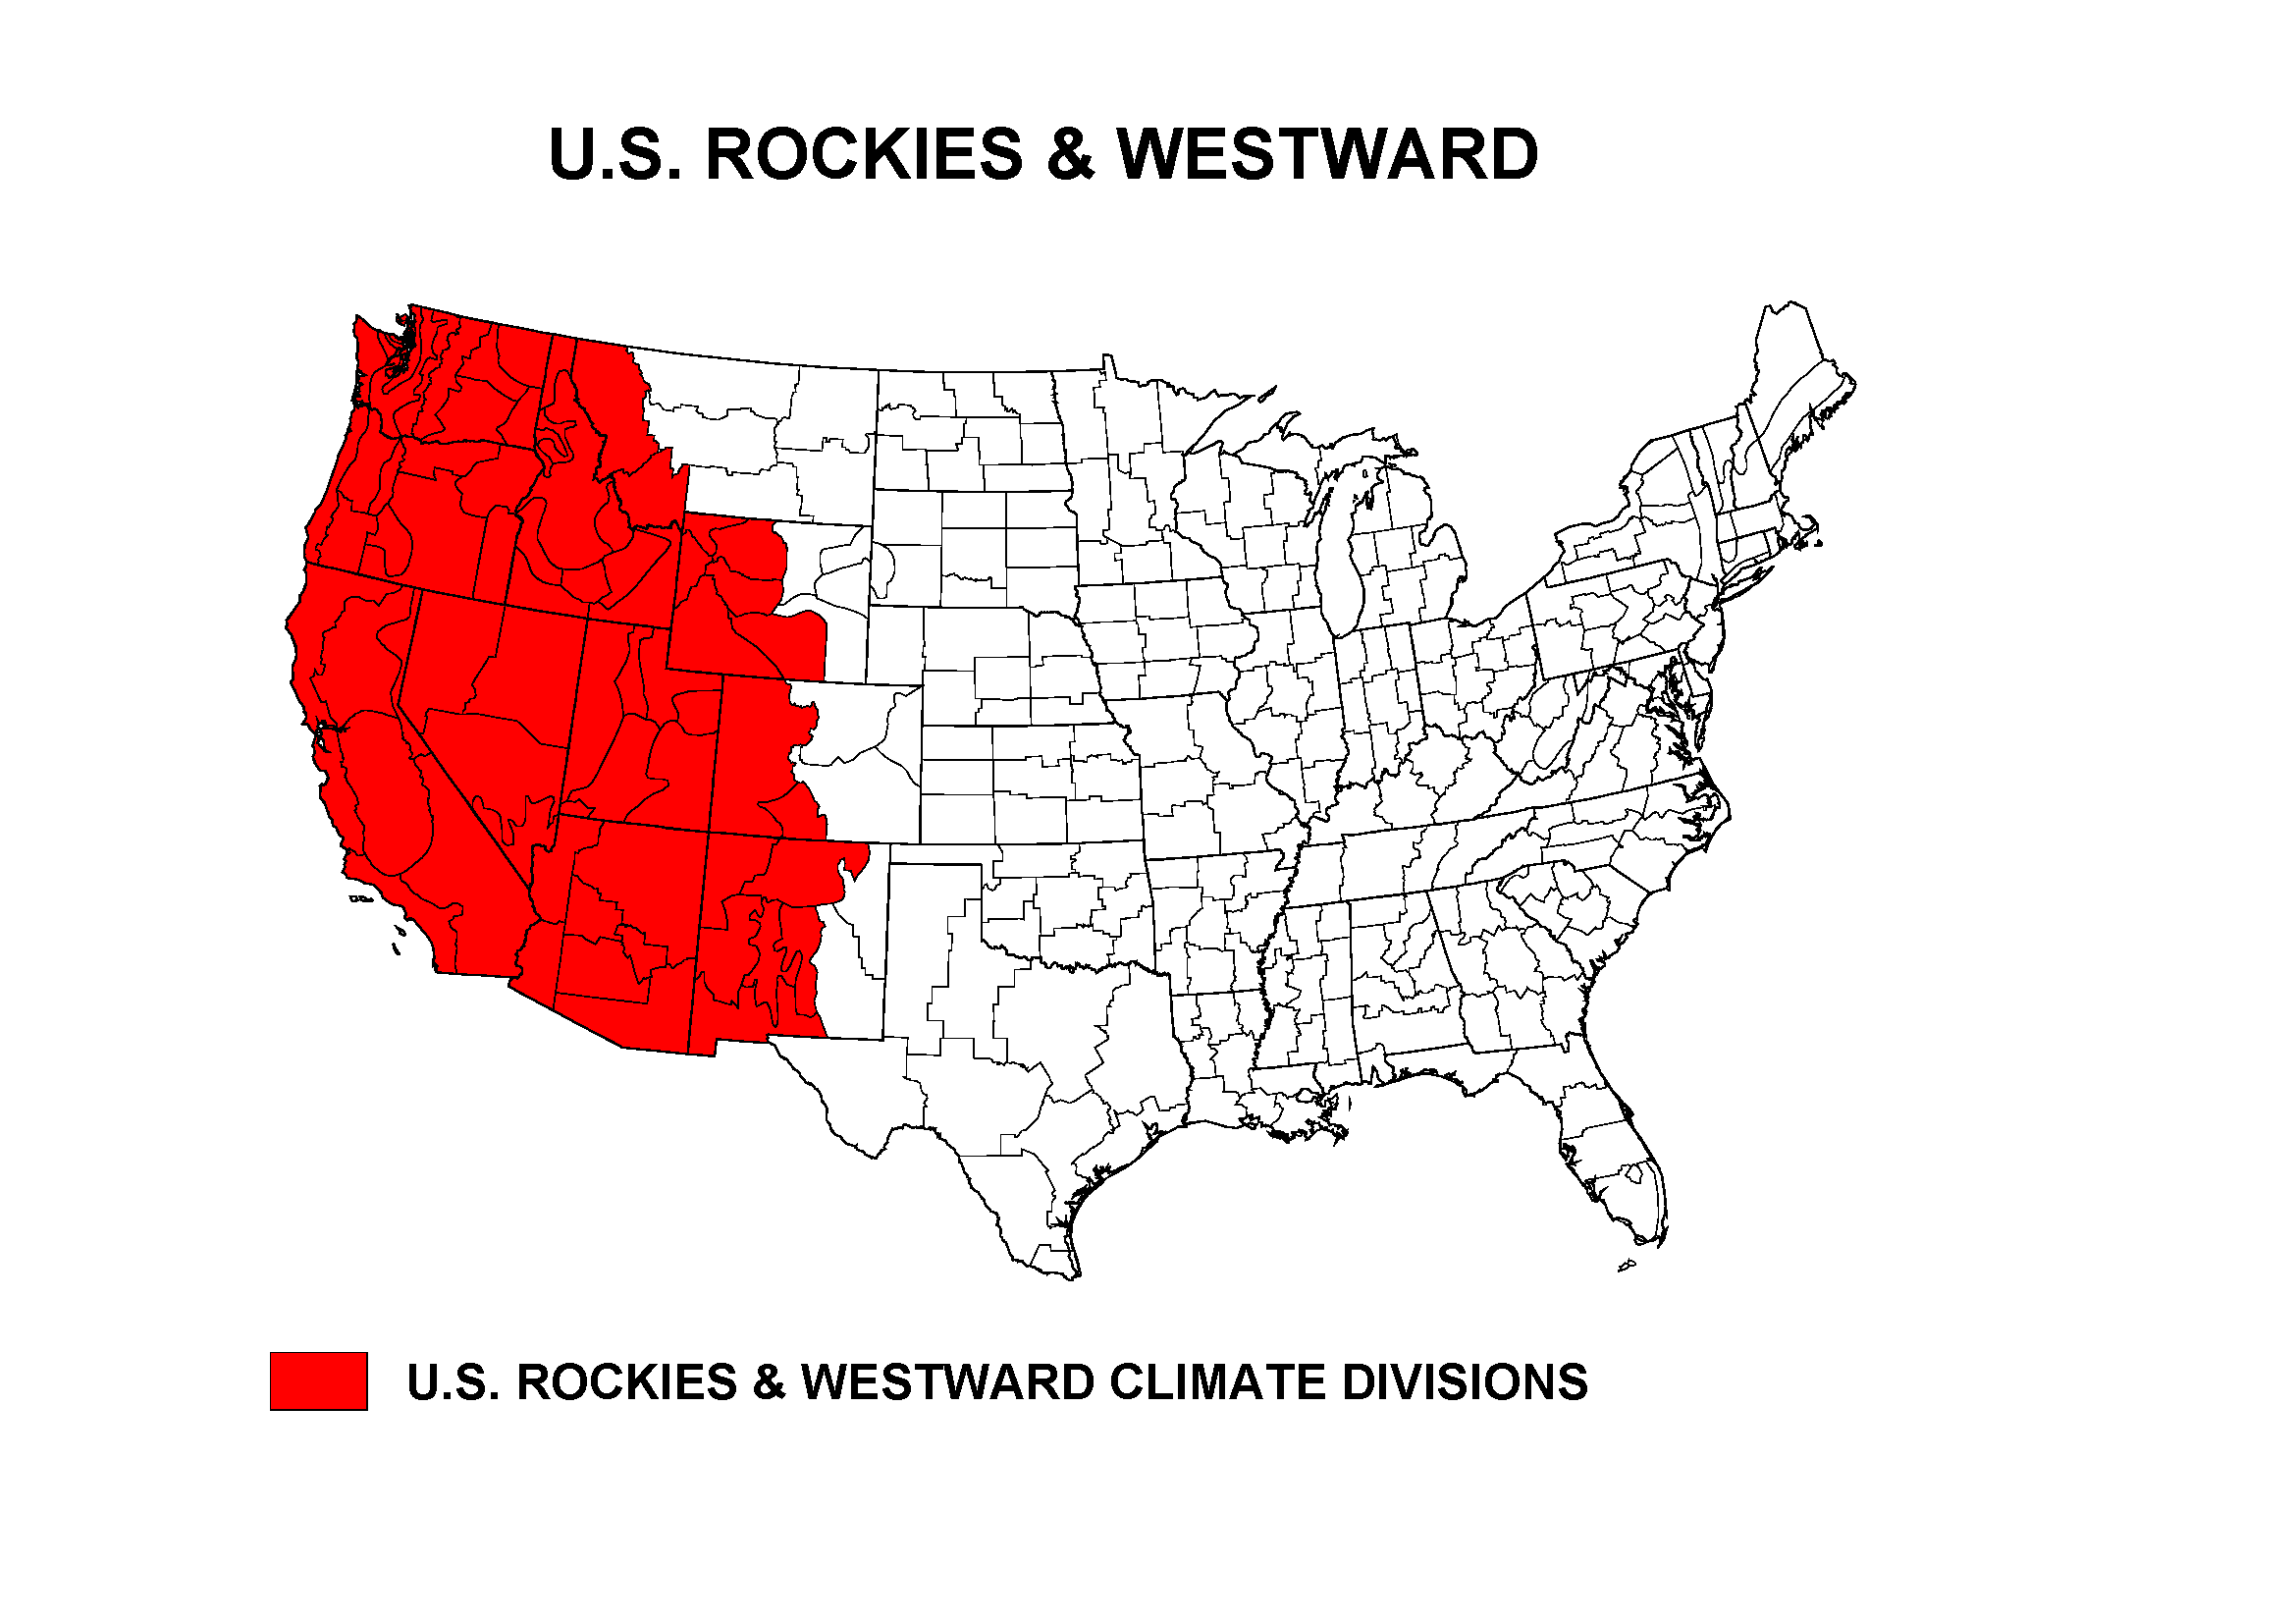
Percent area of the Western U.S. in moderate to extreme drought, January 1900 to present, based on the Palmer Drought Index.
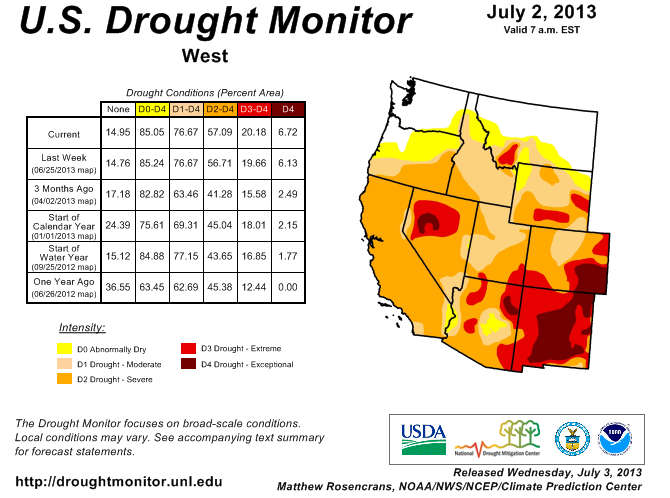
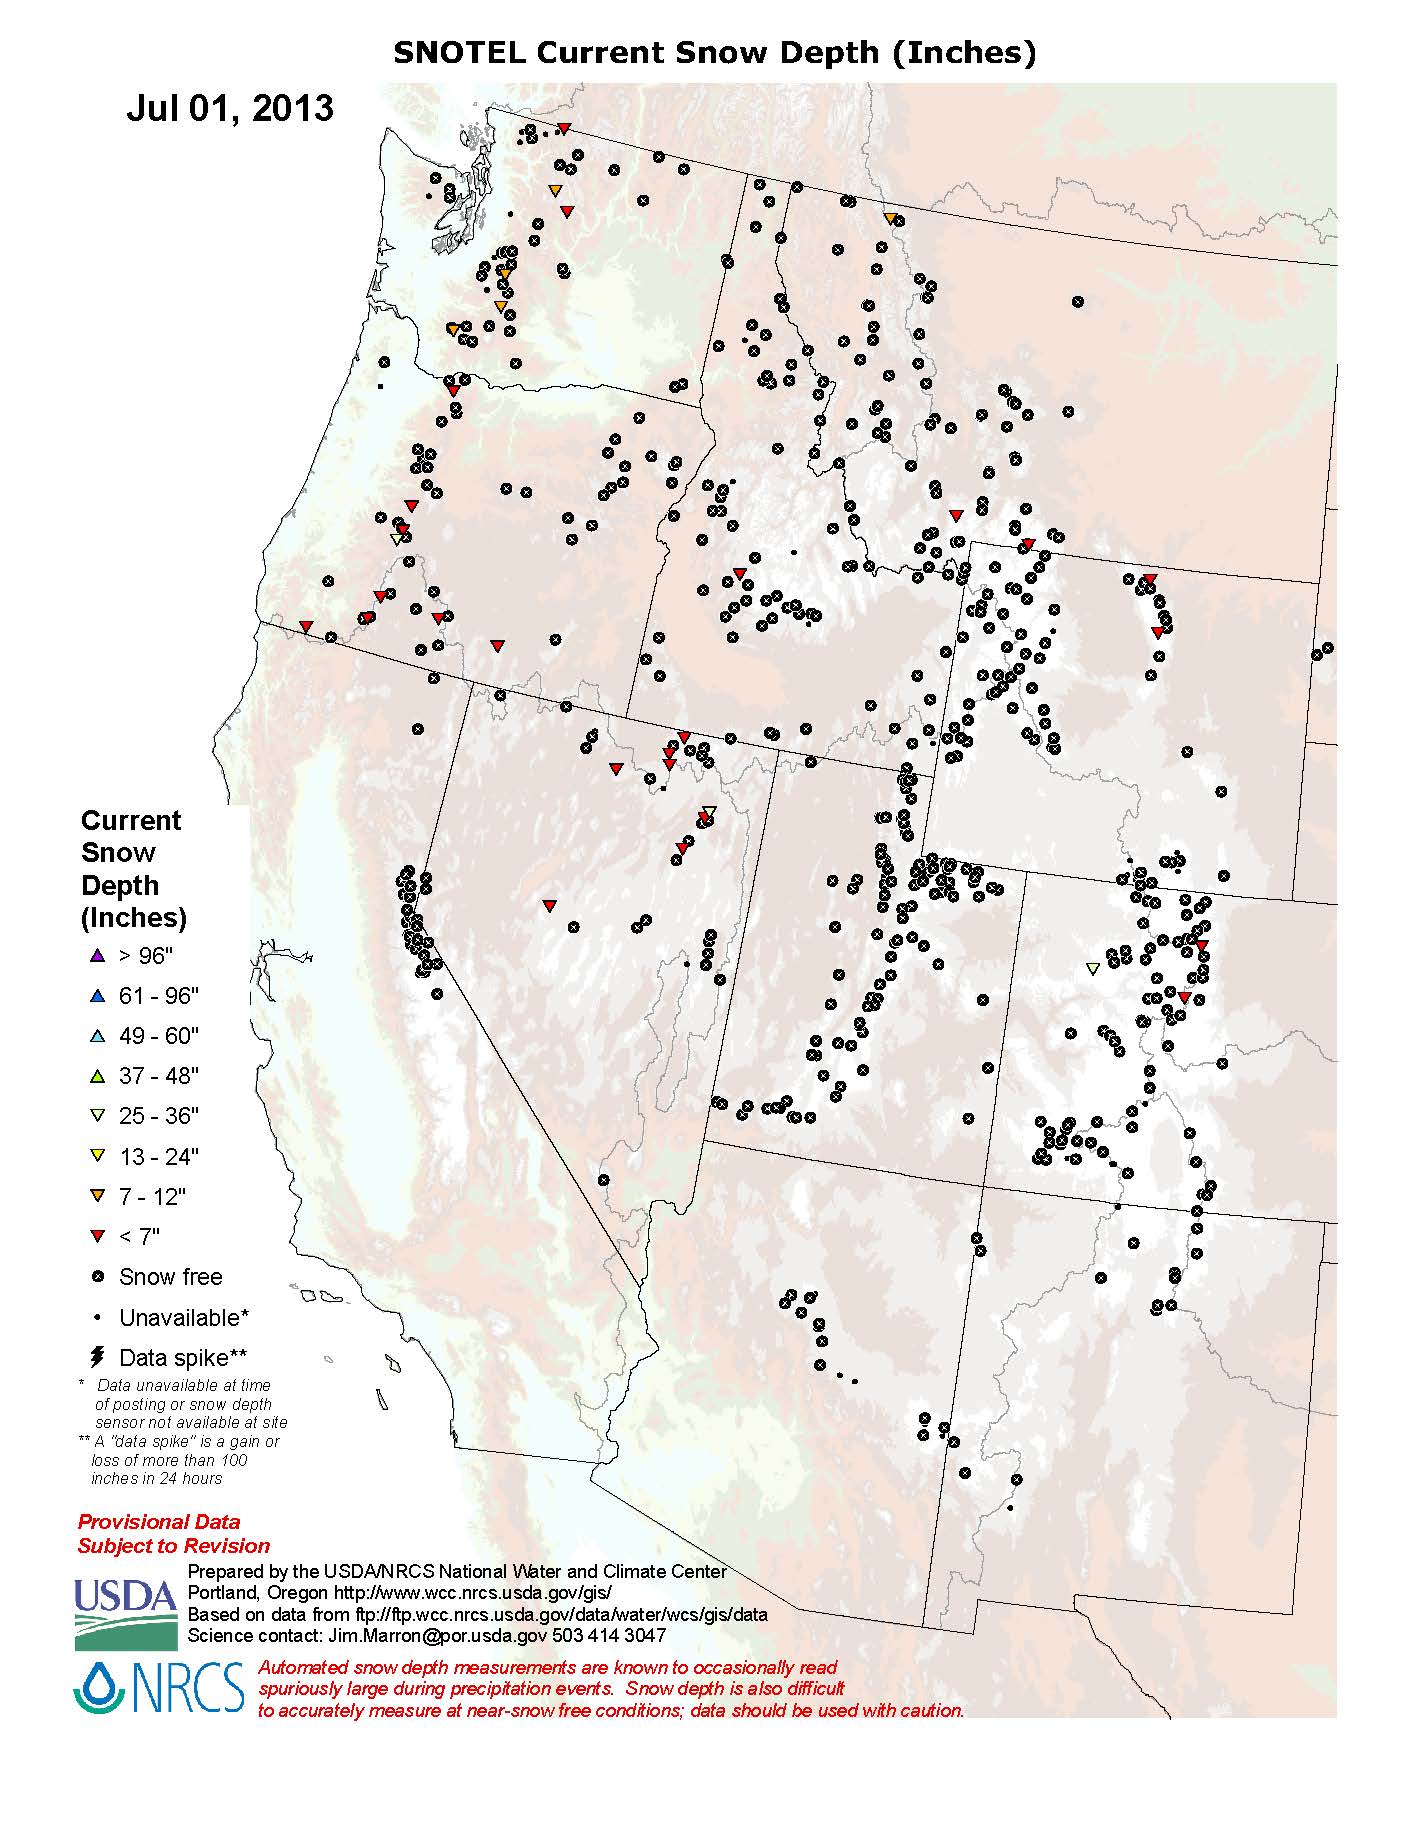
June 2013 was another drier-than-normal month for much of the West, especially the Southwest, with record dry conditions in places. Unusually hot temperatures exacerbated the drought conditions. The last six months have had record dry conditions, especially in California (as noted above). Water year-to-date (October-present) precipitation was below normal for much of the West, especially the southern portions. Only a few areas, primarily the northern basins, averaged near to above normal. This pattern is evident in both the high elevation (SNOTEL) station percentiles and basin averages, as well as in low elevation station observations and 9-month SPI. The western mountain snowpack has essentially all melted by the end of June. The lack of rain and depletion of source meltwater (from the mountain snowpack) were reflected in low streamflows for many western basins. Reservoir storage was near average in Montana but below average in most other states. Integrated satellite and ground observations of vegetation condition (VegDRI) and modeled vegetation condition (Soil Water Index, Water Requirement Satisfaction Index) indicated widespread stress on vegetation across the West, especially the Southwest. According to the USDM, 76.7 percent of the West was experiencing moderate to exceptional drought at the end of June, an increase over last month. The Palmer Drought Index percent area statistic was 75.5 percent, also an increase over last month. The Palmer Hydrological Drought Index (PHDI) is approaching record low values for some climate divisions in the West. For example, the June 2013 PHDI values for the Central Highlands (climate division 6) and Northern Mountains (division 2) in New Mexico are nearly as severe as the worst values reached just last year and in 2011; the June 2013 value in the Arkansas Drainage Basin (climate division 1) in southeastern Colorado is approaching the worst value reached last year; and the June 2013 value in the Upper Platte Basin (climate division 10) of Wyoming is near the worst value reached in 2006.
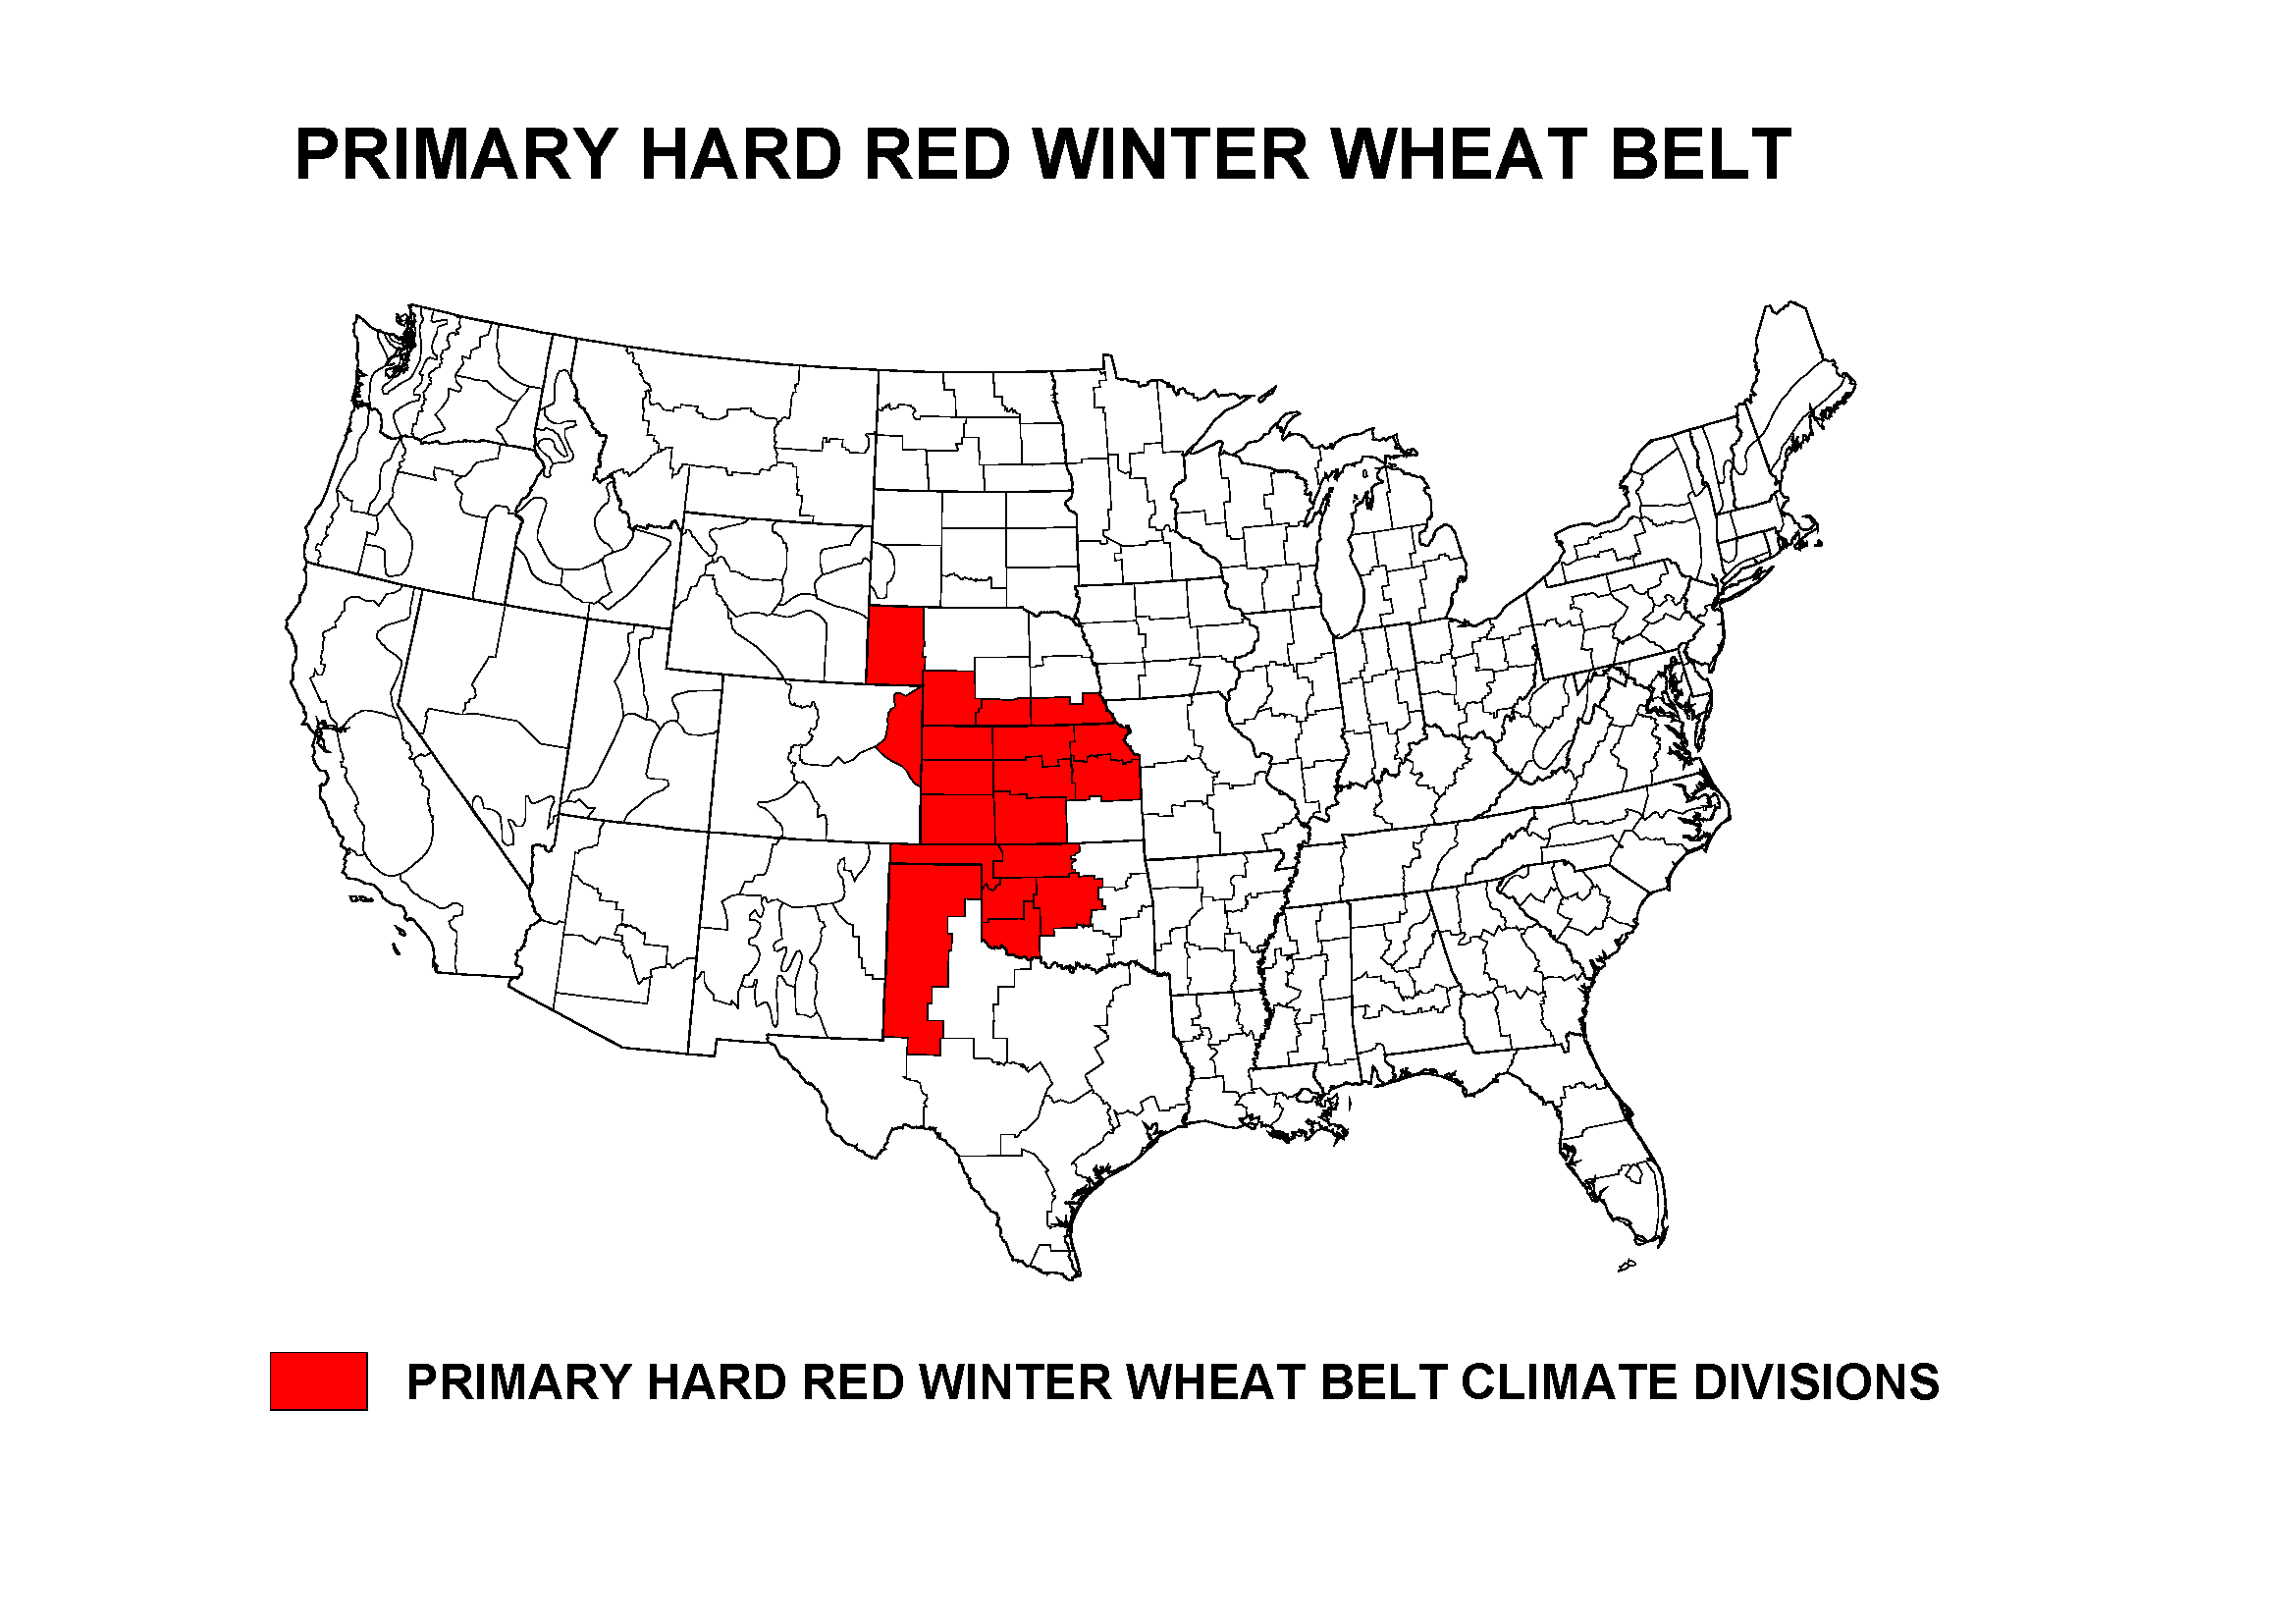
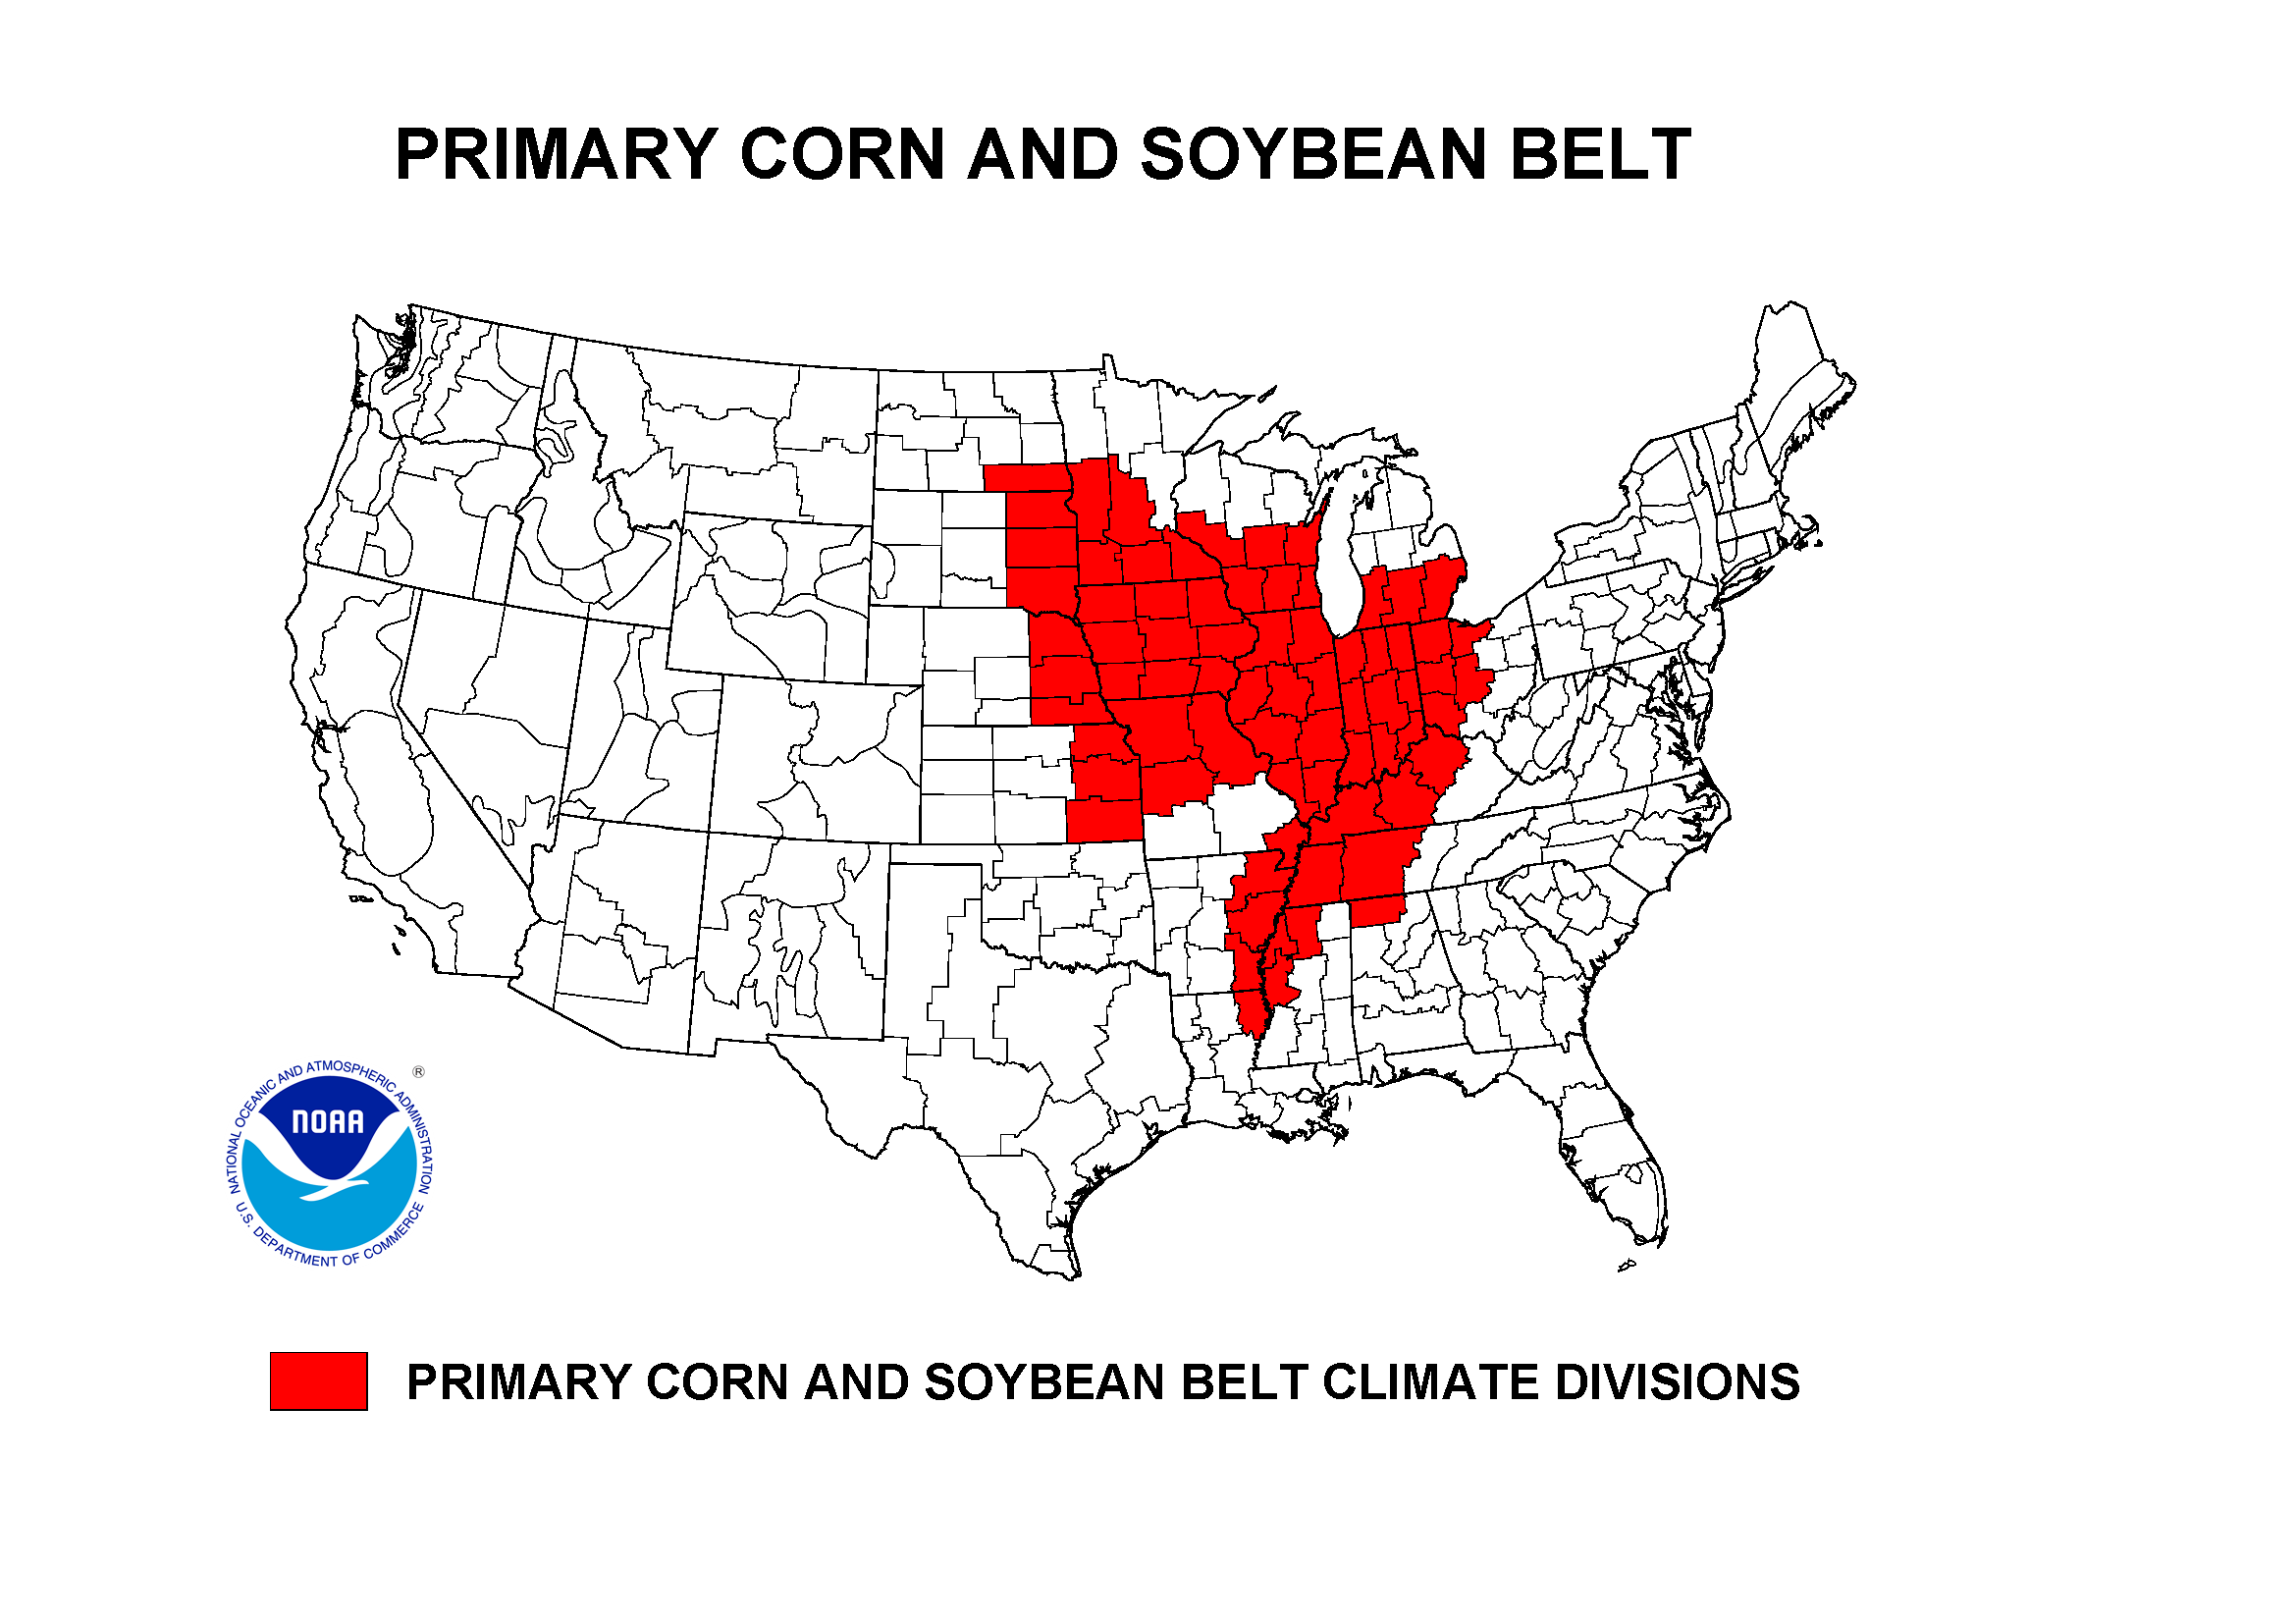
Wheat, Corn, and Soybean Agricultural Belts
|
 |
The Primary Hard Red Winter Wheat agricultural belt generally received below-normal precipitation during June 2013, with the month ranking as the 41st driest and 27th warmest June in the 1895-2013 record, regionwide. Since the start of the growing season (October-June), the region ranked 24th driest and 53rd warmest.
The Primary Corn and Soybean agricultural belt was drier than normal in the western sections but wet in the east this month. For the region as a whole, June 2013 ranked as the 21st wettest and 54th coolest June in the 1895-2013 record. For the growing season thus far (March-June), the region ranked third wettest and tenth coolest. But when just the last three months are examined, April-June 2013 ranks as the wettest and 30th coolest such three-month period.
NOAA Regional Climate Centers:
A more detailed drought discussion, provided by the NOAA Regional Climate Centers and others, can be found below.
West — Pacific Islands
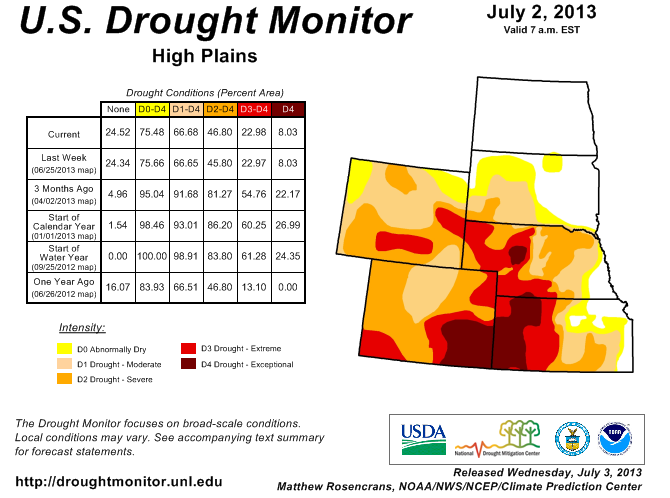
As described by the High Plains Regional Climate Center, June 2013 average temperatures were generally near normal in the east and above normal in the west across the High Plains region. The month was on the drier side in the region with most areas receiving less than 70 percent of normal precipitation. It was especially dry for most of Colorado and Wyoming which received less than 50 percent of normal precipitation and many locations in the western areas of those states received little to no precipitation. One such location was Rock Springs, Wyoming which tied with 2012 and 1956 for the driest June on record with only a trace amount of precipitation (period of record 1948-2013). There were some portions of the region which received ample precipitation including northwestern and southeastern North Dakota, northeastern Wyoming, and a few other scattered pockets. Hot, dry, and windy weather created dangerous fire conditions in Colorado. Several fires burned in Colorado; however two were of note -- the Black Forest Fire and the West Fork Complex Fire. According to InciWeb, the Black Forest Fire started on June 11th due to unknown causes. The fire, located northeast of Colorado Springs, spread quickly due to high winds and thousands of people had to evacuate from the area. Ultimately, this fire became the most destructive in Colorado history, in terms of structures burned, by burning over 500 homes. Just last year, the Waldo Canyon Fire had been deemed the most destructive with 346 homes destroyed. Another fire, the West Fork Complex Fire, consists of three fires which were started by lightning on June 5th. The fire is located in southern Colorado roughly between Durango and Alamosa. This area has steep, rugged terrain and large amounts of beetle-killed trees. These factors created a dangerous situation for firefighters and by the end of June only 2% of the fire had been contained and over 92,000 acres had burned.
The changes in the USDM this month showed a general improvement in the east and persistence in the west. At the end of June, approximately 67 percent of the region was in moderate (D1) to exceptional (D4) drought, down from 73 percent at the end of May. Widespread, beneficial rains led to improvements across much of South Dakota, eastern Nebraska, eastern Kansas, and northern Wyoming. However, much of southern Wyoming and western Colorado had little to no precipitation and drought conditions persisted or worsened there. Colorado contended with high temperatures, little rainfall, and large wildfires and as of June 25th, 100 percent of the state was in the D1-D4 categories. Colorado was the only state in the region which did not have any improvements this month. The large D4 area in eastern Colorado and western Kansas persisted as well.
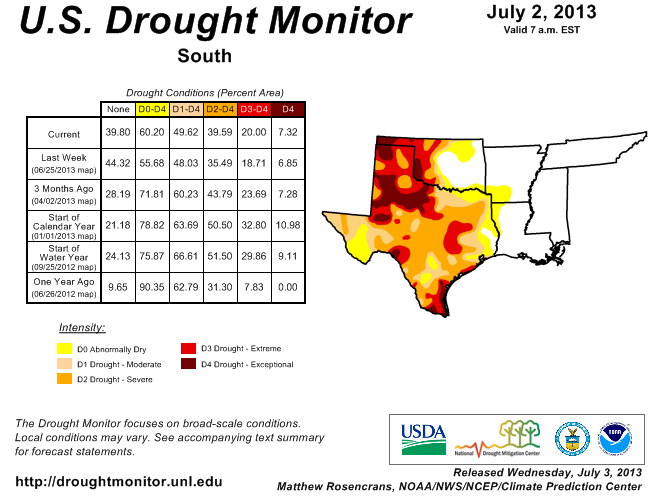
As explained by the Southern Regional Climate Center, the month of June proved to be a slightly warmer than normal month across the board. June was generally a drier than normal month for the Southern region, with the exception of central Mississippi, northern Louisiana, and eastern Tennessee. The driest area of the region occurred in central Texas where a bulk of the stations reported less than half the expected values for the month. This was also the case in northwestern Arkansas and for some parishes in southeastern Louisiana. Eastern Tennessee was on the wet end of the spectrum, reporting between one hundred and fifty to two hundred percent of normal. Drought conditions have remained fairly steady over the month of June. Severe to extreme drought continue to plague much of Texas and Oklahoma. Some improvement has been observed in the central portions of Oklahoma, while Louisiana, Arkansas, Mississippi, and Tennessee remain drought-free. In Texas, the heat caused problems late in the month. Several cities saw their greatest June maximum temperatures ever and dozens of other rural regions saw the same. This had a remarkable effect on reservoirs in East Texas, causing several water planning regions, from Dallas/Fort Worth to Houston and Nacogdoches, to see thousands of acre-feet in surface water loss in days. Statewide reservoir storage dropped by over a percent for the first time in months, falling below end of month levels for May and April.
As summarized by the Midwest Regional Climate Center, June temperatures were close to normal across the Midwest. June precipitation was below normal in limited areas: the northern half of Michigan, northwest and north central Minnesota, extreme southern Missouri, and west of a line from northwest Iowa into west central Illinois and then back to west central Missouri. Totals were more than 50 percent of normal in nearly all locations. The remaining areas received above normal precipitation totals in June. Totals were about twice normal in southern Wisconsin, southeast Michigan, northeast Ohio and an area on the Illinois-Indiana border to the south of Terre Haute, Indiana. With the rain, much of the remaining drought areas in the Midwest shrank away. The only remaining pocket of drought was moderate drought in northern Minnesota around Red Lake. The decrease in drought coverage and intensity in June brought drought areas from about 3.5 percent down to less than 1 percent and the small area of severe drought in southwest Minnesota became drought free in June. Following the drought stricken 2012, the first six months are off to a record wet start in much of the Midwest. Year-to-date regional precipitation totals rank as the wettest January to June period on record (records start in 1895) for the Midwest as a whole. Statewide values also ranked as the wettest in Illinois, Iowa, Michigan, and Wisconsin.
As noted by the Southeast Regional Climate Center, monthly mean temperatures in June were generally between 1 and 2 degrees F (0.5 and 1.1 degrees C) above average across much of the Southeast region, except across southwest Florida and central portions of Georgia and the Carolinas, where temperatures were slightly below average. Monthly temperatures were also below average across the U.S. Virgin Islands, while temperatures across Puerto Rico were near average for the month. June was an exceptionally wet month across the Southeast, as more than half of the region recorded monthly precipitation totals in excess of 10 inches (254 mm), which was between 200 and 400 percent of normal. Precipitation in June was also above average across Puerto Rico and the U.S. Virgin Islands. Widespread rain fell from Florida to Virginia as Tropical Storm Andrea tracked across the region from the 5th to the 8th of the month. A plume of deep tropical moisture spread across the Southeast on the 29th and 30th of the month, resulting in locally heavy downpours and significant flooding.
By the end of June the Southeast region was completely drought-free, marking the first such occurrence in nearly three years. Abnormally dry (D0) conditions remained across the western Panhandle of Florida and parts of southern Alabama and extreme southwestern Georgia. The heavy rains in June had a significant impact on agriculture in the region. The harvesting and cultivation of crops, particularly wheat, hay, and soybeans, as well as the planting of new crops, such peanuts, potatoes, and vegetables, were delayed due to the wet weather and excessive soil moisture. For some farmers, less than half of their crops had been harvested by the end of the month, which may reduce their potential yield. In North Carolina, more than 30 percent of the wheat crop across the state had yet to be harvested. Diseases and pests were also observed across parts of Georgia and the Carolinas, while hay was unable to be cut and baled across parts of Virginia due to excess moisture. The quality of other crops, such as small grains and tobacco, was also negatively affected by the wet weather.
As explained by the Northeast Regional Climate Center, June was another warmer-than-average month in the Northeast, and also very wet. A slow-moving low and the remnants of Tropical Storm Andrea dumped heavy rain on the region from June 6-8. Fourteen of the Northeast's thirty-five first-order climate sites broke daily precipitation records and flooding was reported from northern New Jersey to coastal Massachusetts. Receiving 7.19 inches (182.63 mm) of precipitation, 172 percent of normal, it was the third wettest June since 1895 for the region. All twelve states were wetter than normal with eleven of the states ranking this June among their top ten wettest. Delaware and New Jersey reported their wettest June on record. At the beginning of June, parts of New England were experiencing abnormal dryness (D0) and moderate drought (D1) conditions and New York and New Jersey had areas of D0. Copious amounts of rain fell throughout the month erasing dry conditions in those areas. Parts of Pennsylvania and West Virginia also started the month with D0 and D1 conditions. Plentiful rainfall eased dryness in those states with the exception of a small area of D0 in northern West Virginia and southwestern Pennsylvania.
As summarized by the Western Regional Climate Center, June started out warm, turned cool, then returned to extreme and record warmth at month end, with little relief for most areas affected by ongoing drought. Impressive high temperature records fell in the Southwest. Tucson, Arizona saw its first June on record (1895+) where all days logged triple digit highs. This was the warmest June in 119 years at both Tucson, with an average 89.5 F (31.9 C), and at Phoenix, with an average 94.8 F (34.8 C). On the 30th, Death Valley, California hit 129 F (53.9 C), the hottest June temperature ever at this station, and also equal to the highest June reading in United States history. On the same day, Las Vegas, Nevada tied its all-time hottest temperature for any month at 117 F (47.2 C), ending the warmest June in their 76-year record with an average 91.5 F (33.0 C).
Not atypically, many locations in Southern California, southern Nevada, Utah, and Arizona reported no June precipitation. Precipitation totals for the last twelve months were a scant 5.85 in (149 mm) in Los Angeles, the 6th driest such period in 137 years and 39% of normal. Thunderstorms throughout the month brought much needed precipitation to isolated locations in the Great Basin, Arizona, eastern New Mexico and Colorado. However, Salt Lake City, Utah recorded no measurable precipitation for the second June in a row and only the 3rd June since 1948. Drought conditions worsened this month over Four Corners region, northern Great Basin, and Wyoming. Near the Canadian border, conditions were cool as low pressure systems paraded past. These systems brought ample June precipitation to eastern Washington, northeastern Oregon, the Idaho panhandle, and northern Montana.
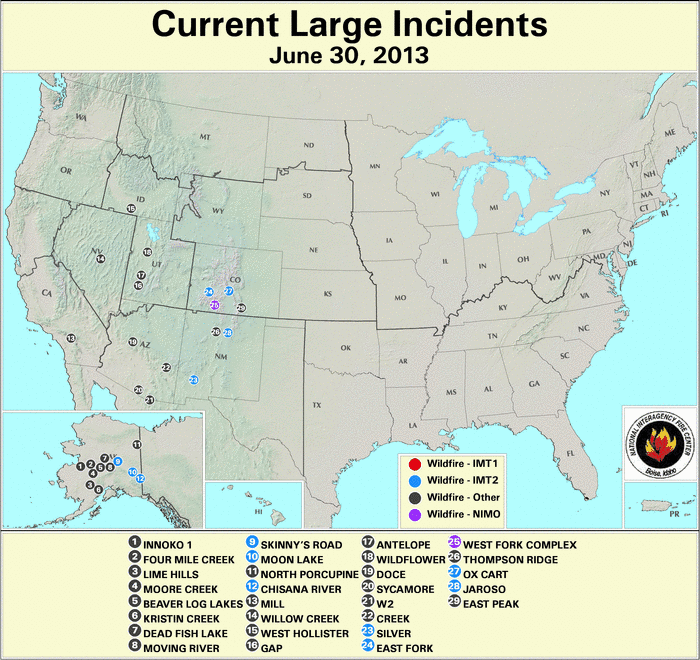
After a cooler than normal spring, a mid-June heat wave brought record-breaking temperatures to South Central Alaska. McGrath hit 94 F (34.4 C) on June 17, shattering the previous all-time record at that location of 90 F (32.2 C) from June 15, 1969. Talkeetna hit 96 F (35.6 C), on the 17th as well, 5 F (2.8 C) above the standing record 91 F (32.8 C), and just 4 F (2.2 C) shy of the all-time annual Alaska record. Several other locations also saw all-time records tied or broken. Heat and continuing dryness greatly increased the incidence of fire in interior Alaska.
At month's end, there were 28 large fires burning in the West. Despite loss of life and property, for the year-to-date, 2013 is at approximately 60% of the 10-year average for both number of fires and acres burned in the nation.
According to media reports (AP, 7/2), the Navajo Nation declared a drought emergency. Navajo Nation President Ben Shelly signed the emergency declaration along with a memorandum directing all executive branch agencies to develop plans for responding to the drought and educating the public about its effects.
Pacific Islands: According to reports from National Weather Service offices, the Pacific ENSO Applications Climate Center (PEAC), and partners, conditions varied across the Pacific Islands.
As noted by the National Weather Service office in Honolulu, after a slow start, the 2013 dry season began in earnest during June. This was especially true on the Big Island where drought has already started to worsen in the leeward areas. Extreme drought, which is the D3 category on the USDM map, was reintroduced in the Pohakuloa region of the Hamakua district after a brief respite in early June. A new area of D3 conditions also developed over the northwestern portion of the north Kohala district. Severe drought, or the D2 category, remained in place over the upper slopes of the north and south Kona districts and expanded into the Waikoloa and Puako regions of the south Kohala district. In the Kau district, the area hit hardest by drought continues to be the lower elevations near South Point which has seen a redevelopment of D2 conditions in recent weeks. In Maui county, extreme drought over the lower southwest slope of Haleakala in the Kihei area expanded eastward to include the Ulupalakua area. Severe drought remained in place over the lower leeward slopes of the west Maui Mountains from Lahaina to Maalaea. On Molokai, the water supply level remains low in the Kualapuu reservoir so the severe drought designation remains in place for agriculture.
Some drought impacts impacts in Hawaii include the following:
KAUAI.
THERE ARE CURRENTLY NO DROUGHT AREAS ON KAUAI.

OAHU.
THERE ARE CURRENTLY NO DROUGHT AREAS ON OAHU.

MOLOKAI.
ALTHOUGH RAINFALL TOTALS WERE BELOW AVERAGE IN JUNE FOR THE WEST
HALF OF THE ISLAND...SATELLITE-BASED VEGETATION HEALTH DATA CONTINUE
TO SHOW FAIR TO GOOD CONDITIONS OVER MOST AREAS.

THE STATE OF HAWAII DEPARTMENT OF AGRICULTURE MAINTAINED A MANDATORY
REDUCTION IN IRRIGATION WATER CONSUMPTION OF 20 PERCENT FOR FARMERS
SERVED BY THE KUALAPUU RESERVOIR.  THE RESTRICTION WAS REDUCED FROM
30 PERCENT TO 20 PERCENT ON APRIL 2 2013.

LANAI.
SATELLITE-BASED VEGETATION HEALTH DATA SHOW LITTLE CHANGE IN
CONDITIONS OVER THE PAST MONTH.  NO RECENT GROUND-BASED OBSERVATIONS
HAVE BEEN RECEIVED TO CONFIRM THIS.

MAUI.
A REPORT OF IMPACTS TO ULUPALAKUA RANCH INDICATED THAT LONG TERM
DROUGHT CONDITIONS HAVE RESULTED IN A HERD SIZE REDUCTION OF OVER 50
PERCENT COMPARED TO 5 YEARS AGO AND THE TOTAL CONTINUES TO FALL.
ESTIMATED FEED FOR LIVESTOCK WAS EVALUATED AT ONLY 31 PERCENT
COMPARED TO 2008 WITH AN ECONOMIC IMPACT ESTIMATED TO BE MORE THAN
HALF A MILLION DOLLARS PER YEAR.

THE MAUI COUNTY DEPARTMENT OF WATER SUPPLY HAS MAINTAINED THEIR
LONG-STANDING REQUEST FOR A 10 PERCENT REDUCTION IN WATER USE BY
CENTRAL AND SOUTH MAUI RESIDENTS.

BIG ISLAND.
RANCHERS OPERATING IN THE NORTH KOHALA DISTRICT NEAR HAWI HAVE
DESTOCKED THEIR PASTURES DUE TO A LACK OF FEED AND RANCHERS WITH
HERDS NEAR SOUTH POINT WERE POISED TO DO THE SAME.  THE POHAKULOA
AREA HAS BEEN DESCRIBED AS HAVING MOSTLY DIRT AND DUST INSTEAD OF
GROWING VEGETATION.  RANCHERS OPERATING IN THE AREA HAVE BEEN
HAULING WATER TO SUSTAIN LIVESTOCK.  WINDWARD SLOPES HAVE BEEN
RECEIVING ALMOST DAILY RAINFALL BUT THE AMOUNT PER DAY HAS BEEN
BELOW AVERAGE.  WHILE THIS RAINFALL APPEARS TO BE SUFFICIENT SO FAR
FOR VEGETATION...IMPACTS MAY SOON OCCUR IF RAINFALL DEFICITS
INCREASE FURTHER.
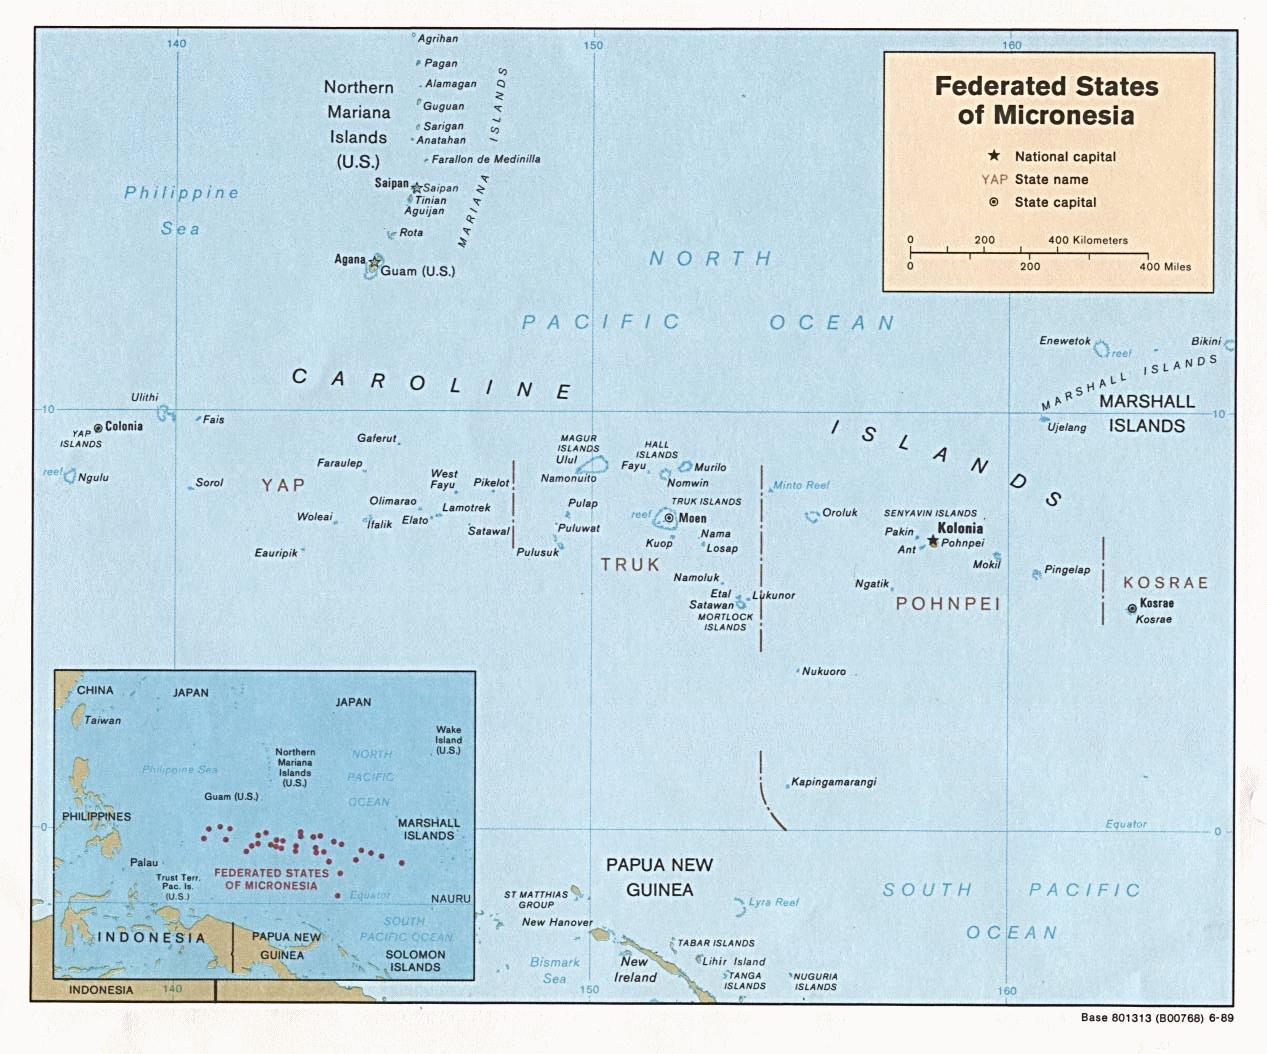
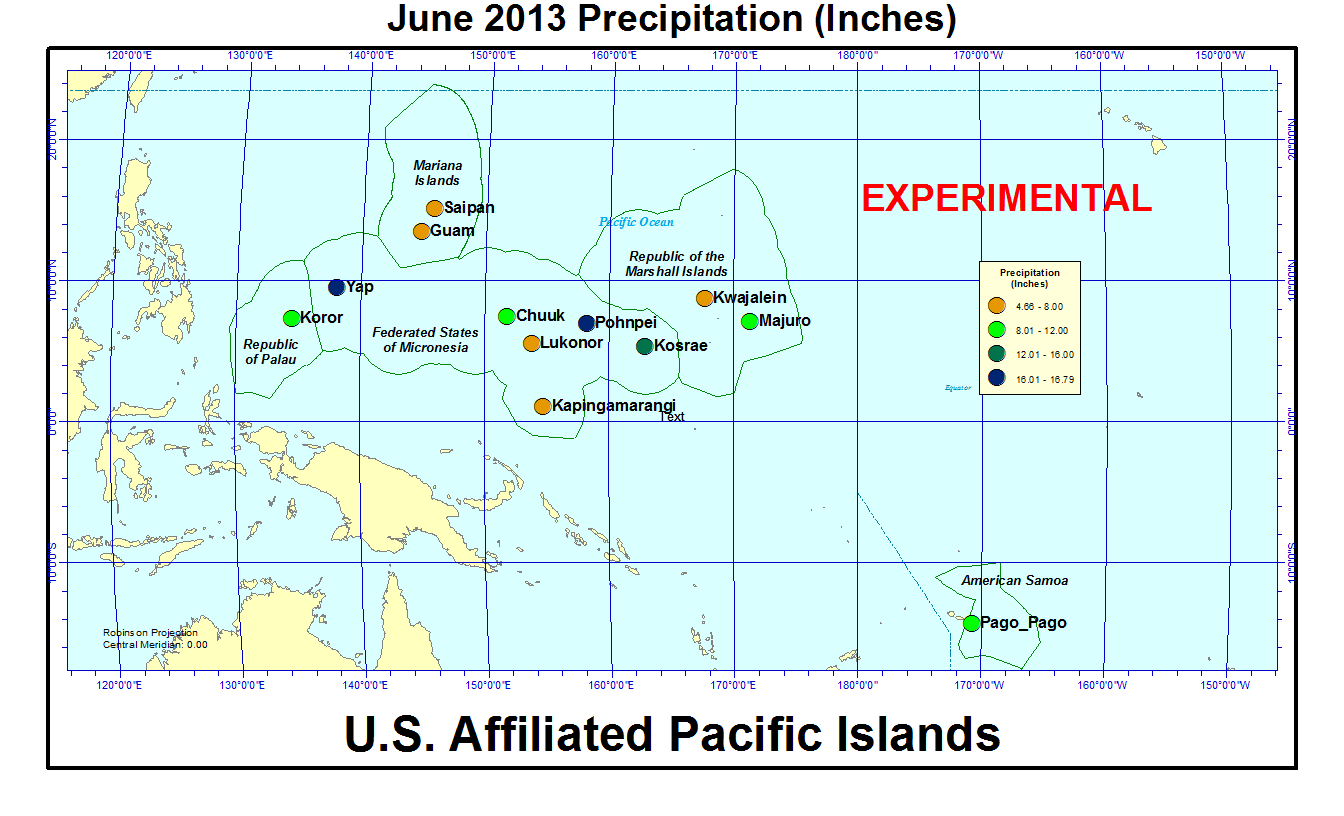
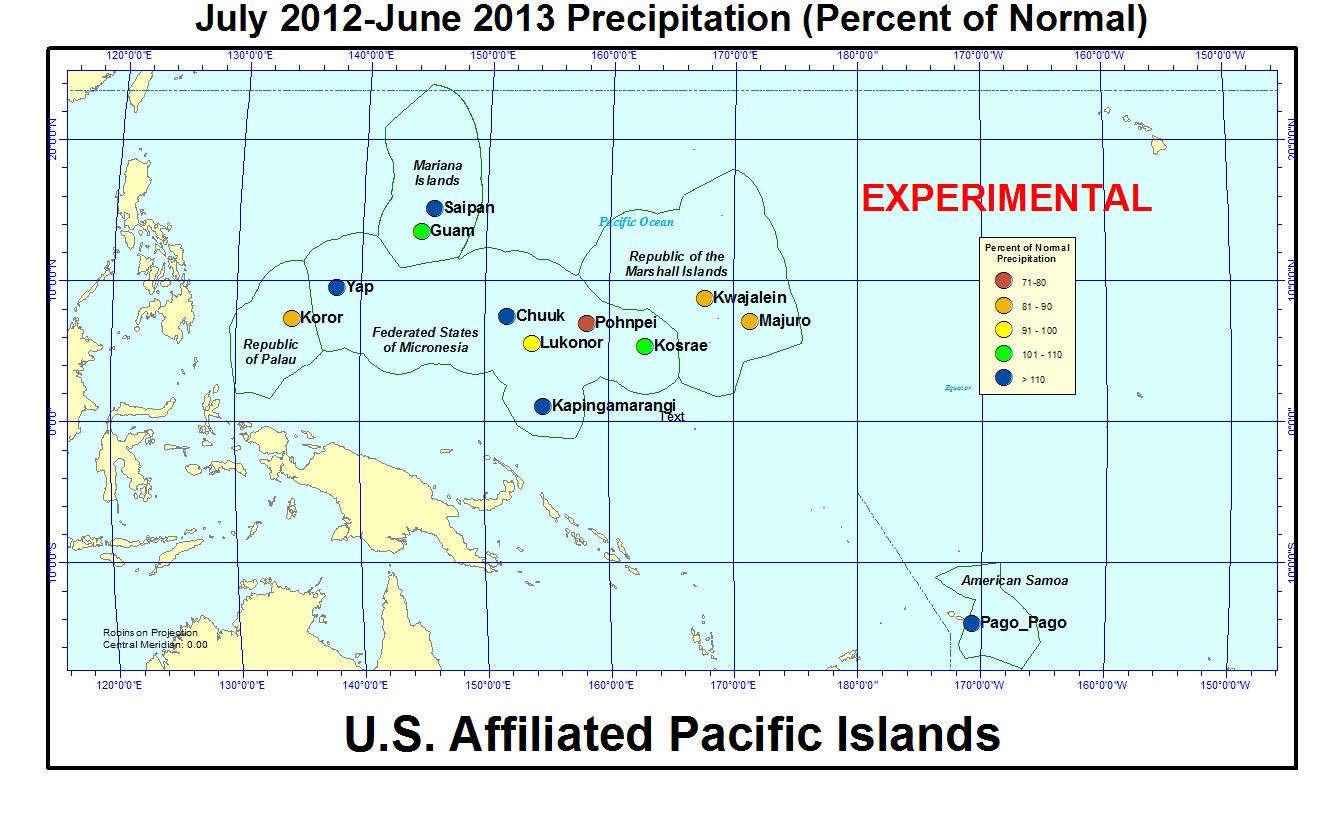
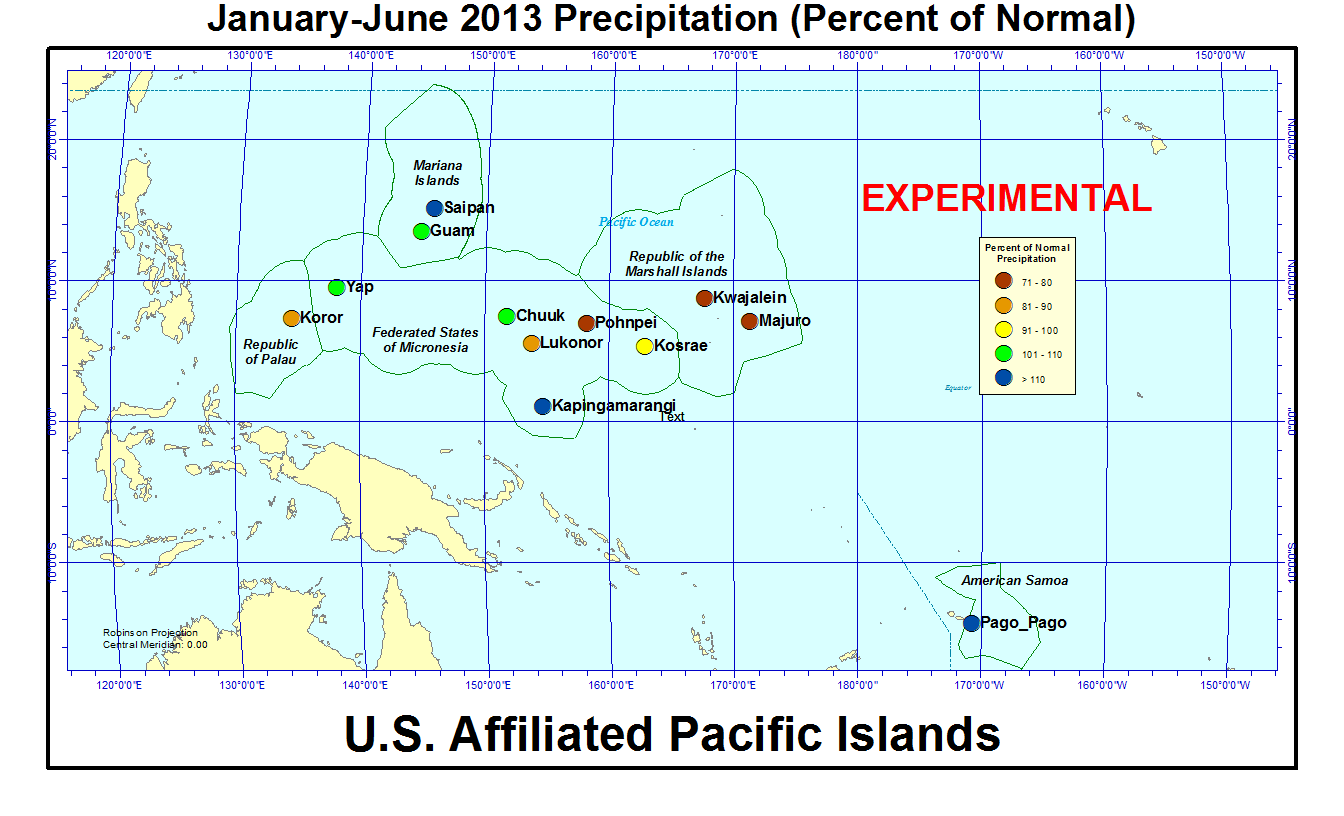
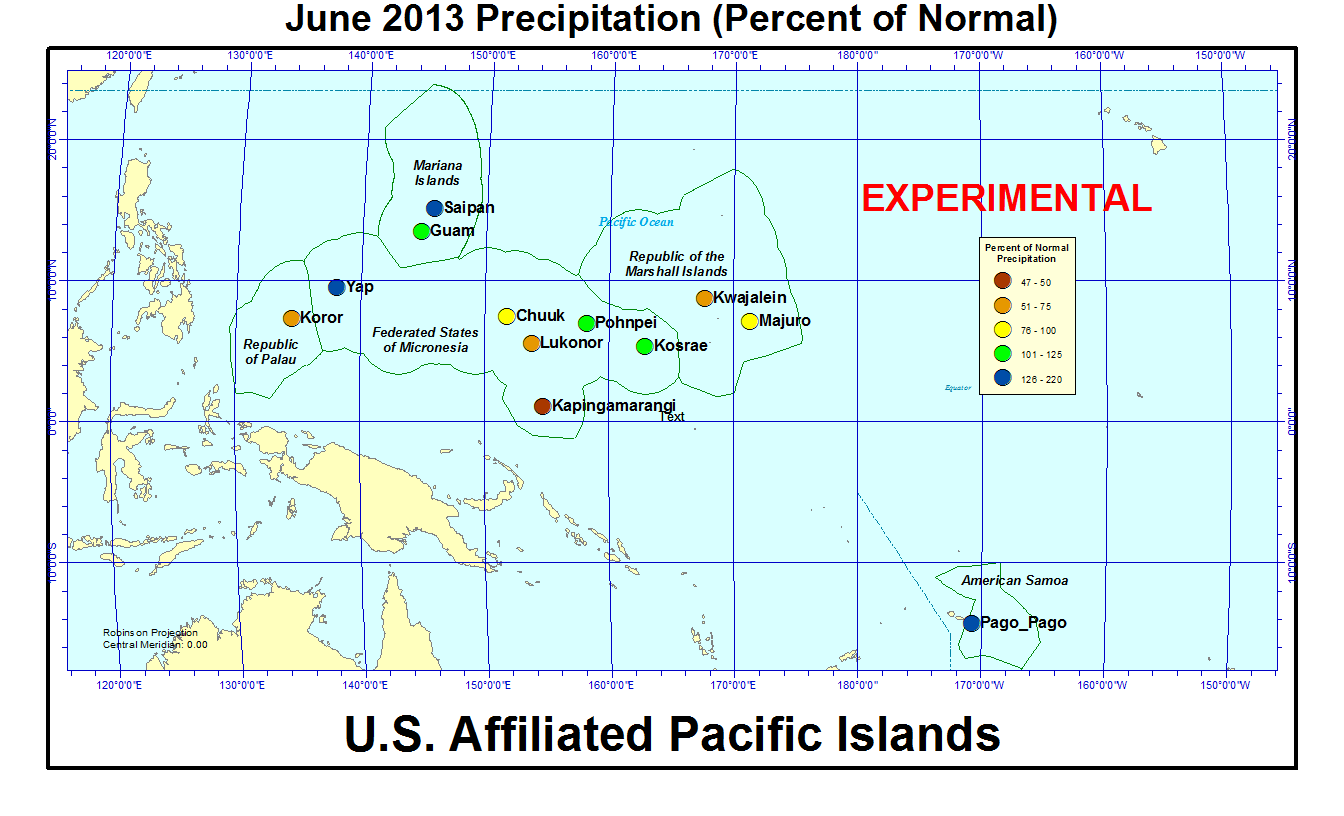
On other Pacific Islands (maps — Micronesia, Marshall Islands, basinwide), June was drier than normal at Koror, Chuuk, Lukonor, Kapingamarangi, Kwajalein, and Majuro. June rainfall amounts were below 4 inches at Tinian and Rota in the Commonwealth of the Northern Mariana Islands, and below 8 inches at Saipan, Guam, Lukonor, Kapingamarangi, and Kwajalein. Majuro and Pohnpei have had below-normal rainfall for ten of the last twelve months, Kwajalein for nine of the last twelve months, Lukonor for eight, and Koror for seven. As a result, twelve-month (July 2012-June 2013) rainfall totals for these five stations were below normal. The year-to-date has been very dry, especially for the northern Marshall Islands. For January-June 2013, Kwajalein has had 19.38 inches of rainfall, or 72 percent of normal, Majuro 41.60 inches (80 percent), and nearby Pohnpei 62.95 inches (71 percent). In the northern Marshalls, Utirik received a scant 8.98 inches of rain for January-June, and Wotje received 8.77 inches.
According to NWS reports, extreme dryness continued for parts of the northern Marshall Islands, but seasonal trade-wind showers helped moderate the dry weather in June. The Republic of the Marshall Islands Cabinet on May 6 issued a state of disaster for the northern Republic of the Marshall Islands (RMI), which was elevated from the previous state of emergency declared on February 19. The Cabinet renewed the disaster declaration on June 7. The drought there was affecting over 6,300 people and has damaged or destroyed considerable agriculture on many atolls and made well water too salty for human consumption. A full recovery is expected to take several months.
| Station Name | Jul 2012 | Aug 2012 | Sep 2012 | Oct 2012 | Nov 2012 | Dec 2012 | Jan 2013 | Feb 2013 | Mar 2013 | Apr 2013 | May 2013 | Jun 2013 | Jul- Jun |
|---|---|---|---|---|---|---|---|---|---|---|---|---|---|
| Chuuk | 141% | 169% | 86% | 128% | 144% | 116% | 99% | 146% | 192% | 49% | 79% | 84% | 112% |
| Guam NAS | 66% | 179% | 126% | 92% | 74% | 55% | 128% | 97% | 191% | 45% | 103% | 102% | 92% |
| Kapingamarangi | 146% | 192% | 147% | 138% | 167% | 74% | 197% | 154% | 199% | 77% | 48% | 47% | 112% |
| Koror | 88% | 102% | 111% | 78% | 67% | 103% | 72% | 92% | 56% | 103% | 109% | 67% | 80% |
| Kosrae | 124% | 144% | 109% | 113% | 119% | 110% | 98% | 146% | 64% | 95% | 76% | 122% | 91% |
| Kwajalein | 120% | 95% | 57% | 73% | 45% | 230% | 39% | 17% | 74% | 178% | 29% | 67% | 83% |
| Lukonor | 82% | 73% | 148% | 74% | 178% | 62% | 60% | 134% | 122% | 71% | 92% | 64% | 82% |
| Majuro | 68% | 87% | 67% | 46% | 154% | 53% | 31% | 152% | 78% | 69% | 65% | 96% | 79% |
| Pago Pago | 105% | 59% | 195% | 54% | 181% | 143% | 137% | 87% | 93% | 144% | 66% | 220% | 107% |
| Pohnpei | 92% | 96% | 90% | 82% | 109% | 71% | 83% | 54% | 67% | 59% | 52% | 113% | 78% |
| Saipan | 77% | 135% | 101% | 172% | 31% | 89% | 191% | 78% | 127% | 63% | 203% | 157% | 114% |
| Yap | 84% | 128% | 187% | 140% | 121% | 102% | 90% | 113% | 130% | 50% | 69% | 134% | 112% |
| Station Name | Jul 2012 | Aug 2012 | Sep 2012 | Oct 2012 | Nov 2012 | Dec 2012 | Jan 2013 | Feb 2013 | Mar 2013 | Apr 2013 | May 2013 | Jun 2013 | Jul- Jun |
|---|---|---|---|---|---|---|---|---|---|---|---|---|---|
| Chuuk | 16.92" | 21.78" | 10.04" | 14.68" | 15.30" | 13.09" | 10.00" | 10.60" | 16.00" | 6.11" | 8.93" | 9.85" | 153.3" |
| Guam NAS | 6.74" | 26.42" | 15.98" | 10.56" | 5.45" | 2.81" | 5.12" | 2.95" | 3.95" | 1.14" | 3.51" | 6.32" | 90.95" |
| Kapingamarangi | 20.65" | 15.57" | 14.56" | 11.32" | 15.44" | 7.25" | 18.02" | 14.25" | 22.79" | 10.51" | 5.84" | 6.45" | 162.65" |
| Koror | 16.36" | 13.72" | 13.01" | 9.23" | 7.68" | 11.52" | 7.29" | 7.91" | 4.13" | 7.57" | 12.87" | 11.70" | 122.99" |
| Kosrae | 18.55" | 20.46" | 15.52" | 12.33" | 16.49" | 17.75" | 16.27" | 18.89" | 10.20" | 16.71" | 13.41" | 17.89" | 194.47" |
| Kwajalein | 11.83" | 9.23" | 6.17" | 8.18" | 5.09" | 15.33" | 1.22" | 0.46" | 1.73" | 9.34" | 1.97" | 4.66" | 75.21" |
| Lukonor | 13.08" | 10.26" | 15.02" | 8.39" | 16.18" | 7.00" | 5.05" | 11.93" | 11.34" | 8.06" | 10.77" | 7.51" | 124.59" |
| Majuro | 7.54" | 10.15" | 7.47" | 5.84" | 20.69" | 6.09" | 2.42" | 10.44" | 5.13" | 6.46" | 6.60" | 10.55" | 99.38" |
| Pago Pago | 5.84" | 3.19" | 12.73" | 4.99" | 18.34" | 18.31" | 18.27" | 10.48" | 9.97" | 13.52" | 6.35" | 11.75" | 133.74" |
| Pohnpei | 14.21" | 13.62" | 11.27" | 12.59" | 16.18" | 11.37" | 10.88" | 5.14" | 8.78" | 10.92" | 10.44" | 16.79" | 142.19" |
| Saipan | 6.86" | 17.73" | 10.24" | 18.31" | 1.75" | 3.44" | 4.83" | 2.03" | 2.40" | 1.65" | 4.82" | 5.68" | 79.74" |
| Yap | 12.74" | 18.92" | 25.19" | 17.08" | 10.67" | 8.68" | 5.72" | 5.86" | 5.95" | 2.81" | 5.41" | 16.16" | 135.19" |
| Station Name | Jul 2012 | Aug 2012 | Sep 2012 | Oct 2012 | Nov 2012 | Dec 2012 | Jan 2013 | Feb 2013 | Mar 2013 | Apr 2013 | May 2013 | Jun 2013 | Jul- Jun |
|---|---|---|---|---|---|---|---|---|---|---|---|---|---|
| Chuuk | 11.98" | 12.86" | 11.71" | 11.51" | 10.61" | 11.25" | 10.10" | 7.25" | 8.32" | 12.47" | 11.30" | 11.66" | 136.77" |
| Guam NAS | 10.14" | 14.74" | 12.66" | 11.44" | 7.38" | 5.11" | 4.01" | 3.03" | 2.07" | 2.53" | 3.40" | 6.18" | 99.09" |
| Kapingamarangi | 14.15" | 8.13" | 9.93" | 8.19" | 9.27" | 9.84" | 9.15" | 9.27" | 11.43" | 13.64" | 12.08" | 13.78" | 145.85" |
| Koror | 18.53" | 13.50" | 11.77" | 11.84" | 11.39" | 11.16" | 10.18" | 8.56" | 7.44" | 7.32" | 11.83" | 17.48" | 152.90" |
| Kosrae | 14.91" | 14.22" | 14.22" | 10.94" | 13.83" | 16.11" | 16.67" | 12.93" | 16.06" | 17.51" | 17.75" | 14.64" | 213.87" |
| Kwajalein | 9.87" | 9.74" | 10.74" | 11.18" | 11.28" | 6.66" | 3.16" | 2.64" | 2.35" | 5.26" | 6.72" | 6.93" | 90.41" |
| Lukonor | 15.93" | 14.04" | 10.15" | 11.32" | 9.08" | 11.27" | 8.41" | 8.93" | 9.26" | 11.31" | 11.69" | 11.65" | 151.36" |
| Majuro | 11.17" | 11.69" | 11.17" | 12.73" | 13.44" | 11.39" | 7.74" | 6.88" | 6.58" | 9.42" | 10.11" | 11.01" | 125.25" |
| Pago Pago | 5.55" | 5.38" | 6.53" | 9.26" | 10.14" | 12.84" | 13.34" | 12.00" | 10.68" | 9.39" | 9.66" | 5.33" | 125.57" |
| Pohnpei | 15.43" | 14.26" | 12.55" | 15.27" | 14.83" | 16.08" | 13.18" | 9.55" | 13.17" | 18.41" | 19.96" | 14.81" | 182.36" |
| Saipan | 8.91" | 13.13" | 10.09" | 10.62" | 5.61" | 3.85" | 2.53" | 2.59" | 1.89" | 2.63" | 2.38" | 3.62" | 70.25" |
| Yap | 15.08" | 14.82" | 13.50" | 12.18" | 8.83" | 8.51" | 6.39" | 5.19" | 4.56" | 5.63" | 7.85" | 12.04" | 120.31" |
[top]
State/Regional/National Moisture Status
A detailed review of drought and moisture conditions is available for all contiguous U.S. states, the nine standard regions, and the nation (contiguous U.S.):
| northeast u. s. | east north central u. s. | central u. s. |
| southeast u. s. | west north central u. s. | south u. s. |
| southwest u. s. | northwest u. s. | west u. s. |
| Contiguous United States |
[top]
Contacts & Questions