|
Contents Of This Report: |
|
Please note that the values presented in this report are based on preliminary data. They will change when the final data are processed, but will not be replaced on these pages.
National Drought Overview
|
|
[top]
Detailed Drought Discussion
Overview
Weather disturbances moving in a  very active jet stream flow intensified as they traversed an upper-level trough over the central U.S., sending a series of low pressure and frontal systems across the central and southeastern parts of the country.
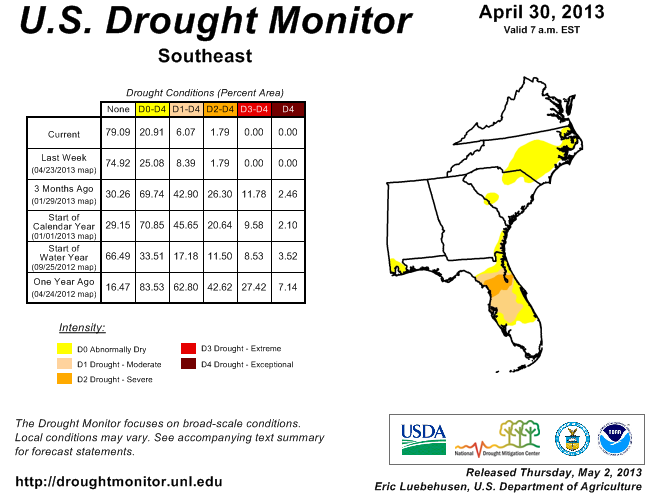
The resulting beneficial precipitation shrank drought areas in the eastern Plains, Midwest, and Southeast, with extreme to exceptional drought virtually eliminated from the Southeast. But the systems largely missed the Southwest and Northeast, with these regions ending the month generally drier than normal. Drought expanded in the West and abnormally dry conditions grew in the Northeast.
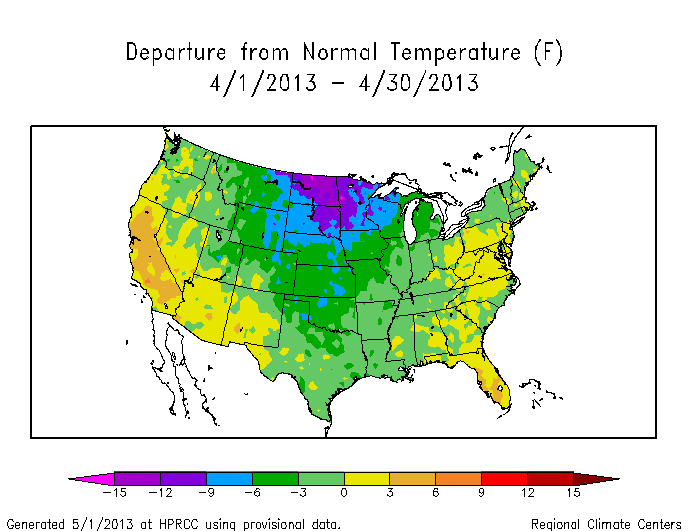
When the temperature and precipitation are averaged across the country for the entire month, April 2013 ranked as the 23rd coolest and 19th wettest April in the 119-year record.
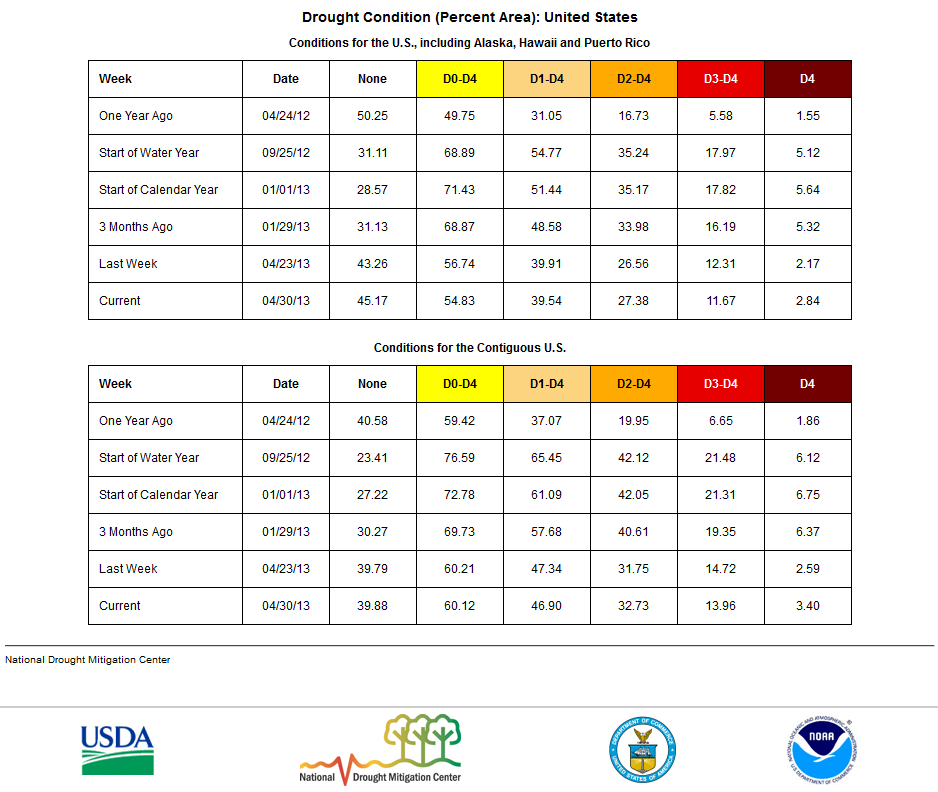
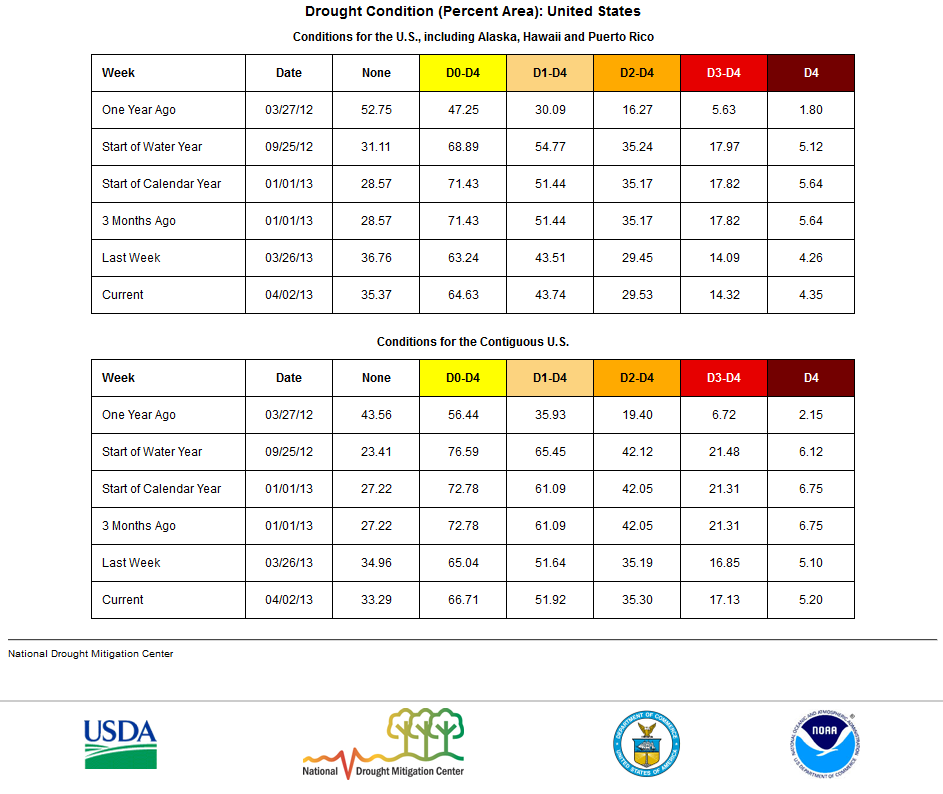
The April precipitation helped reduce the moderate-to-exceptional national drought footprint from 51.9 percent at the end of March to 46.9 percent at the end of April.
According to the Palmer Drought Index, which goes back to the beginning of the 20th century, 41.8 percent of the contiguous U.S. was in moderate to extreme drought at the end of April, decrease of about 7 percent compared to last month.
very active jet stream flow intensified as they traversed an upper-level trough over the central U.S., sending a series of low pressure and frontal systems across the central and southeastern parts of the country.
The resulting beneficial precipitation shrank drought areas in the eastern Plains, Midwest, and Southeast, with extreme to exceptional drought virtually eliminated from the Southeast. But the systems largely missed the Southwest and Northeast, with these regions ending the month generally drier than normal. Drought expanded in the West and abnormally dry conditions grew in the Northeast.
When the temperature and precipitation are averaged across the country for the entire month, April 2013 ranked as the 23rd coolest and 19th wettest April in the 119-year record.
The April precipitation helped reduce the moderate-to-exceptional national drought footprint from 51.9 percent at the end of March to 46.9 percent at the end of April.
According to the Palmer Drought Index, which goes back to the beginning of the 20th century, 41.8 percent of the contiguous U.S. was in moderate to extreme drought at the end of April, decrease of about 7 percent compared to last month.
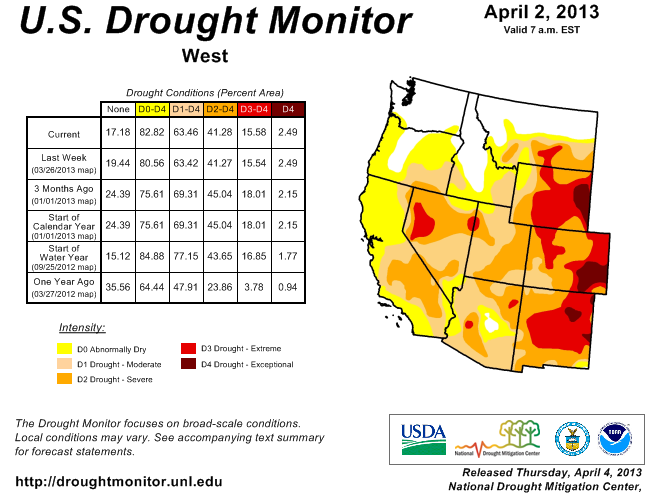
The U.S. Drought Monitor drought map valid April 30, 2013.
By the end of the month, the core drought areas in the U.S. included:
- a large area of moderate (D1) to exceptional (D4) drought stretching from the West, across the Northern and Southern Plains, with the most intense drought centered in the Southwest to Plains states;
- an area of moderate to severe (D2) drought lingering in the Upper Midwest;
- a contracting area of moderate to severe drought in the Southeast; and
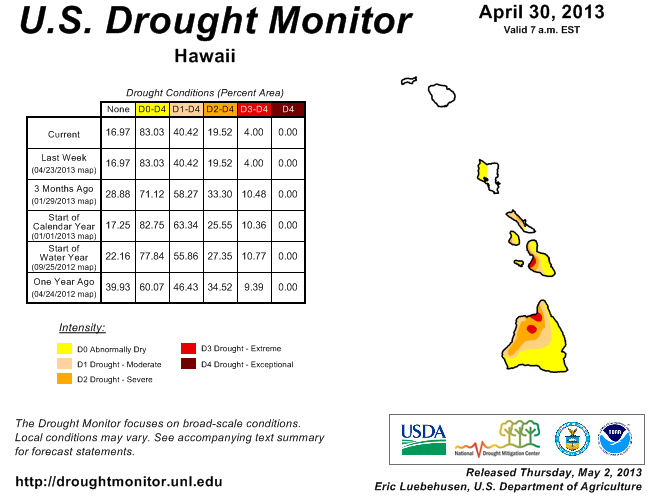
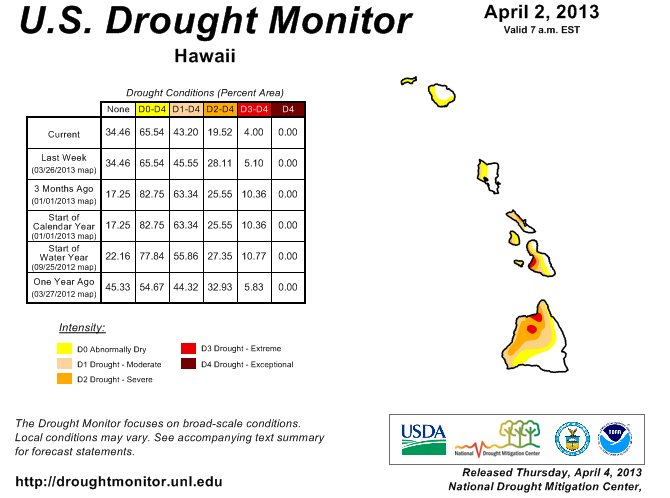
- much of Hawaii, where moderate to extreme (D3) drought largely persisted.
Palmer Drought Index
The Palmer drought indices measure the balance between moisture demand (evapotranspiration driven by temperature) and moisture supply (precipitation). The Palmer Z Index depicts moisture conditions for the current month, while the Palmer Hydrological Drought Index (PHDI) and Palmer Drought Severity Index (PDSI) depict the current month's cumulative moisture conditions integrated over the last several months.
|
 |
Used together, the Palmer Z Index and PHDI maps show that April short-term dry conditions occurred over long-term dry conditions that existed at the end of March across parts of the West and Southern Plains, exacerbating the drought, and short-term dry conditions occurred over parts of the Northeast, which were near-neutral at the end of March, with dryness beginning to be reflected in the long-term indicators at the end of April. Short-term wet conditions happened over long-term dry conditions over parts of the Midwest and Central to Northern Plains, as well as the Southeast, further improving drought conditions. Short-term wetness continued over the Great Lakes to Ohio Valley, where long-term neutral conditions rapidly turned wet.
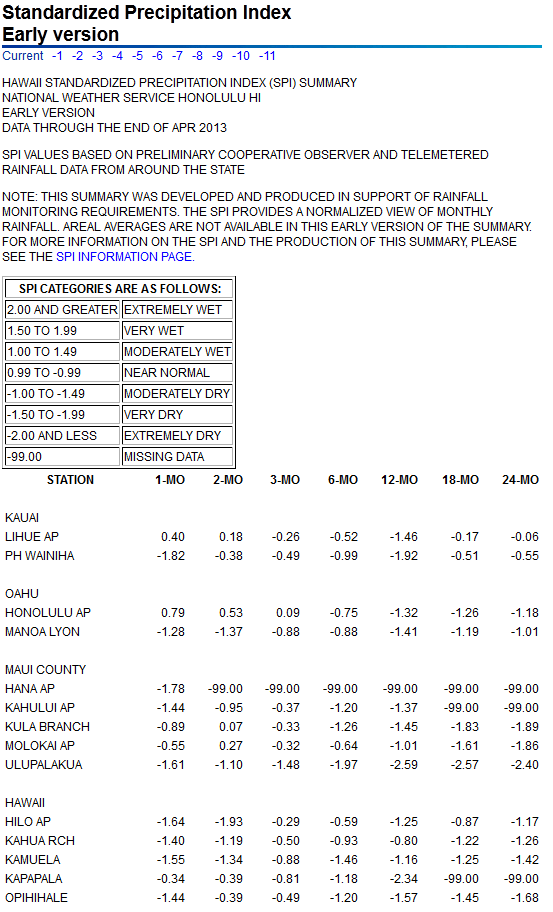
Standardized Precipitation Index
The Standardized Precipitation Index (SPI) measures moisture supply. The SPI maps here show the spatial extent of anomalously wet and dry areas at time scales ranging from 1 month to 24 months.
 |
 |
 |
The 1-month SPI map shows dryness in three distinct dry areas — southern California and Nevada, the Southwest to Southern High Plains, and New England — as well as unusual moisture from the Southeast to the Upper Mississippi Valley. The dryness in the Northeast is most expansive at 2 to 3 months but most intense in New England at 6 months. Widespread dryness in the West is evident at all time scales but is most intense in the extreme West at 3 months. The recent weather systems have neutralized dryness in the short-term over much of the Central and Northern Plains, but very dry conditions are still evident at 9 and 12 months. The Southern Plains register as dry on all of the SPI maps from 2 to 24 months, but especially at the longer time scales. The Southeast shows up as wet at 1 to 12 months, but is still dry at 24 months. On the other hand, the Ohio Valley and Great Lakes (except extreme western Great Lakes) are neutral to wet at all time scales.
 |
 |
 |
Agricultural, Hydrological, and Meteorological Indices and Impacts
 |
 |
Drought conditions were reflected in numerous agricultural, hydrological, and other meteorological indicators, both observed and modeled.
Agricultural:
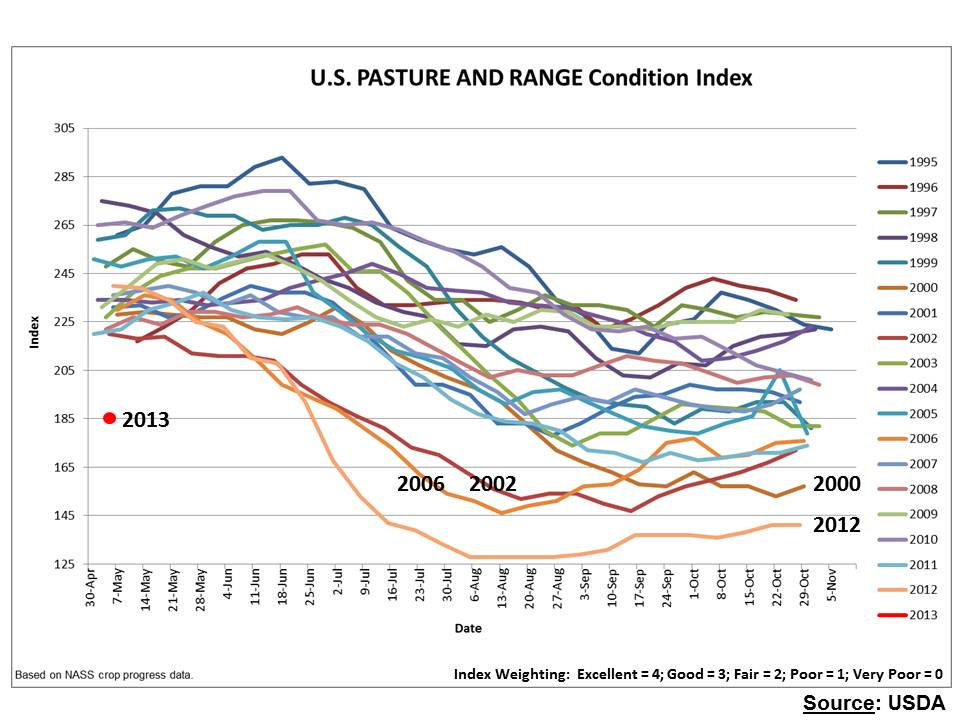
According to the U.S. Department of Agriculture (USDA), as of April 30, 54 percent of winter wheat, 54 percent of cattle, 41 percent of hay, 39 percent of corn, and 31 percent of soybeans were in drought. These percentages are less than the corresponding percentages from a month ago. May 5 USDA statistics revealed that 39 percent of the U.S. winter wheat crop was rated in poor to very poor condition, with statewide percentages as high as 74 percent in Texas, 62 percent in South Dakota, and 56 percent in Colorado. The values were below 50 percent, but still high, in Nebraska (49%), Oklahoma (45%), and Kansas (40%). May 5 statistics also reveal 36 percent of the nation's pasture and rangeland rated in poor to very poor condition, with statewide values as high as 91 percent in New Mexico, 76 percent in Colorado, 70 percent in Nebraska, 62 percent in Kansas, 58 percent in South Dakota, 55 percent in Wyoming, 54 percent in Montana, and 53 percent in Texas. The statewide percentages were above average from Texas to Montana and from Wisconsin to California. As noted by the USDA, the national percentage of pasture and rangeland in poor to very poor condition for 2013 was the lowest spring start for this statistic in the 1995-2013 record due, in part, to 2012 ending at a very low value.
Map showing NOAA/NWS/CPC modeled monthly soil moisture percentiles.
- USDA (U.S. Department of Agriculture) observed soil moisture conditions and comparison to 5-year average and 10-year average;
- the Palmer Crop Moisture Index (CMI), which got wetter where it rained from the Great Lakes to the Gulf of Mexico coast, but deteriorated in the Southwest as the month progressed (weeks 1, 2, 3, 4);
- NOAA Climate Prediction Center (CPC) modeled soil moisture anomalies and percentiles for the end of the month, and soil moisture anomaly change compared to previous month;
- CPC's Leaky Bucket model soil moisture percentiles;
- NLDAS (North American Land Data Assimilation System) modeled soil moisture percentiles for the top soil layer and total soil layer;
- VIC (University of Washington Variable Infiltration Capacity macroscale hydrologic model) modeled soil moisture percentiles, and soil moisture percentile change compared to previous month;
- USDA percent of pasture and rangeland in poor to very poor condition and comparison to average (anomalies, percentiles);
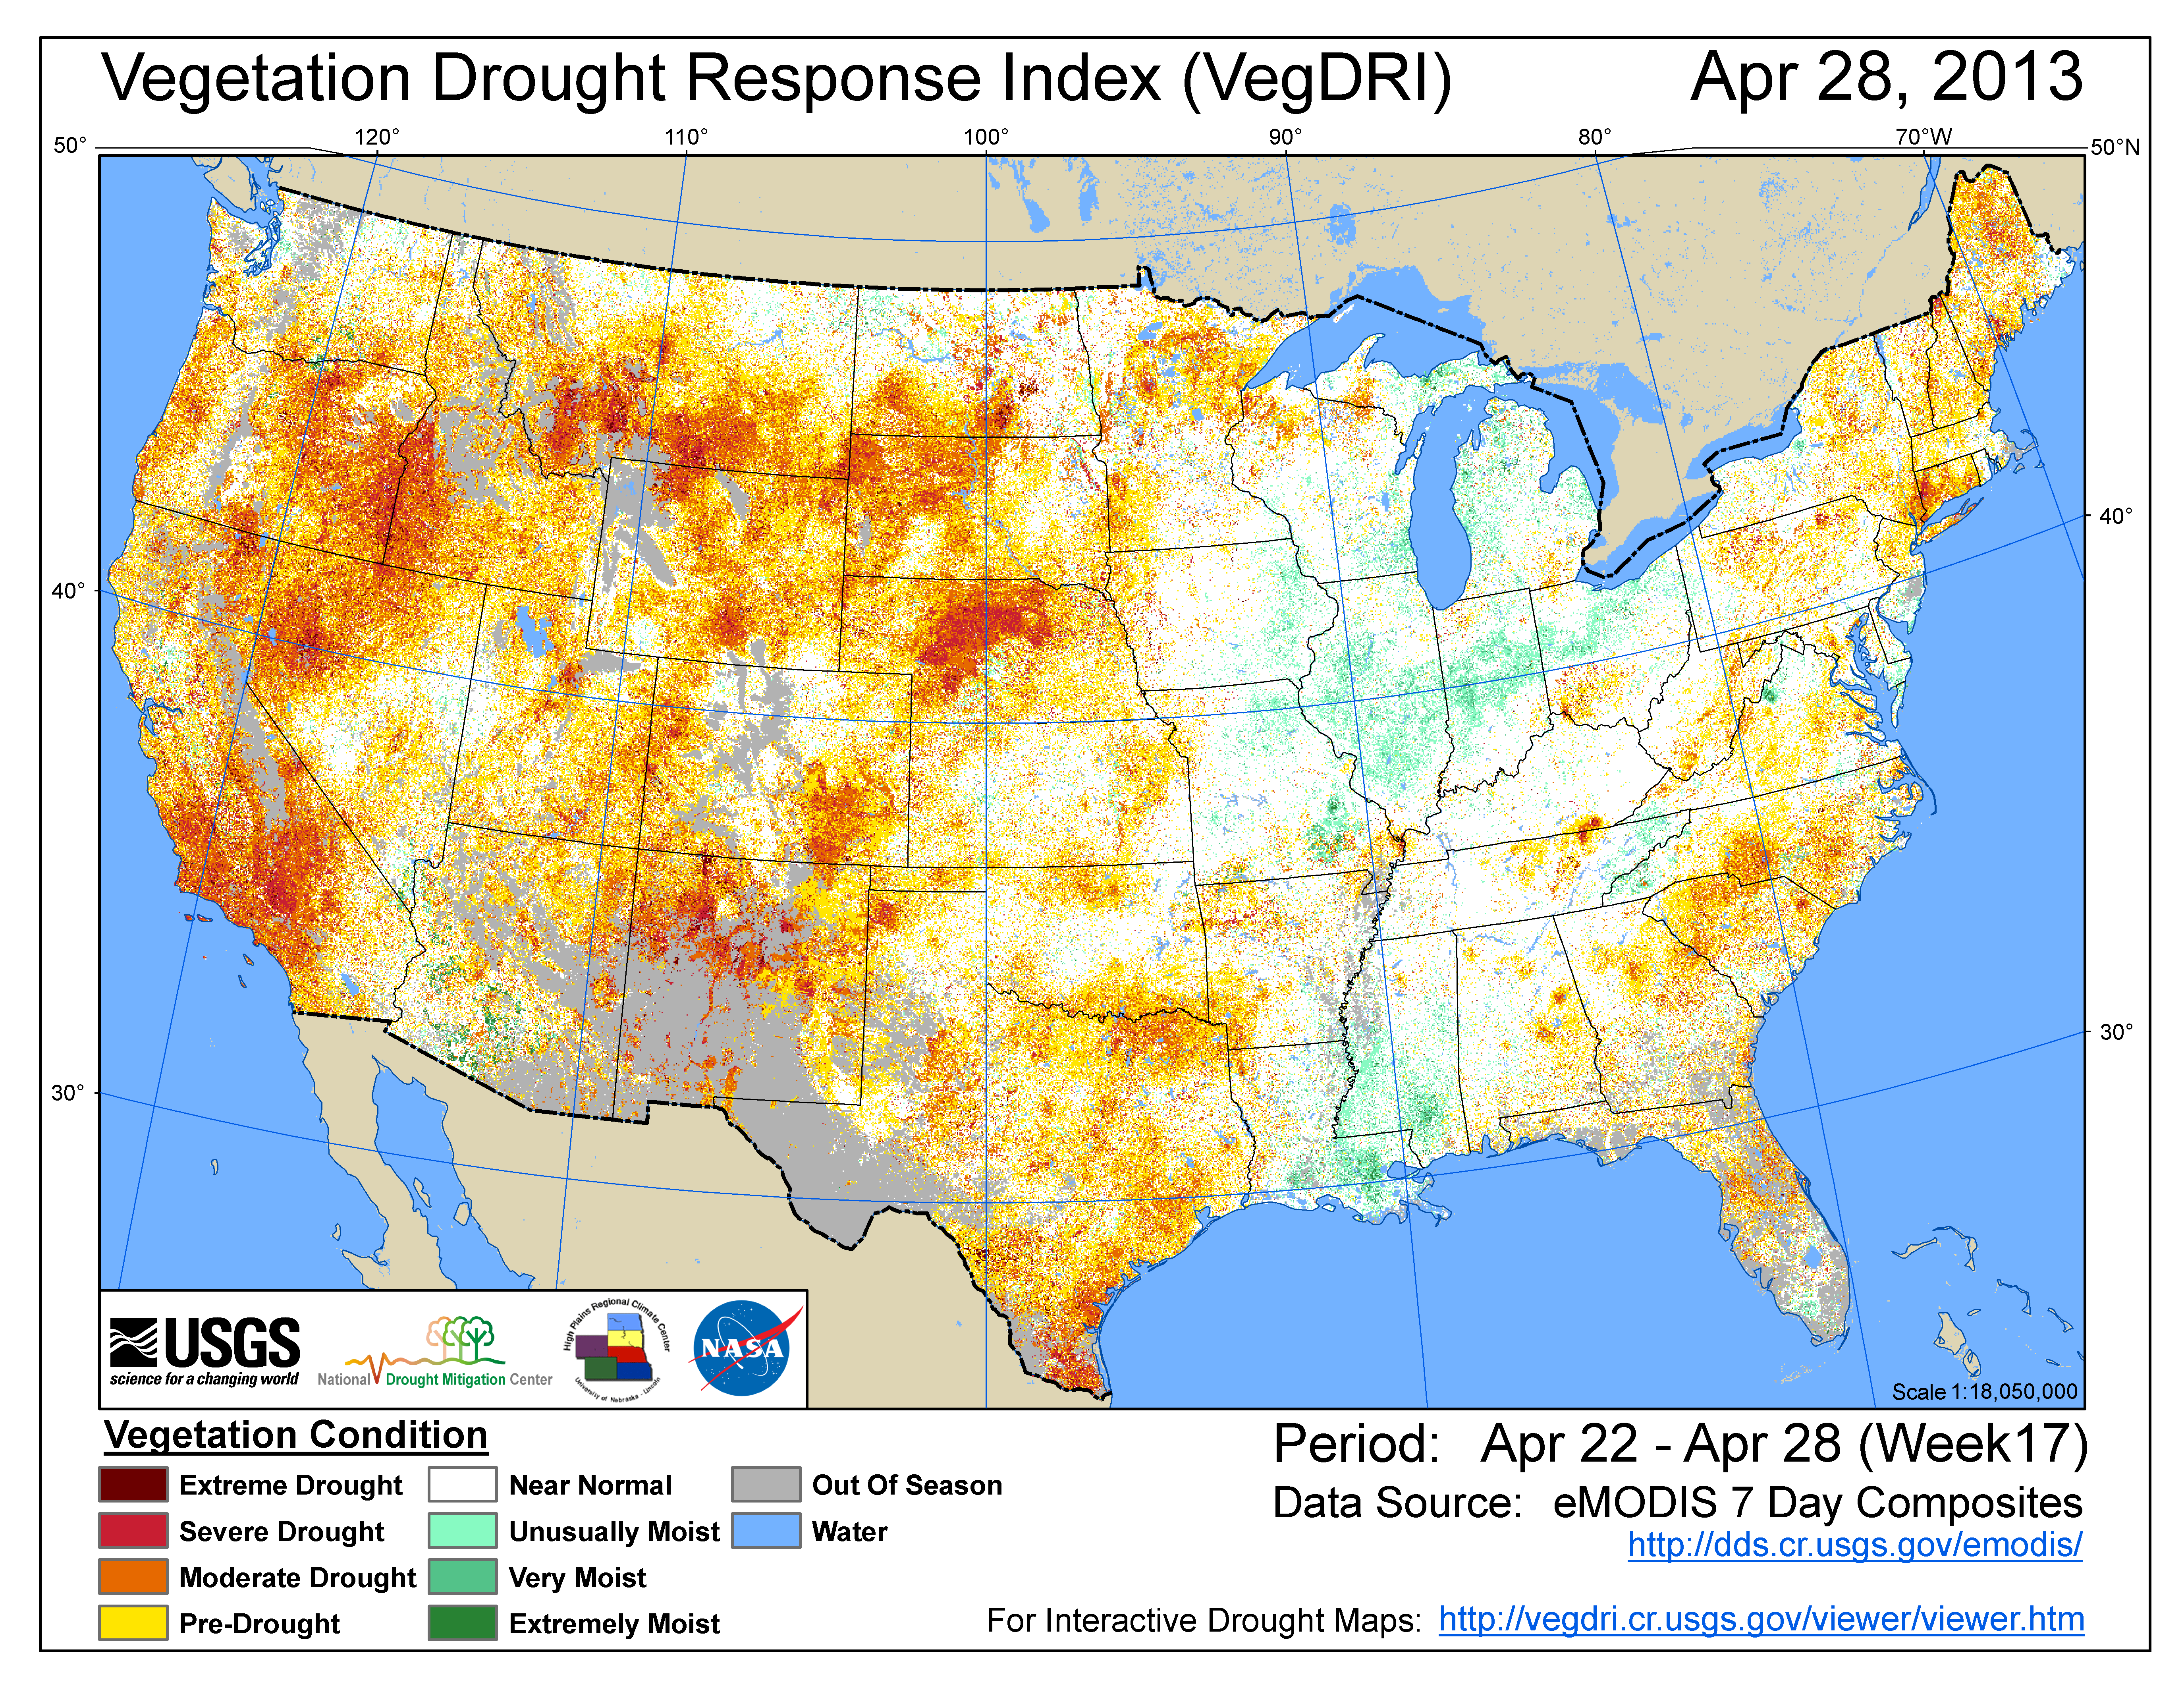
- Vegetation Drought Response Index (VegDRI);
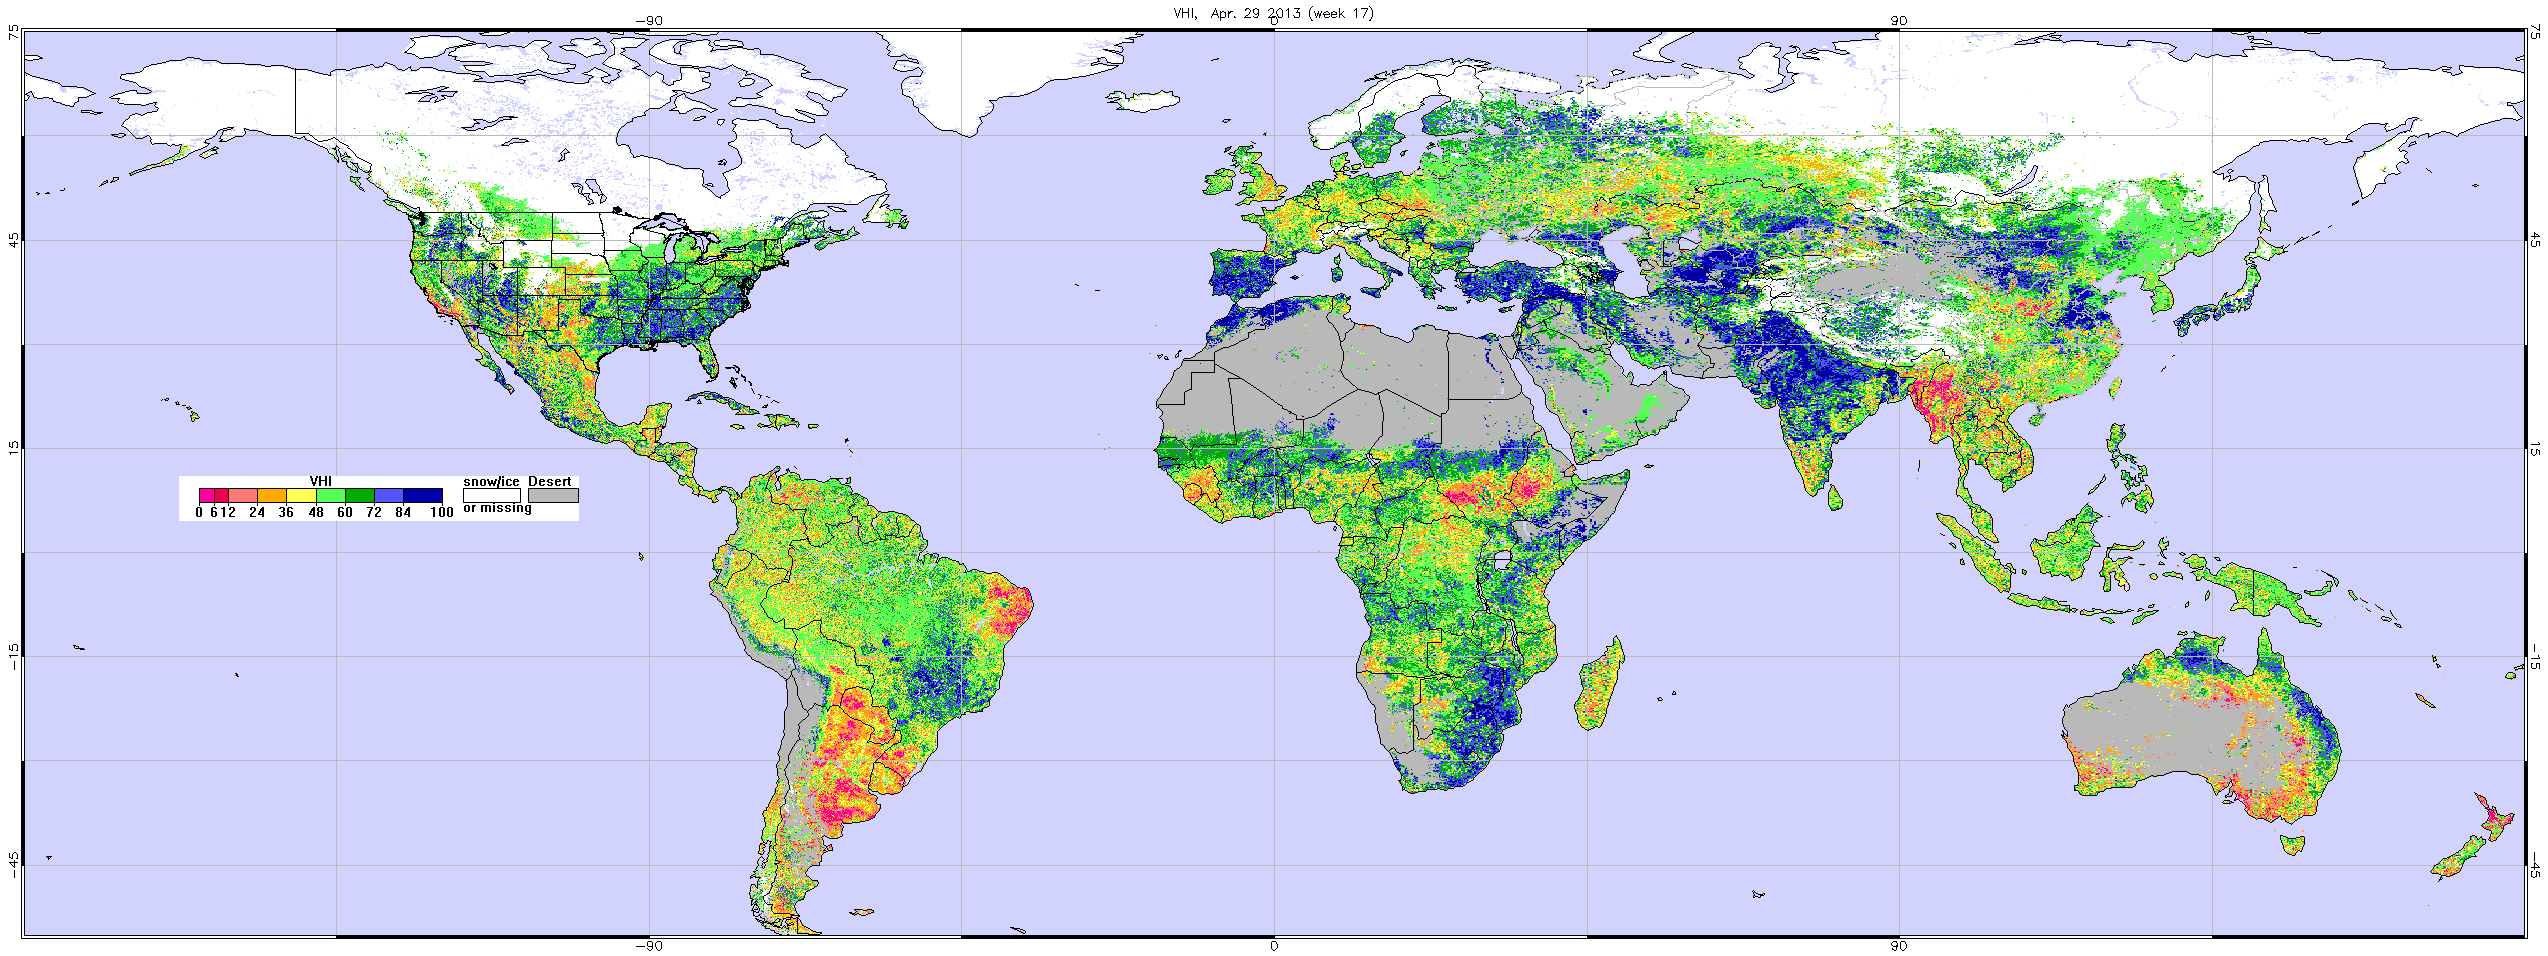
- the NOAA/NESDIS satellite-based Vegetation Health Index (VHI);
Hydrological:
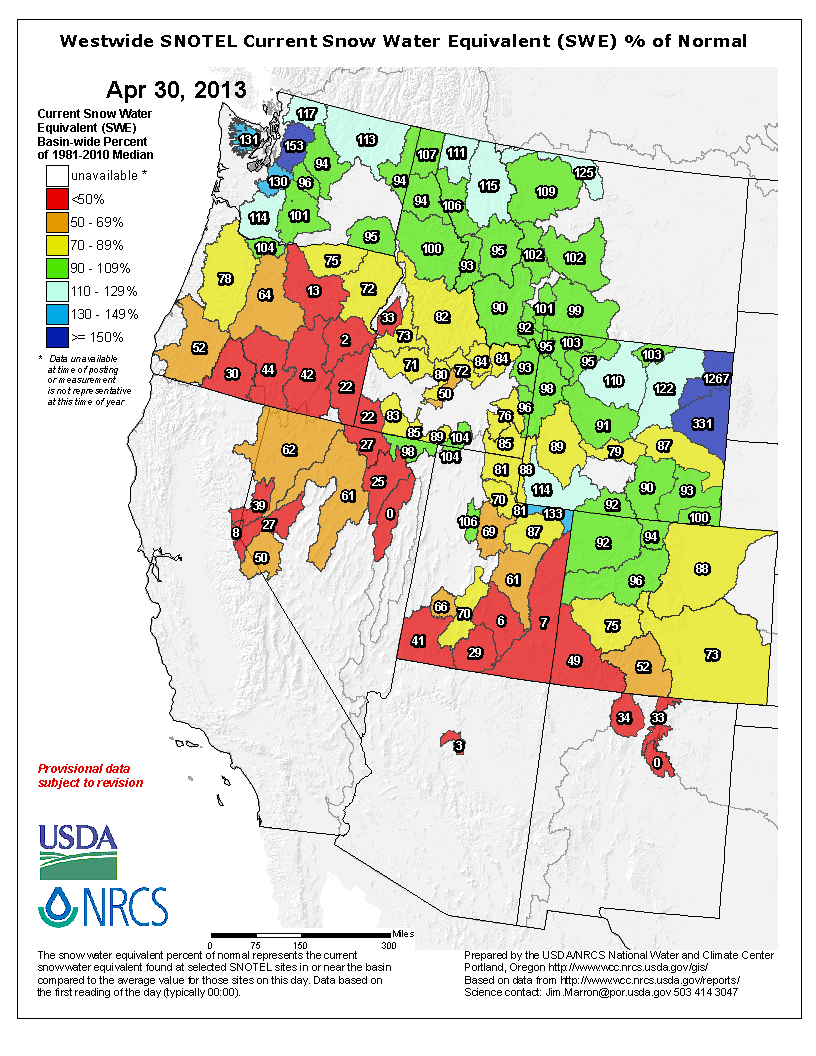
Map showing USDA NRCS mountain snowpack.
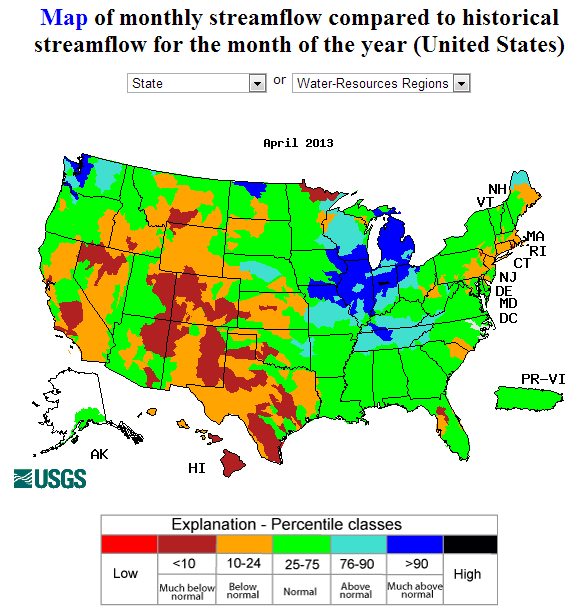
- USGS (U.S. Geological Survey) observed streamflow percentiles;
- VIC 1-, 2-, 3-, and 6-month runoff percentiles;
- NLDAS model runoff anomalies and percentiles;
- NLDAS modeled streamflow anomalies and percentiles;
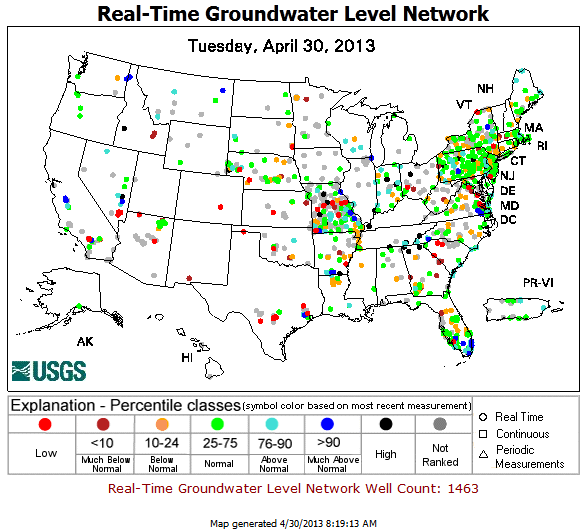
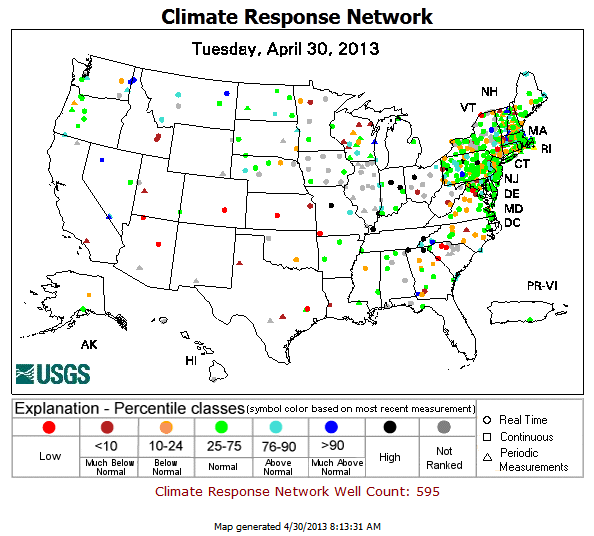
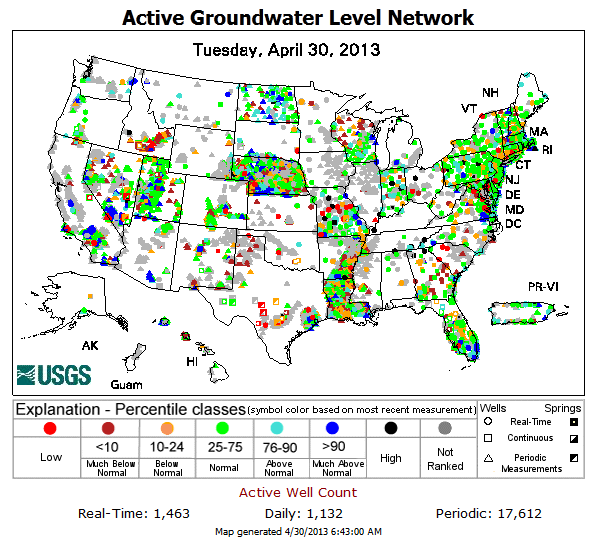
- USGS groundwater observations (real-time network, climate response network, total active network);
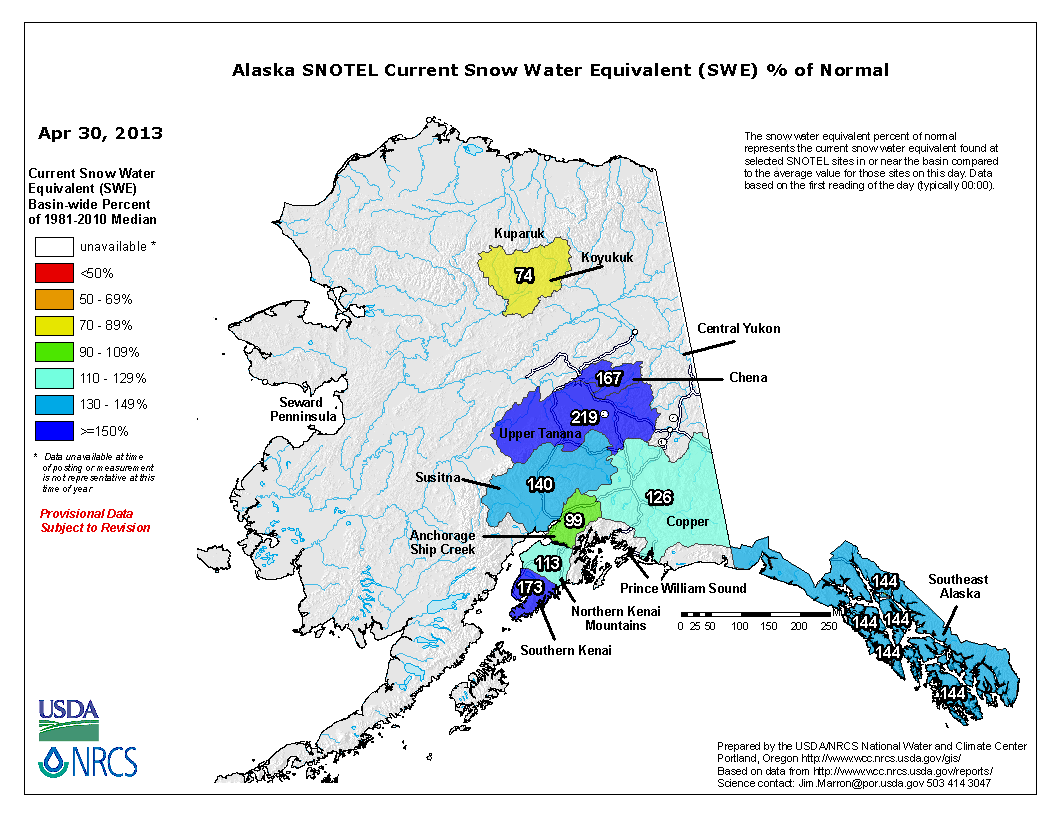
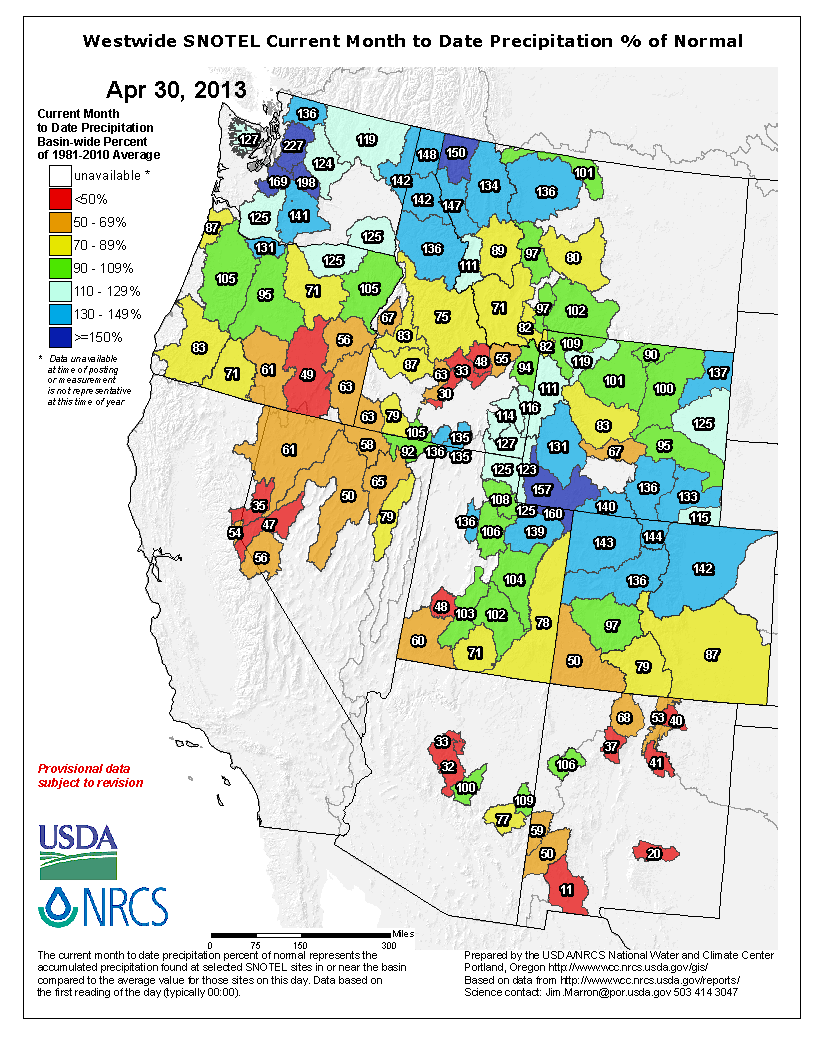
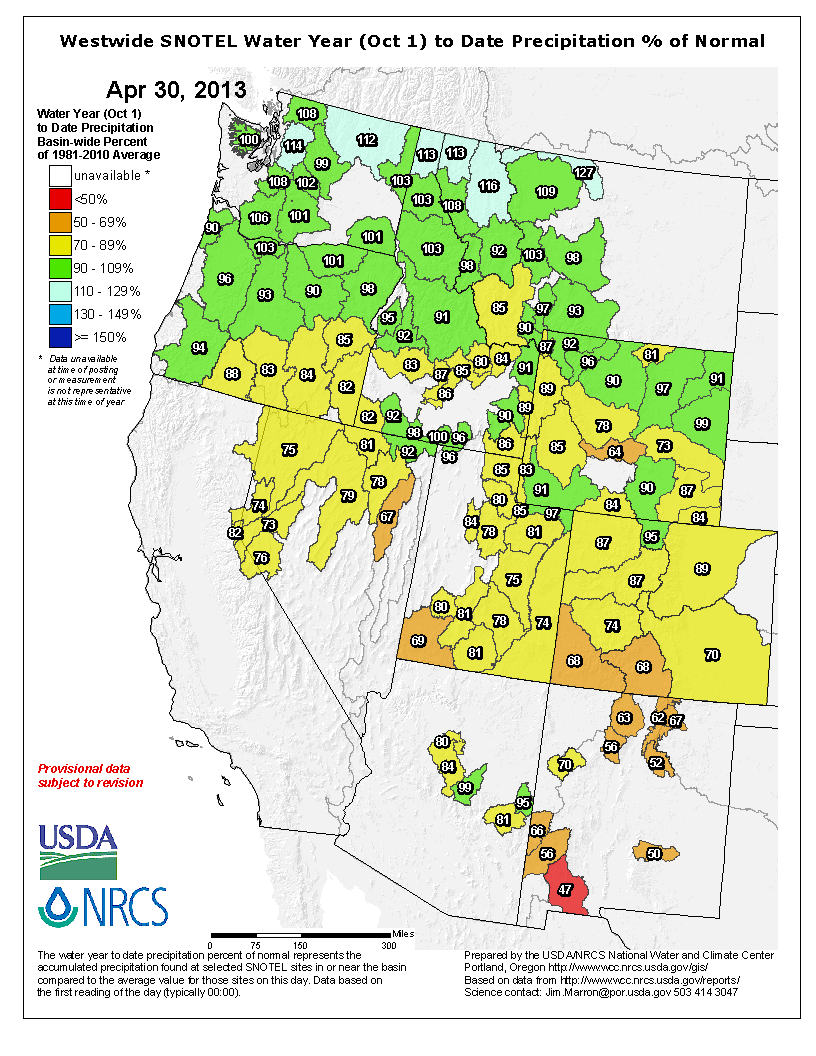
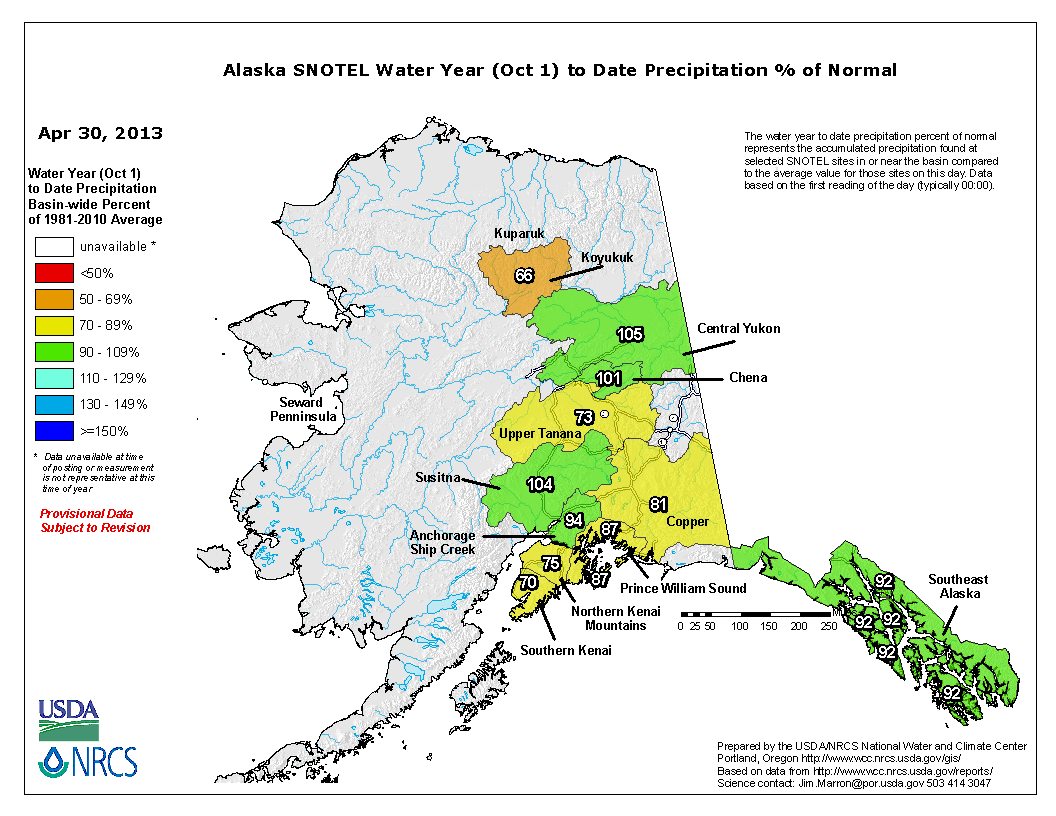
- USDA snow pack and snow water content observations for the West (SNOTEL station percentiles and percent of normal, SNOTEL basin percent of normal and percent of average) and Alaska (SNOTEL station and basin percent of normal);
- VIC modeled snow water content percentile;
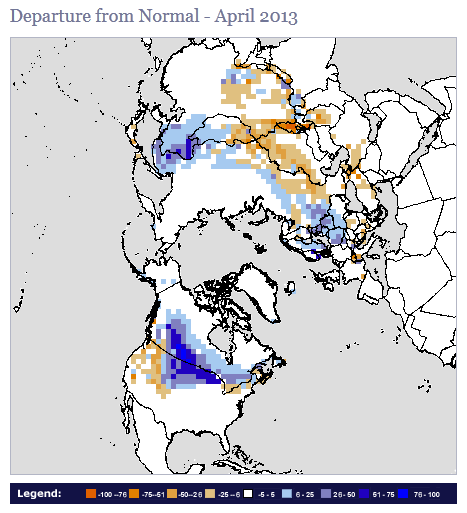
- NOAA/Rutgers University Global Snow Lab satellite-observed snow cover anomalies;
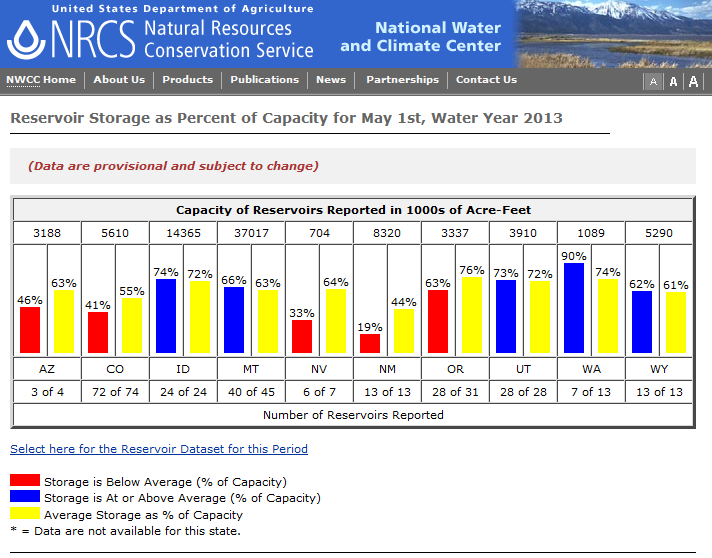
- USDA statewide reservoir storage as percent of capacity (with average depicted);
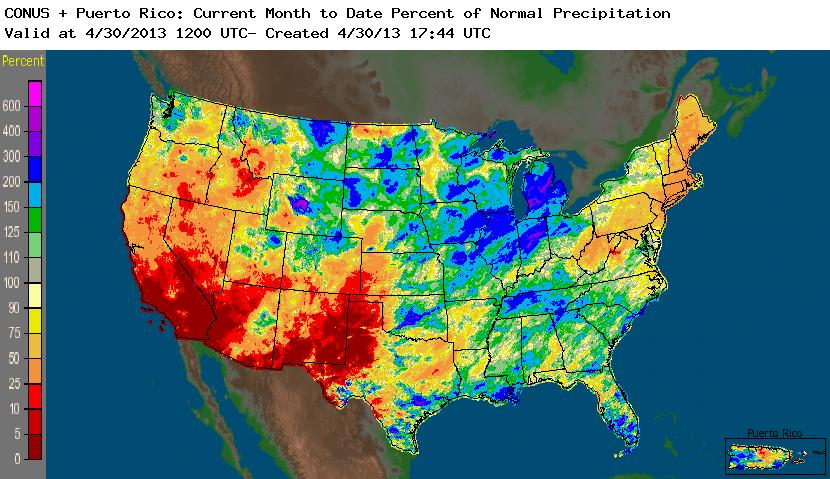
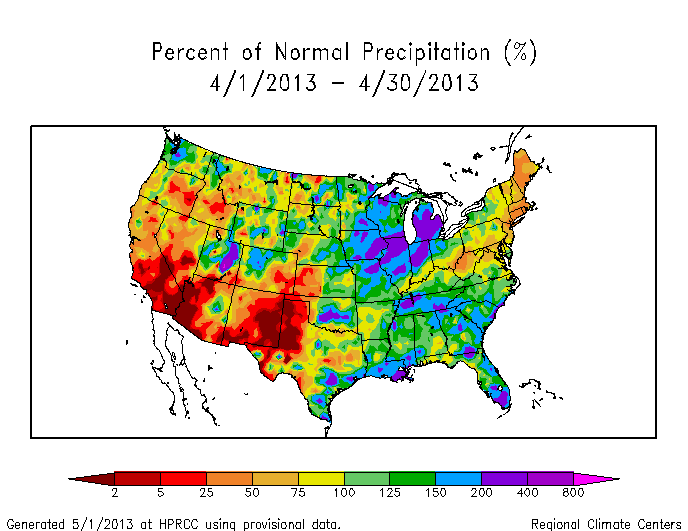
Meteorological:
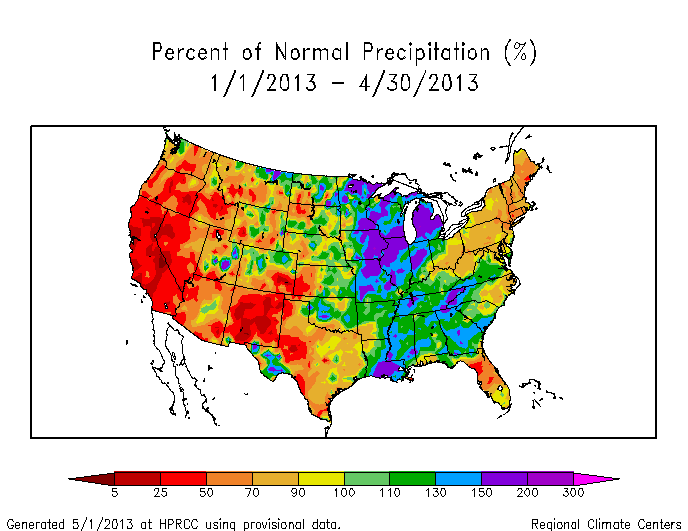
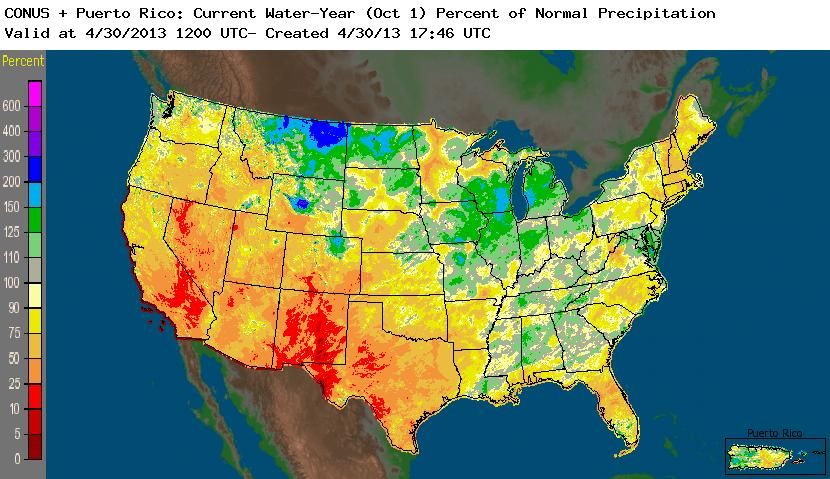
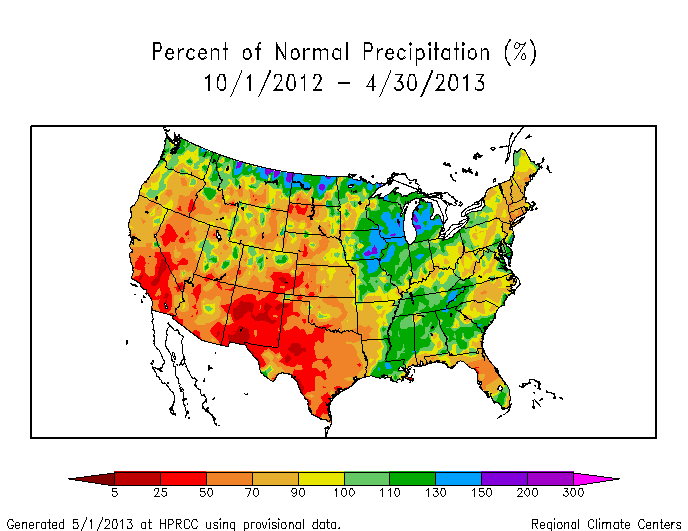
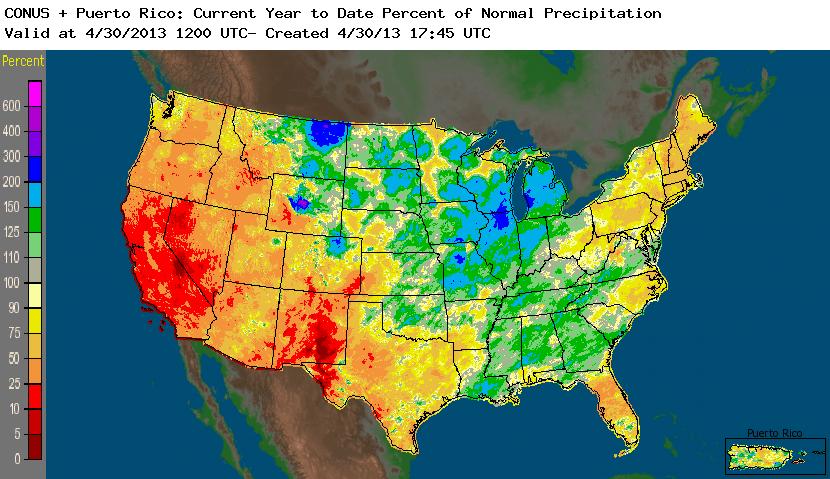
Map showing year-to-date percent of normal precipitation.
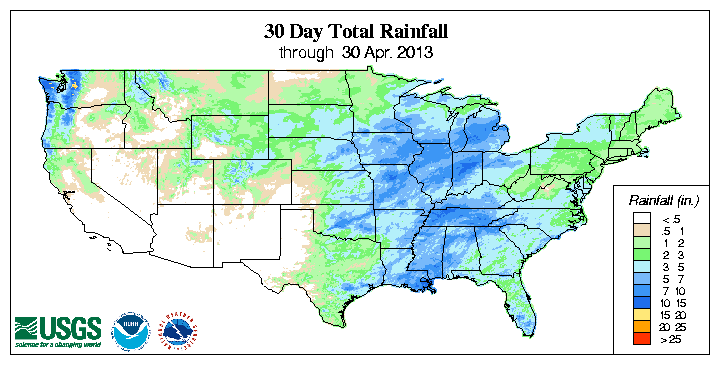
- monthly total precipitation (plotted by the USGS, NOAA National Weather Service [NWS], and NOAA High Plains Regional Climate Center [HPRCC]);
- monthly percent of normal precipitation and precipitation percentiles (NWS, HPRCC station observations, West SNOTEL and ACIS stations, West basins, Alaska SNOTEL stations, Leaky Bucket model, CPC) and precipitation anomalies (CPC);
- NCDC monthly statewide precipitation ranks;
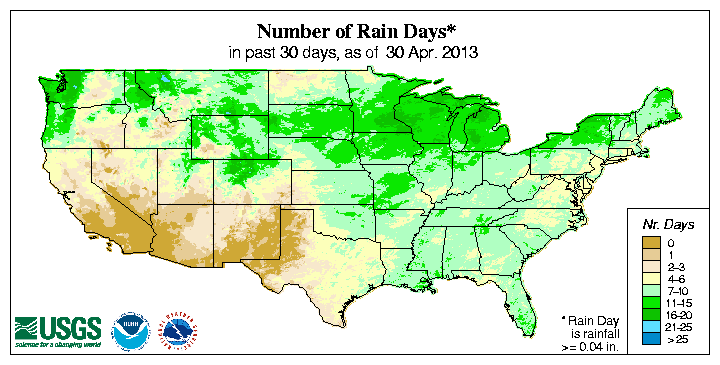
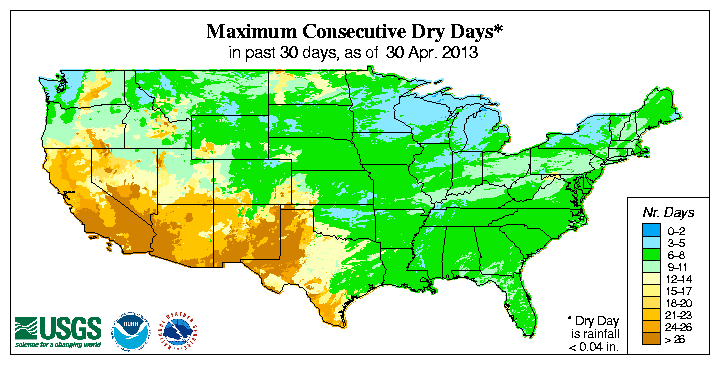
- USGS 30-day number of days with precipitation and maximum number of consecutive dry days;
- water-year-to-date (October-present) percent of normal precipitation (NWS, HPRCC station observations, West SNOTEL and ACIS stations, West basins, Alaska stations, Alaska basins) and precipitation percentiles (West SNOTEL stations);
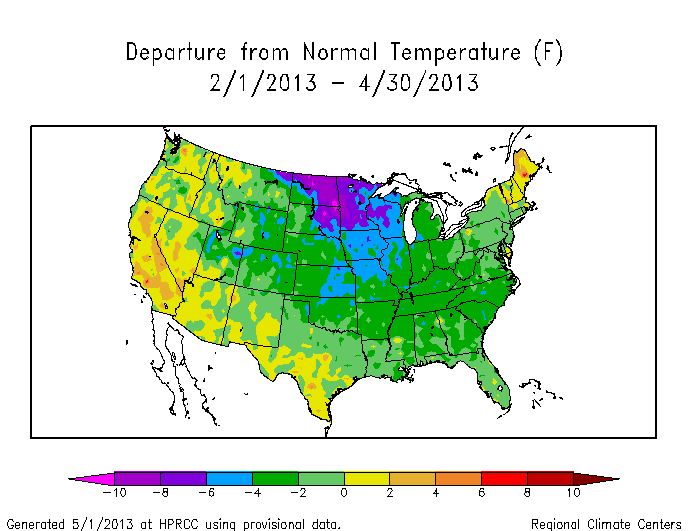
- monthly temperature departures from normal (CPC, HPRCC) and temperature percentiles (CPC, Leaky Bucket);
- NCDC monthly standardized temperature departures and statewide temperature ranks; and
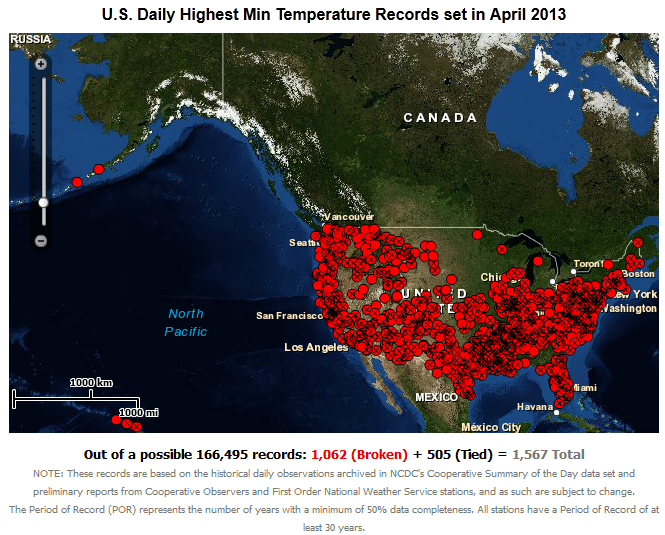
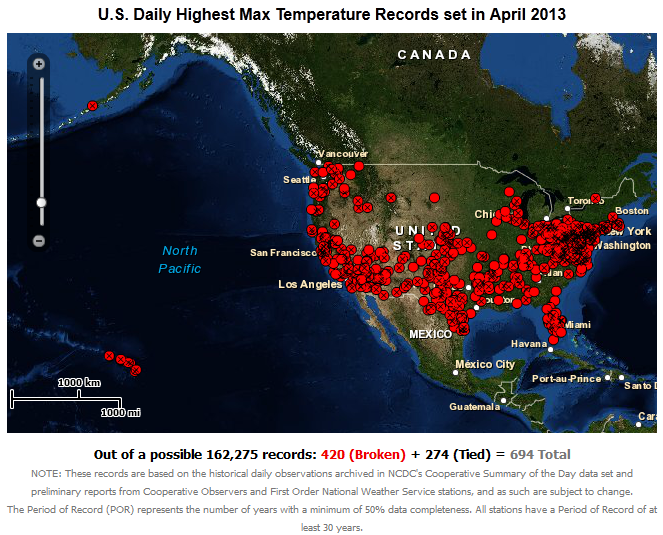
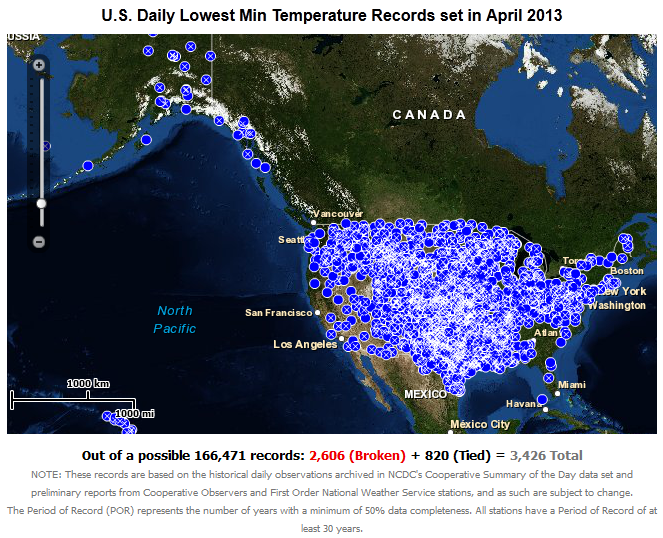
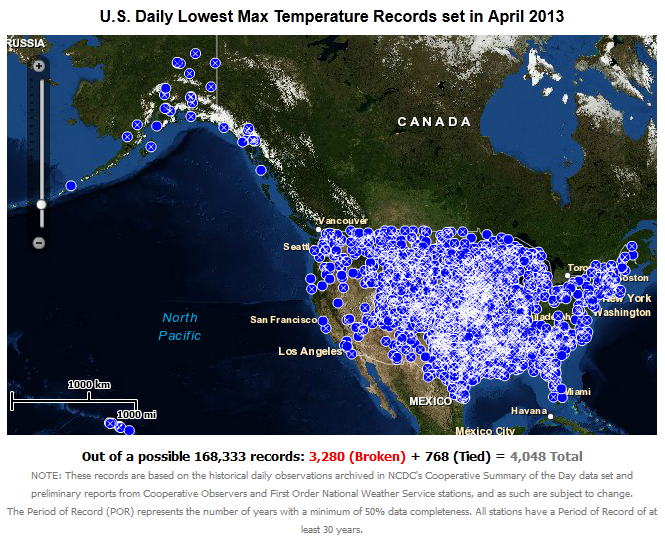
- number of record warm daily low temperatures, record daily high temperatures, record daily low temperatures, and record cool daily high temperatures, set during the month (from NCDC's daily records analysis) — more than three times as many record cool high and low temperatures occurred as record warm highs and lows.
![NOAA National Weather Service [NWS]](/monitoring-content/sotc/drought/2013/04/noaa-nws-ahps-pcp-amt-us-mtd-0430.jpg)
![NOAA High Plains Regional Climate Center [HPRCC]](/monitoring-content/sotc/drought/2013/04/noaa-hprcc-pcp-amt-us-1m-0430.png)
Regional Discussion
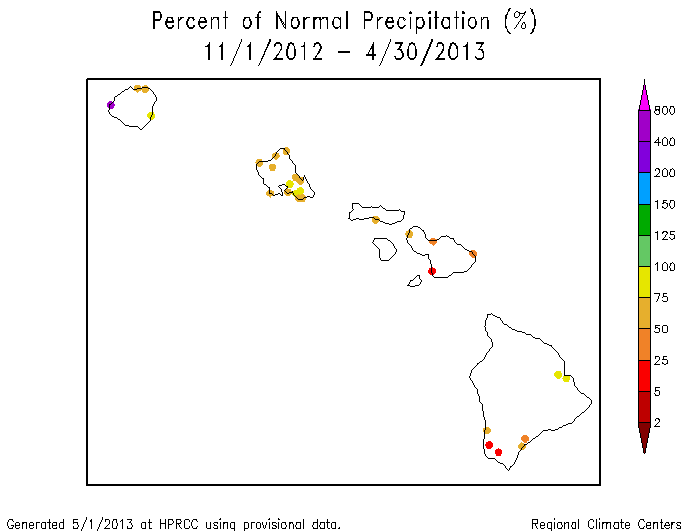
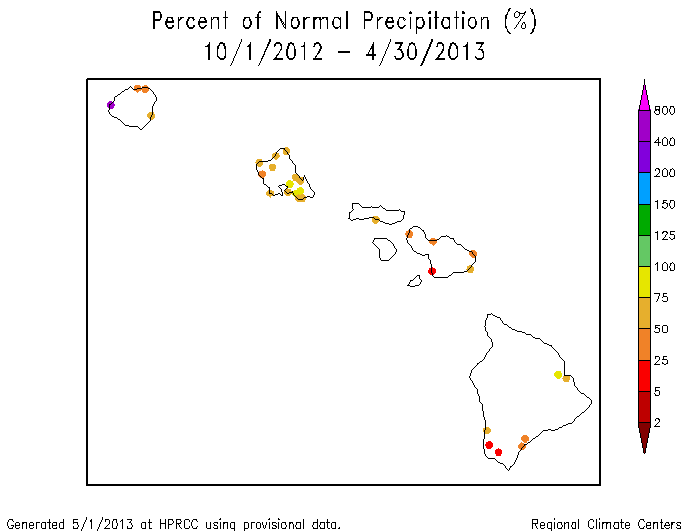
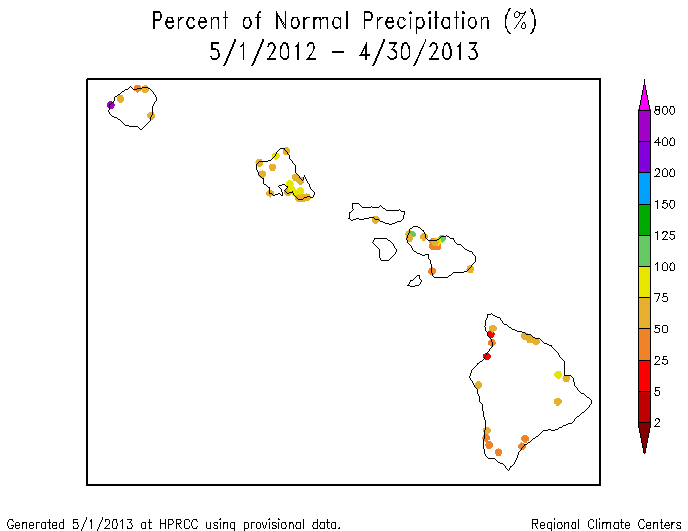
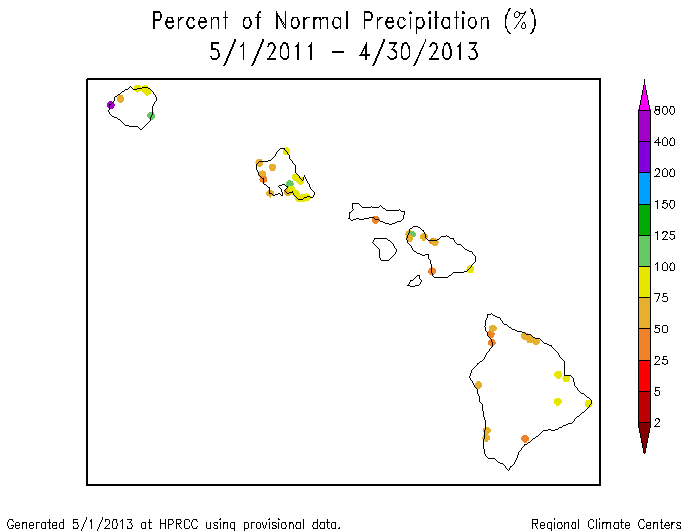
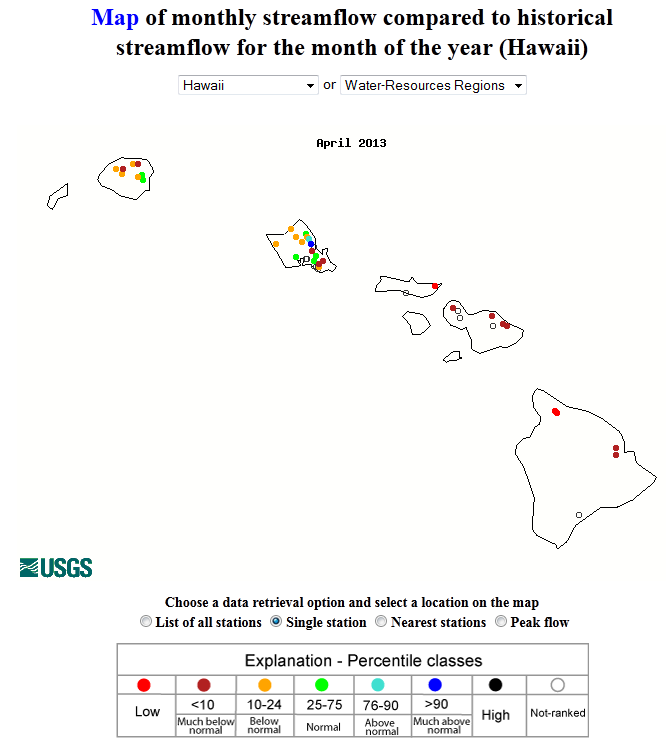
Hawaii: April 2013 was drier than normal for stations in the southeastern Hawaiian Islands but wetter than normal for some in the northwestern islands. This pattern is evident in the precipitation anomaly maps for the last 2, 3, and 4 months. A more widespread pattern of below-normal rainfall is evident at longer time scales (6, 7, 12, 24, and 36 months). Streamflow across the main islands averaged below normal. The percent of the state experiencing moderate to extreme drought area fell slightly from 43 percent last month to 40 percent this month.
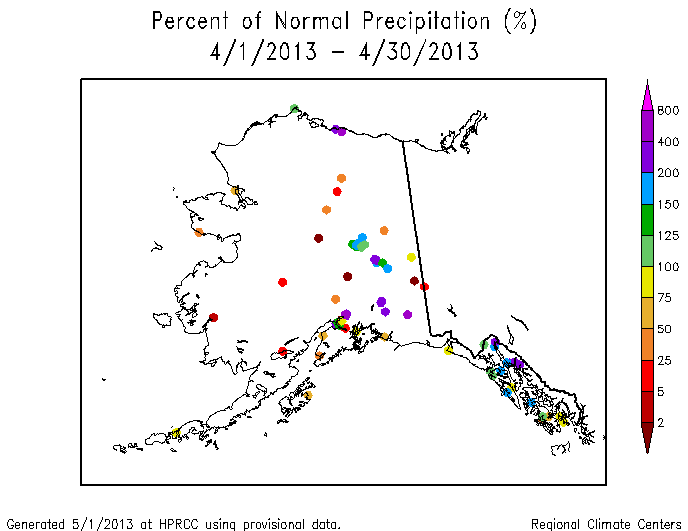
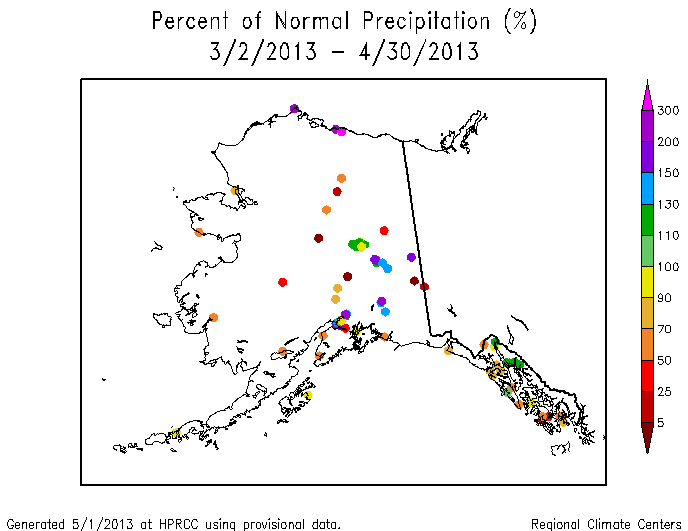
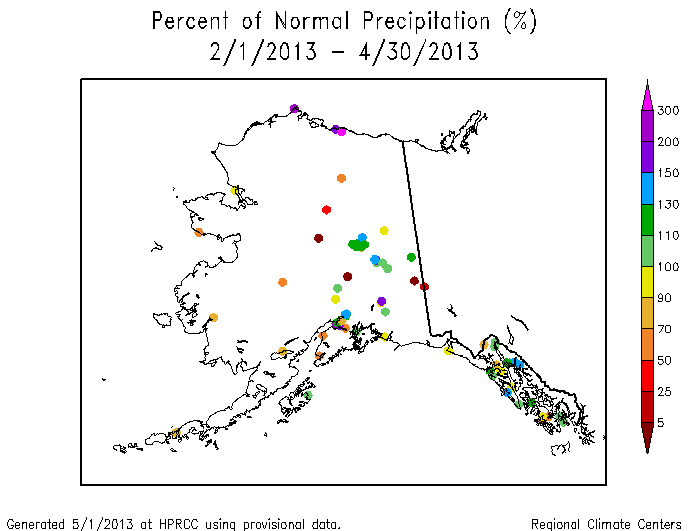
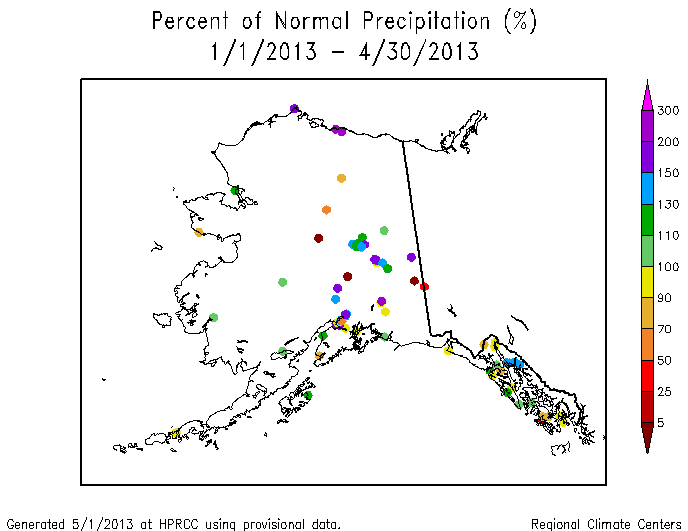
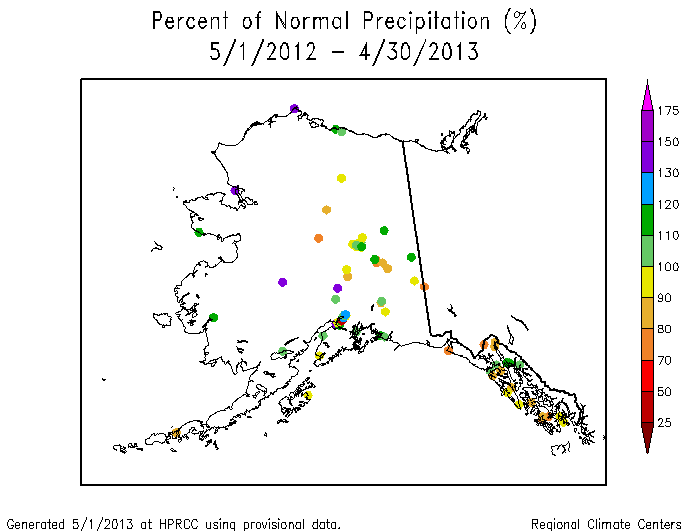
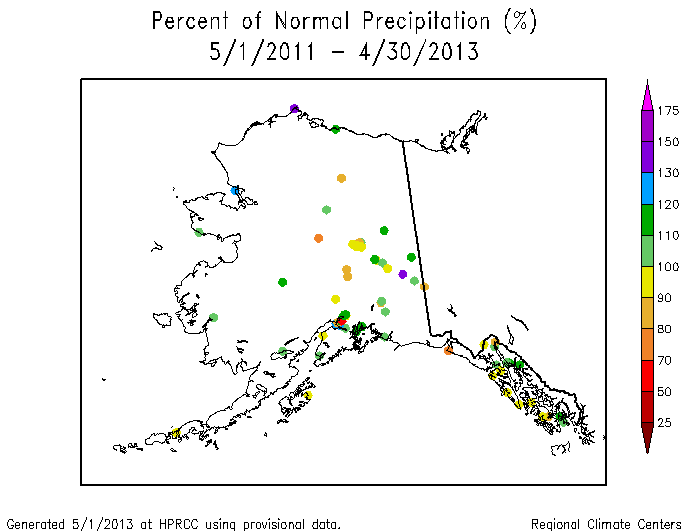
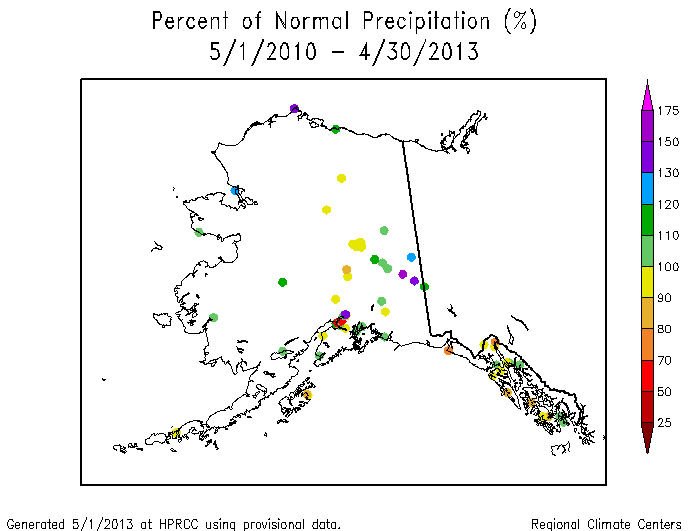
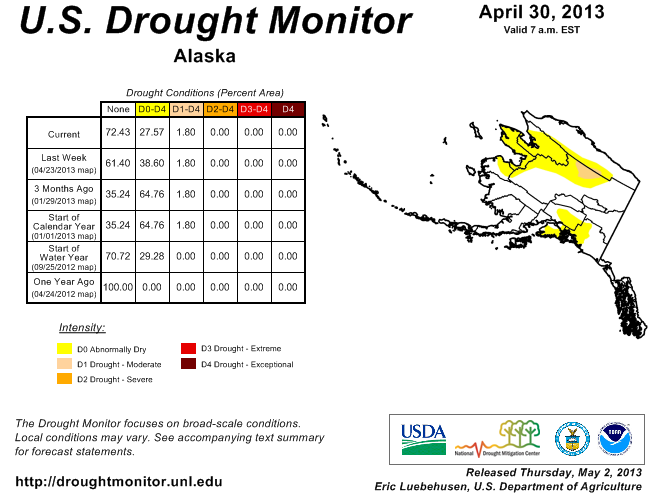
Alaska: The precipitation pattern in April 2013 was mixed, with generally drier-than-normal conditions in the west and south (especially the southwest) and wetter-than-normal conditions in the north and east. The pattern becomes even more mixed at the intermediate time scales with dryness shifting to the central and southeastern stations at the longest time scales (2, 3, 4, 6, 7, 12, 24, and 36 months). Abnormal dryness now covers about a fourth of the state on the USDM map with a spot of moderate drought continuing in the Koyukuk Basin where the water content of the snow pack and water-year-to-date (October-present) precipitation were low.
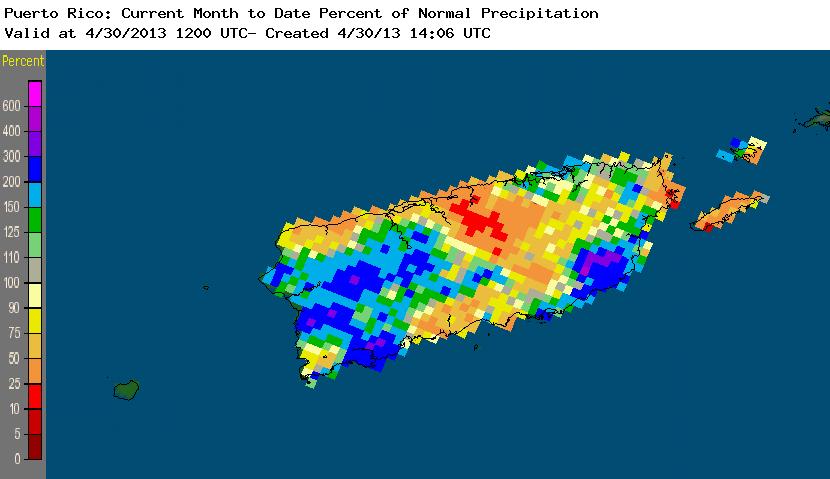
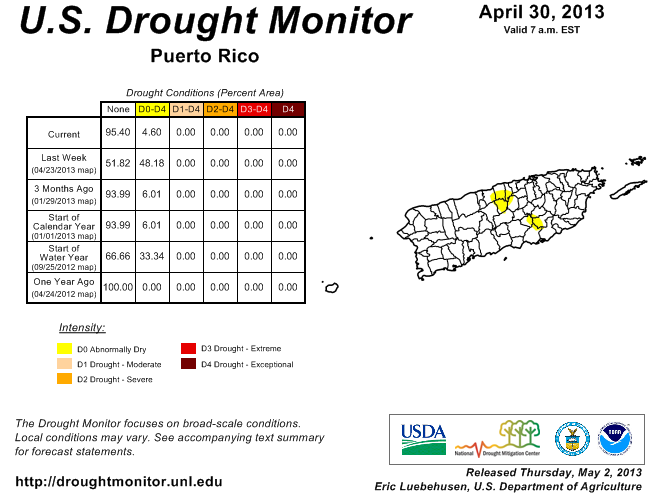
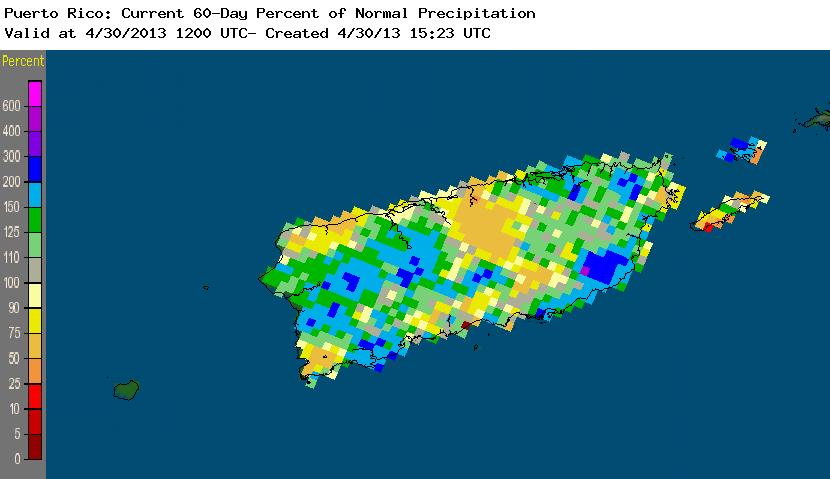
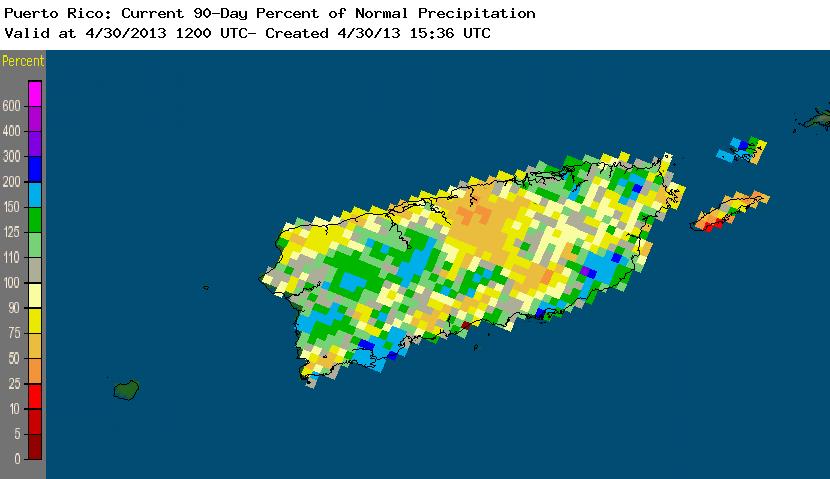
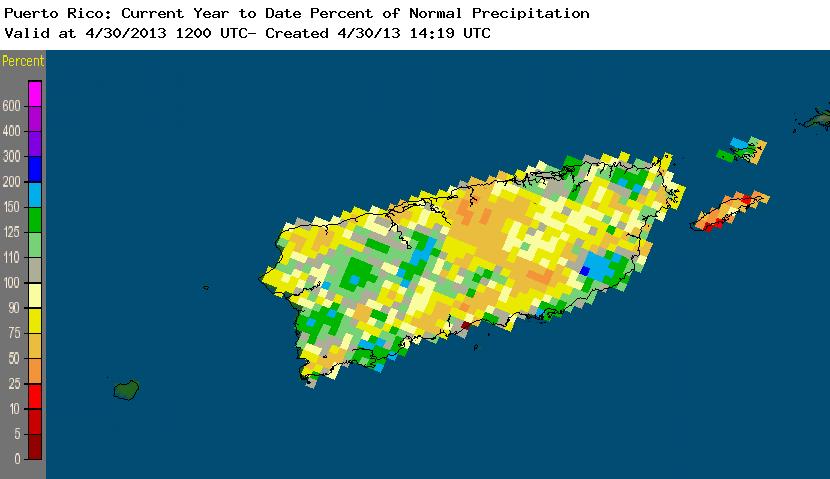
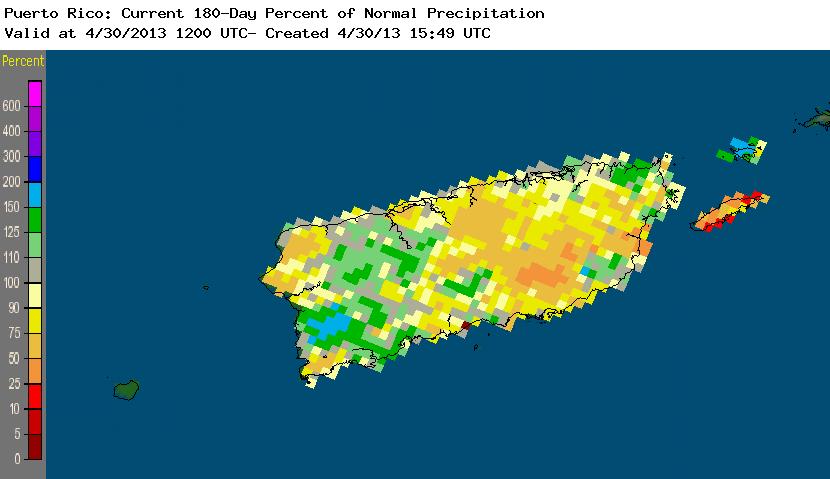
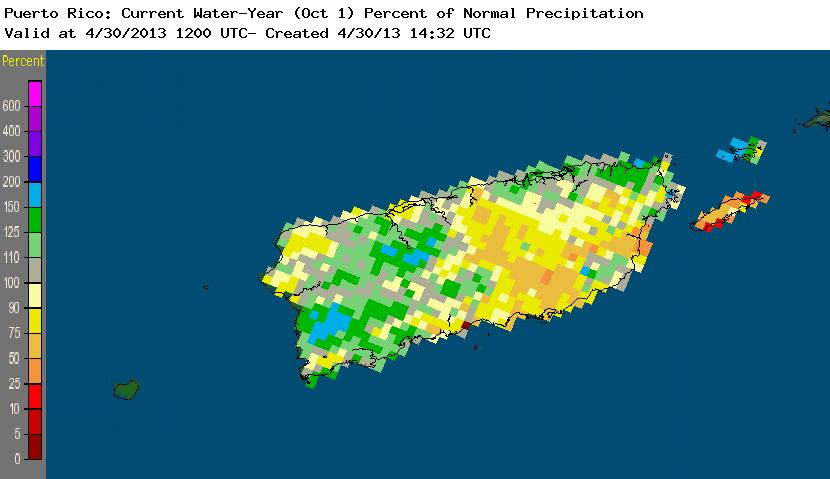
Puerto Rico: Above-normal precipitation fell over western and southeastern parts of Puerto Rico during April, considerably shrinking the abnormally dry area on the USDM map. But spots of abnormally dry (D0) remained, reflecting dryness in the central regions at longer time scales (last 2, 3, 4, 6, and 7 months).
 |
|
On a statewide basis, April 2013 ranked in the top ten driest category for Connecticut (sixth driest) and was eleventh driest for Rhode Island and twelfth driest for New Mexico. Nine other states ranked in their driest third of the historical record. At the other extreme, Iowa and Michigan had the wettest April in the 1895-2013 record. Dryness for the last three months was centered in the West, Southern Plains, and Northeast, where 19 states ranked in the driest third of the historical record — four of which (California, Idaho, Oregon, and Nevada) had a top ten driest February-April 2013, with California ranking second driest.
|
|
The year to date (January-April 2013) was drier than normal in the West and Northeast. Eight states — four in the West (California, Nevada, Idaho, and Oregon) and four in New England (Connecticut, Maine, New Hampshire, and Vermont) — ranked in the top ten driest category, with 14 others ranking in the driest third of the historical record. California had the driest January-April in the 119-year record.
|
|
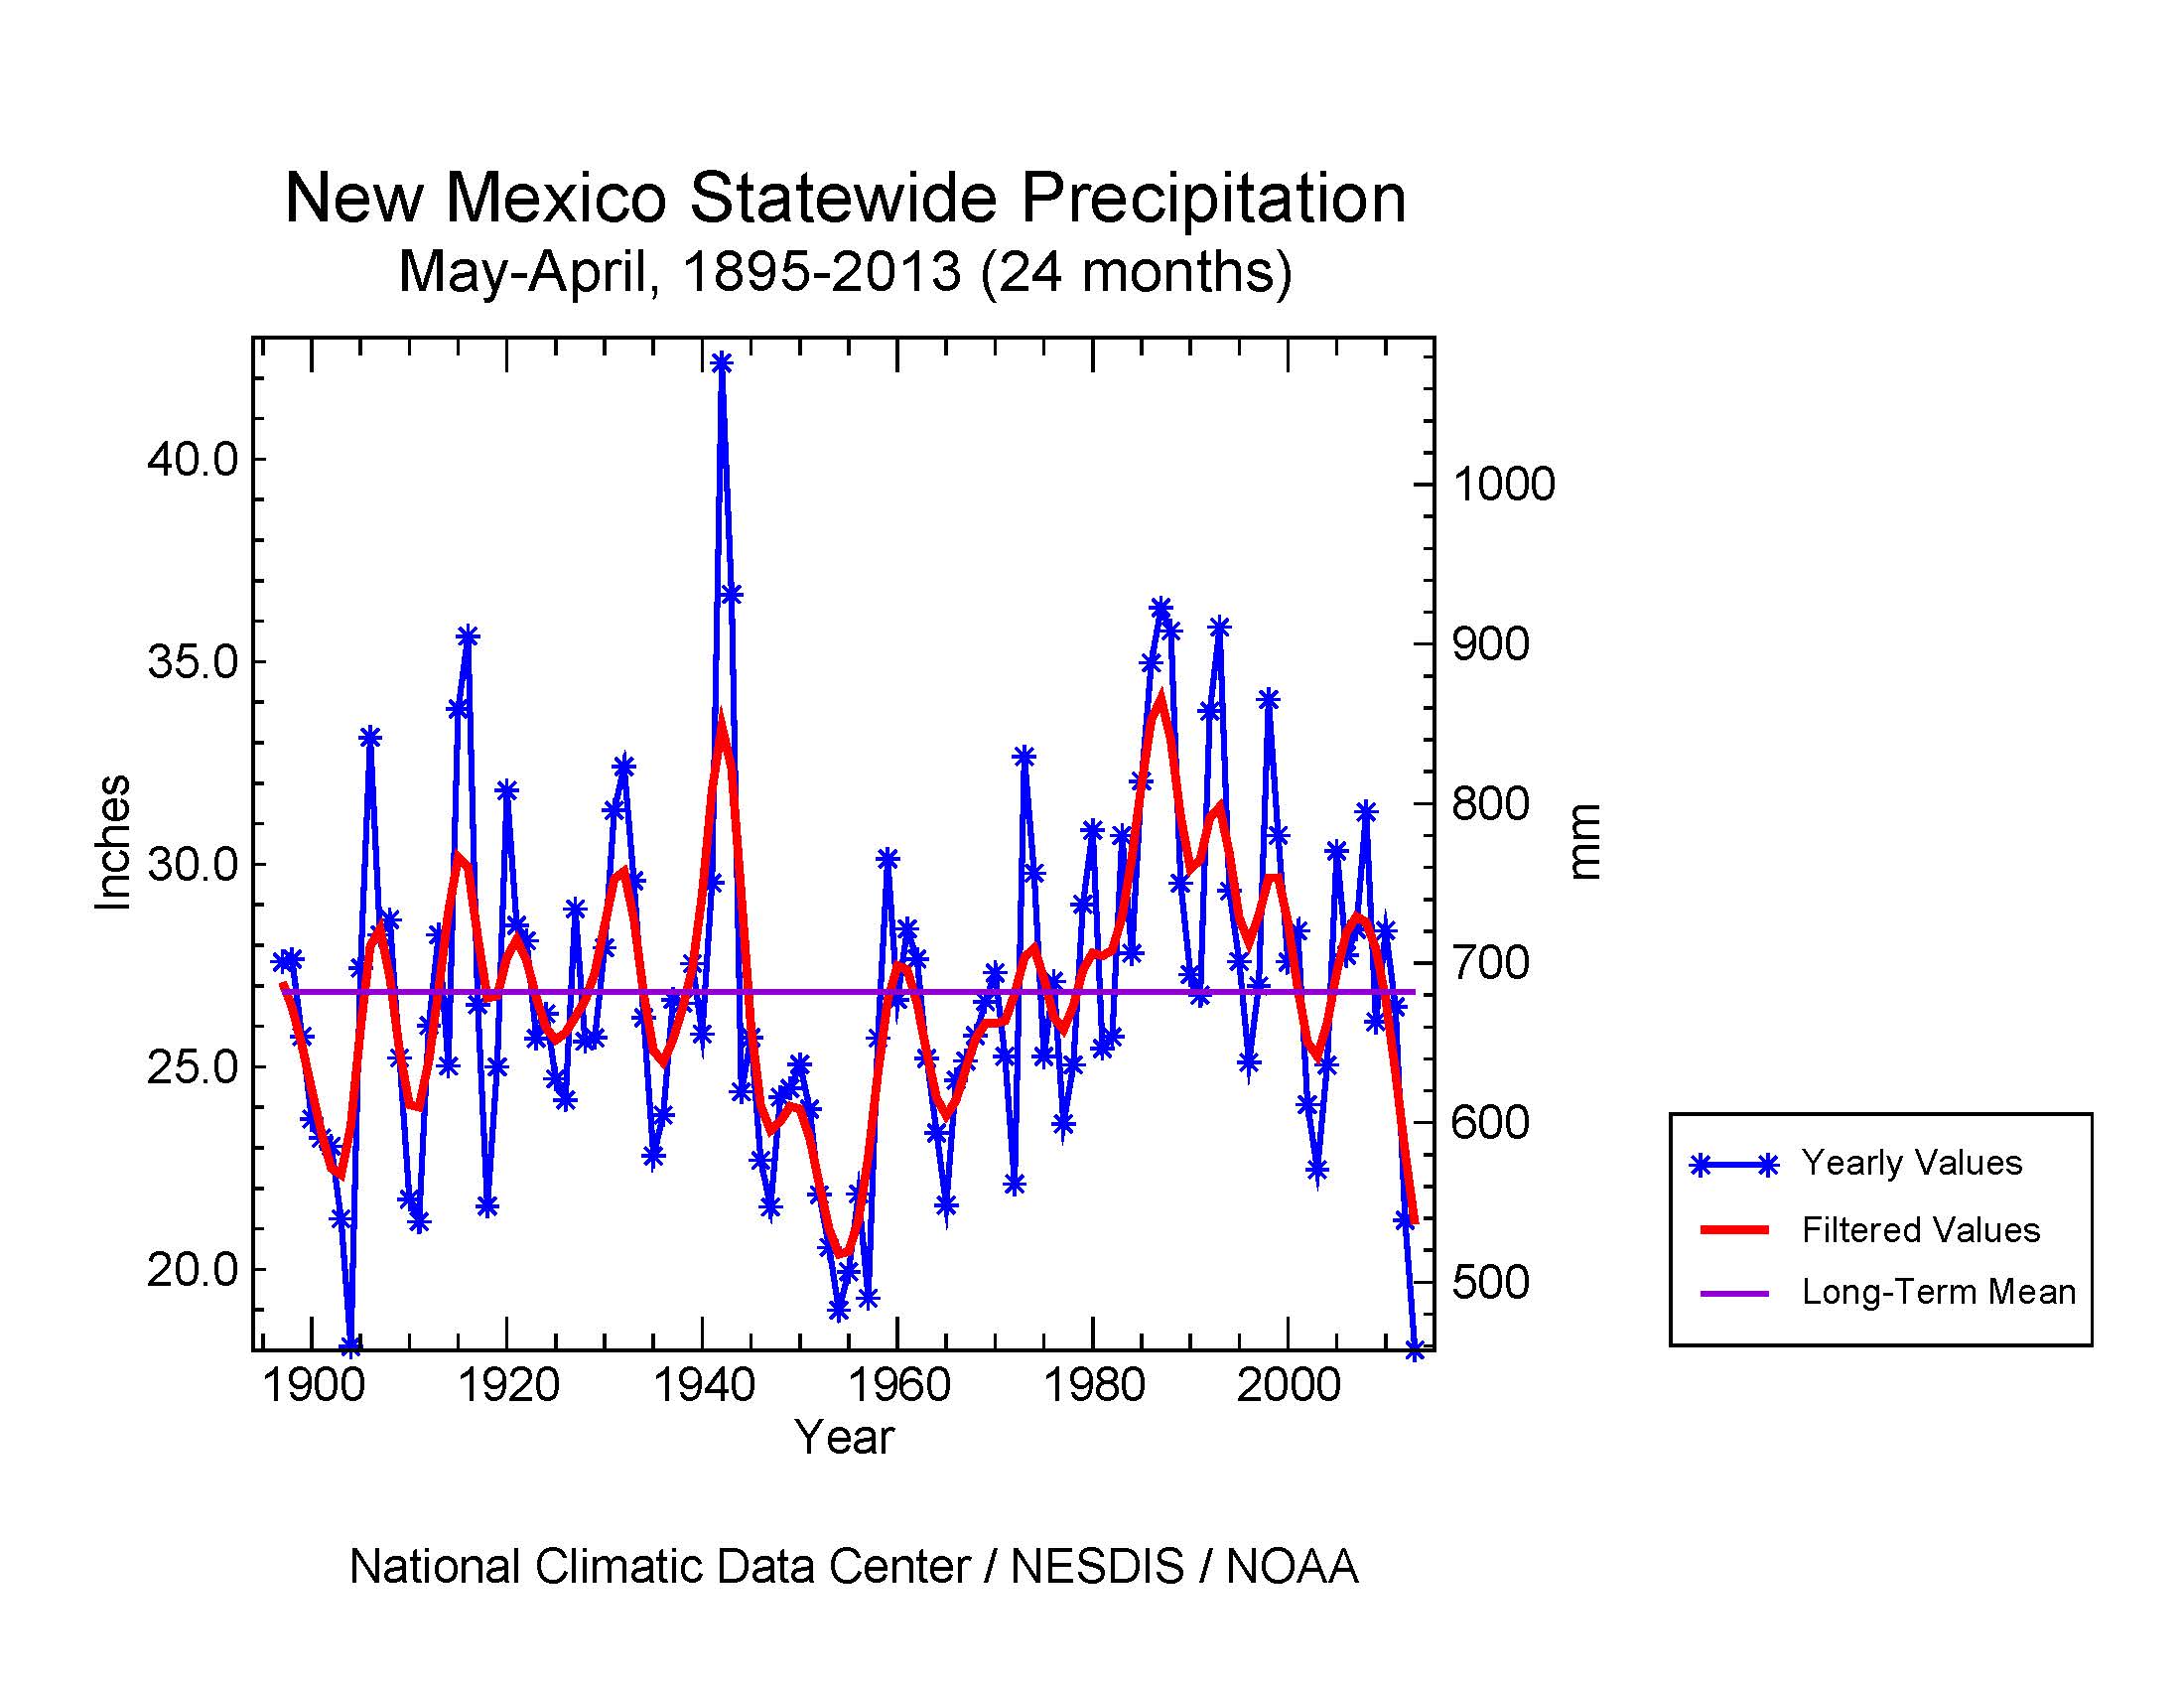
The dryness in the Northeast and West (and Southern Plains) extended back six months, with Connecticut having its second driest November-April and New Hampshire its fifth driest. Fourteen other states ranked in the driest third of the historical record. The last twelve months were the driest May-April on record for Nebraska and New Mexico, second driest for Wyoming, third driest for Kansas, and fourth driest for Colorado. Three other states (California, Oklahoma, and South Dakota) fell in the top ten driest category, while an additional eleven ranked in the driest third of the historical record for May-April. Nebraska and New Mexico also had the driest June-April. The dryness was so prolonged in New Mexico that the state also had the driest 24-month period (May 2011-April 2013).
|
|
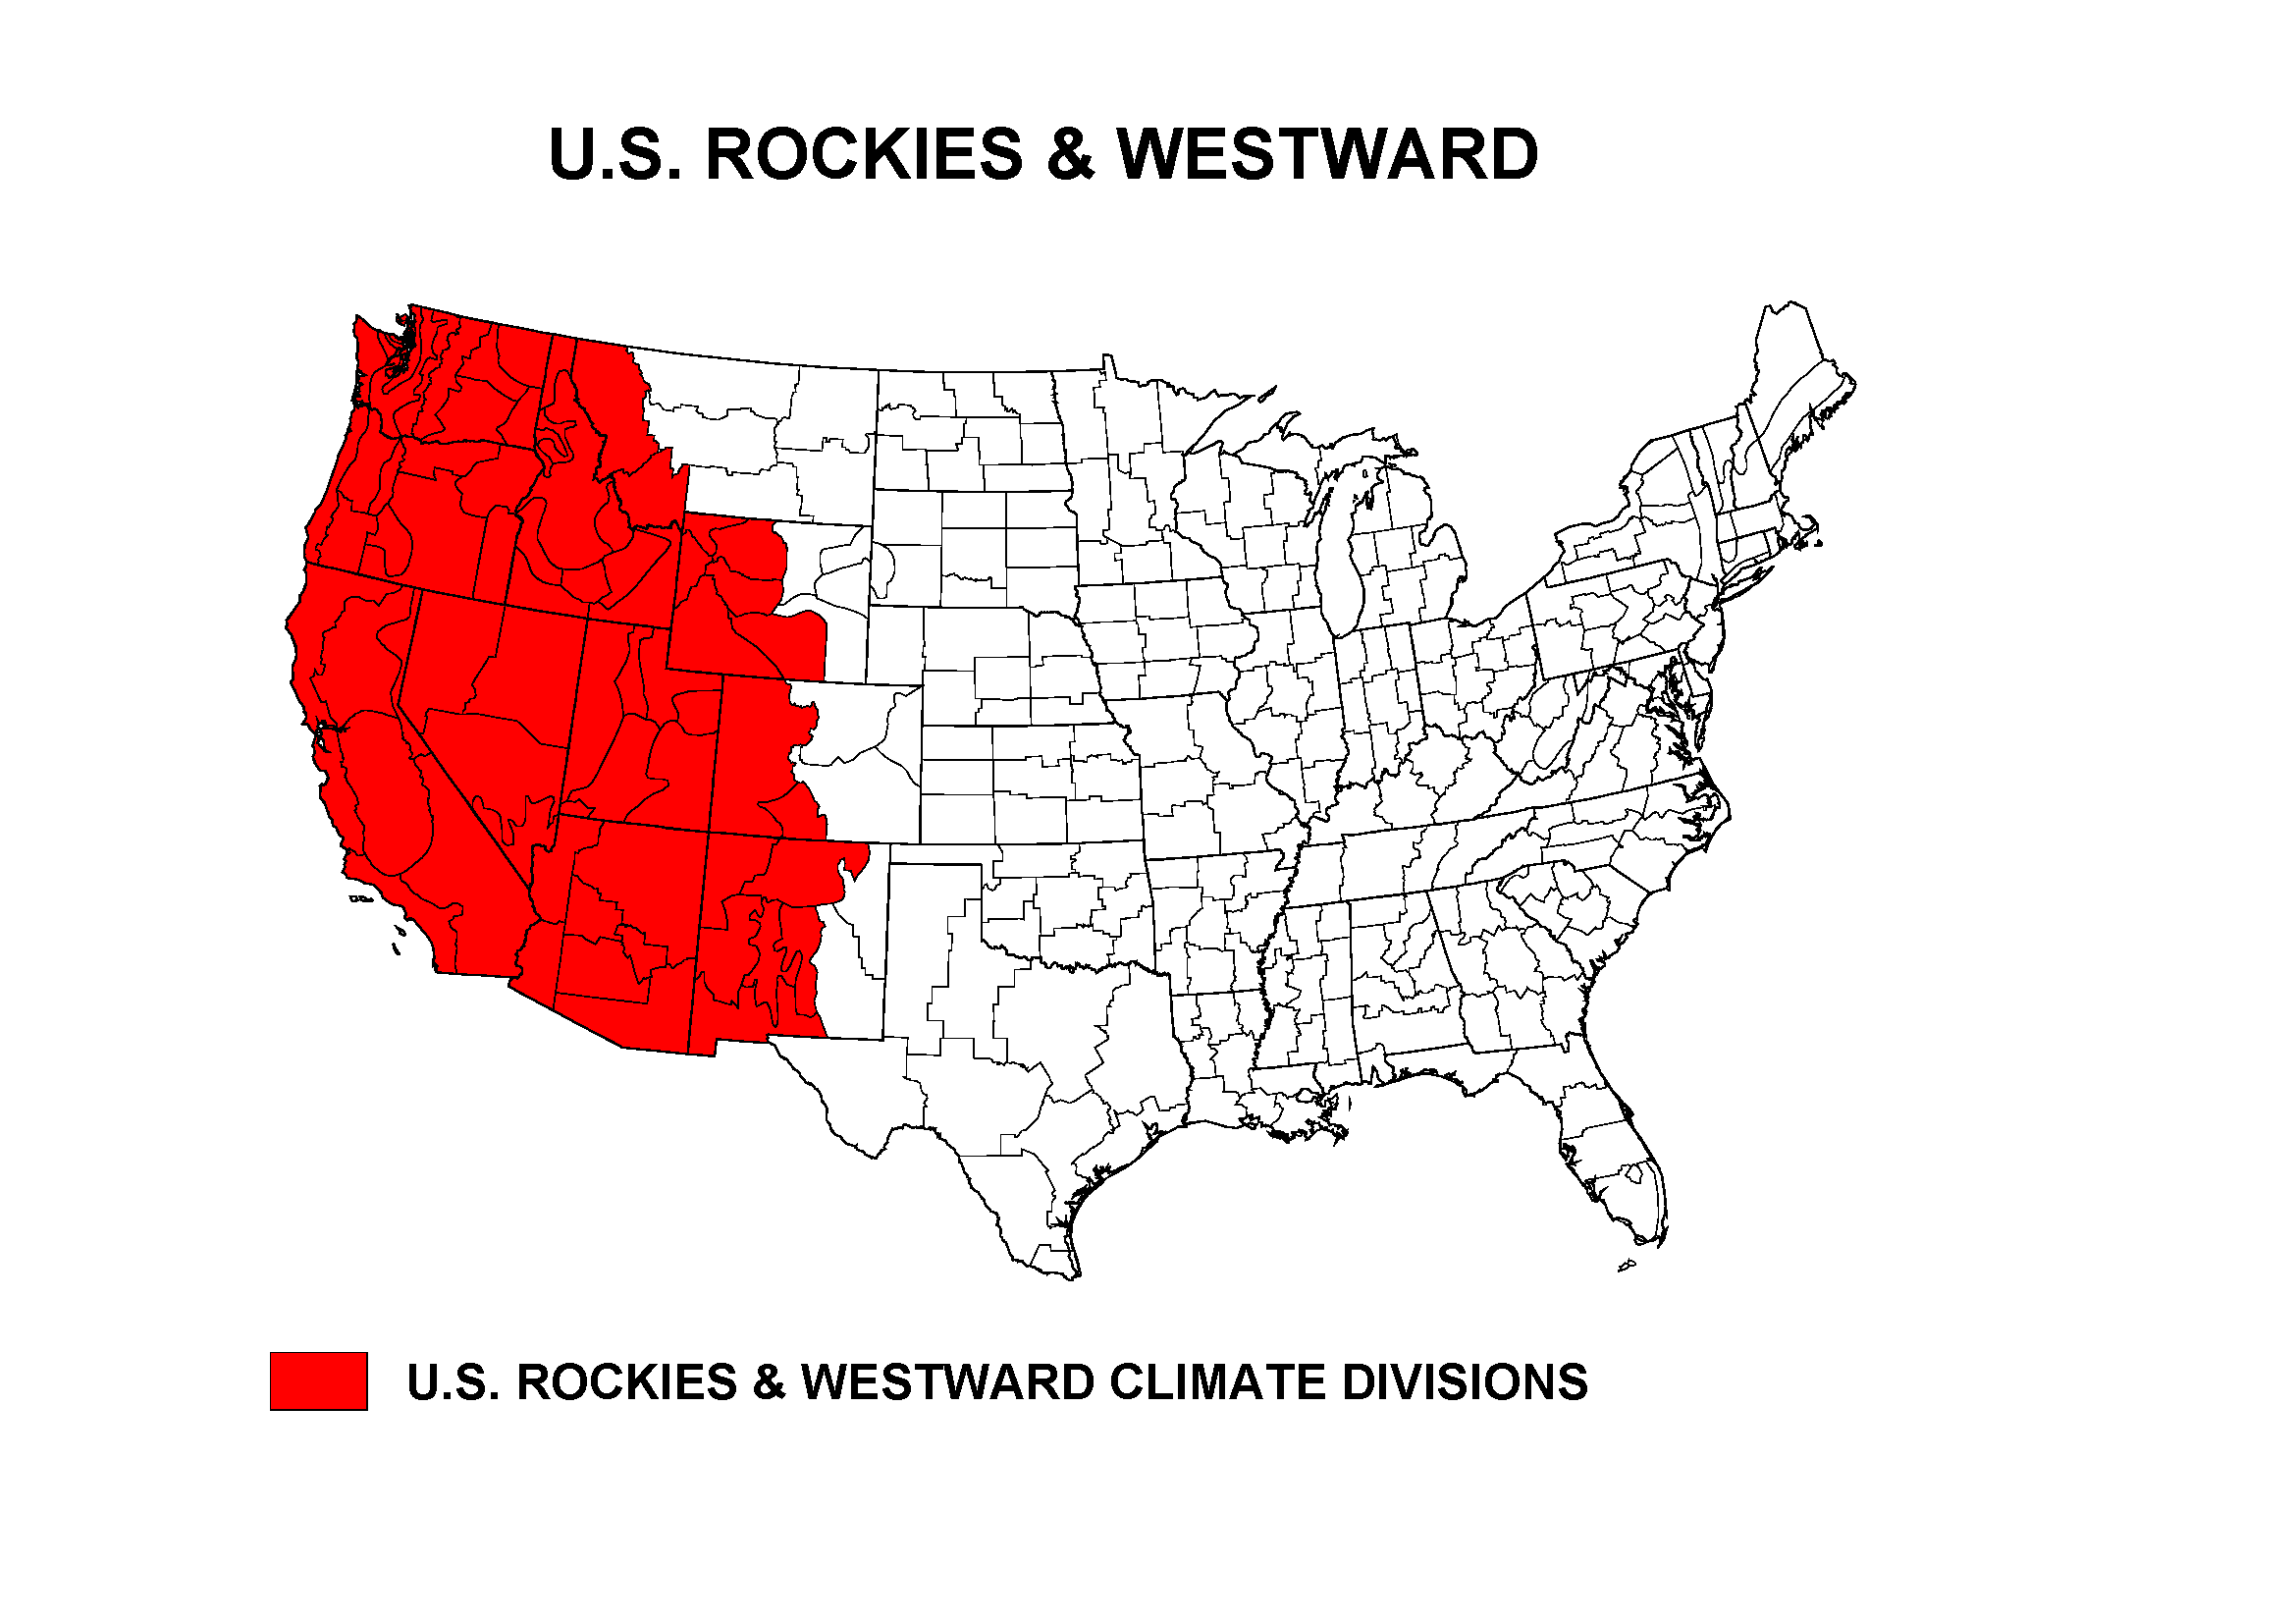
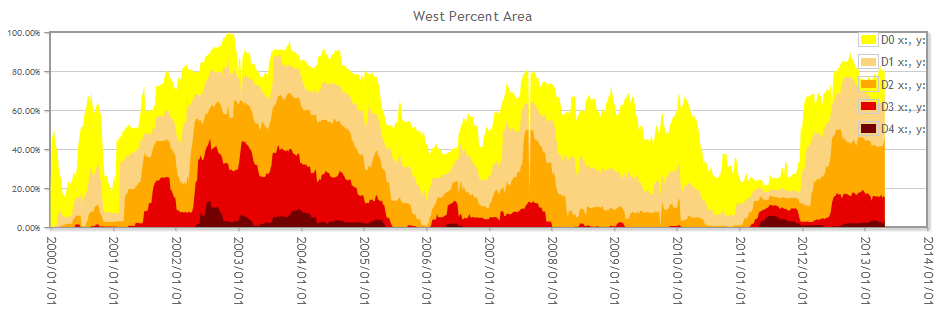
Percent area of the Western U.S. in moderate to extreme drought, January 1900 to present, based on the Palmer Drought Index.
New Mexico Central Highlands PMDI, January 1900-April 2013.
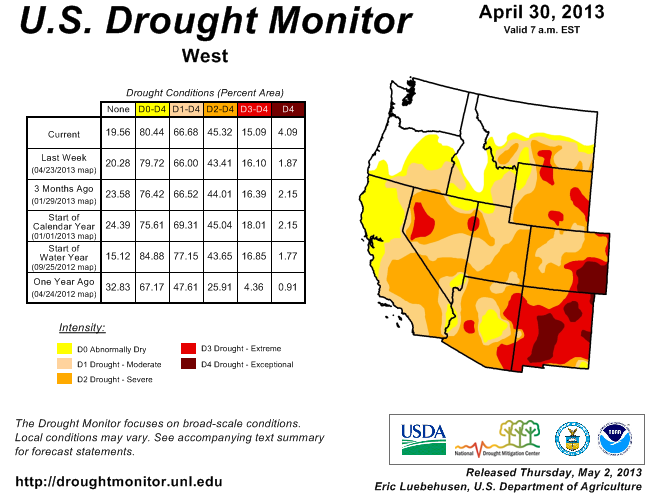
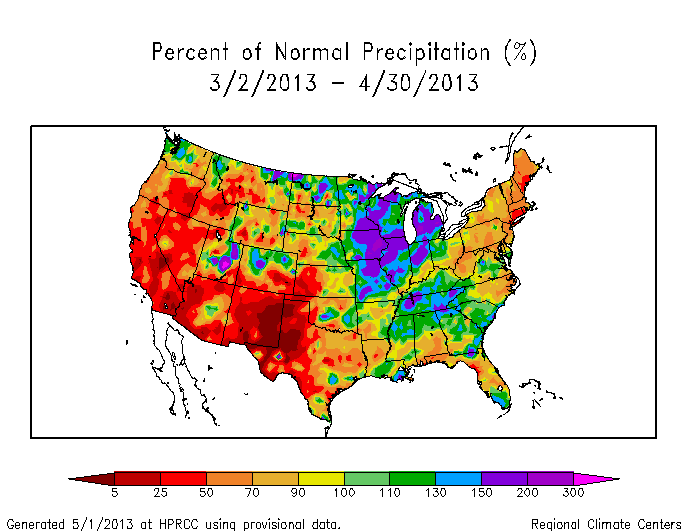
April 2013 was drier than normal for much of the West, with the last four months having record dry conditions, especially along the coastal states (as noted above). Water year-to-date (October-present) precipitation was below normal for much of the West, especially the southern portions. Only a few areas, primarily the northern basins, averaged near to above normal. This pattern is evident in both the high elevation (SNOTEL) station percentiles and basin averages, as well as in low elevation station observations and 6-month SPI. Snow pack water content (station percentiles and basin percent of normal) was much below-normal in the southern to western basins of the West, but snow water content was near to above normal for this late in the snow season for the higher basins of the Central to Northern Rockies and far northern basins of the Pacific Northwest. The lack of source meltwater (from the mountain snowpack) was reflected in low streamflows for many western basins. Reservoir storage was below average in several states in the Southwest (Arizona, Colorado, New Mexico) and Great Basin (Nevada) but near to above average in the other states. New Mexico and Arizona reservoirs were significantly low, with the Elephant Butte Reservoir in New Mexico's chile belt at 10 percent of capacity, the lowest amount of water available for irrigation in almost 100 years. Integrated satellite and ground observations of vegetation condition (VegDRI) indicated widespread stress on vegetation across the West. According to the USDM, 66.7 percent of the West was experiencing moderate to exceptional drought at the end of April, an increase over last month. The Palmer Drought Index percent area statistic was 71.6 percent, about the same as last month. The dryness in New Mexico has been so severe and prolonged that the PMDI for New Mexico's Central Highlands (climate division 6) continued to hover near the record low levels set only a couple years ago.
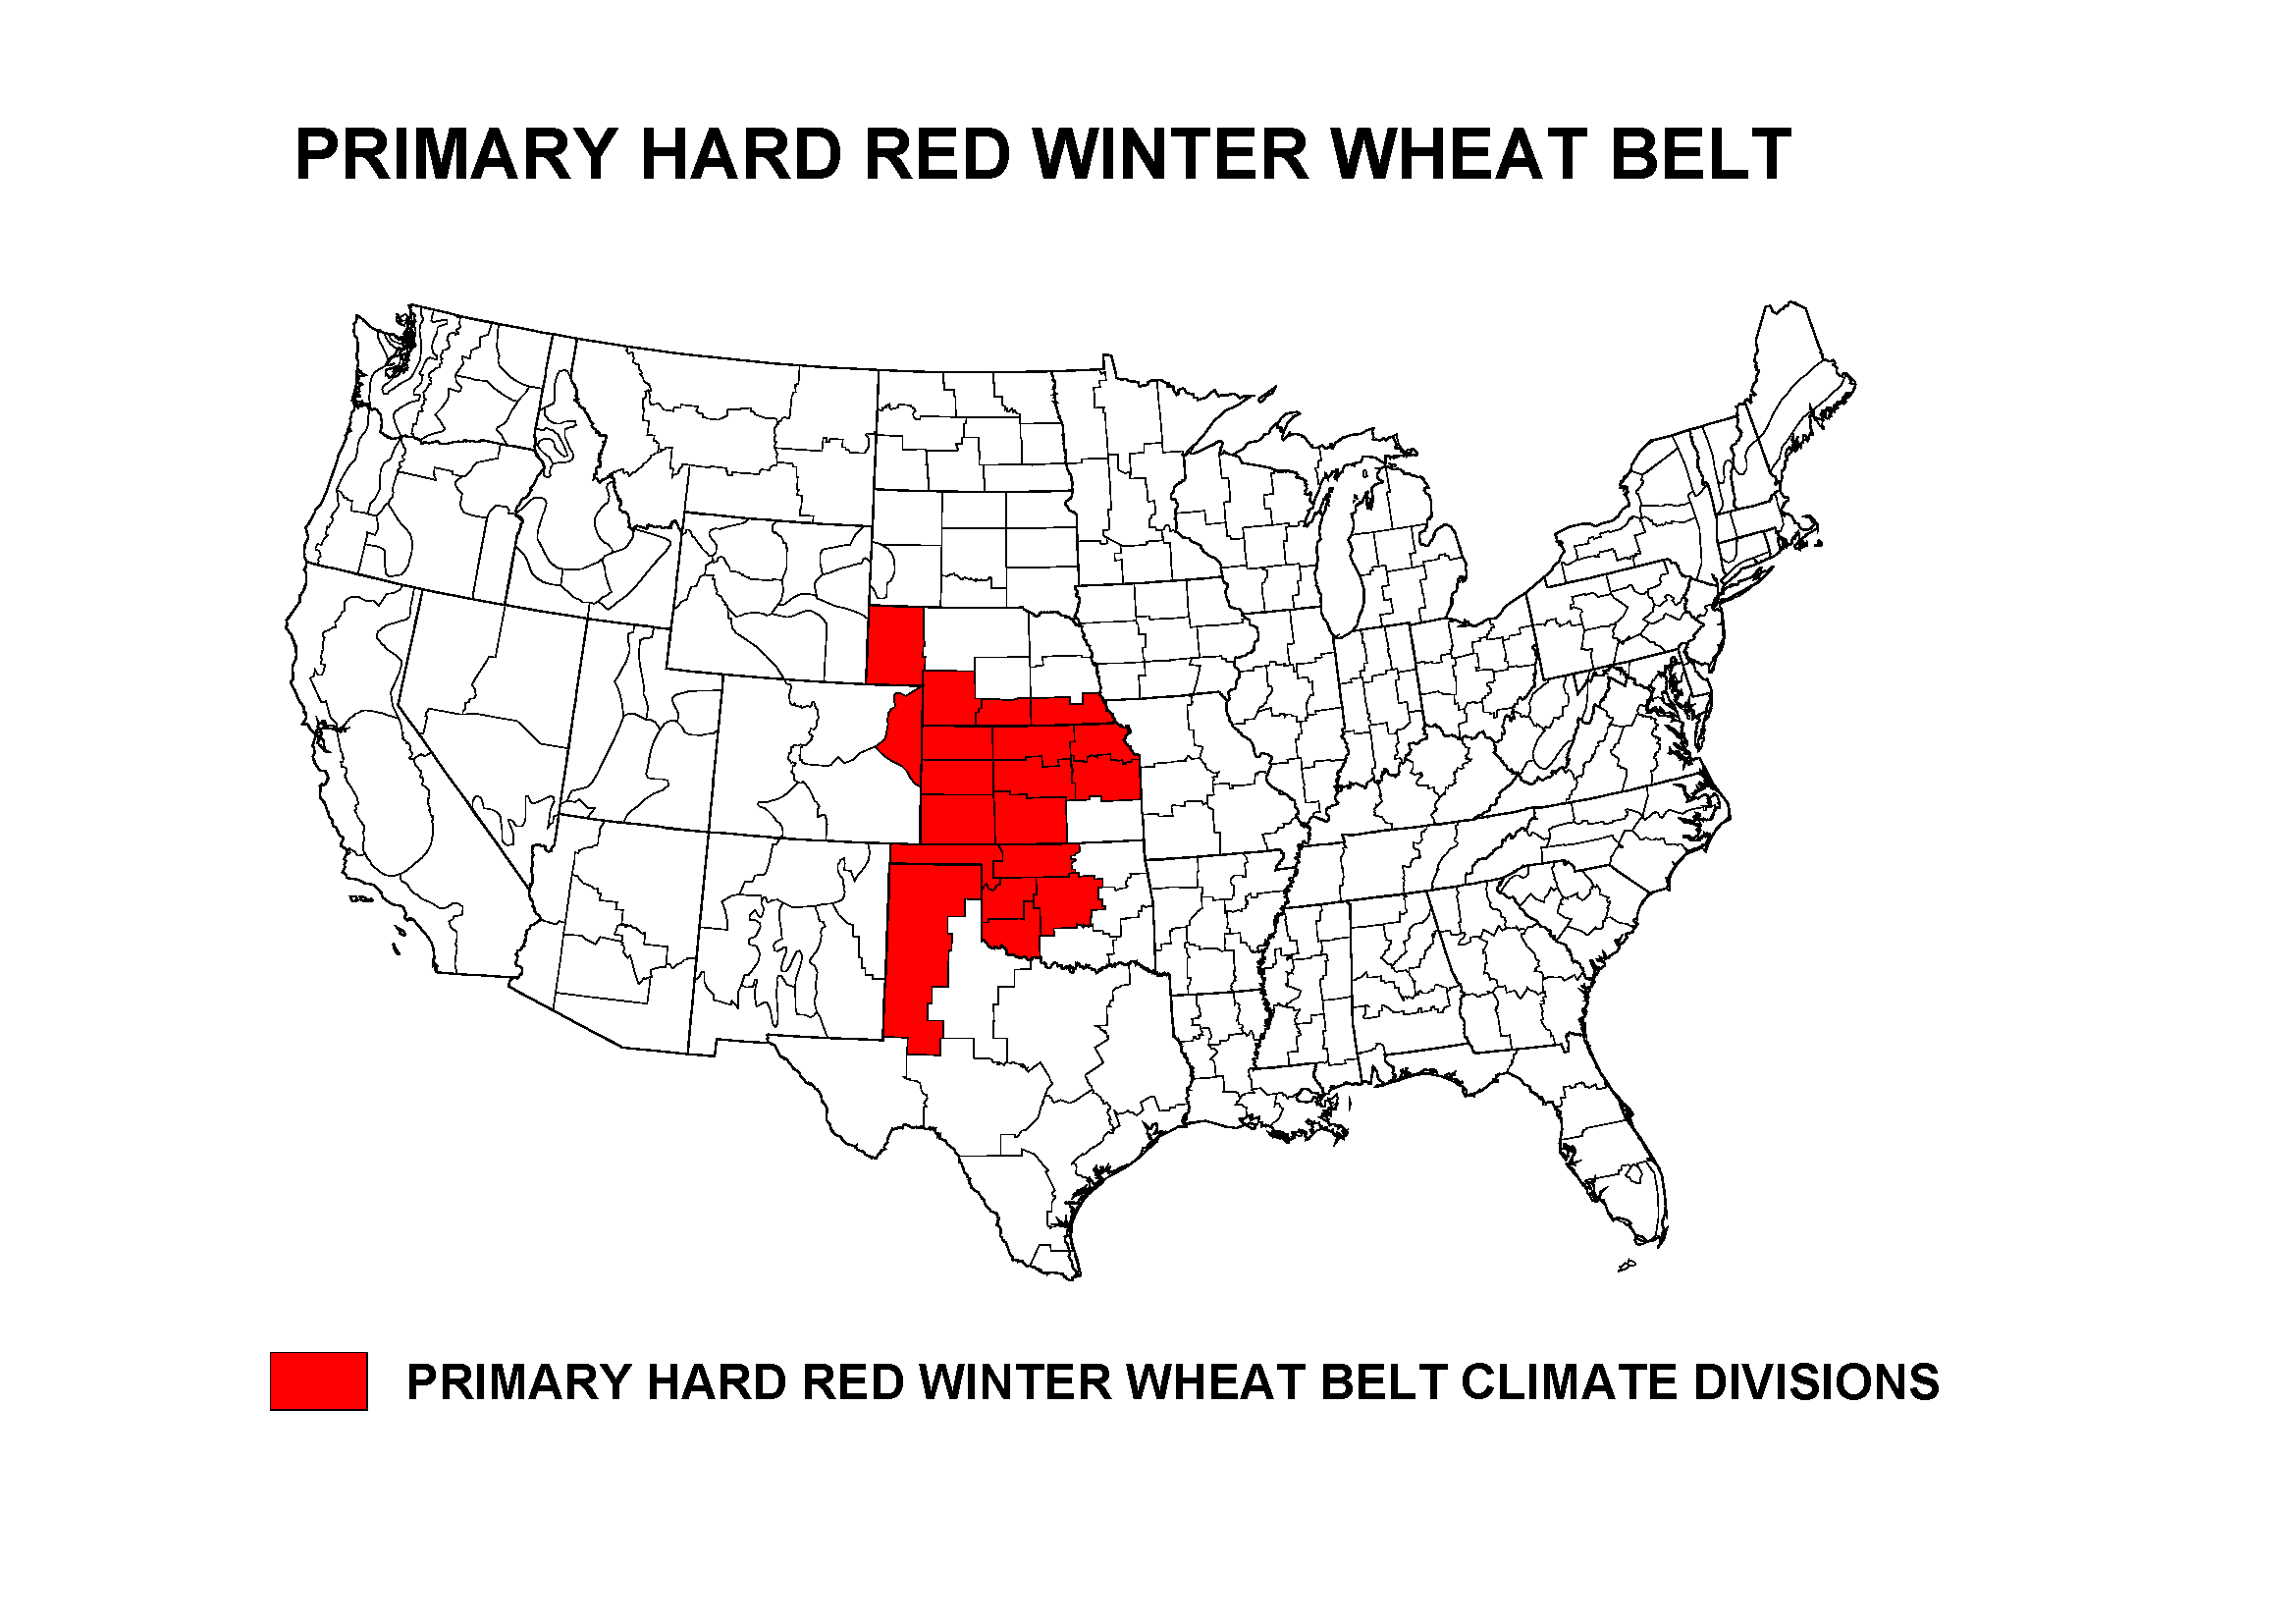
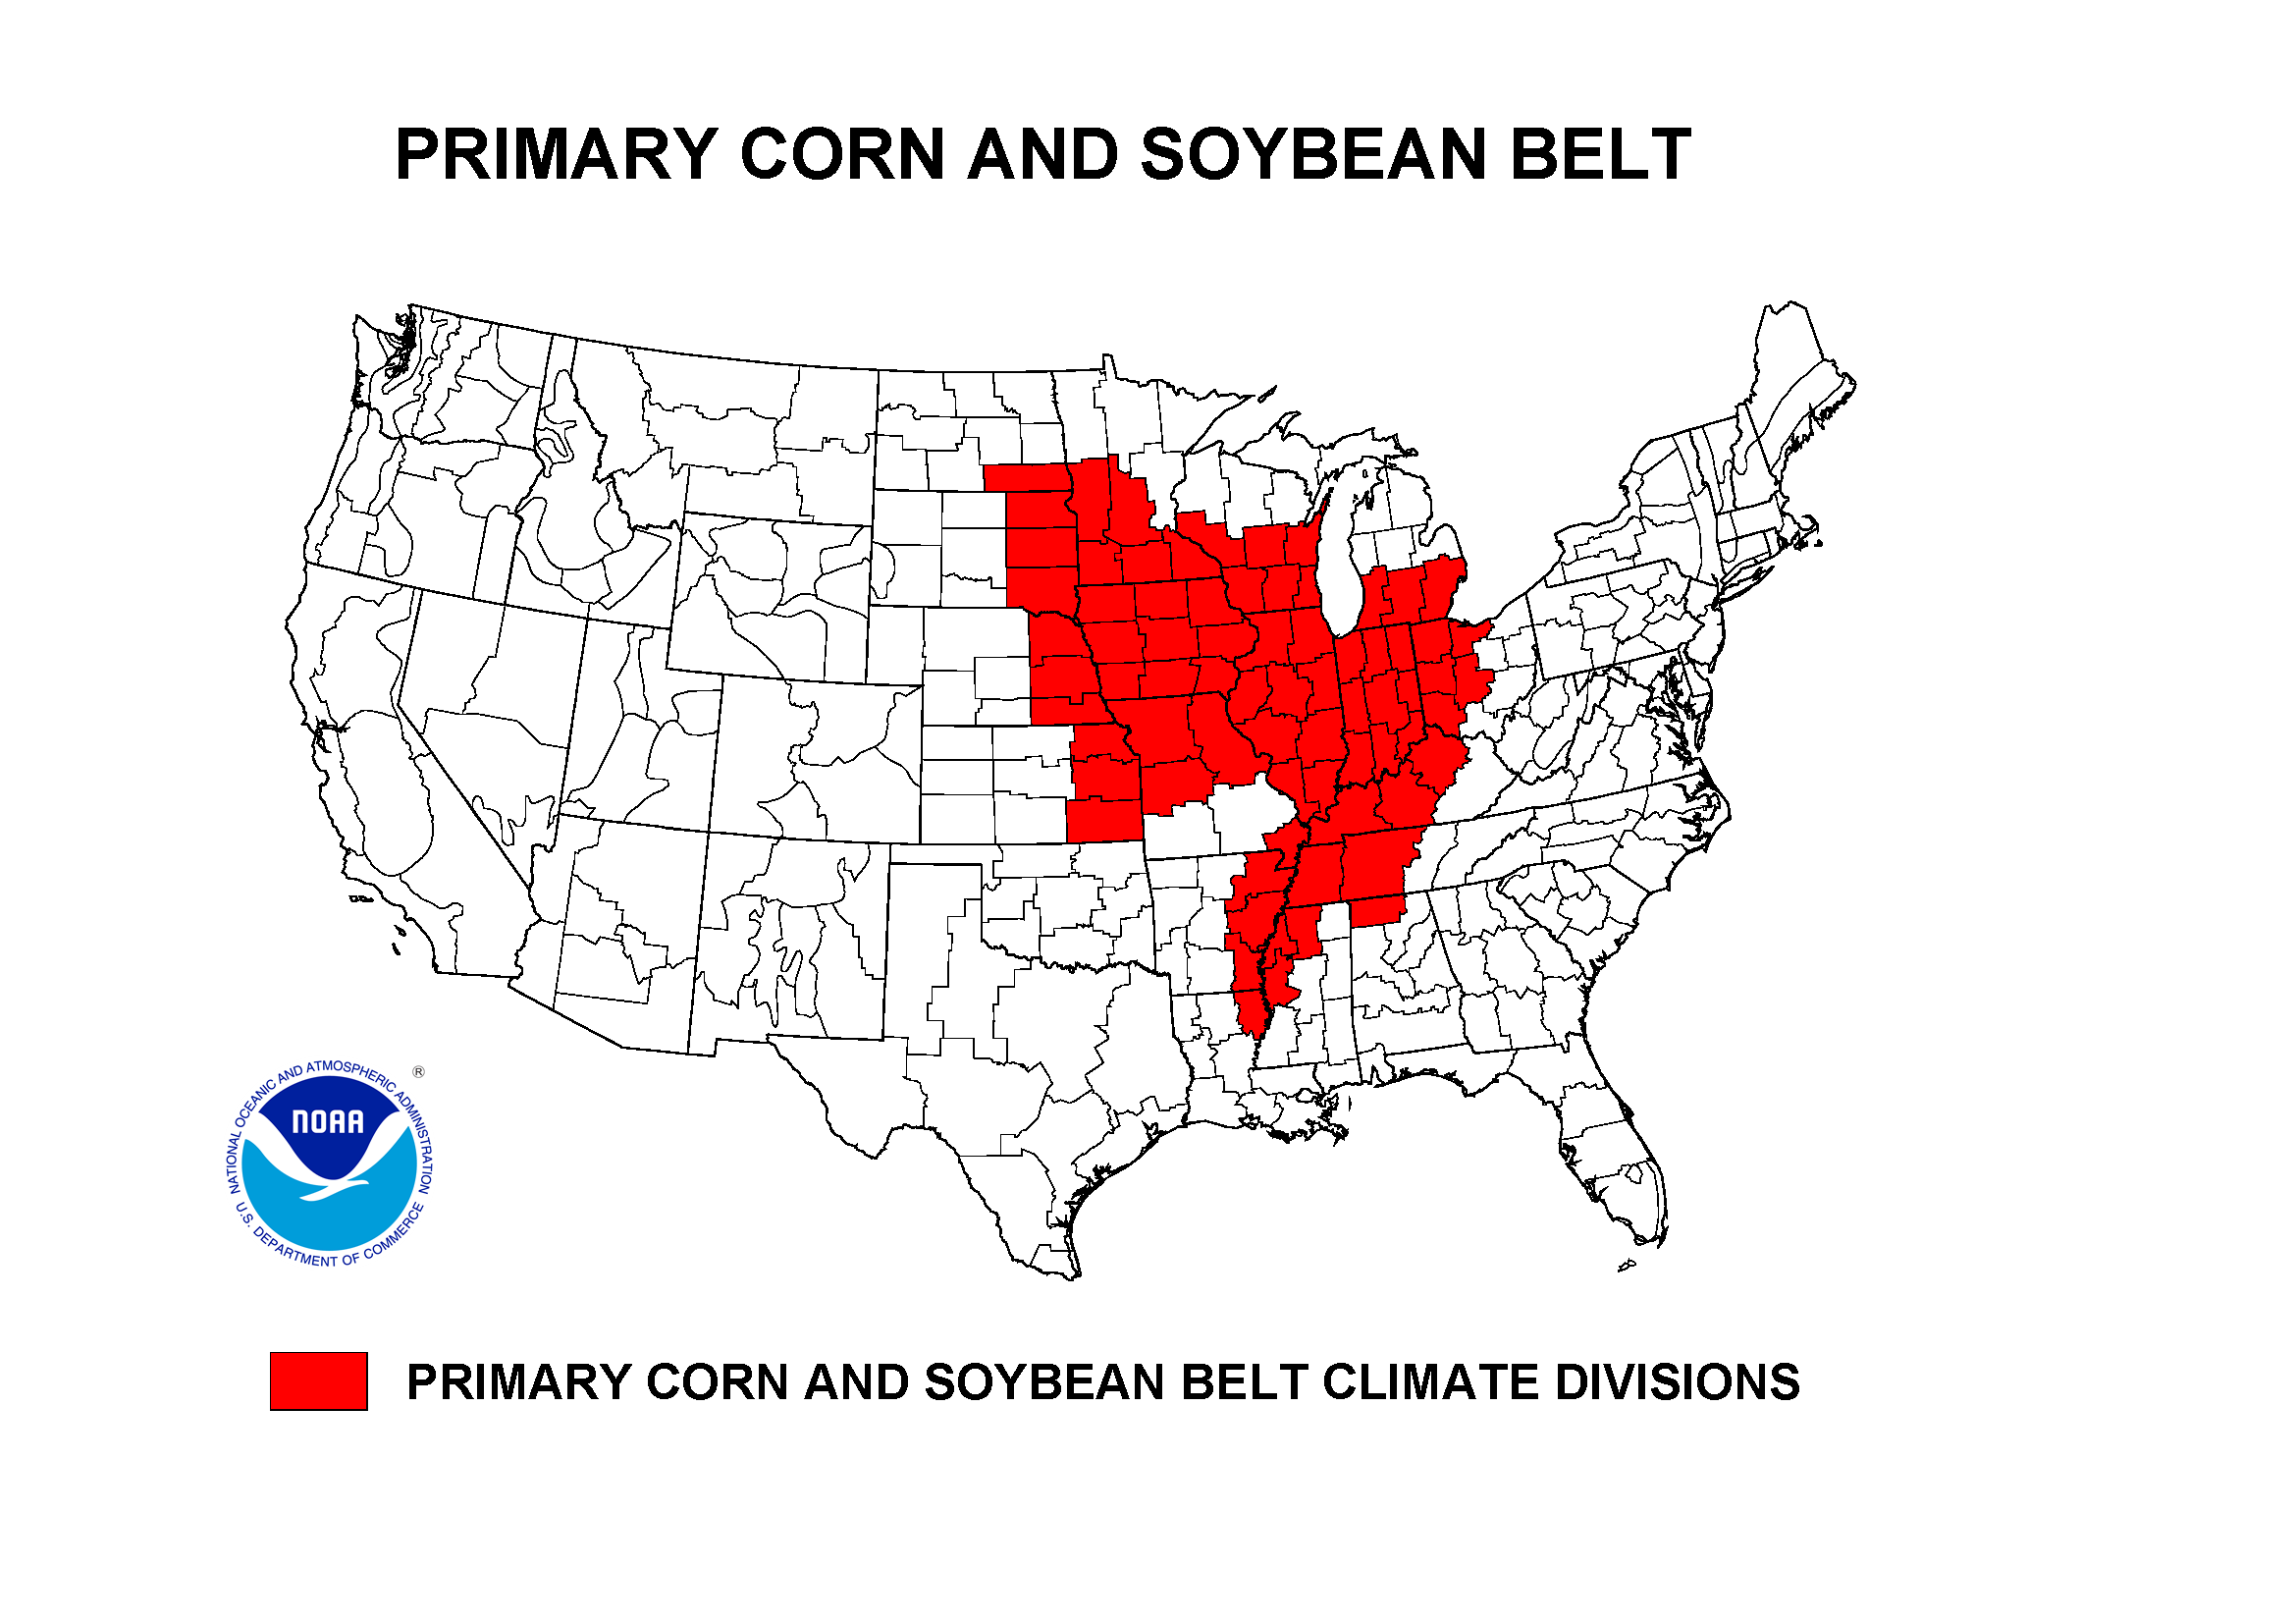
Primary Hard Red Winter Wheat Belt
|
 |
Eastern and northern parts of the Primary Hard Red Winter Wheat agricultural belt received above-normal precipitation during April 2013, but the western and southern areas were dry, with the result for the region as a whole being the 56th wettest April in the 1895-2013 record. For the growing season as a whole, this region had the 34th driest October-April in 2013. April 2013 ranked as the sixth coldest April, but earlier warmth gave October 2012-April 2013 a mid-range rank of 57th coldest regionwide.
|
 |
The Primary Corn and Soybean agricultural belt was extremely dry during 2012. In contrast, the beginning of the 2013 growing season has been very wet. April 2013 was the third wettest April in the 1895-2013 record, with March-April 2013 ranking as the 13th wettest March-April. Temperatures have been cold, with April 2013 ranking 14th coldest and March-April 2013 ranking third coldest, which follows the warmest March-April only last year.
NOAA Regional Climate Centers:
A more detailed drought discussion, provided by the NOAA Regional Climate Centers and others, can be found below.
West — Pacific Islands
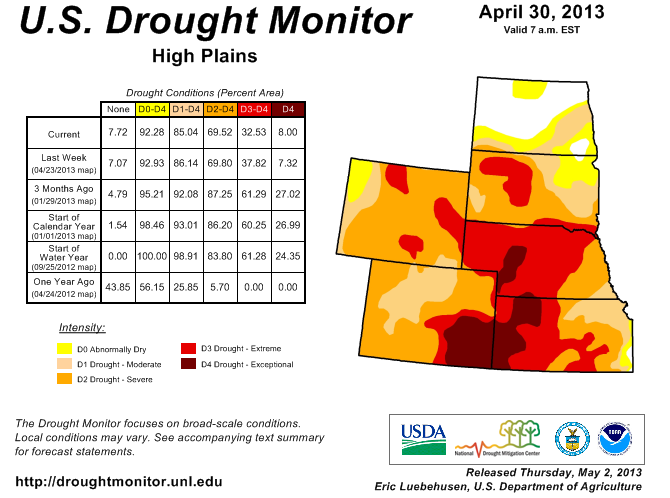
As described by the High Plains Regional Climate Center, cooler conditions of March continued into April across the region. The High Plains region experienced a wide range of weather conditions this April including rain, snow, sleet, freezing rain, thunderstorms (including thundersnow and thundersleet), hail, high winds, dust storms, and tornadoes. This active pattern was welcomed as it brought many chances for precipitation to the drought-stricken areas and widespread improvements were made in regards to the drought. By the end of the month, April precipitation totals were quite varied, however, and most locations were within about 25 percent of normal precipitation. Northern and southwestern North Dakota, west-central Nebraska, western Kansas, and eastern Colorado received less than 50 percent of normal precipitation. For some locations, even ones that came short of normal, this was the most precipitation received in the past year. For instance, North Platte, Nebraska only had 1.27 inches (32 mm) of liquid equivalent precipitation this month which was 56 percent of normal. However, this was the most precipitation since April of last year. Unfortunately, North Platte was still 13.00 inches (330 mm) below normal for that 12-month period. Even with increases in precipitation, drought impacts were still being realized. According to the USDA, the winter wheat crops in Colorado and Kansas were struggling due to the prolonged dryness with much of the crop rating in the poor to very poor categories (54 percent in Colorado and 39 percent in Kansas). Also, in Colorado, the combination of drought and strong winds contributed to a dust storm that closed I-25 and covered farmland with sand and dirt. While dust storms are not necessarily uncommon in Colorado, this dust storm had quite an impact on local farmers in Lincoln County, located in the east-central part of the state. According to 9News in Denver, a dust storm on April 14th blew sand and dirt on more than 100,000 acres of land. Some places had an estimated 6-8 inches of sand and dirt covering the fields. Local ranchers indicated that it may take years to rebuild the soil.
There were significant changes to the USDM over the past month as the combination of cool and wet conditions allowed for many improvements to be made. At the end of April, approximately 85 percent of the region was in moderate (D1) to exceptional (D4) drought -- down from 91 percent at the end of last month. All D4 conditions in South Dakota and Wyoming were erased leaving D3 or severe drought conditions (D2) in its place. Overall, Nebraska had the largest improvements and went from 76 percent in D4 to only 8 percent. Extreme drought conditions were also trimmed back in South Dakota, Wyoming, eastern Nebraska, and northern Colorado. Unfortunately, conditions worsened slightly in southeastern Colorado and western Kansas where D4 expanded. Kansas now has the largest percentage of D4 coverage at just under 20 percent.
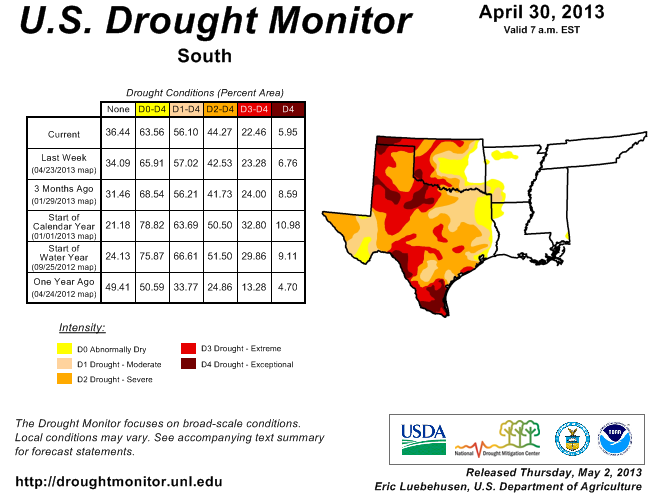
As explained by the Southern Regional Climate Center, April proved to be a colder than normal month for the region. April precipitation totals in the Southern region varied spatially, with drier than normal conditions in western Texas and western Oklahoma, while much wetter than normal conditions were observed in the eastern portions of the region and along the Louisiana and Mississippi coastline. In the western portion of the region, the majority of stations reported less than one quarter of normal precipitation, with many stations, particularly in the High Plains climate division of Texas, not seeing a drop all month. Conversely, precipitation totals over much of Tennessee varied between one and a half to two times of normal. This was also the case in southern Louisiana, southern Mississippi, and east central Oklahoma. Texas was the only state in the region that experienced a drier than normal month.
Drought conditions have not changed significantly over the past month. The states of Tennessee, Mississippi, and Louisiana remain drought free. In Arkansas, above normal precipitation led to drought relief in the western counties. There has also been some slight reduction of drought conditions in eastern Oklahoma. Dryness in the western half of Texas led to some deterioration, particularly in the western panhandle and the northern panhandle. Farmers in far west and south Texas still have dry conditions to contend with, where rainfall has been sparse for months and streamflows have become too low to depend on. Agricultural concerns aren't limited to a lack of rain this month, though. Strong frontal passages have brought temperatures near freezing for many parts of the state. The unseasonably cold conditions are causing concern for farmers, particularly for vineyards and peaches in central and west Texas; others remain convinced the cold won't affect prices or future yields for wheat, which is still young and resist the cold somewhat. A $5.3 million grant, provided through the Agriculture Secretary, is aimed at funding research to improve resilience to these problems (Information provided by the Texas State Office of Climatology). In the middle of the month, high winds caused wind storms in west Texas which, combined with the dry conditions in these regions, kicked up dust and dropped visibility, causing anywhere between $15,000 and $20,000 in damages. These high winds have contributed to increased fire risk, allowing lightning to set off several fires in east Texas. This and other fire emergencies from the previous two years have prompted FEMA to grant Texas $31.2 million to combat new fires and recover from the many fires since 2011 (Information provided by the Texas State Office of Climatology).
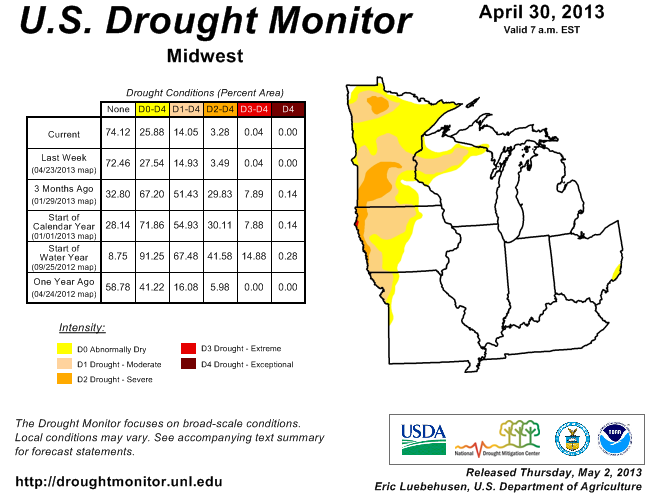
As summarized by the Midwest Regional Climate Center, April temperatures in the Midwest ranged from near normal in the southeast to much below normal in the northwest. April precipitation was well above normal for much of the Midwest. Totals for the Midwest as a whole ranked as the second wettest April, trailing only 2011 (period of record 1895-2013). Drought conditions continued to recede to the west as wet weather and flooding became a problem in many locations. Cool and wet weather have combined to delay field work and planting in most of the region. All nine states were well behind normal in planting progress for the corn crop. Only Missouri and Kentucky had more than 10 percent of their crop planted compared to a normal of more than 40 percent of the crop planted by the end of April. All nine states were behind normal by 12 to 35 percent at the end of the month. Lakes in the northern two-thirds of Minnesota remained ice covered at the end of April. Ice-out on lakes in southern Minnesota came two to three weeks later than historical median dates.
As noted by the Southeast Regional Climate Center, mean temperatures in April were variable across the Southeast, with above-average temperatures across the northern and southern tiers of the region and near-average temperatures across the middle of the region. Monthly temperatures were also above-average across Puerto Rico, with San Juan recording its 5th warmest April in a record extending back to 1898. Conversely, temperatures were slightly below-average across the U.S. Virgin Islands. Monthly precipitation totals were also variable across the Southeast. The driest locations in April were found across much of Virginia, eastern North Carolina, and parts of the Florida Panhandle, where monthly precipitation totals were between 50 and 75 percent of normal. Monthly precipitation was above (below) average across the western (eastern) half of Puerto Rico, while precipitation was generally below average across the U.S. Virgin Islands.
Drought conditions continued to improve across much of the Southeast, as the area designated in moderate drought (D1) or greater decreased from 17 percent at the end of March to only 6 percent at the end of April. This is the smallest value observed across the Southeast since July 2010. Drought conditions were eliminated across the Carolinas and only a small area of drought remained along the coast of Georgia. On the other hand, areas of moderate (D1) and severe (D2) drought continued to persist across much of central Florida, although this aided the planting of spring produce. The cold weather from the prior month that extended into early April continued to limit forage and winter wheat growth across Florida and North Carolina, and caused some damage to warm season crops across south Florida and to row crops across southern Georgia.
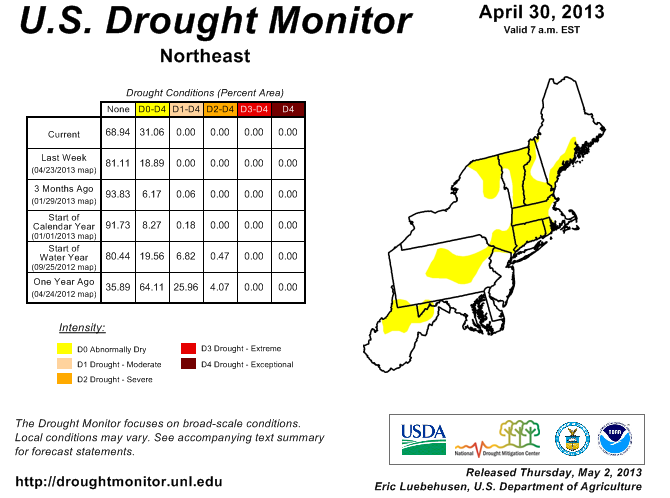
As explained by the Northeast Regional Climate Center, preliminary data indicated the Northeast's average temperature of 46.3 degrees F (7.9 degrees C) was neither above nor below normal for April — it was exactly normal. Five states were cooler than normal while seven were warmer. For the fourth month in a row the Northeast was drier than normal. The region received 2.75 inches (69.85 mm) of precipitation, 75 percent of normal, making it the 29th driest April since 1895. All states were drier than normal with six of twelve ranking this April among their top 26 driest: Connecticut, 6th; Rhode Island, 11th; Maine, 16th; Massachusetts, 22nd; New Hampshire, 25th; and West Virginia, 26th. Connecticut was the driest state at 32 percent of normal. Departures for the rest of the states ranged from 37 percent of normal in Rhode Island to 96 percent of normal in New York.
The on-going lack of precipitation caused abnormally dry (D0) conditions to be introduced by the USDM in two counties in western Maryland, the northern third of West Virginia, part of coastal Maine, most of Massachusetts and Rhode Island, and all of Connecticut by the end of the month. Abnormal dryness lingered through April in parts of New York while dry conditions along the Vermont-New Hampshire border were expanded to include surrounding counties. Conditions improved in northwest and southeast Pennsylvania, but the central portion remained dry and conditions deteriorated to D0 in the southwest corner of the state. In New Jersey, dry conditions in western counties were eased.
As summarized by the Western Regional Climate Center, large-scale circulation patterns this April continued to favor precipitation in the eastern Great Basin, Rockies, and far northwest at the expense of the Sierra Nevada and Southwest. Much of the southern tier of the West experienced less than 25% of normal precipitation. Eastern Oregon and southern Idaho also saw dry conditions. Persistent upper level troughs over the High Plains brought colder than normal temperatures to the far northeastern portions of the region, the Rocky Mountain states and inland Northwest, while the Southwest saw above normal temperatures and unusual cold dominated Alaska.
After a fairly dry start to the winter season, March and April brought significant snowfall to Colorado's Front Range. Boulder recorded its snowiest April in a 120-year record with 47.6 in (121 cm) snowfall. The previous record was 44 in (112 cm) in 1957. Much of this snowfall occurred over the 15th-18th with consecutive strong storms. Colorado's statewide average snowpack climbed to 92% of average, with basins in the northern part of the state near to above average while basins in the southern part of the state remained 60-80% of average. Despite the record snowfall, total precipitation at Boulder fell short of record values, totaling 4.16 in (106 mm), 145% of normal. Western Washington also received ample precipitation this month. Washington snowpack was doing well at month's end, with all basins over 90% of normal. Elsewhere in the West, precipitation and snowpack were not so abundant. With very little snowfall and warm temperatures this month, snowpack in the Sierra Nevada fell to 18% of normal by the end of the month. Snowpack also dwindled in southern Oregon, southern Utah and northern Nevada. Montana saw its 4th consecutive month of below normal statewide average precipitation, making for nine out of the past 12 consecutive months with below normal precipitation. Further south, Los Angeles recorded its 5th driest rain season (July 1-April 30) total of 5.14 in (131 mm). This is the 5th driest since records began in 1877 and 9.44 in (240 mm) below normal for this period. The total January-April precipitation is the least on record over much of central and northern California and western Nevada, parts of western Oregon and Washington, and in southwest Montana, eastern Idaho, and northwest Wyoming.
April 14-16: Dust storm in southern Nevada, northern Arizona: High winds across the Southwest lifted and transported dust from the deserts of southeastern California and the Colorado plateau, northeastward into Colorado. Visibility was reduced to 5 miles (8 km) in Las Vegas, Nevada, on the 14th and 50 feet (15 m) in northern Arizona on the 16th. Interstate 40 was closed between Winslow and Winona, Arizona. Wind gusts reached 68 mph (109 kph) in Winslow on the 16th.
Pacific Islands: According to reports from National Weather Service offices, the Pacific ENSO Applications Climate Center (PEAC), and partners, conditions varied across the Pacific Islands.
As noted by the National Weather Service office in Honolulu, while the west half of the state slowly pulled out of drought through the course of the 2012-2013 wet season, extreme drought, or the D3 category in the USDM map, persisted through yet another wet season on the Big Island. The current area of D3 conditions includes a portion of the Pohakuloa region of the Hamakua district and the lower slopes of the south Kohala district near Kawaihae and Puako. Severe drought, or D2 conditions, cover the rest of the south Kohala district and also the upper slopes of the north Kona and south Kona districts. The island of Maui also has persistent extreme drought over the southwest slope of Haleakala including the Kihei, Kamaole, and Ulupalakua areas. Extreme drought on Maui has lasted through two consecutive wet seasons. Severe drought continues to cover the lower southeast slope of Haleakala near Kaupo, and the lower elevations of west Maui from Maalaea to Kaanapali. Drought continues to ease in portions of west Molokai with the removal of moderate drought, or the D1 category. However, severe drought persists for agriculture areas served by the Kualapuu reservoir due to continued low supply levels. Reservoir water levels have increased slowly over the past several months but have not risen to pre-drought conditions.
Some drought impacts impacts in Hawaii include the following:
KAUAI.
THERE ARE CURRENTLY NO DROUGHT AREAS ON KAUAI.

OAHU.
SEVERAL LATE SEASON COLD FRONTS BROUGHT ENOUGH RAINFALL TO REMOVE
DROUGHT AS VEGETATION CONDITIONS HAVE IMPROVED.  SEVERAL RAIN GAGES
IN WEST OAHU RECORDED THEIR HIGHEST APRIL RAINFALL TOTALS IN OVER 20
YEARS.

MOLOKAI.
WEST MOLOKAI CONTINUES TO SEE IMPROVING AGRICULTURE AND GENERAL
VEGETATION CONDITIONS.  SATELLITE-BASED VEGETATION HEALTH DATA SHOW
GOOD CONDITIONS OVER MOST AREAS OF THE ISLAND.

THE STATE OF HAWAII DEPARTMENT OF AGRICULTURE MAINTAINED A MANDATORY
REDUCTION IN IRRIGATION WATER CONSUMPTION OF 20 PERCENT FOR FARMERS
SERVED BY THE KUALAPUU RESERVOIR.  THE RESTRICTION WAS REDUCED FROM
30 PERCENT TO 20 PERCENT ON APRIL 2 2013.

LANAI.
SATELLITE-BASED VEGETATION HEALTH DATA SHOW A DETERIORATION OF
CONDITIONS OVER THE PAST MONTH.  HOWEVER... RAINFALL OVER THE PAST
WEEK MAY HAVE HALTED THE SLIDE TOWARD WORSE CONDITIONS.

MAUI.
ULUPALAKUA RANCH HAS JUST COMPLETED ITS DRIEST WET SEASON ON
RECORD.  AN EARLY MAY COLD FRONT BROUGHT SOME NEEDED RAINFALL BUT
MUCH MORE IS NEEDED.  PASTURES IN THE EXISTING DROUGHT
AREAS...ESPECIALLY IN THE LOWER ELEVATIONS NEAR KIHEI...WERE
DESTOCKED MANY MONTHS AGO.  THE MAUI COUNTY DEPARTMENT OF WATER
SUPPLY HAS MAINTAINED THEIR LONG-STANDING REQUEST FOR A 10 PERCENT
REDUCTION IN WATER USE BY CENTRAL AND SOUTH MAUI RESIDENTS.

BIG ISLAND.
APRIL IS NORMALLY ONE OF THE WETTEST MONTHS OF THE YEAR FOR THE
EAST-FACING SLOPES OF THE BIG ISLAND.  HOWEVER...A LACK OF TRADE
WIND RAINFALL RESULTED IN VERY DRY CONDITIONS.  THE FARM SERVICE
AGENCY REPORTED THAT GINGER ROOT AND SWEET POTATO FARMERS ARE DOING
FINE SO FAR BUT DROUGHT IMPACTS WILL APPEAR IF DRY CONDITIONS
PERSIST THROUGH MAY.  RANCHERS NEAR SOUTH POINT INDICATED THAT
PASTURE CONDITIONS ARE DETERIORATING FOLLOWING A BRIEF PERIOD OF
REGROWTH.  THE DRY CONDITIONS HAVE BEEN BENEFICIAL TO SOME.  A
RAMBUTAN FARMER MENTIONED RECENTLY THAT THE DRY WEATHER HAS
STIMULATED FLOWER GROWTH...THOUGH RAINFALL WILL BE NEEDED SOON.
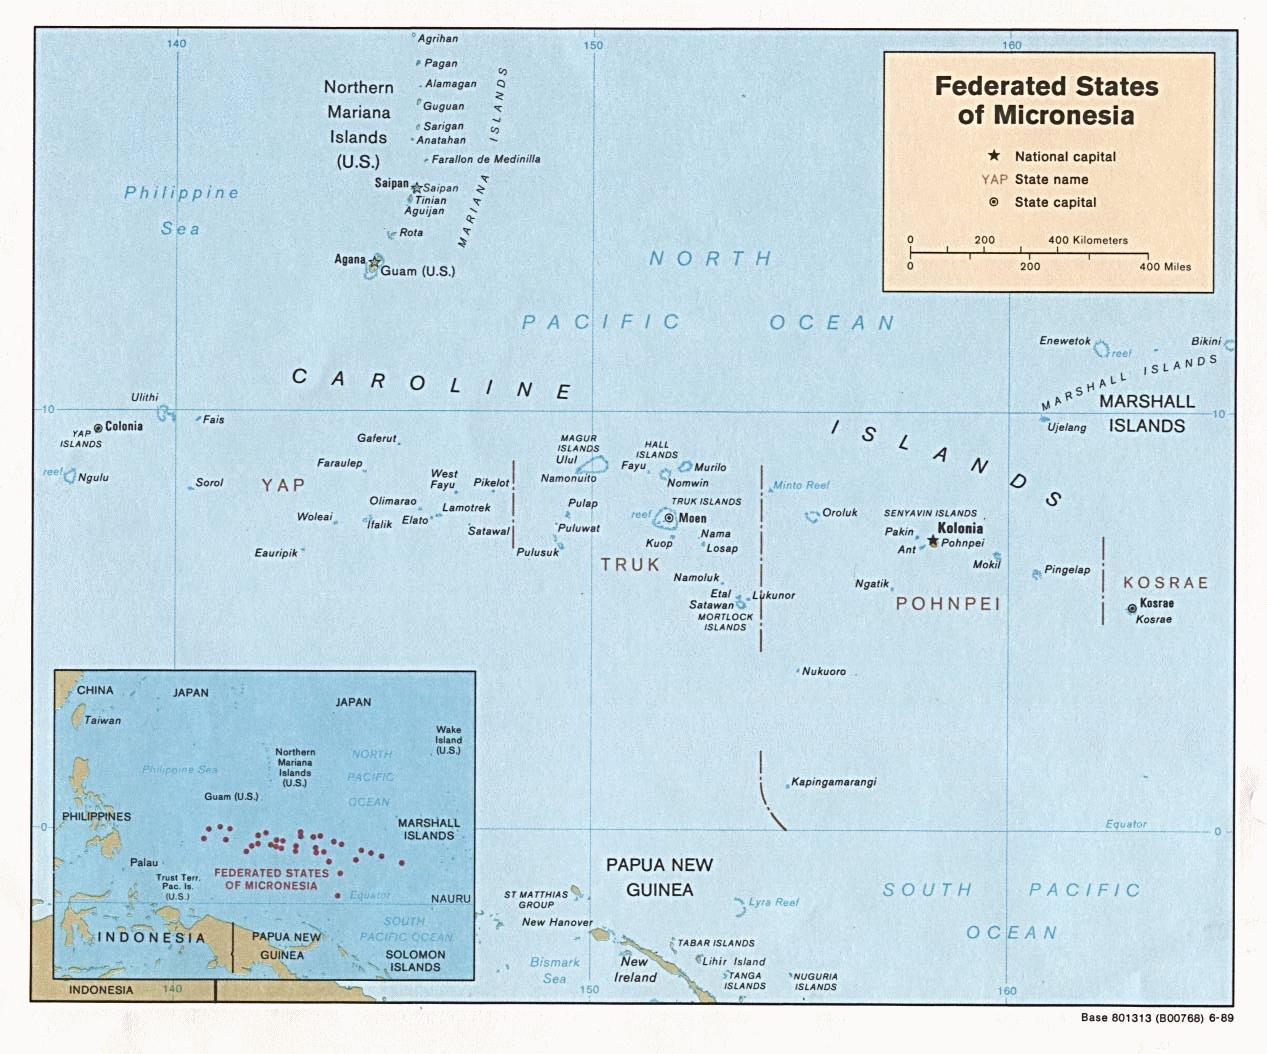
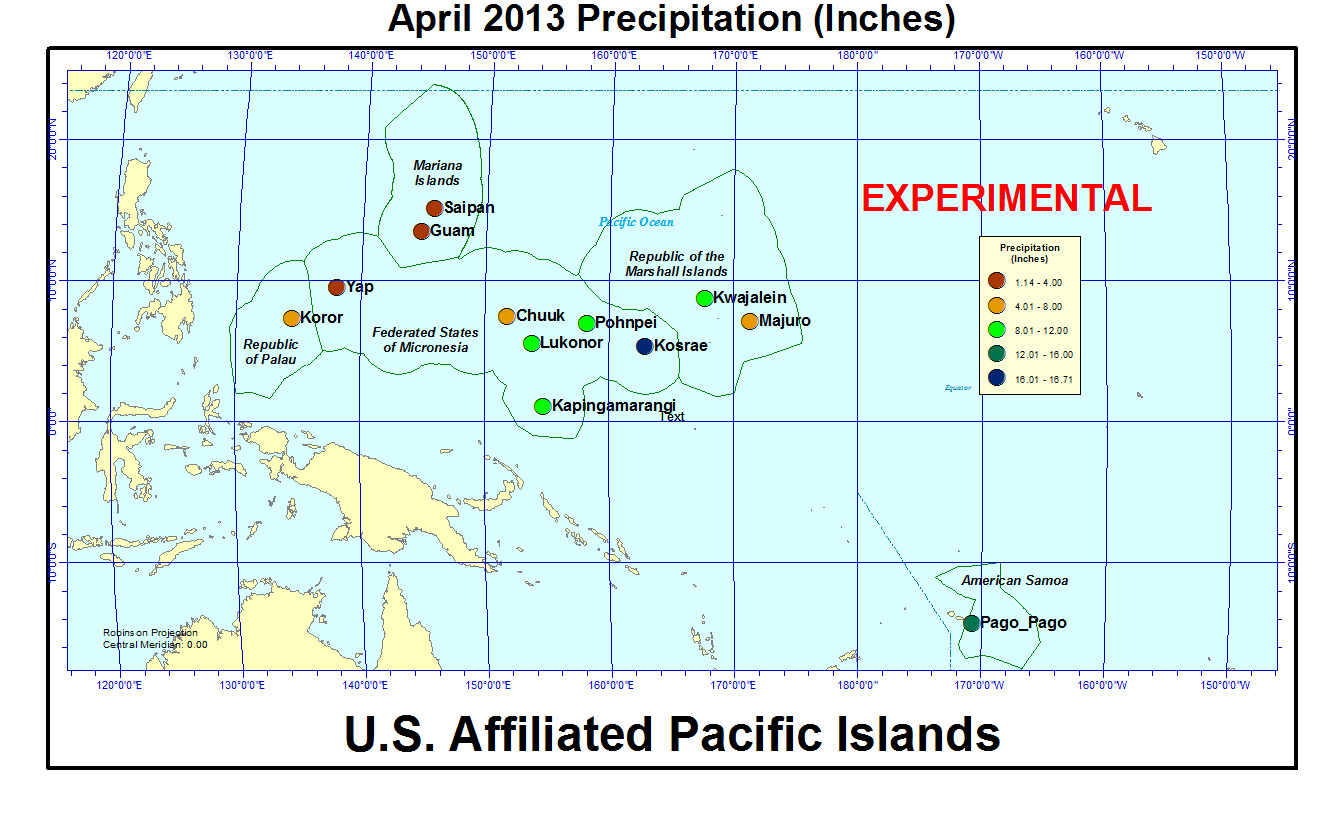
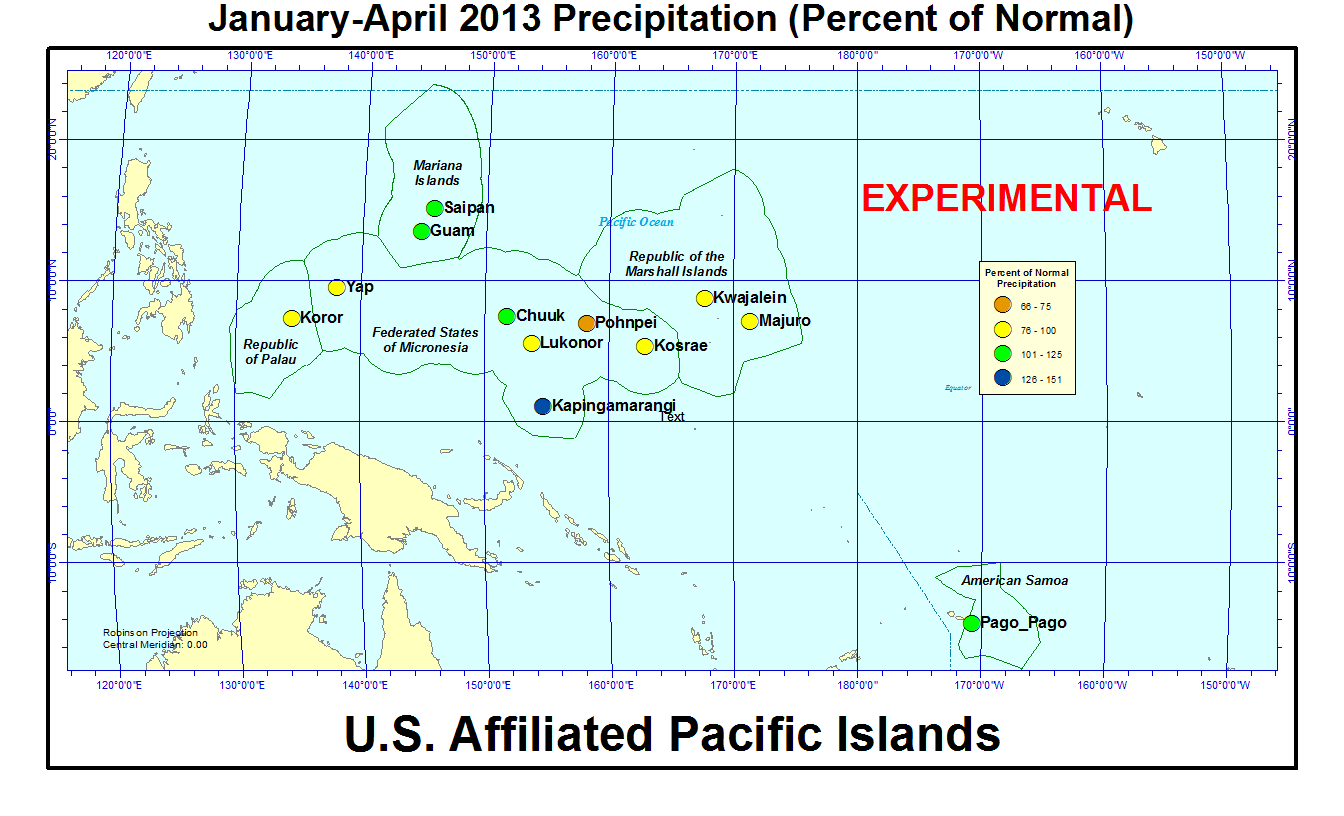
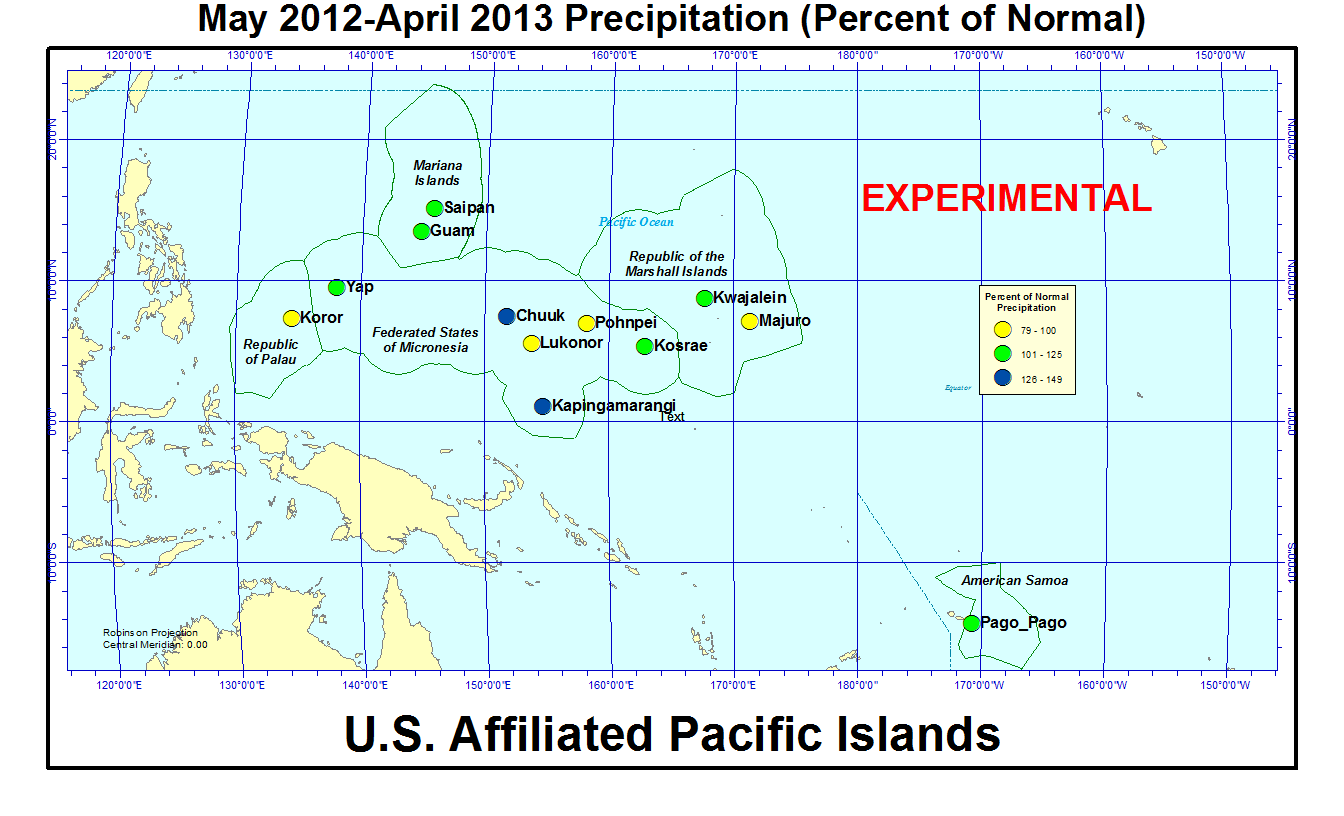
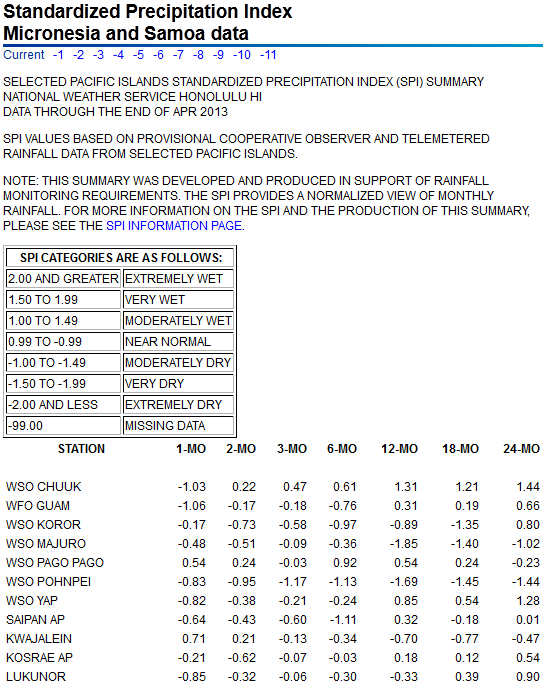
On other Pacific Islands (maps — Micronesia, Marshall Islands, basinwide), April was drier than normal at Majuro, Pohnpei, Lukonor, and Saipan, and much drier than normal at Chuuk, Guam, and Yap. April rainfall amounts were below 4 inches at Yap, Saipan, and Guam and below 8 inches at Koror, Chuuk, and Majuro. (This is the dry season for several of these stations, so even low rainfall amounts may show up as high percent of normals.) Majuro has been below normal for 10 of the last 12 months, Pohnpei for 9 of the last 12 months, and Kwajalein for 7 of the last 12 months. Year-to-date (January-April 2013) rainfall totals for Kwajalein, Majuro, Koror, Yap, Lukonor, and Kosrae were below normal, and twelve-month (May 2012-April 2013) rainfall totals for Majuro, Pohnpei, Lukonor, and Koror were below normal.
According to NWS reports, extreme dryness continued for parts of the northern Marshall Islands, and dry weather also persisted for the Commonwealth of the Northern Mariana Islands and Guam. The Republic of the Marshall Islands Cabinet and the Chief Secretary on April 16 declared a state of emergency for the Northern Marshall Islands. Less than four inches of rain has fallen for the first four months of 2013 on some northern islands in the Marshalls (1.93 inches at Wotje and 3.66 inches at Utirik), with water supplies gone and damage occurring to agriculture. Grass fires are the major problem for Guam and the Marianas.
| Station Name | May 2012 | Jun 2012 | Jul 2012 | Aug 2012 | Sep 2012 | Oct 2012 | Nov 2012 | Dec 2012 | Jan 2013 | Feb 2013 | Mar 2013 | Apr 2013 | May- Apr |
|---|---|---|---|---|---|---|---|---|---|---|---|---|---|
| Chuuk | 173% | 131% | 141% | 169% | 86% | 128% | 144% | 116% | 99% | 146% | 192% | 49% | 124% |
| Guam NAS | 224% | 107% | 66% | 179% | 126% | 92% | 74% | 55% | 128% | 97% | 191% | 45% | 96% |
| Kapingamarangi | 143% | 179% | 146% | 192% | 147% | 138% | 167% | 74% | 197% | 154% | 199% | 77% | 132% |
| Koror | 122% | 95% | 88% | 102% | 111% | 78% | 67% | 103% | 72% | 92% | 56% | 103% | 85% |
| Kosrae | 86% | 99% | 124% | 144% | 109% | 113% | 119% | 110% | 98% | 146% | 64% | 95% | 90% |
| Kwajalein | 161% | 117% | 120% | 95% | 57% | 73% | 45% | 230% | 39% | 17% | 74% | 178% | 97% |
| Lukonor | 106% | 125% | 82% | 73% | 148% | 74% | 178% | 62% | 60% | 134% | 122% | 71% | 88% |
| Majuro | 59% | 81% | 68% | 87% | 67% | 46% | 154% | 53% | 31% | 152% | 78% | 69% | 78% |
| Pago Pago | 126% | 115% | 105% | 59% | 195% | 54% | 181% | 143% | 137% | 87% | 93% | 144% | 107% |
| Pohnpei | 115% | 100% | 92% | 96% | 90% | 82% | 109% | 71% | 83% | 54% | 67% | 59% | 84% |
| Saipan | 166% | 118% | 77% | 135% | 101% | 172% | 31% | 89% | 191% | 78% | 127% | 63% | 110% |
| Yap | 142% | 99% | 84% | 128% | 187% | 140% | 121% | 102% | 90% | 113% | 130% | 50% | 114% |
| Station Name | May 2012 | Jun 2012 | Jul 2012 | Aug 2012 | Sep 2012 | Oct 2012 | Nov 2012 | Dec 2012 | Jan 2013 | Feb 2013 | Mar 2013 | Apr 2013 | May- Apr |
|---|---|---|---|---|---|---|---|---|---|---|---|---|---|
| Chuuk | 19.56" | 15.27" | 16.92" | 21.78" | 10.04" | 14.68" | 15.30" | 13.09" | 10.00" | 10.60" | 16.00" | 6.11" | 169.35" |
| Guam NAS | 7.63" | 6.63" | 6.74" | 26.42" | 15.98" | 10.56" | 5.45" | 2.81" | 5.12" | 2.95" | 3.95" | 1.14" | 95.38" |
| Kapingamarangi | 17.24" | 24.68" | 20.65" | 15.57" | 14.56" | 11.32" | 15.44" | 7.25" | 18.02" | 14.25" | 22.79" | 10.51" | 192.28" |
| Koror | 14.49" | 16.54" | 16.36" | 13.72" | 13.01" | 9.23" | 7.68" | 11.52" | 7.29" | 7.91" | 4.13" | 7.57" | 129.45" |
| Kosrae | 15.35" | 14.56" | 18.55" | 20.46" | 15.52" | 12.33" | 16.49" | 17.75" | 16.27" | 18.89" | 10.20" | 16.71" | 193.08" |
| Kwajalein | 10.82" | 8.08" | 11.83" | 9.23" | 6.17" | 8.18" | 5.09" | 15.33" | 1.22" | 0.46" | 1.73" | 9.34" | 87.48" |
| Lukonor | 12.35" | 14.53" | 13.08" | 10.26" | 15.02" | 8.39" | 16.18" | 7.00" | 5.05" | 11.93" | 11.34" | 8.06" | 133.19" |
| Majuro | 5.96" | 8.89" | 7.54" | 10.15" | 7.47" | 5.84" | 20.69" | 6.09" | 2.42" | 10.44" | 5.13" | 6.46" | 97.08" |
| Pago Pago | 12.15" | 6.13" | 5.84" | 3.19" | 12.73" | 4.99" | 18.34" | 18.31" | 18.27" | 10.48" | 9.97" | 13.52" | 133.92" |
| Pohnpei | 22.98" | 14.86" | 14.21" | 13.62" | 11.27" | 12.59" | 16.18" | 11.37" | 10.88" | 5.14" | 8.78" | 10.92" | 152.8" |
| Saipan | 3.96" | 4.26" | 6.86" | 17.73" | 10.24" | 18.31" | 1.75" | 3.44" | 4.83" | 2.03" | 2.40" | 1.65" | 77.46" |
| Yap | 11.14" | 11.95" | 12.74" | 18.92" | 25.19" | 17.08" | 10.67" | 8.68" | 5.72" | 5.86" | 5.95" | 2.81" | 136.71" |
| Station Name | May 2012 | Jun 2012 | Jul 2012 | Aug 2012 | Sep 2012 | Oct 2012 | Nov 2012 | Dec 2012 | Jan 2013 | Feb 2013 | Mar 2013 | Apr 2013 | May- Apr |
|---|---|---|---|---|---|---|---|---|---|---|---|---|---|
| Chuuk | 11.30" | 11.66" | 11.98" | 12.86" | 11.71" | 11.51" | 10.61" | 11.25" | 10.10" | 7.25" | 8.32" | 12.47" | 136.77" |
| Guam NAS | 3.40" | 6.18" | 10.14" | 14.74" | 12.66" | 11.44" | 7.38" | 5.11" | 4.01" | 3.03" | 2.07" | 2.53" | 99.09" |
| Kapingamarangi | 12.08" | 13.78" | 14.15" | 8.13" | 9.93" | 8.19" | 9.27" | 9.84" | 9.15" | 9.27" | 11.43" | 13.64" | 145.85" |
| Koror | 11.83" | 17.48" | 18.53" | 13.50" | 11.77" | 11.84" | 11.39" | 11.16" | 10.18" | 8.56" | 7.44" | 7.32" | 152.90" |
| Kosrae | 17.75" | 14.64" | 14.91" | 14.22" | 14.22" | 10.94" | 13.83" | 16.11" | 16.67" | 12.93" | 16.06" | 17.51" | 213.87" |
| Kwajalein | 6.72" | 6.93" | 9.87" | 9.74" | 10.74" | 11.18" | 11.28" | 6.66" | 3.16" | 2.64" | 2.35" | 5.26" | 90.41" |
| Lukonor | 11.69" | 11.65" | 15.93" | 14.04" | 10.15" | 11.32" | 9.08" | 11.27" | 8.41" | 8.93" | 9.26" | 11.31" | 151.36" |
| Majuro | 10.11" | 11.01" | 11.17" | 11.69" | 11.17" | 12.73" | 13.44" | 11.39" | 7.74" | 6.88" | 6.58" | 9.42" | 125.25" |
| Pago Pago | 9.66" | 5.33" | 5.55" | 5.38" | 6.53" | 9.26" | 10.14" | 12.84" | 13.34" | 12.00" | 10.68" | 9.39" | 125.57" |
| Pohnpei | 19.96" | 14.81" | 15.43" | 14.26" | 12.55" | 15.27" | 14.83" | 16.08" | 13.18" | 9.55" | 13.17" | 18.41" | 182.36" |
| Saipan | 2.38" | 3.62" | 8.91" | 13.13" | 10.09" | 10.62" | 5.61" | 3.85" | 2.53" | 2.59" | 1.89" | 2.63" | 70.25" |
| Yap | 7.85" | 12.04" | 15.08" | 14.82" | 13.50" | 12.18" | 8.83" | 8.51" | 6.39" | 5.19" | 4.56" | 5.63" | 120.31" |

[top]
State/Regional/National Moisture Status
A detailed review of drought and moisture conditions is available for all contiguous U.S. states, the nine standard regions, and the nation (contiguous U.S.):
| northeast u. s. | east north central u. s. | central u. s. |
| southeast u. s. | west north central u. s. | south u. s. |
| southwest u. s. | northwest u. s. | west u. s. |
| Contiguous United States |
[top]
Drought Indicators
- Palmer Drought Indices
- Standardized Precipitation Index
- long-term (36 to 60 month) percent of normal precipitation maps
- airport station percent of normal precipitation maps
- statewide precipitation rank maps
- Cooperative station percent of normal precipitation maps
- percent of average maps for the SNOTEL stations in the western mountains provided by the Western Regional Climate Center
- hydrologic year precipitation
- snow water equivalent of snowpack
- satellite-based observations of vegetative health
- National Weather Service model calculations of soil moisture, runoff, and evaporation
- National Weather Service model calculations of soil moisture using the Leaky Bucket Model
- Midwest Regional Climate Center model calculations of soil moisture
- topsoil moisture conditions observed by the USDA and mapped by the Climate Prediction Center
- pasture and range land conditions observed by the USDA and mapped by the Climate Prediction Center
- streamflow maps maintained by the USGS
[top]
Contacts & Questions