|
Contents Of This Report: |
|
National Drought Overview
|
|
[top]
Detailed Drought Discussion
Overview
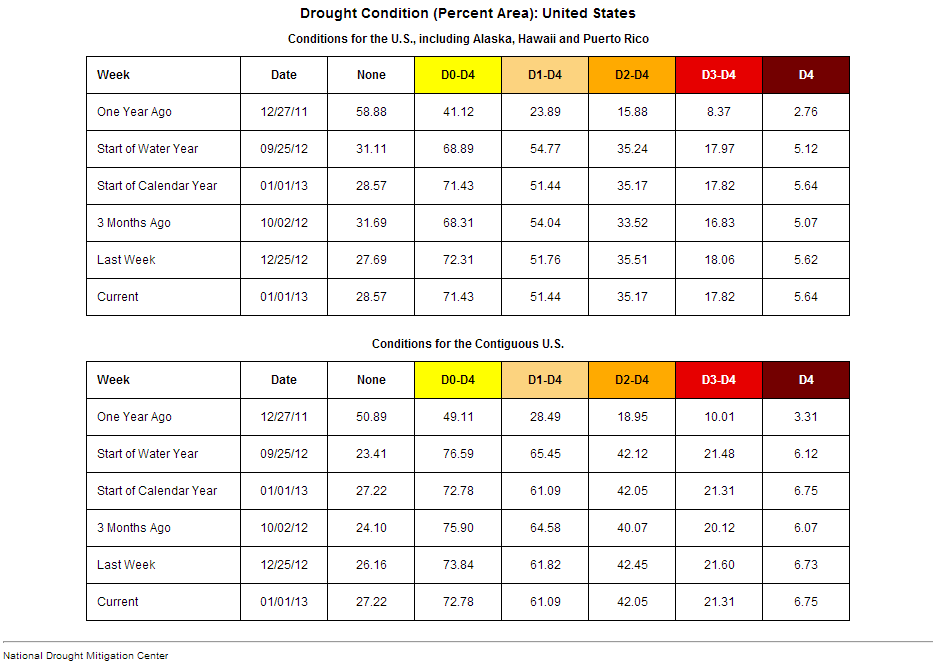
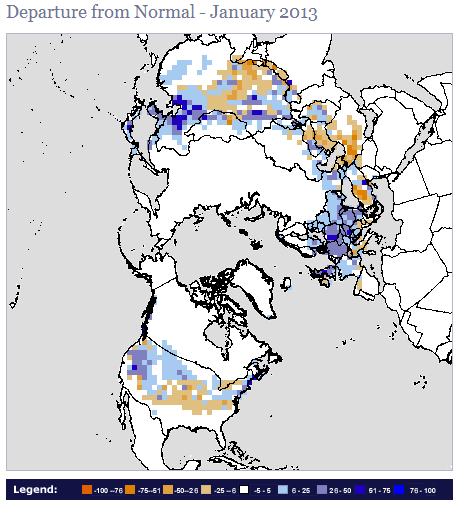
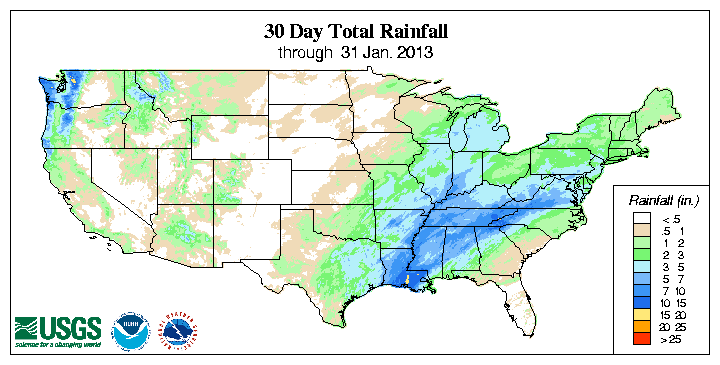
The polar jet stream and associated storm track were very active during January 2013, meandering in large loops of troughs and ridges which brought warm and cold spells to different areas during the month (weeks 1, 2, 3, 4, 5) as well as favoring some areas with precipitation and blocking rain or snow from other areas. Winter storms moving in the jet stream flow tapped Gulf of Mexico moisture to drop above-normal precipitation over the Lower to Mid-Mississippi and Ohio valleys and southern Appalachians (weeks 1, 2, 3, 4, 5), while winter storms in the western trough brought welcomed precipitation over parts of the West. But the weather systems largely avoided the heart of the Central Plains and Southeast drought areas. The beneficial rain and snow helped improve drought conditions over parts of the West; precipitation from the frequent frontal systems and low pressure centers chipped away at the drought areas in the Southeast before the systems moved northeast; and tropical showers shrank the drought area in Hawaii. But drought intensified in the Great Plains. When the temperature and precipitation are averaged across the country for the entire month, January 2013 ranked as the 39th warmest and 38th wettest January in the 119-year record. The January precipitation helped reduce the moderate-to-exceptional national drought footprint from 61.1 percent at the end of December to 57.7 percent at the end of January. According to the Palmer Drought Index, which goes back to the beginning of the 20th century, 45.6 percent of the contiguous U.S. was in moderate to extreme drought at the end of January, a decrease of about 6 percent compared to last month.
The U.S. Drought Monitor drought map valid January 29, 2013.
By the end of the month, the core drought areas in the U.S. included:
- a large area of moderate (D1) to exceptional (D4) drought stretching from the West, across the Northern to Southern Plains, into the Upper Midwest and Mid-Mississippi Valley, with the most intense drought centered in the Plains states;
- a persistent area of moderate to exceptional drought in the Southeast to Mid-Atlantic; and
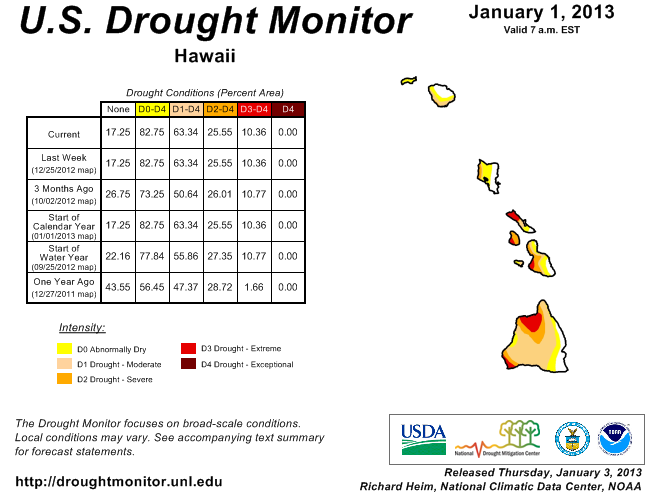
- much of Hawaii, where moderate to extreme (D3) drought persisted.
Palmer Drought Index
The Palmer drought indices measure the balance between moisture demand (evapotranspiration driven by temperature) and moisture supply (precipitation). The Palmer Z Index depicts moisture conditions for the current month, while the Palmer Hydrological Drought Index (PHDI) and Palmer Drought Severity Index (PDSI) depict the current month's cumulative moisture conditions integrated over the last several months.
|
 |
Used together, the Palmer Z Index and PHDI maps show that the January short-term moisture conditions improved long-term drought in the Mid-Atlantic, Southern Plains, and Midwest, but January short-term dryness deteriorated long-term drought in parts of the Southeast and West (January PHDI compared to December PHDI). The combination resulted in a decrease in the total area under drought.
Standardized Precipitation Index
The Standardized Precipitation Index (SPI) measures moisture supply. The SPI maps here show the spatial extent of anomalously wet and dry areas at time scales ranging from 1 month to 24 months.
 |
 |
 |
The 1-month SPI map shows that the moisture deficiencies in January were moderately dry or worse in four main areas: coastal Southeast, New England, Far West, and Central Rockies into the adjacent High Plains. Unusually wet conditions occurred from the Southern Plains through Great Lakes, and Lower Mississippi Valley to Mid-Atlantic states. The precipitation pattern for the last two months has been geographically diverse enough to limit short-term dryness to just parts of the Southeast and Central Rockies to adjacent High Plains. The precipitation pattern has been sufficient for the 3-month SPI to reflect near normal conditions across a wide swath of the country, with short-term dryness indicated for only areas in New England, coastal Southeast, Southern Plains, and Central Rockies into the adjacent High Plains. It isn't until six to nine months that widespread dryness is evident in the central third of the country. This pattern of long-term dryness persists in the 12-month SPI map. Dryness in the Southern Plains shows up weakly in the 3- and 6-month SPI maps, more strongly in the 9- and 12-month maps, and most strongly at 24 months. Dryness in parts of the Southeast is evident at all time scales. Patchy dryness in the West can be seen at 9 to 24 months.
 |
 |
 |
Agricultural and Hydrological Indices and Impacts
 |
 |
Drought conditions were reflected in numerous agricultural, hydrological, and other meteorological indicators, both observed and modeled.
Agricultural:
According to the U.S. Department of Agriculture (USDA), as of January 29, 59 percent of winter wheat, 59 percent of hay, and 69 percent of cattle were in drought. For the 30th consecutive week (July 10, 2012 - January 29, 2013), drought encompassed more than two-thirds of the domestic cattle inventory.
Map showing NOAA/NCEP NLDAS modeled monthly soil moisture percentiles (total column).
- NOAA Climate Prediction Center (CPC) modeled soil moisture anomalies and percentiles for the end of the month, and soil moisture anomaly change compared to previous month;
- CPC's Leaky Bucket model soil moisture percentiles;
- NLDAS (North American Land Data Assimilation System) modeled soil moisture percentiles for the top soil layer and total soil layer;
- VIC (University of Washington Variable Infiltration Capacity macroscale hydrologic model) modeled soil moisture percentiles, and soil moisture percentile change compared to previous month;
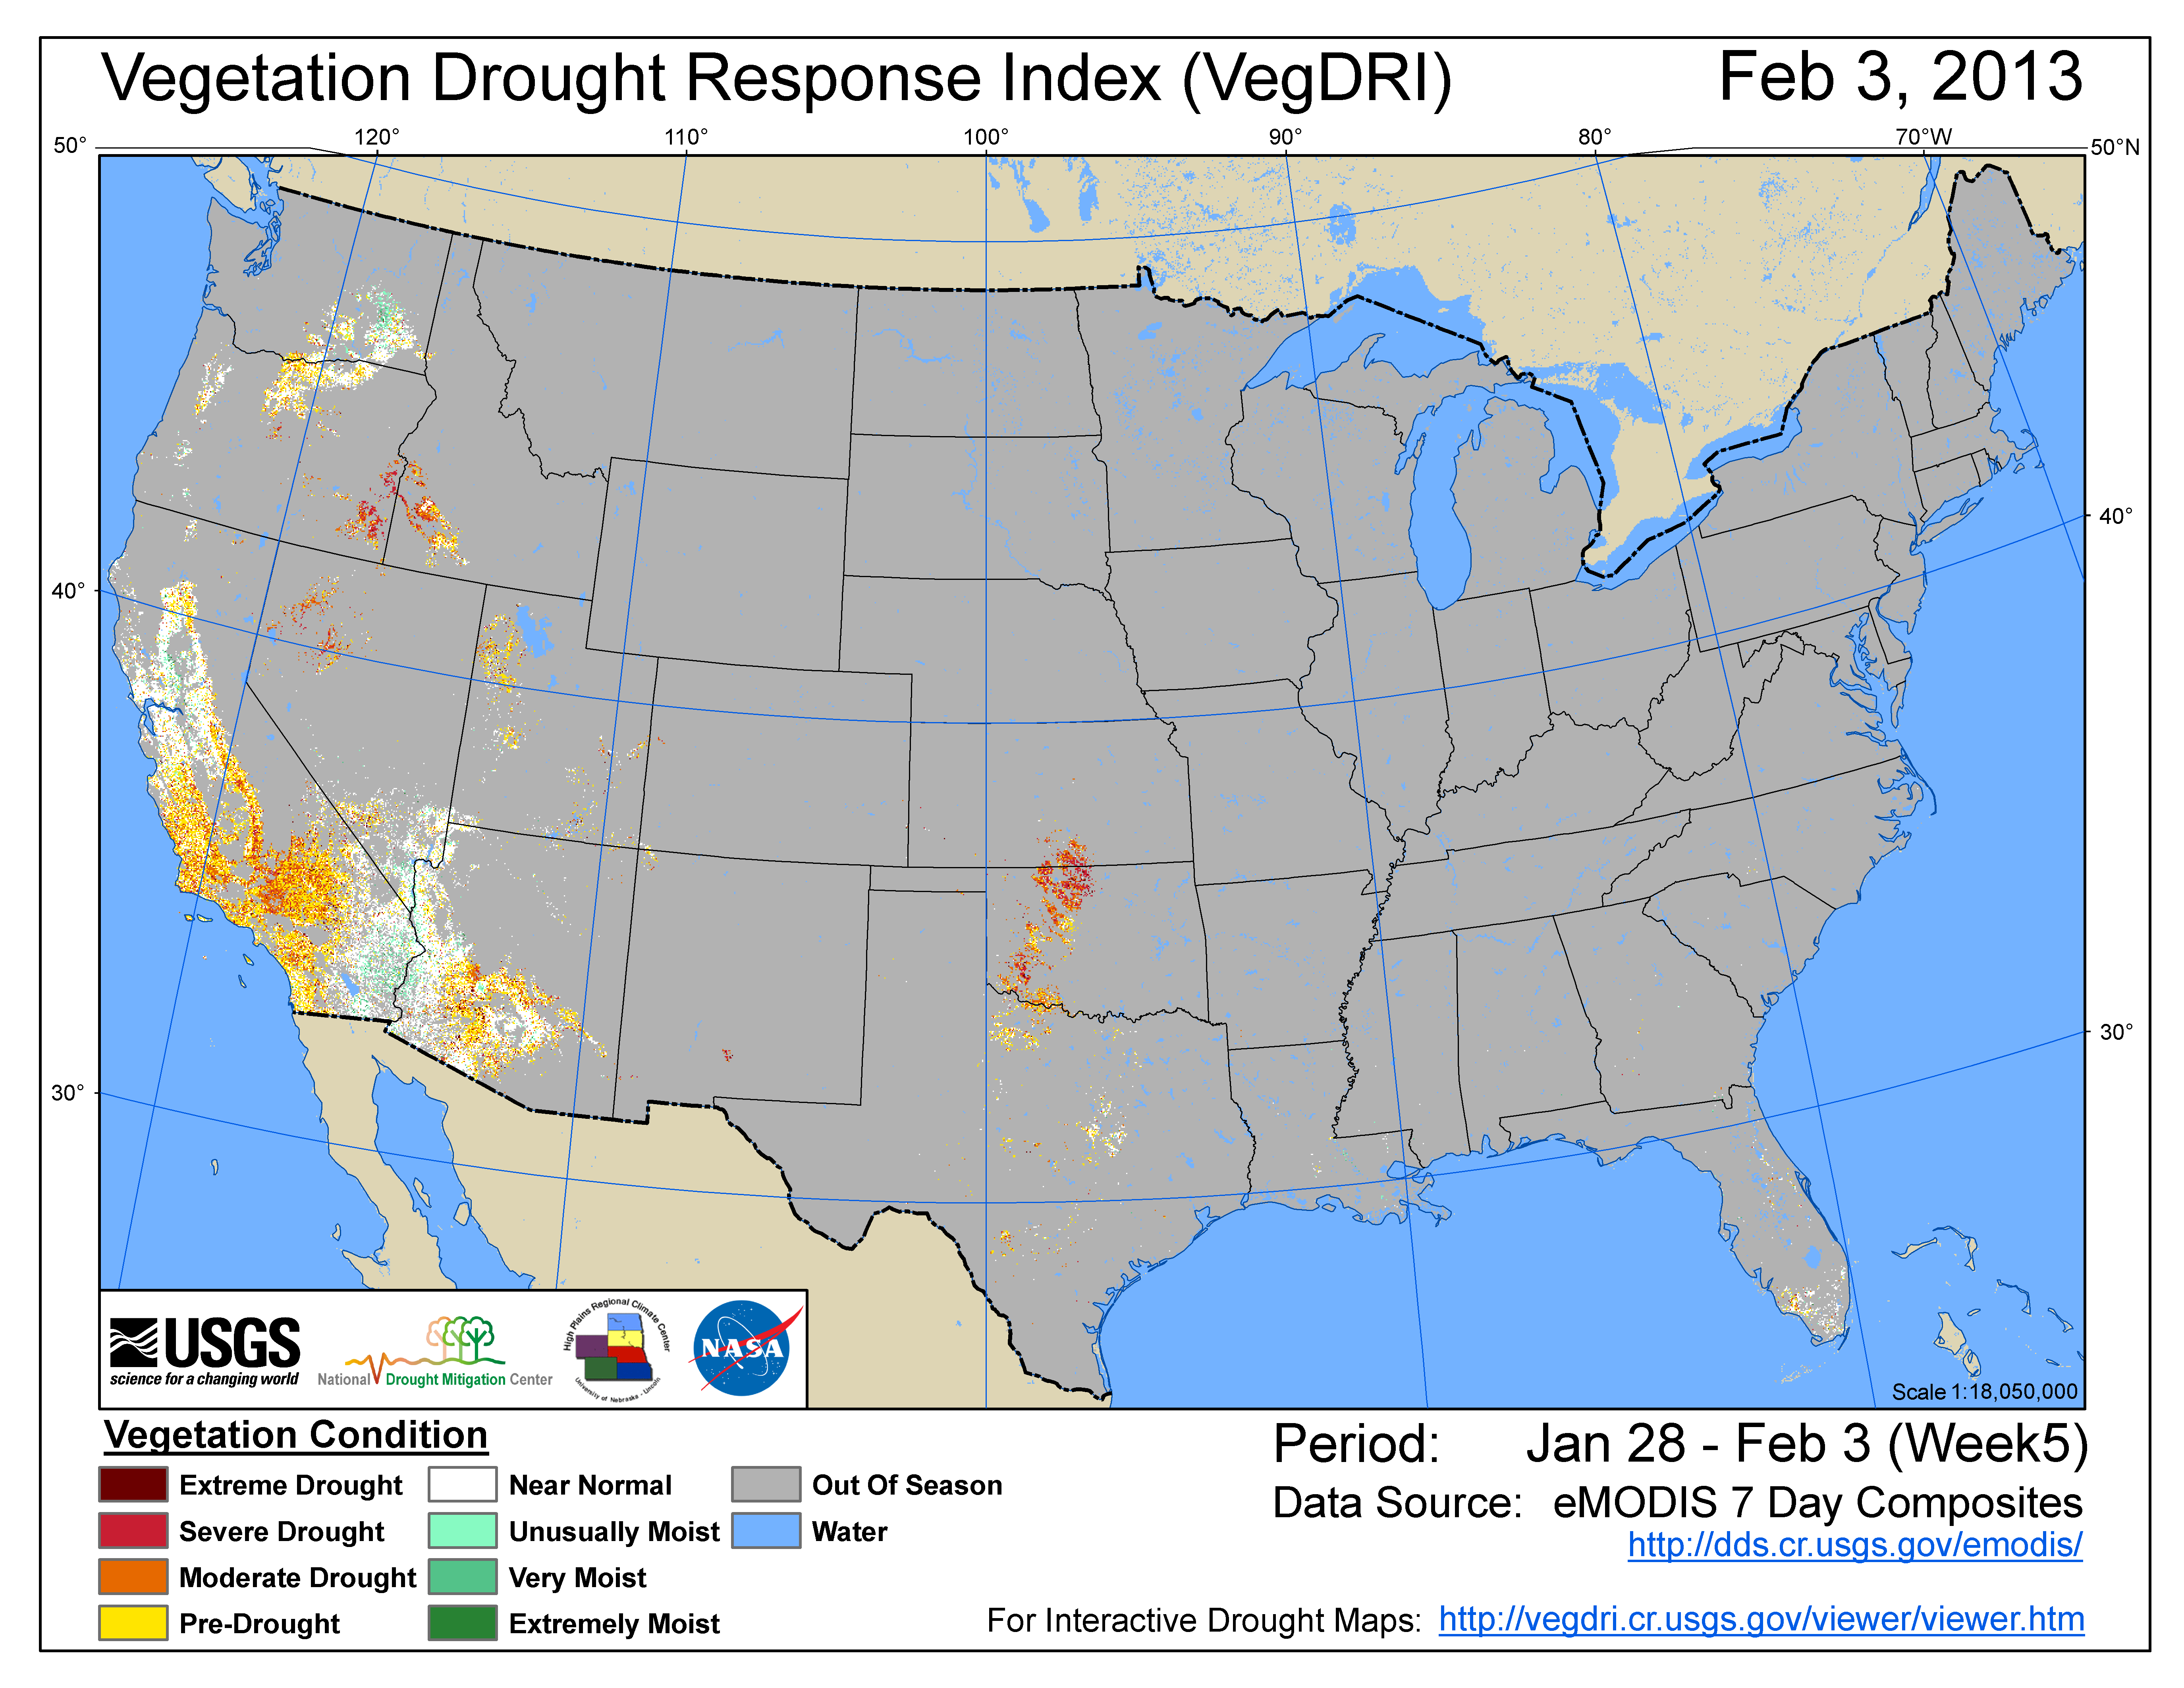
- Vegetation Drought Response Index (VegDRI);
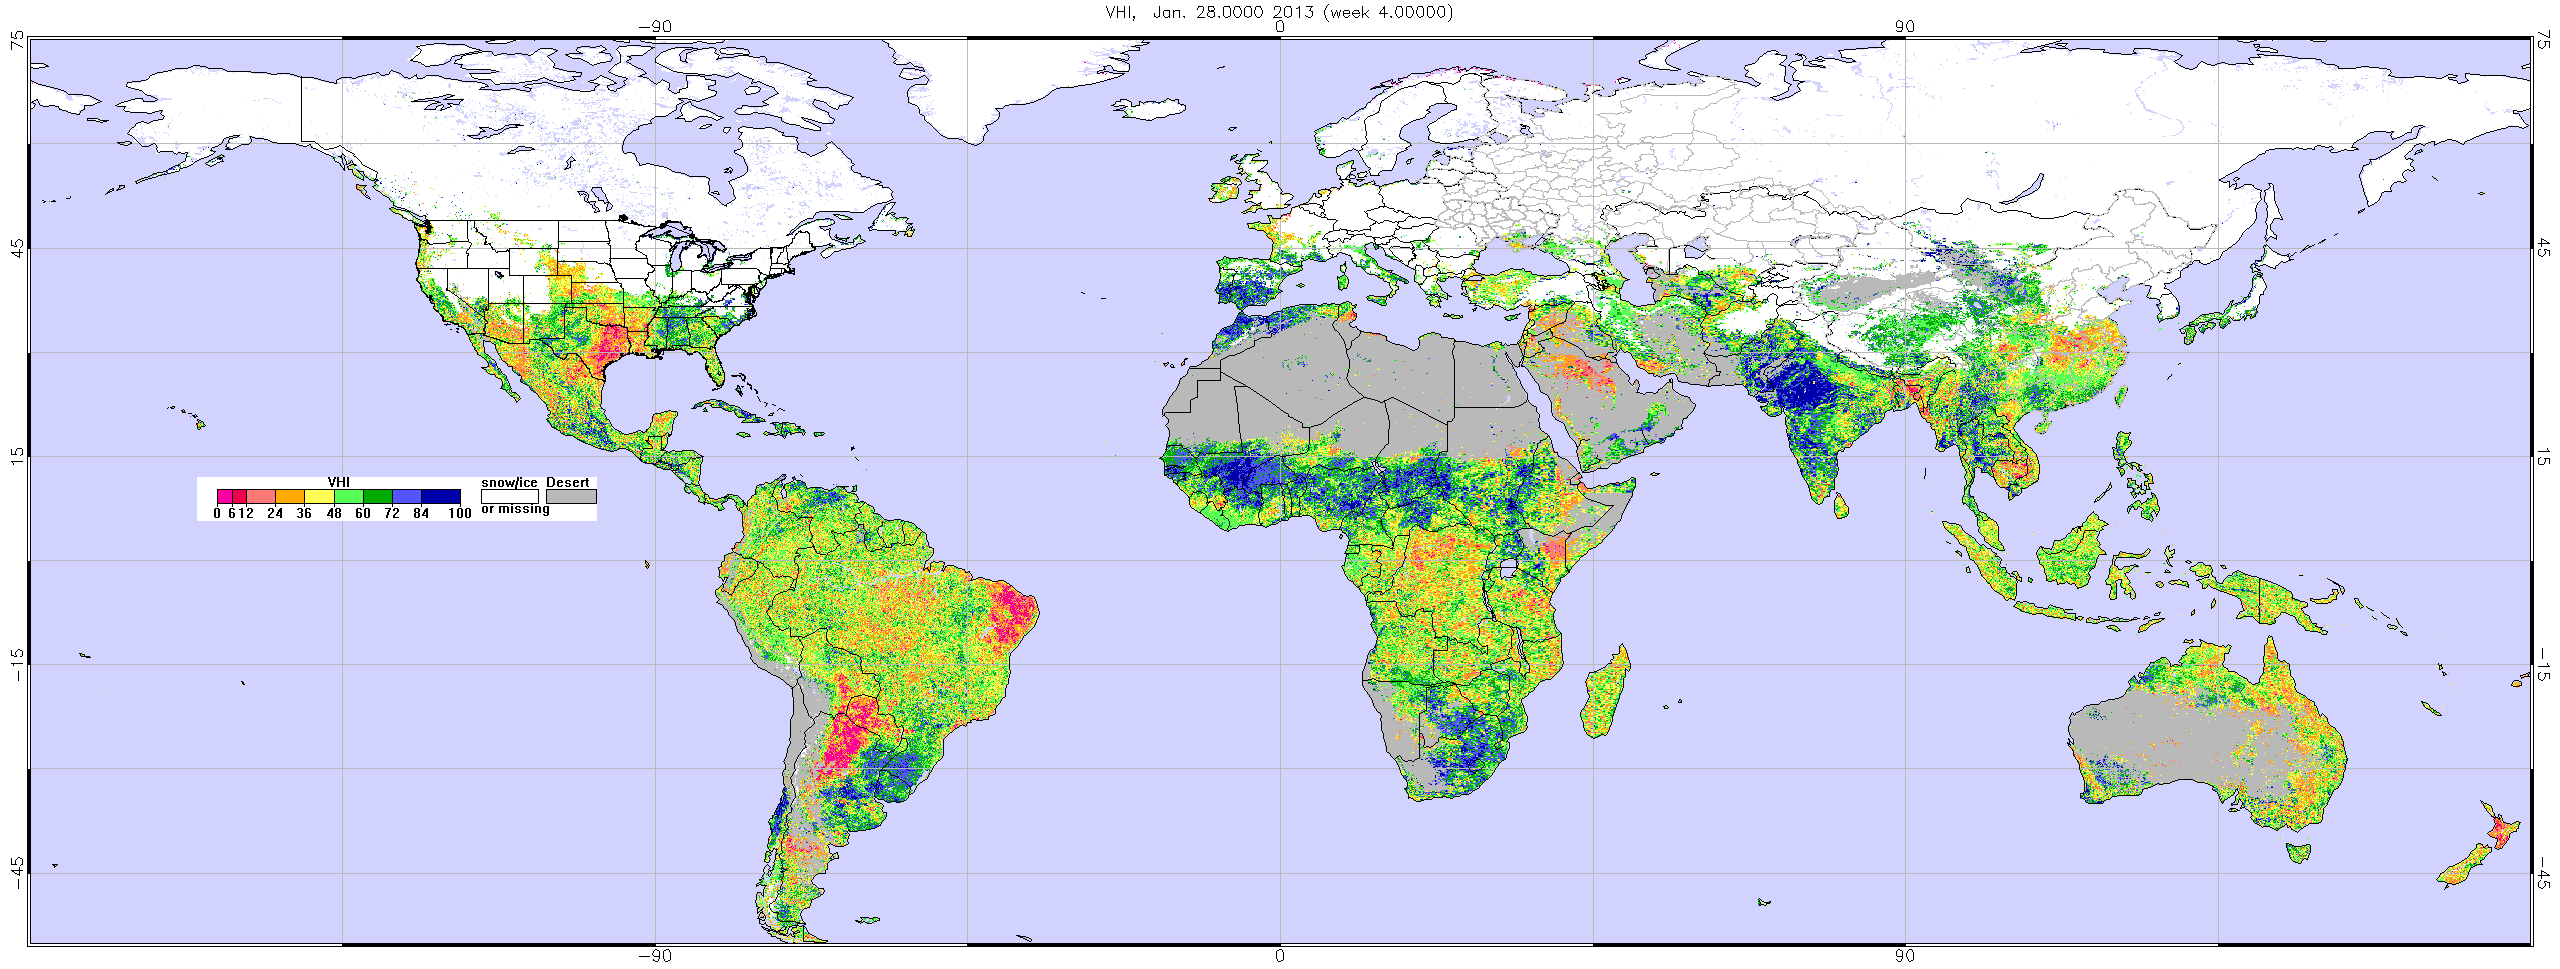
- the NOAA/NESDIS satellite-based Vegetation Health Index (VHI);
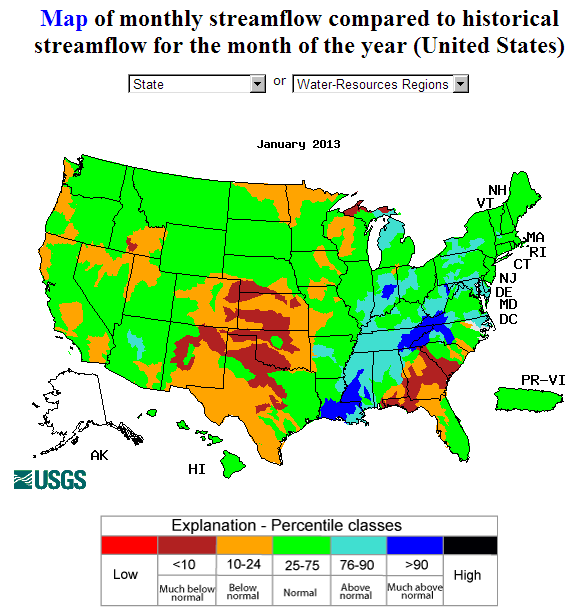
Hydrological:
Map showing NOAA/NCEP NLDAS modeled monthly streamflow anomaly.
- USGS observed streamflow percentiles;
- VIC 1-, 2-, 3-, and 6-month runoff percentiles;
- NLDAS model runoff anomalies and percentiles;
- NLDAS modeled streamflow anomalies and percentiles;
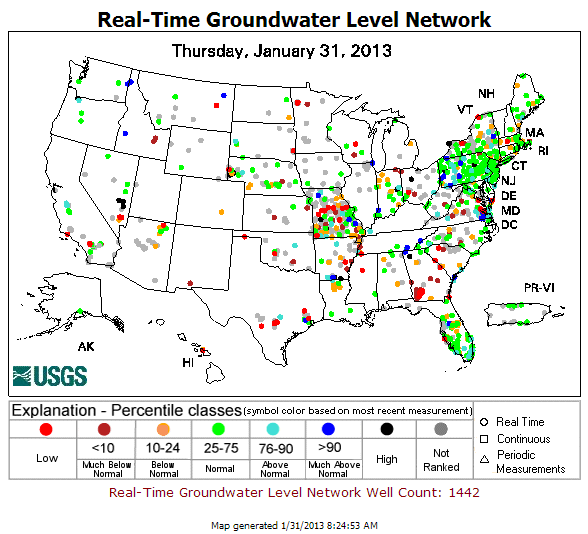
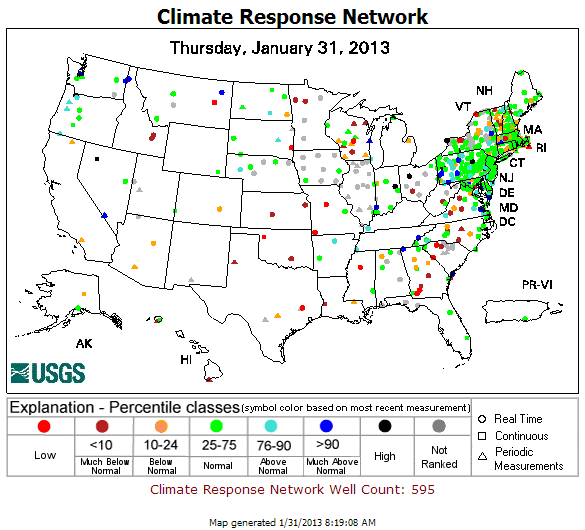
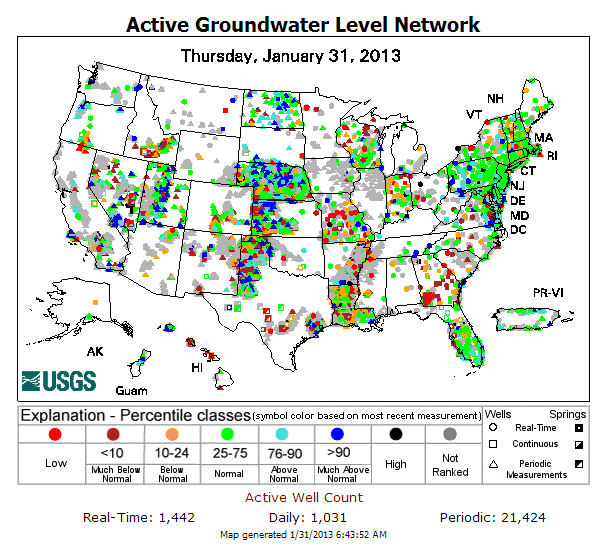
- USGS groundwater observations (real-time network, climate response network, total active network);
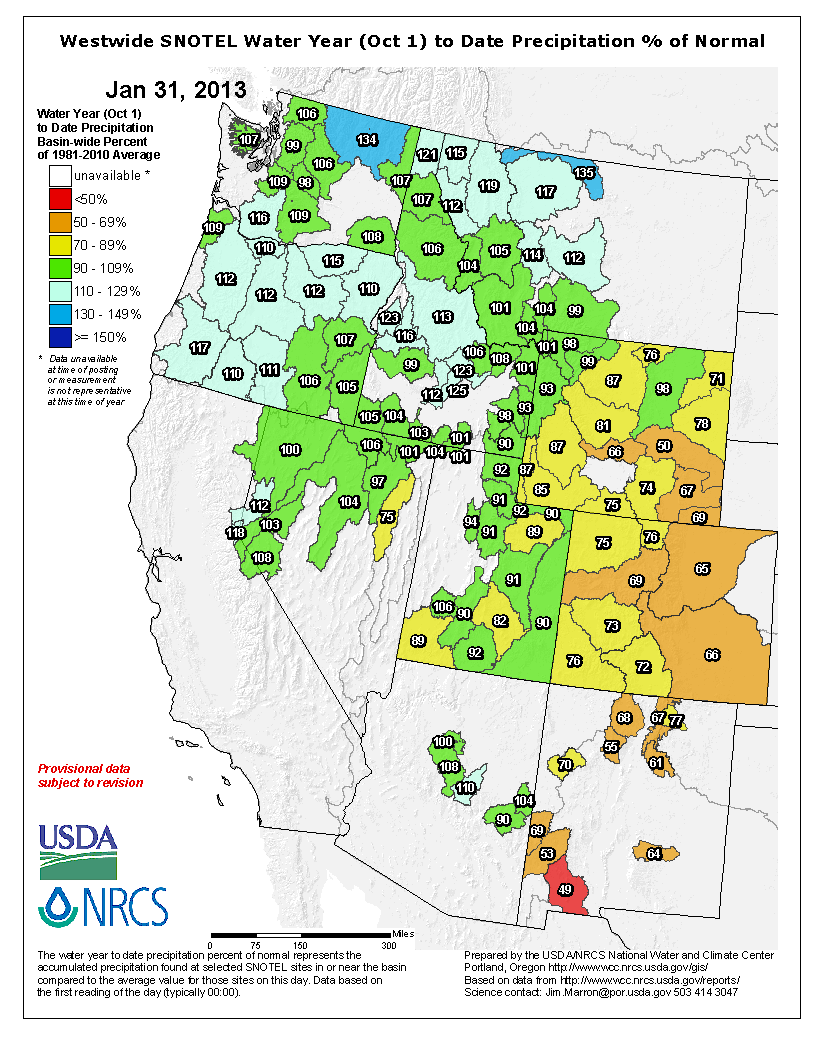
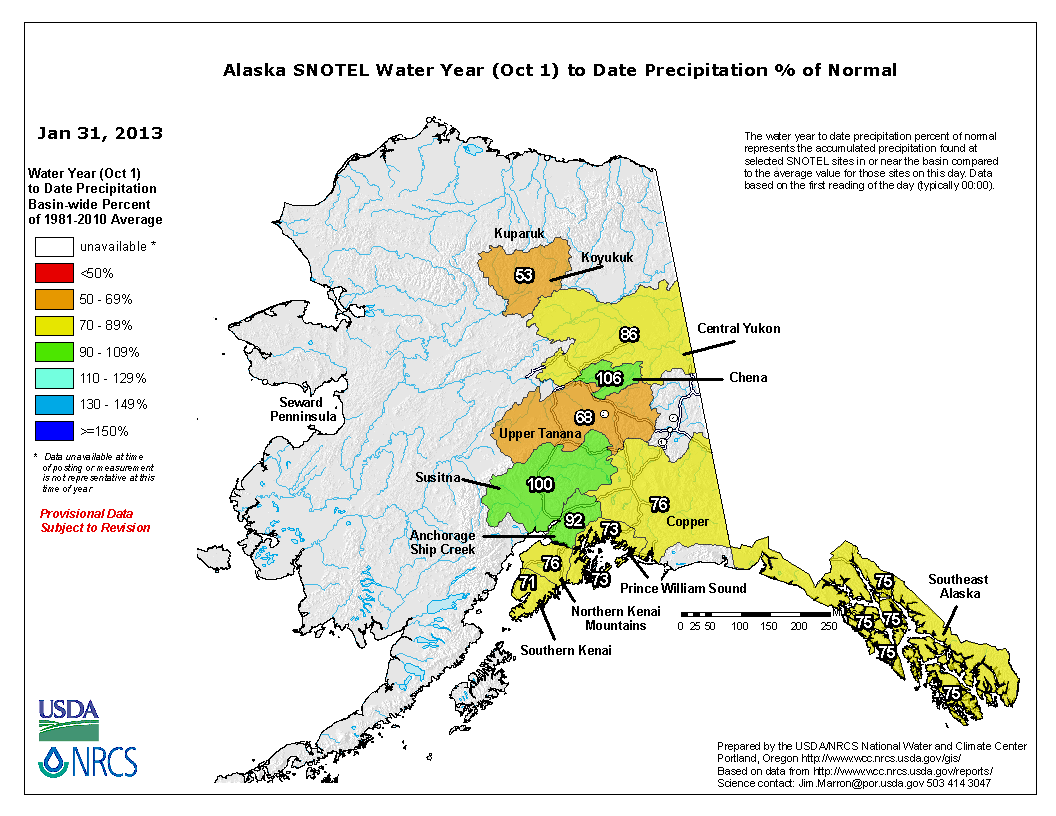
- USDA snow pack and snow water content observations for the West (SNOTEL station percentiles, SNOTEL station percent of normal, SNOTEL basin percent of normal and percent of average) and Alaska (SNOTEL station percent of normal, SNOTEL basin percent of normal);
- VIC modeled snow water content percentile;
- NOAA/Rutgers University Global Snow Lab satellite-observed snow cover anomalies;
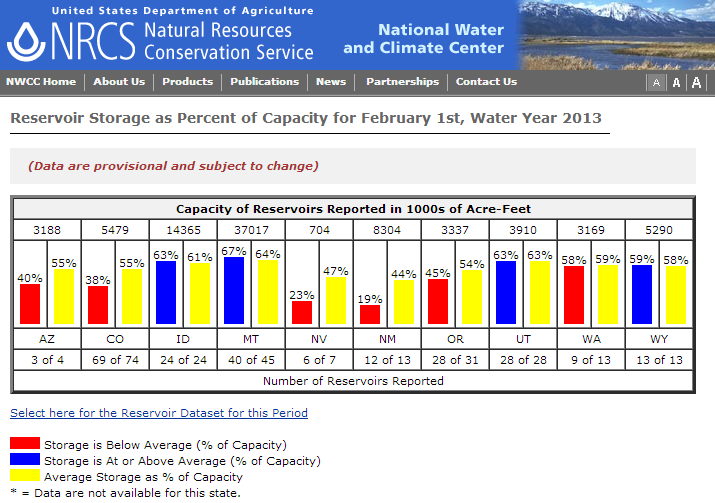
- USDA statewide reservoir storage as percent of capacity (with average depicted);
Meteorological:
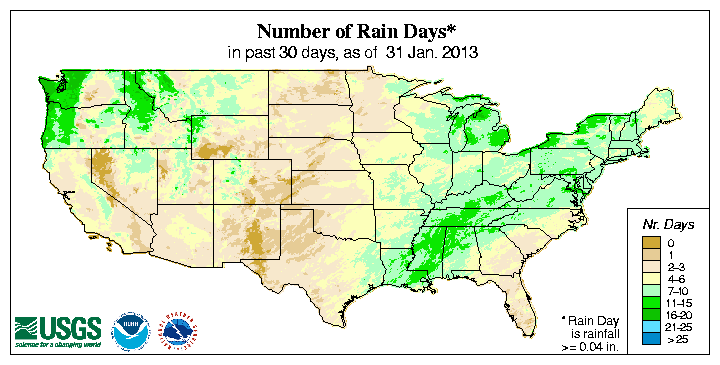
Map showing number of days with precipitation.
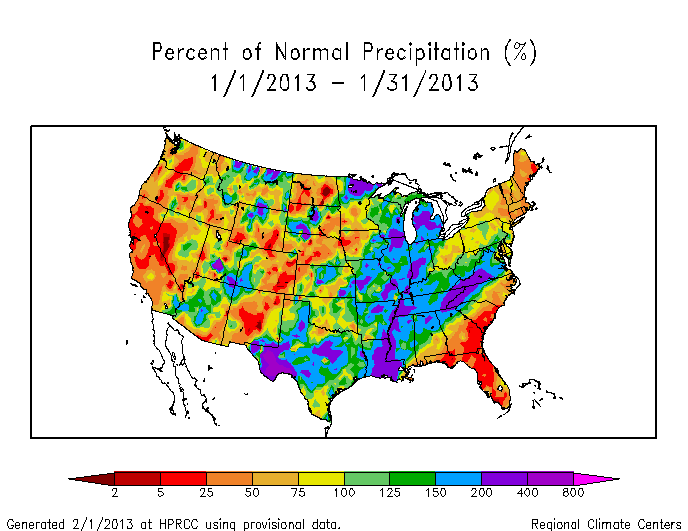
- monthly total precipitation (plotted by the USGS, NOAA National Weather Service [NWS], and NOAA High Plains Regional Climate Center [HPRCC]);
- monthly percent of normal precipitation and precipitation percentiles (NWS, CPC, HPRCC station observations, Leaky Bucket model), precipitation anomalies (CPC);
- NCDC monthly statewide precipitation ranks;
- USGS 30-day number of days with precipitation and maximum number of consecutive dry days;
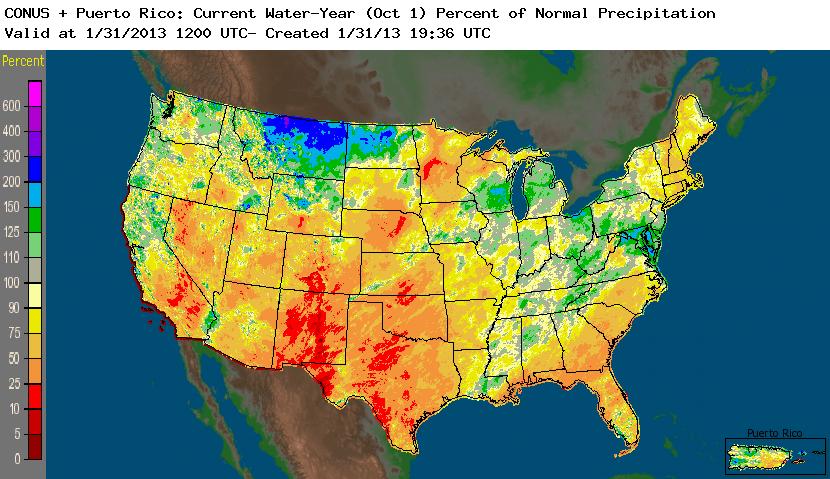
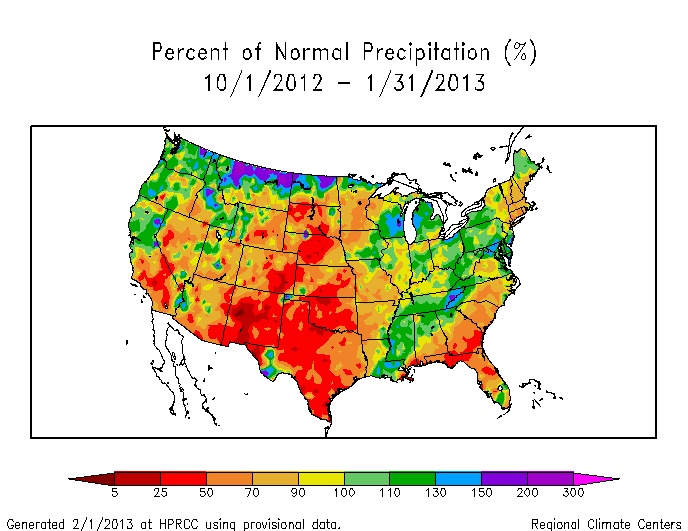
- water-year-to-date (October-present) percent of normal precipitation (NWS, HPRCC station observations, West SNOTEL stations, West SNOTEL and ACIS stations, Alaska SNOTEL stations, West basins, Alaska basins) and precipitation percentiles (West SNOTEL stations);
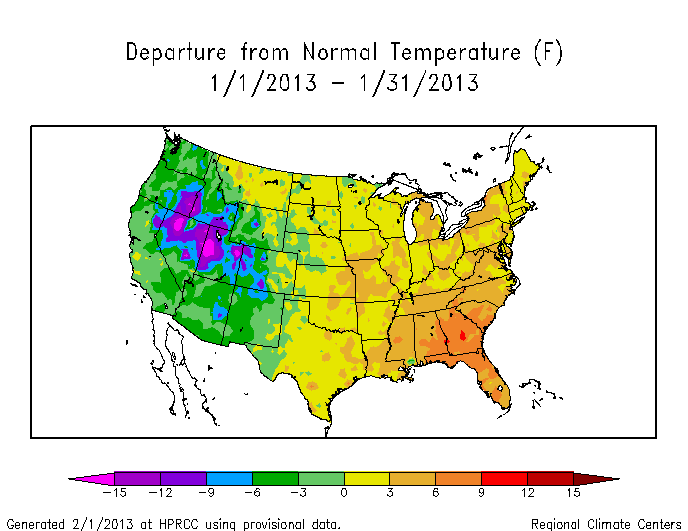
- monthly temperature departures from normal (CPC, HPRCC) and temperature percentiles (CPC, Leaky Bucket);
- NCDC monthly standardized temperature departures and statewide temperature ranks; and
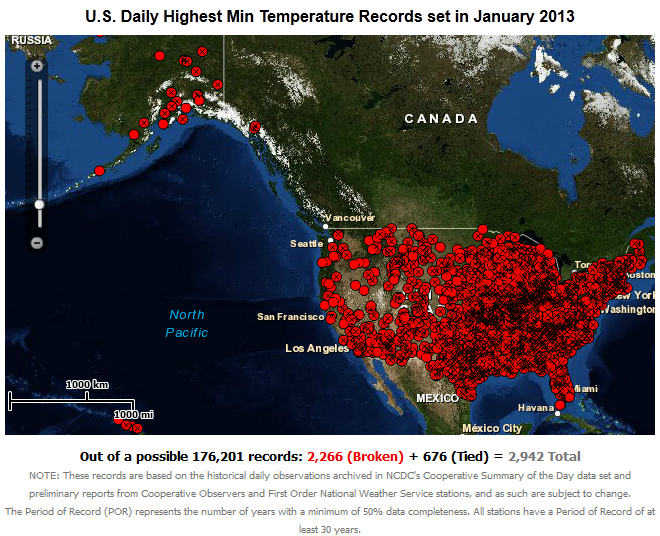
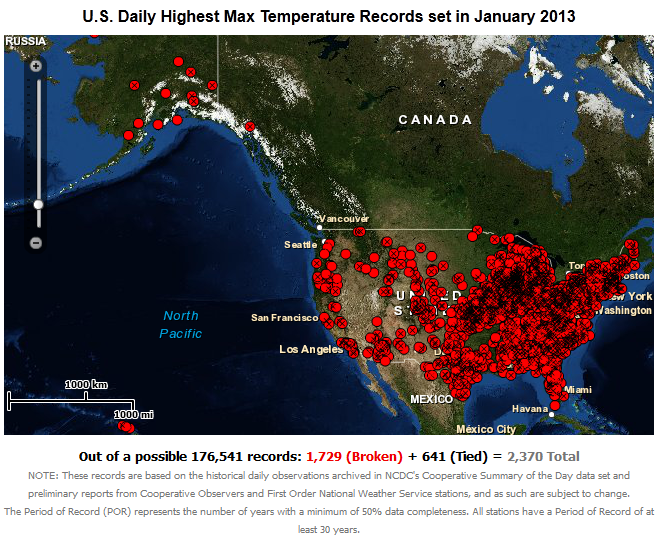
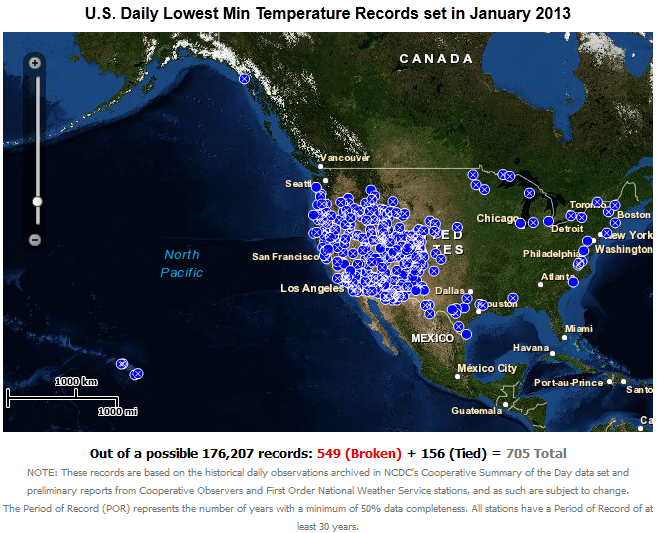
- number of record warm daily low temperatures, record daily high temperatures, record daily low temperatures, and record cool daily high temperatures, set during the month (from NCDC's daily records analysis).
![NOAA National Weather Service [NWS]](/monitoring-content/sotc/drought/2013/01/noaa-nws-ahps-pcp-amt-us-mtd-0131.jpg)
![NOAA High Plains Regional Climate Center [HPRCC]](/monitoring-content/sotc/drought/2013/01/noaa-hprcc-pcp-amt-us-1m-0131.png)
Regional Discussion
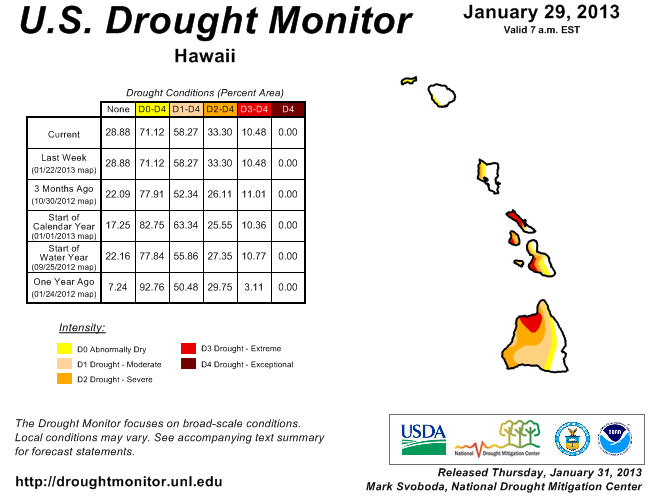
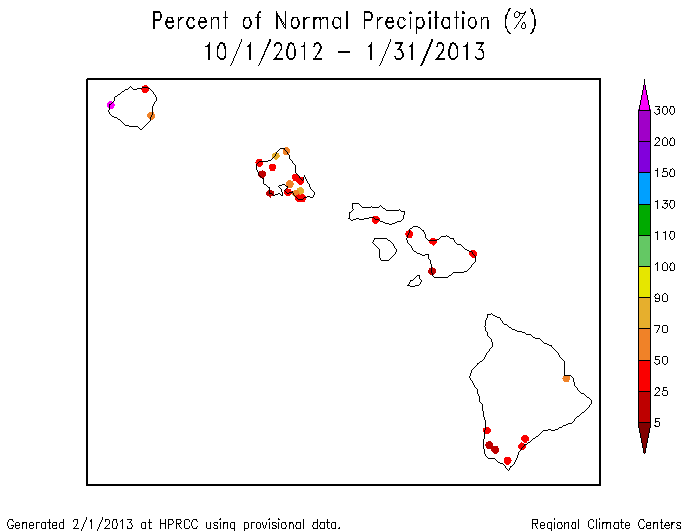
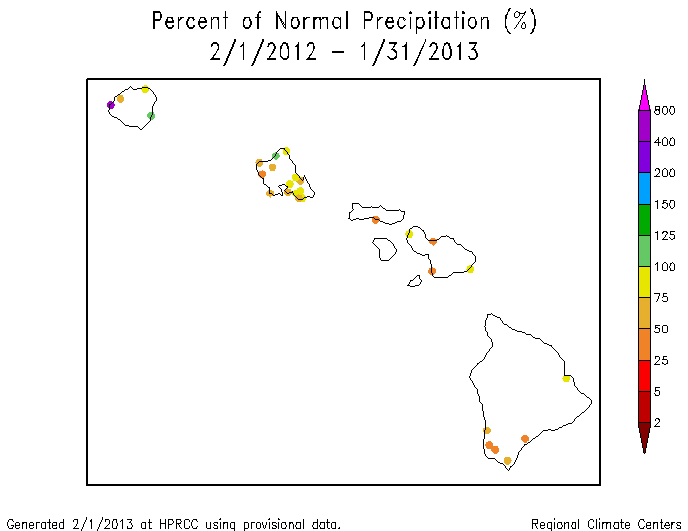
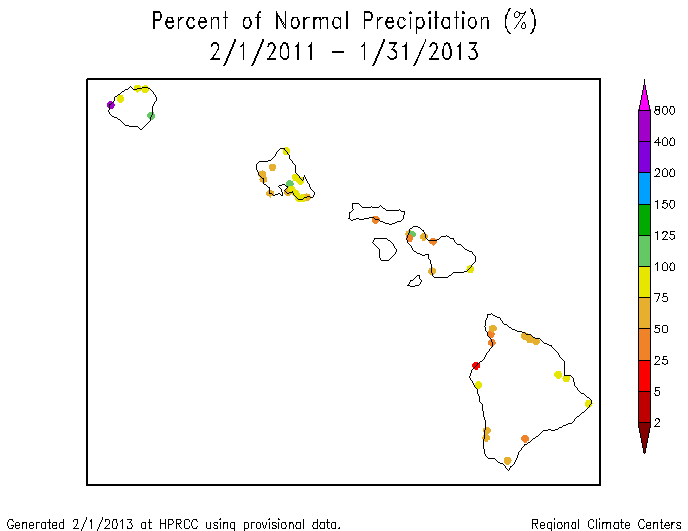
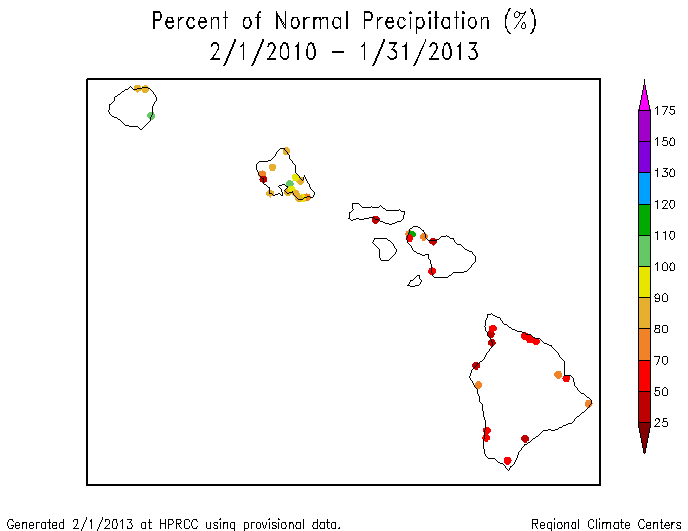
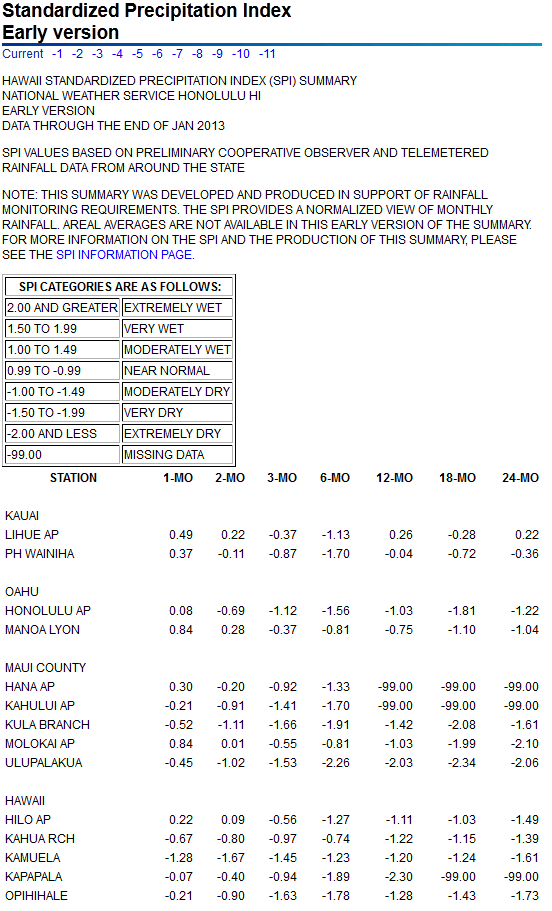
Hawaii: January 2013 was drier than normal for the southeastern islands but near to wetter than normal for the northwestern islands. But the pattern was drier than normal for most stations in Hawaii for much of the last three years (last 2, 3, 4, 6, 10, 12, 24, and 36 months). The January rains increased streamflow and reduced the moderate to extreme drought area from 63 percent of the state last month to 58 percent this month.
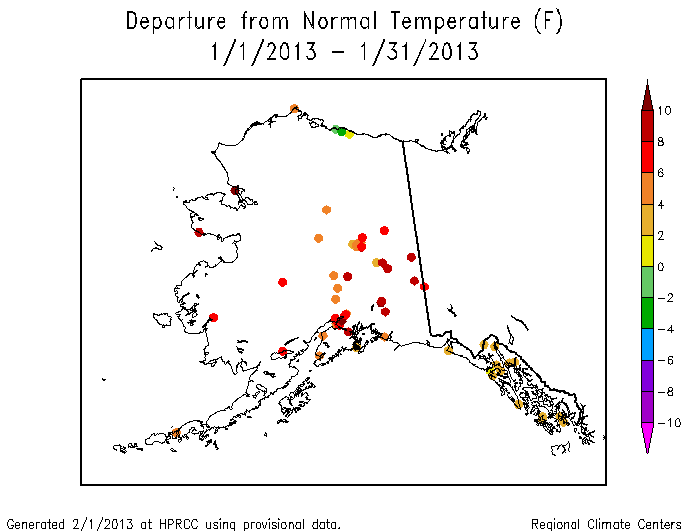
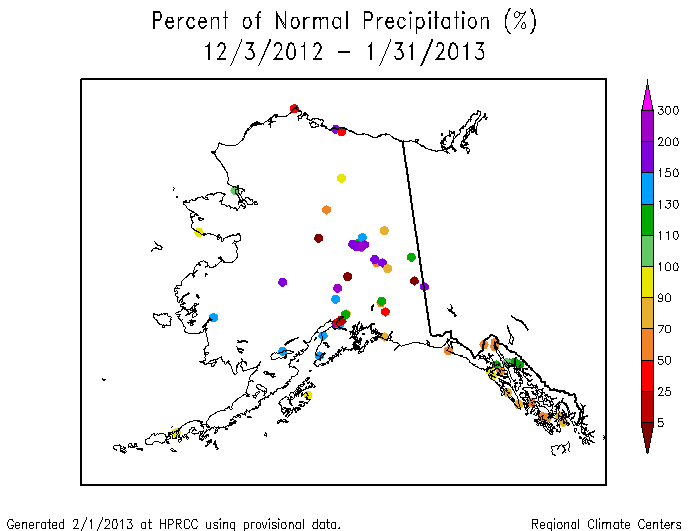
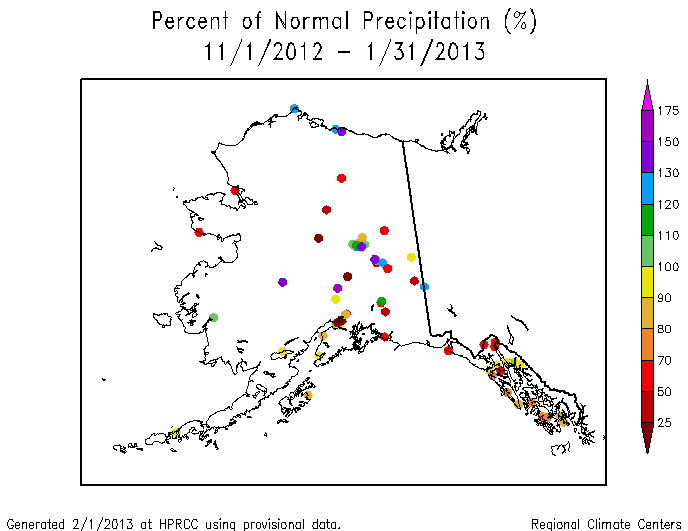
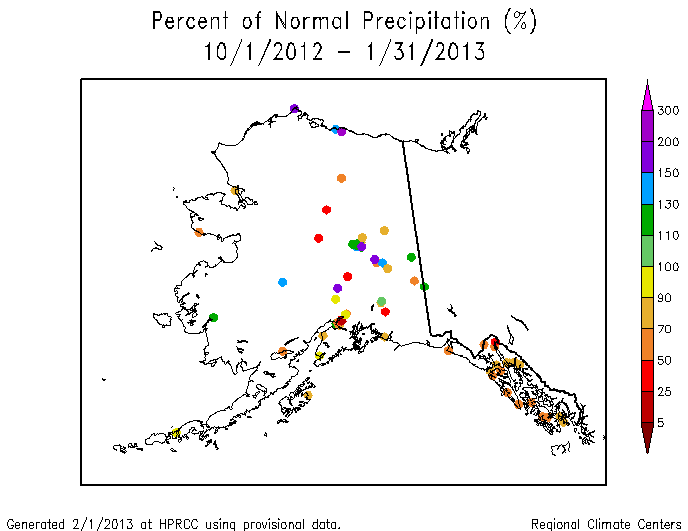
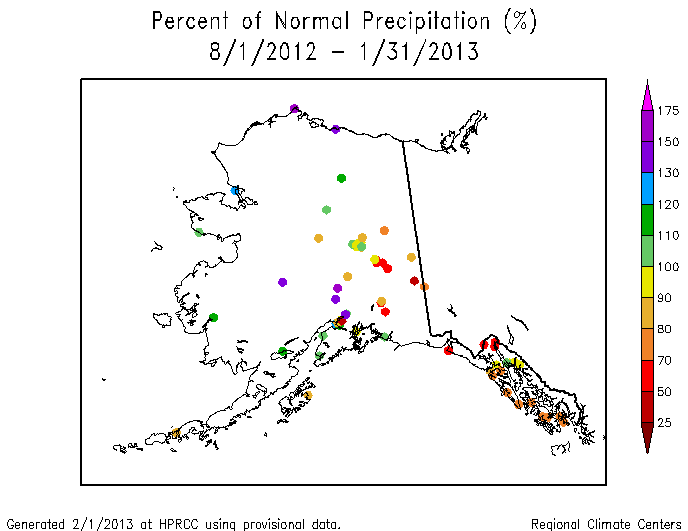
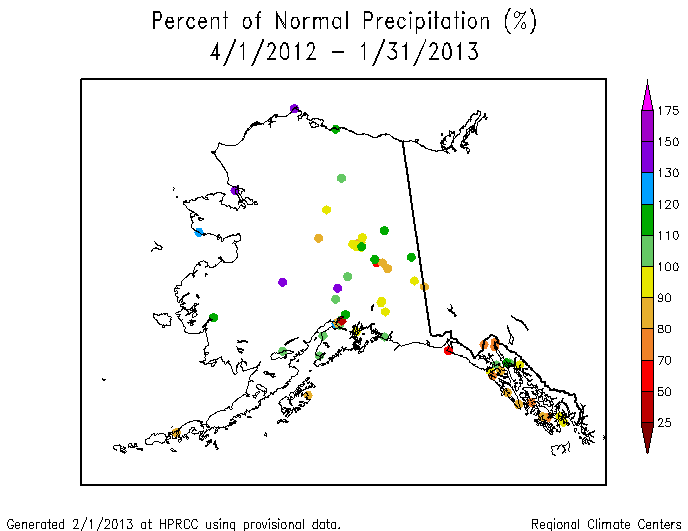
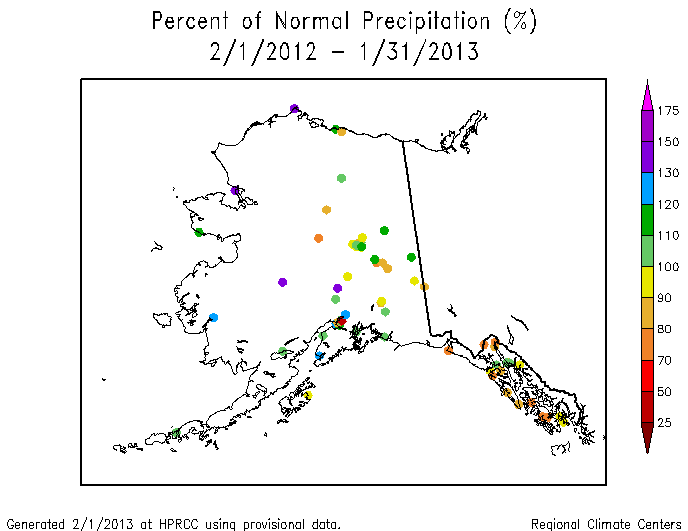
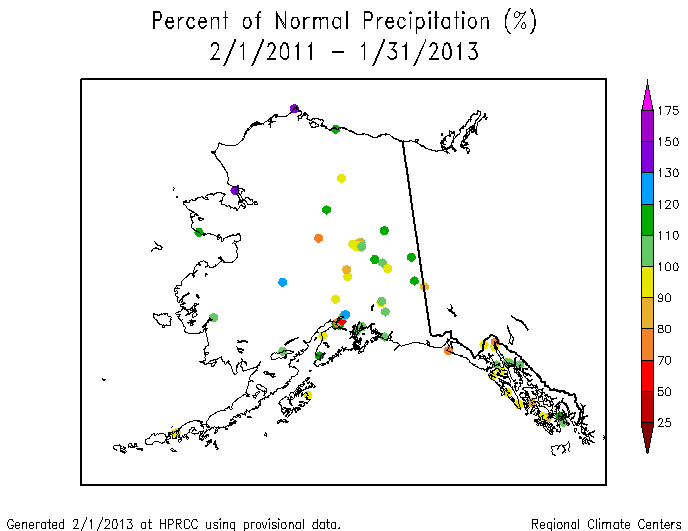
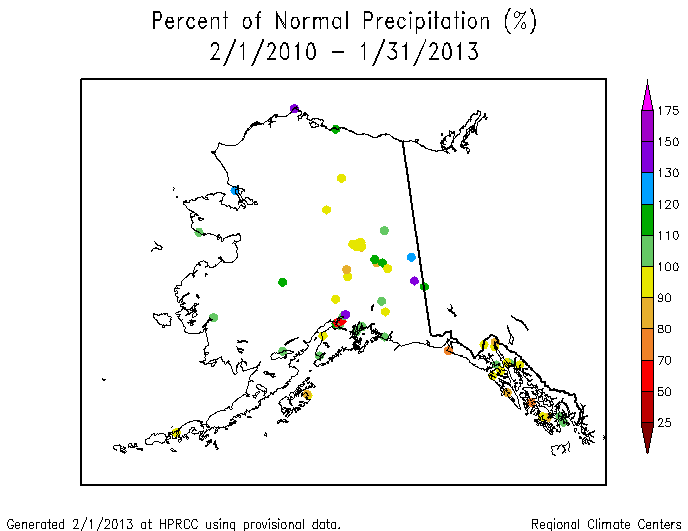
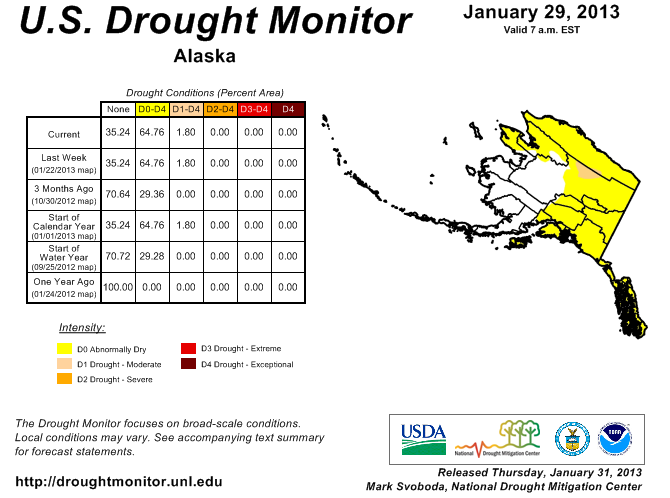
Alaska: Most of the stations in Alaska were wetter and warmer than normal during January 2013. But drier-than-normal areas are evident at 2 months, with the dryness more widespread and intense at intermediate time scales (3, 4, and 6 months). The pattern is mixed at longer time scales (10, 12, 24, and 36 months). Abnormal dryness covers the northern and eastern two-thirds of the state on the USDM map with a spot of moderate drought in the Koyukuk Basin where the water content of the snowpack and water-year-to-date (October-present) precipitation were low.
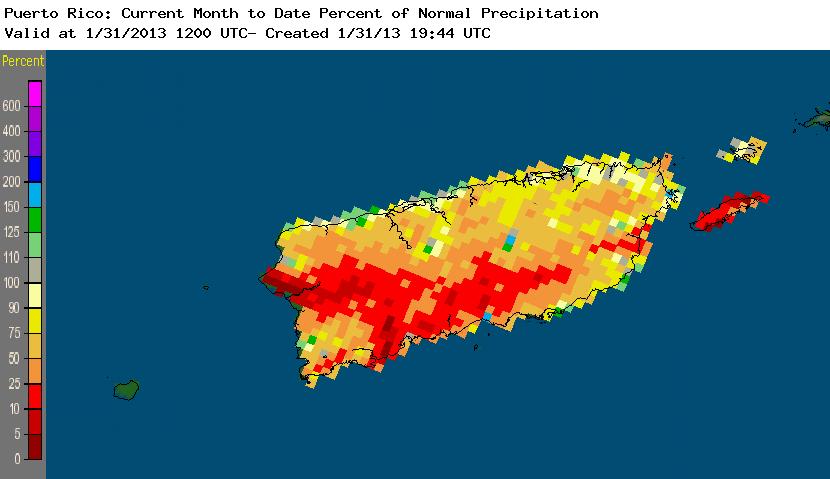
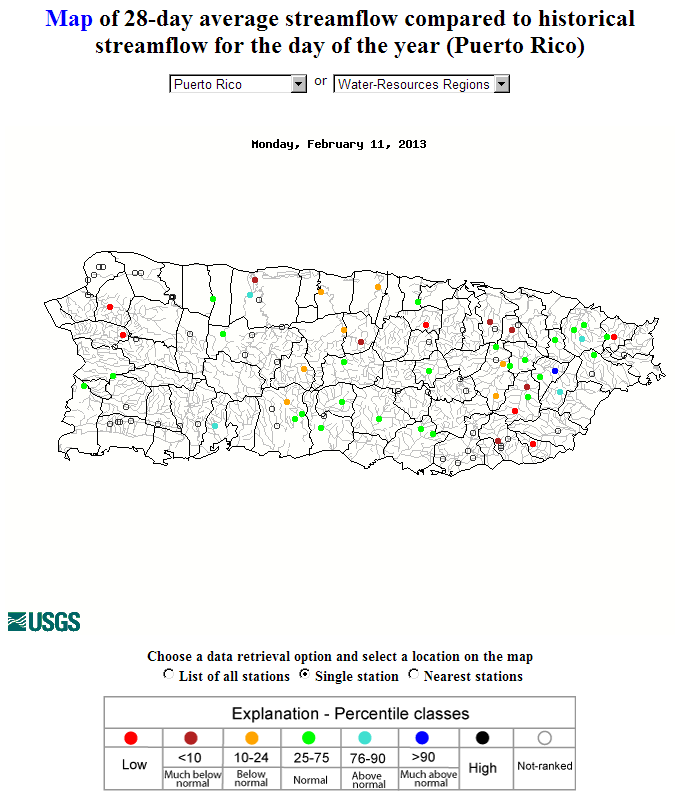
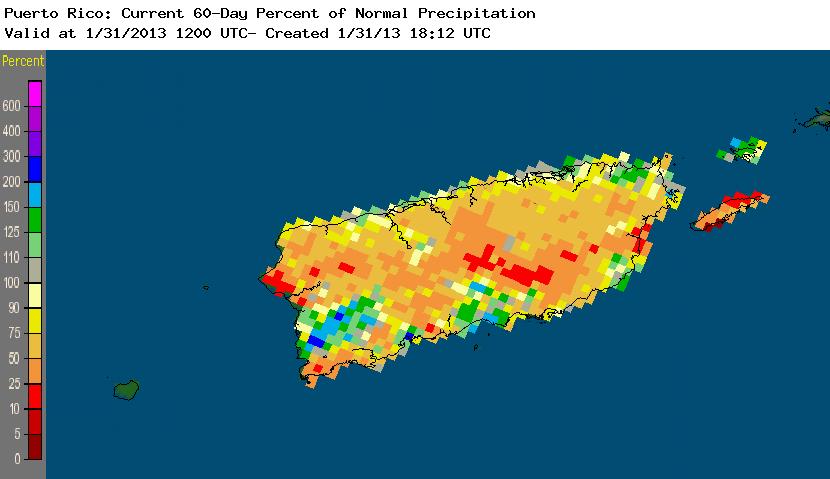
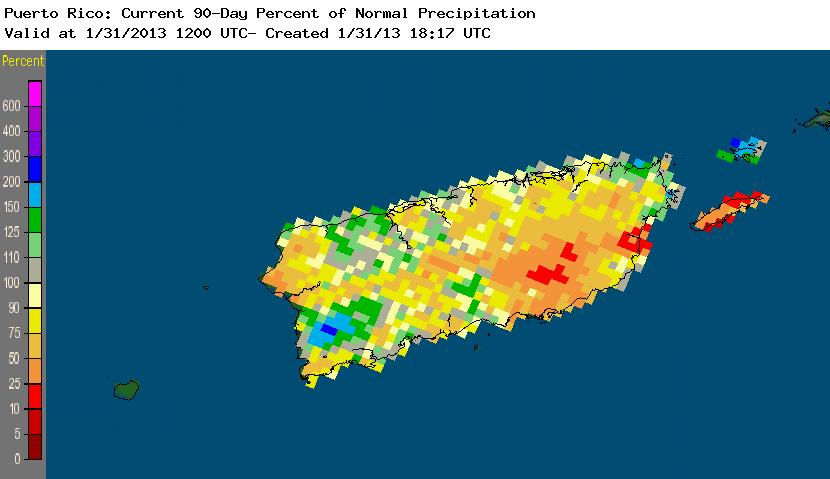
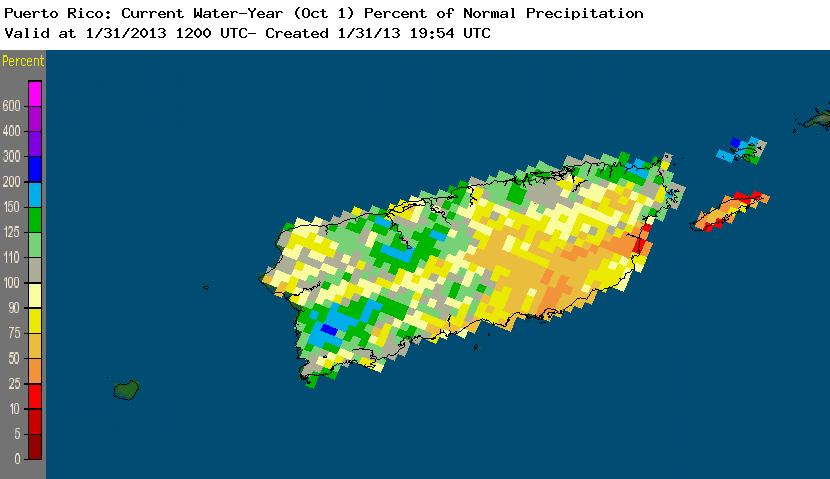
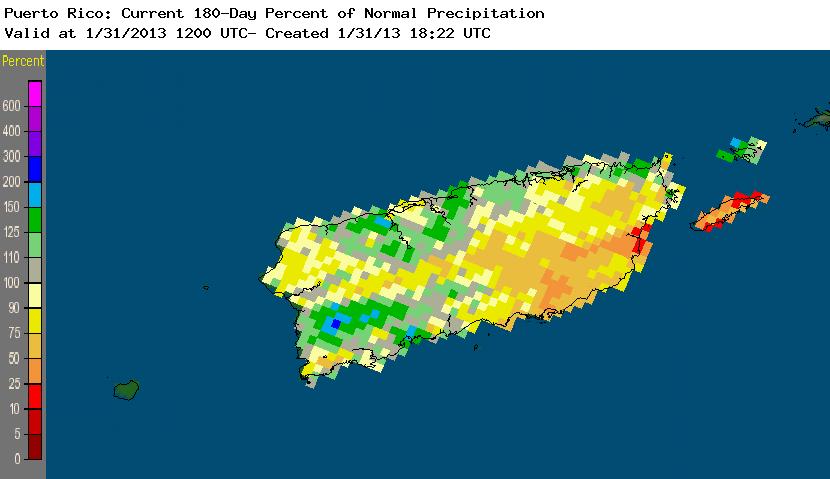
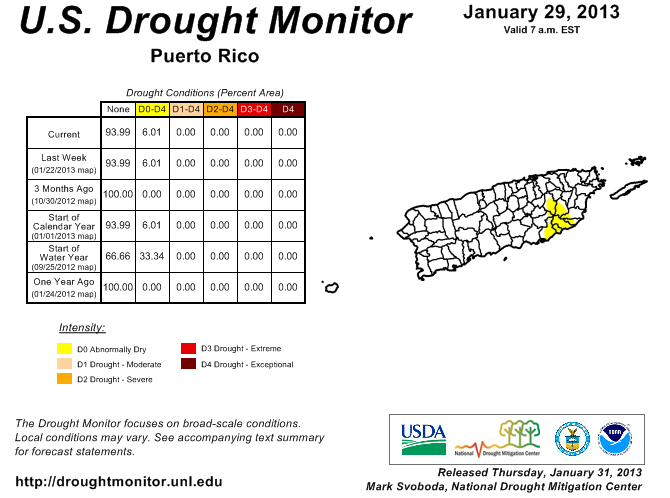
Puerto Rico: January was a very dry month for Puerto Rico, especially the western and southern areas, with low streamflows at some stations. But at longer time scales, the area with the driest anomalies shifted to the southeast (last 2, 3, 4, and 6 months), where an area of D0 (abnormally dry) reflected the dryness on the USDM map.
 |
|
On a statewide basis, January 2013 ranked in the top ten driest category for three states (California, Florida, and Connecticut) and eleventh driest for Maine and Rhode Island. Fourteen other states ranked in their driest third of the historical record — in New England, the Southeast, and Central Plains to West. Dryness at three months was centered in the Great Plains, Southeast, Mid-Atlantic, and New England, where 16 states ranked in the driest third of the historical record — three of which (Florida, Connecticut, and New Hampshire) had a top ten driest November-January.
|
|
At the six-month time scale the Rockies to Great Plains and Upper Midwest were the epicenter of dryness, with the Southeast also dry. Nebraska had the driest August-January in the 1895-2012 record and four other states ranked in the top ten driest category. It was so dry in Nebraska that the state was driest for all seasons from 5 months (September-January) to 12 months (February-January).
 |
 |
The spatial pattern of dryness for the 12-month period (February 2012-January 2013) was similar to that for the last 6 months, except the dryness stretched further into the Ohio Valley and included states along the Mid-Atlantic coast and in New England. Nebraska and Wyoming had the driest February-January on record and four other states ranked in the top ten driest category, including New Mexico, Colorado, Missouri, and Delaware. It was so dry in Wyoming that the state was driest for all seasons from 10 months (April-January) to 12 months (February-January).
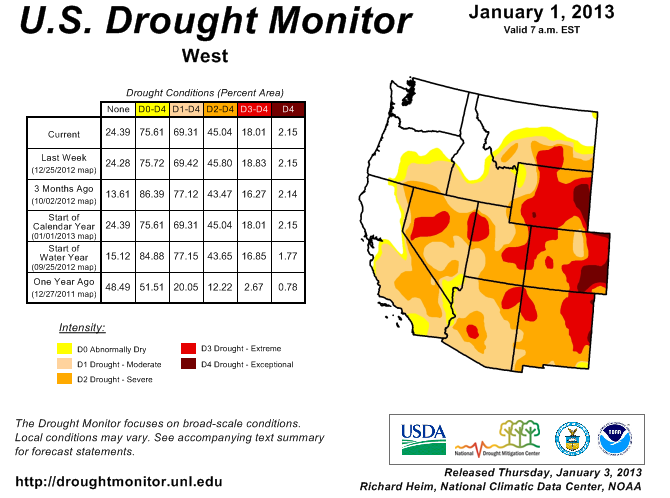
Percent area of the Western U.S. in moderate to extreme drought, January 1900 to present, based on the Palmer Drought Index.
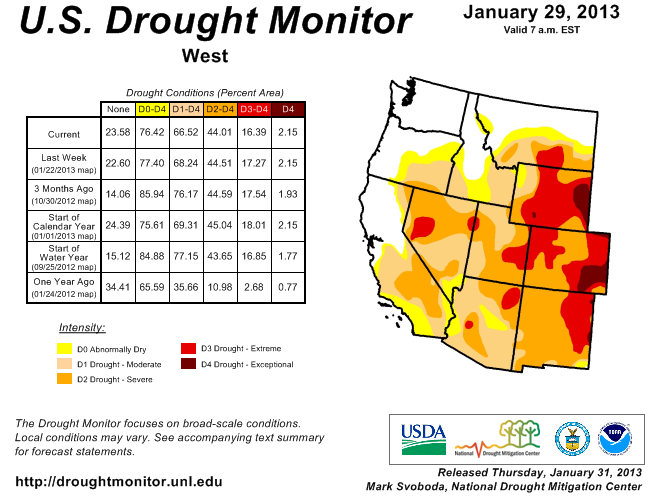
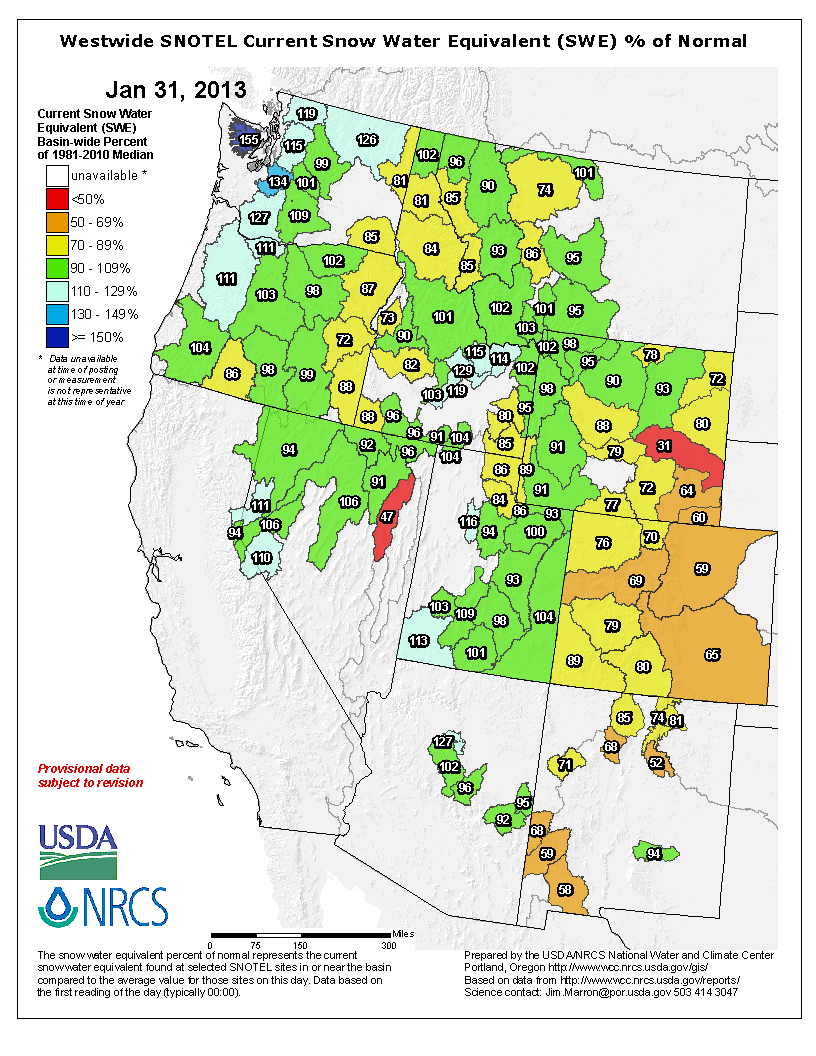
Beneficial rain and snow fell across part of the West during January, but much of the region was drier than normal. Water year-to-date (October-present) precipitation was above-normal in the northwestern regions and below-normal in the southeastern areas of the West — especially in the Central and Southern Rockies — as seen in high elevation (SNOTEL) station percentiles and basin averages. Low elevation station observations indicated dryness also across much of the Great Basin. Snow pack water content (station percentiles and percent of normal, basin percent of normal) was much below-normal in the Central to Southern Rockies and below normal across parts of the Great Basin and Pacific Northwest. Reservoir storage was below average in several states in the Southwest (Arizona, Colorado, New Mexico) and Great Basin to Northwest (Nevada and Oregon), but near to above average in the other states. According to the USDM, 66.5 percent of the West was experiencing moderate to exceptional drought at the end of January, a 2.8 percent decrease compared to last month. The Palmer Drought Index percent area statistic was about 49 percent, an increase of about one percent compared to last month.
|
|
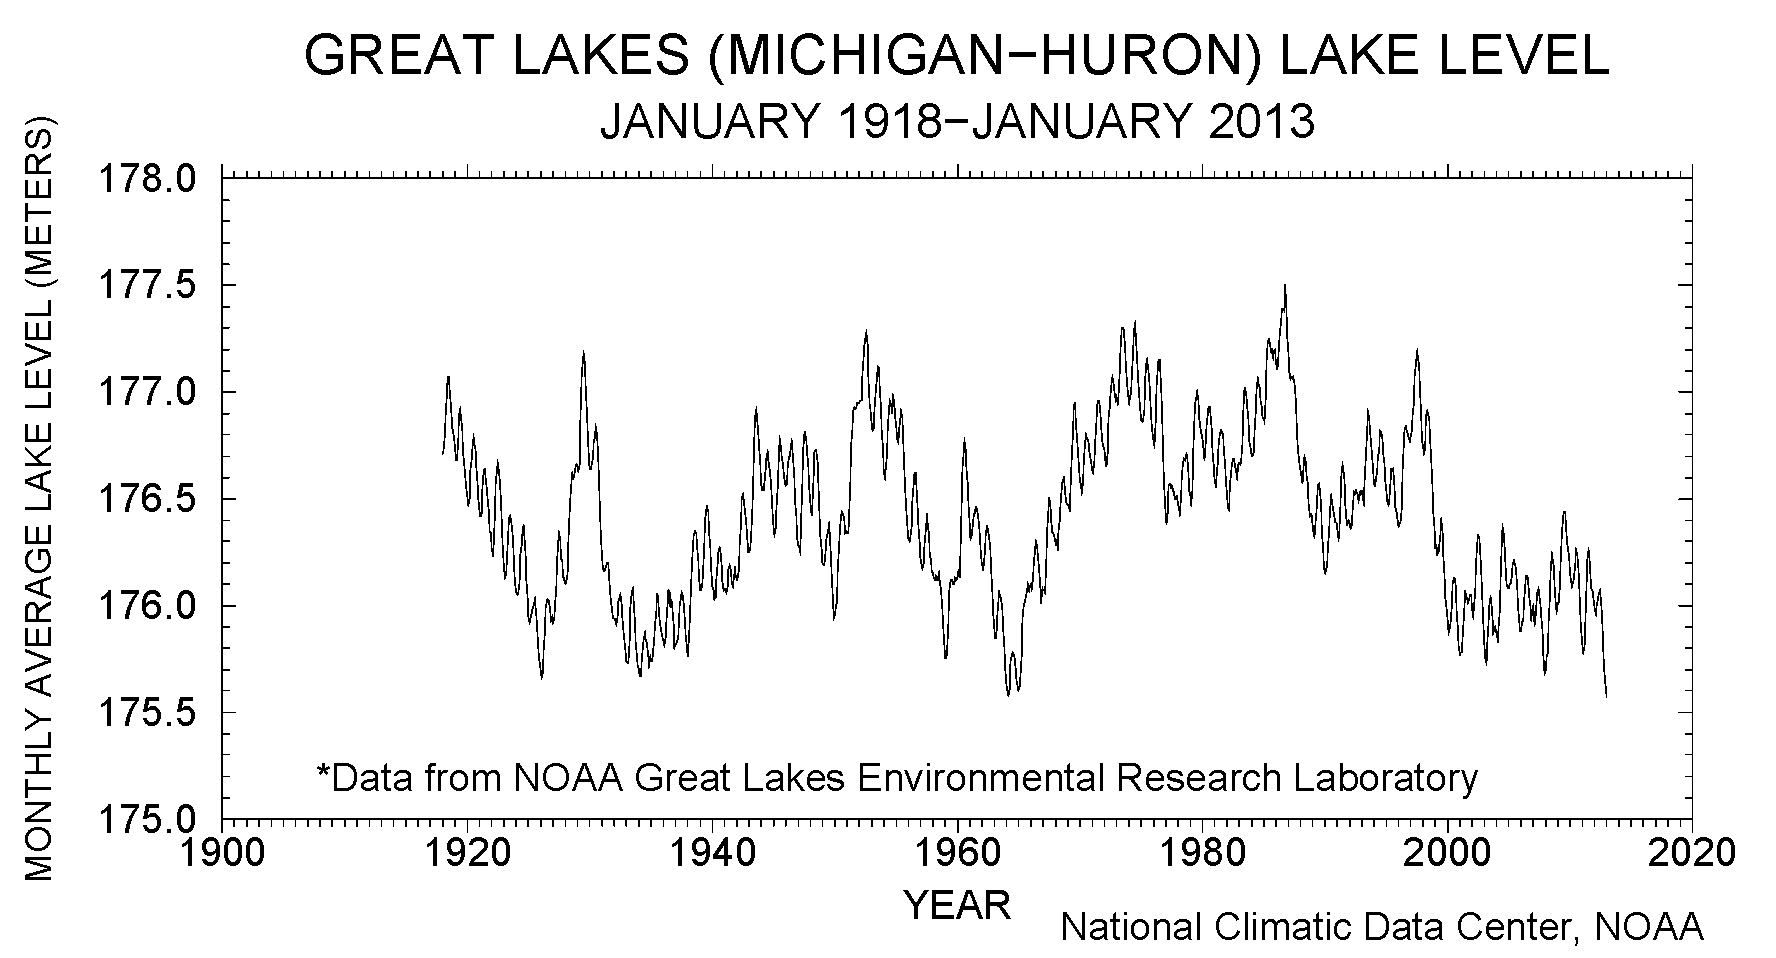
Monthly level (meters) of Great Lakes Michigan and Huron, January 1918-January 2013.
Recent media reports carried an announcement by the U.S. Army Corps of Engineers that two of the Great Lakes (Michigan and Huron) reached their lowest level in the 1918-present record at the end of January 2013 (see graph to right), and the other Great Lakes (Superior, Erie, and Ontario) were also well below average. Temperatures have been warm, with the U.S. side of the Great Lakes river basin experiencing the second warmest February-January 12-month period in the 1895-2013 record during February 2012-January 2013. Precipitation on the U.S. side for this period ranked only 59th driest for the entire Great Lakes basin, which is near the long-term average but also is a significant departure from the unusual wetness of the last ten years. Evaporation is dependent on temperature, humidity, wind, and the amount of solar radiation (sunlight). While potential evapotranspiration in recent years has been high due to anomalously warm temperatures, the unusually wet conditions basinwide on the U.S. side during the last decade have kept the Great Lakes basin PHDI from reaching extreme drought levels.
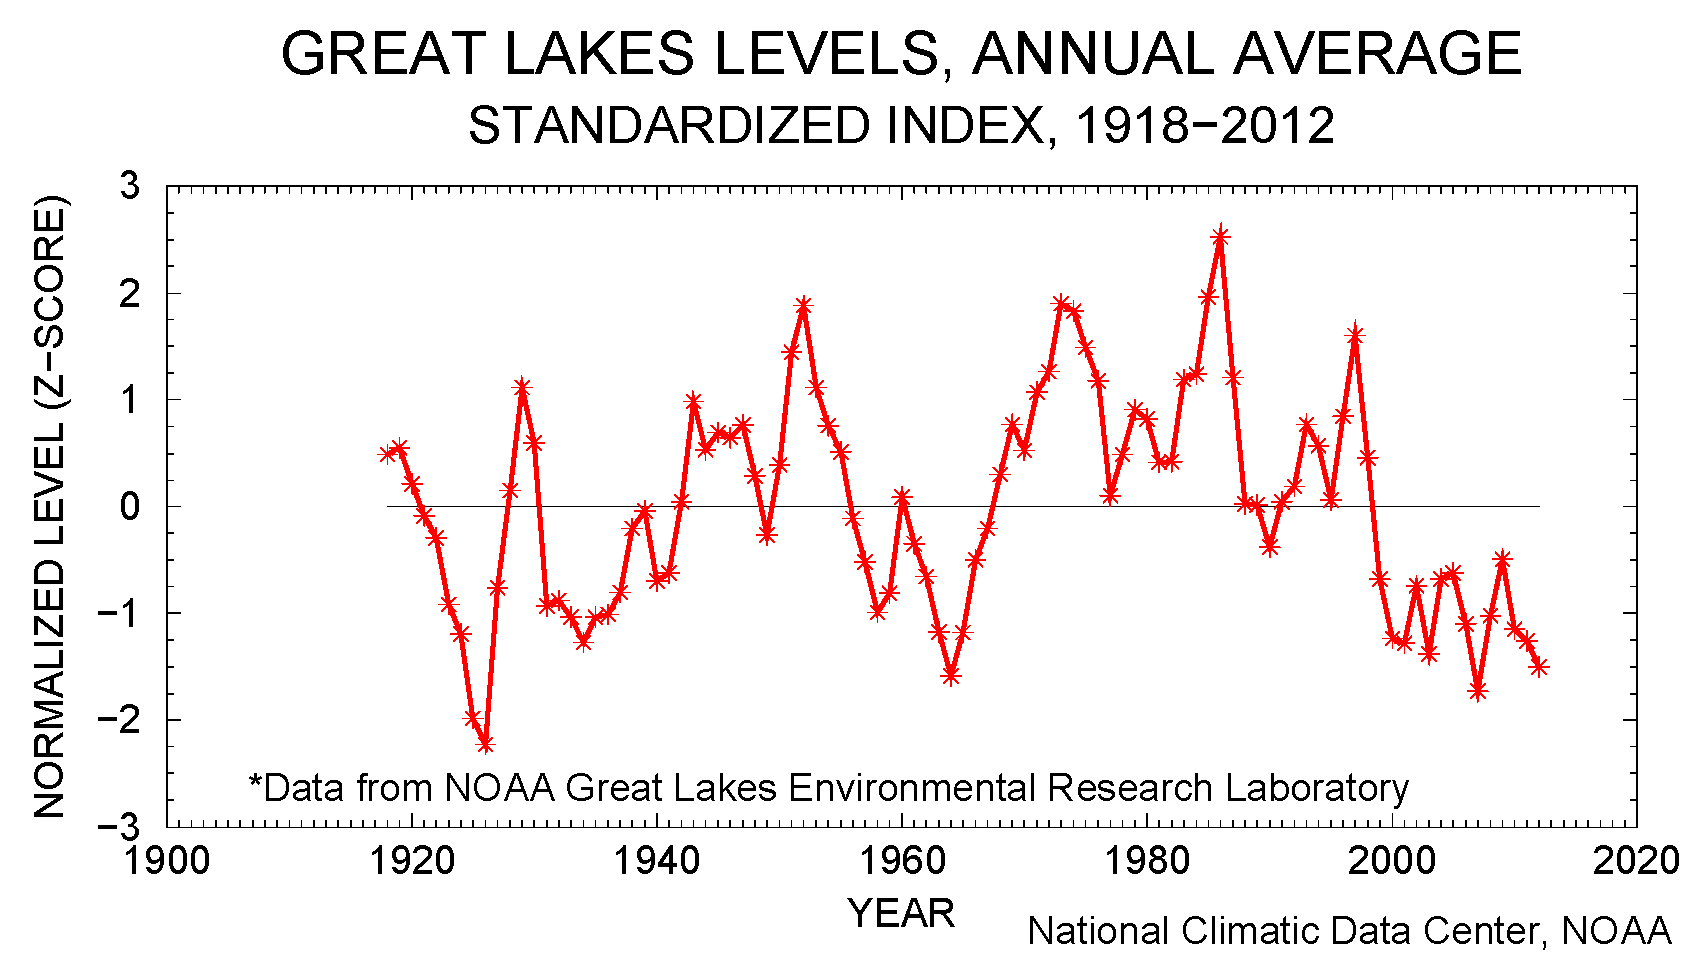
Annual average lake level for Great Lakes, 1918-2012, normalized by mean and standard deviation and area-averaged across the lakes.
In the graph to the left, the annual averaged lake level for each of the Great Lakes was normalized using the lakes' long-term average and standard deviation. The normalized z-scores were weighted by lake area to compute a basinwide averaged z-score, which was then itself normalized. Basinwide, the lake levels for the last 14 years (beginning in 1999) have been consistently well below average. Other periods with consistently below-average lake levels, basinwide, include 1956-1967 (which encompasses the 1960s national drought centered in the Northeast), 1931-1941 (the Dust Bowl of the 1930s decade), and 1921-1927 (which encompasses the 1920s national drought centered in the Southeast). For each of these earlier low lake level periods, the Great Lakes experienced persistent severe drought basinwide.
Great Lakes basin temperatures undergo a seasonal cycle with summer being the hottest time of year (with maximum seasonal evaporation) and winter being the coldest (with minimal seasonal evaporation). In 2012, the Great Lakes basin experienced the 13th warmest April-September (warm season) in the 1895-present record, with April-September temperatures well above the long-term average for most of the last 15 years. The basin had the warmest October-March (cold season) in 2011-2012, and likewise the October-March temperatures have been well above the long-term average for most of the last 15 years. The 2012-2013 cold season has also started well above average for the basin, with October 2012-January 2013 ranking as the 22nd warmest October-January. Warm season precipitation (April-September) was below average basinwide in 2012, but it has been generally above average for most of the last 15 years. Cold season precipitation (October-March) has been consistently much wetter than average for the last eleven years, with the current season-to-date (October 2012-January 2013) ranking tenth wettest. It is clear that the low lake levels of the recent decade are less dependent on precipitation than the low lake levels of the 20th century, and temperature may be playing a more significant role.
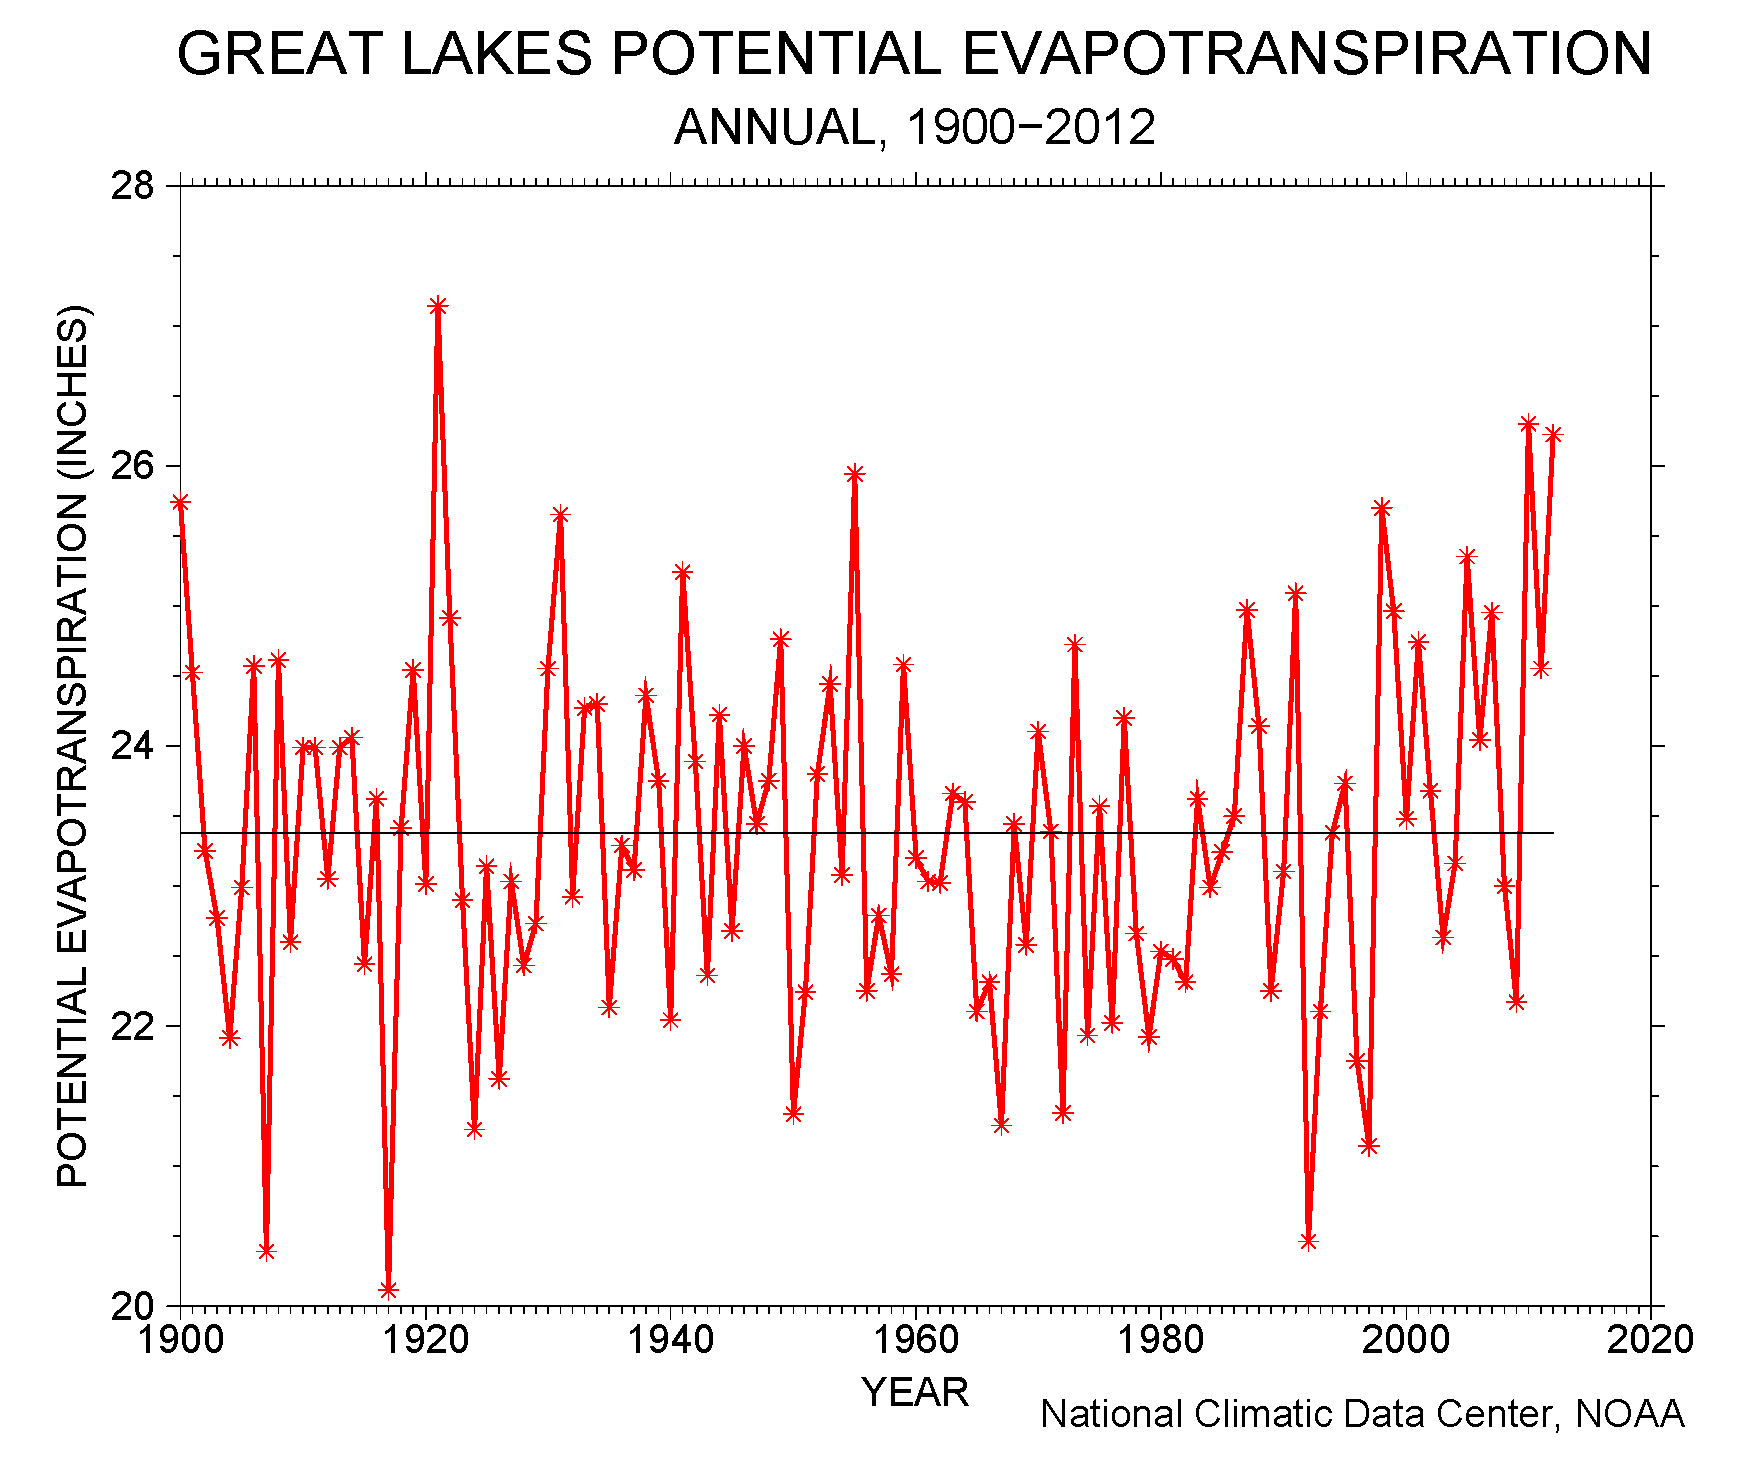
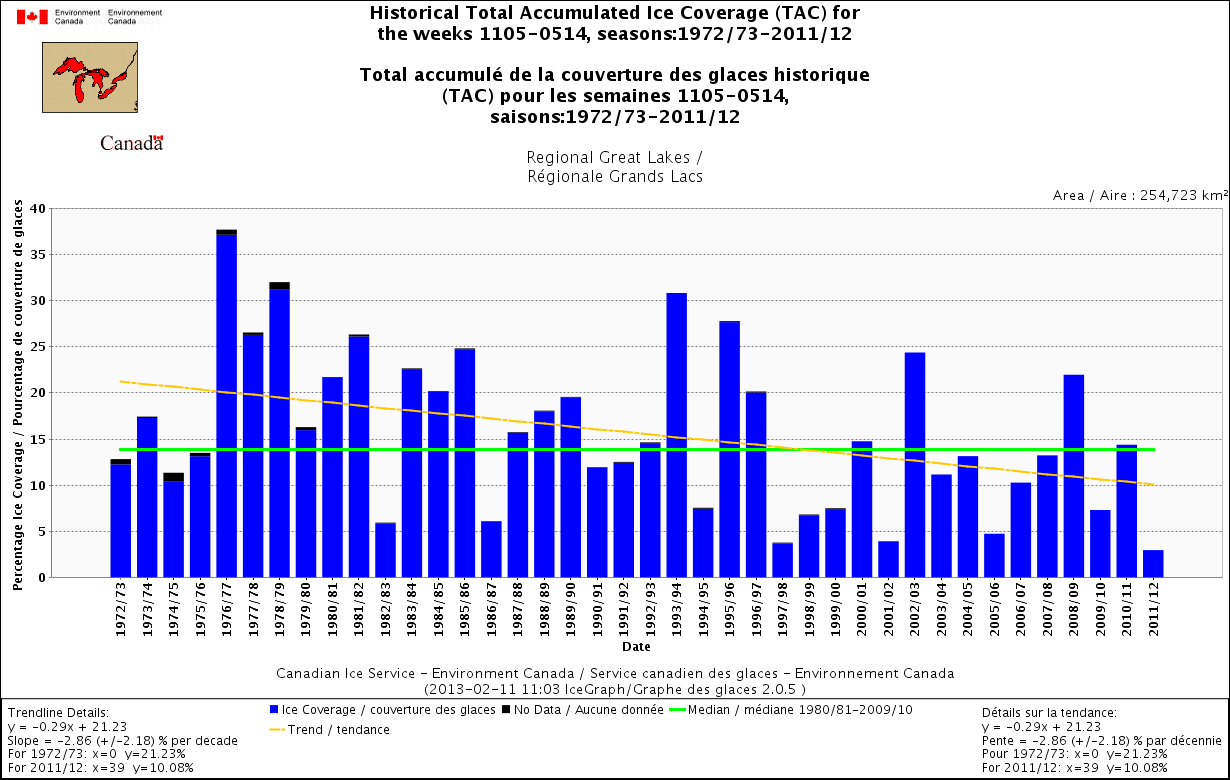
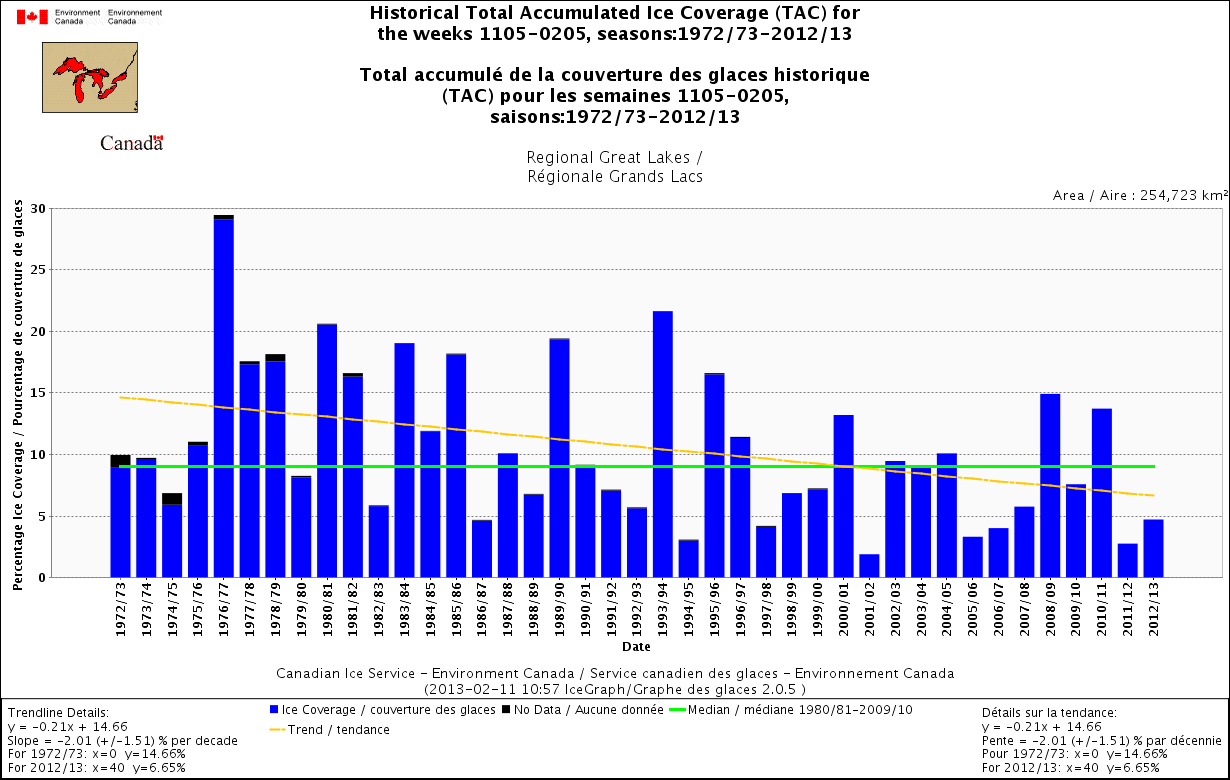
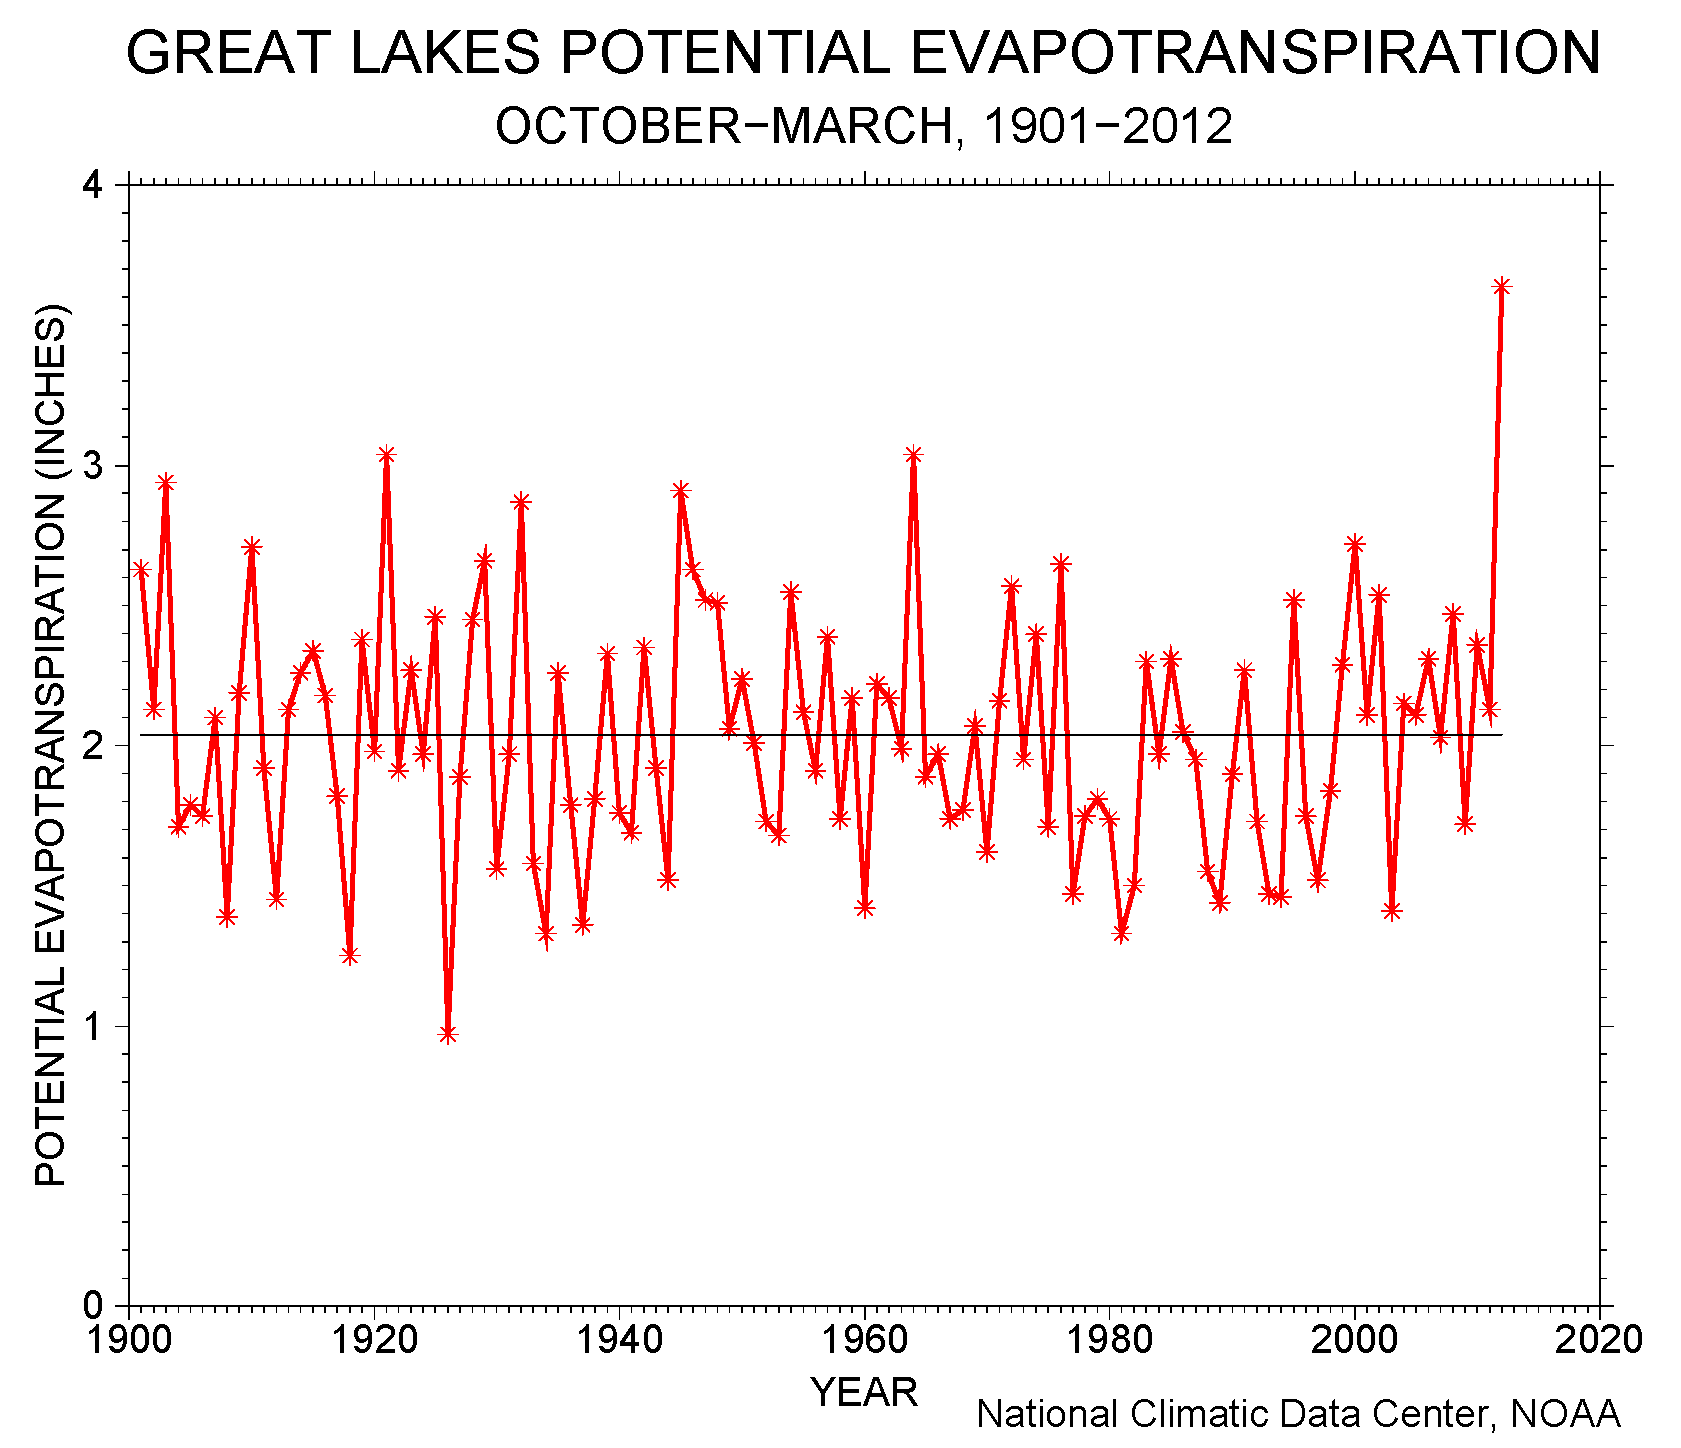
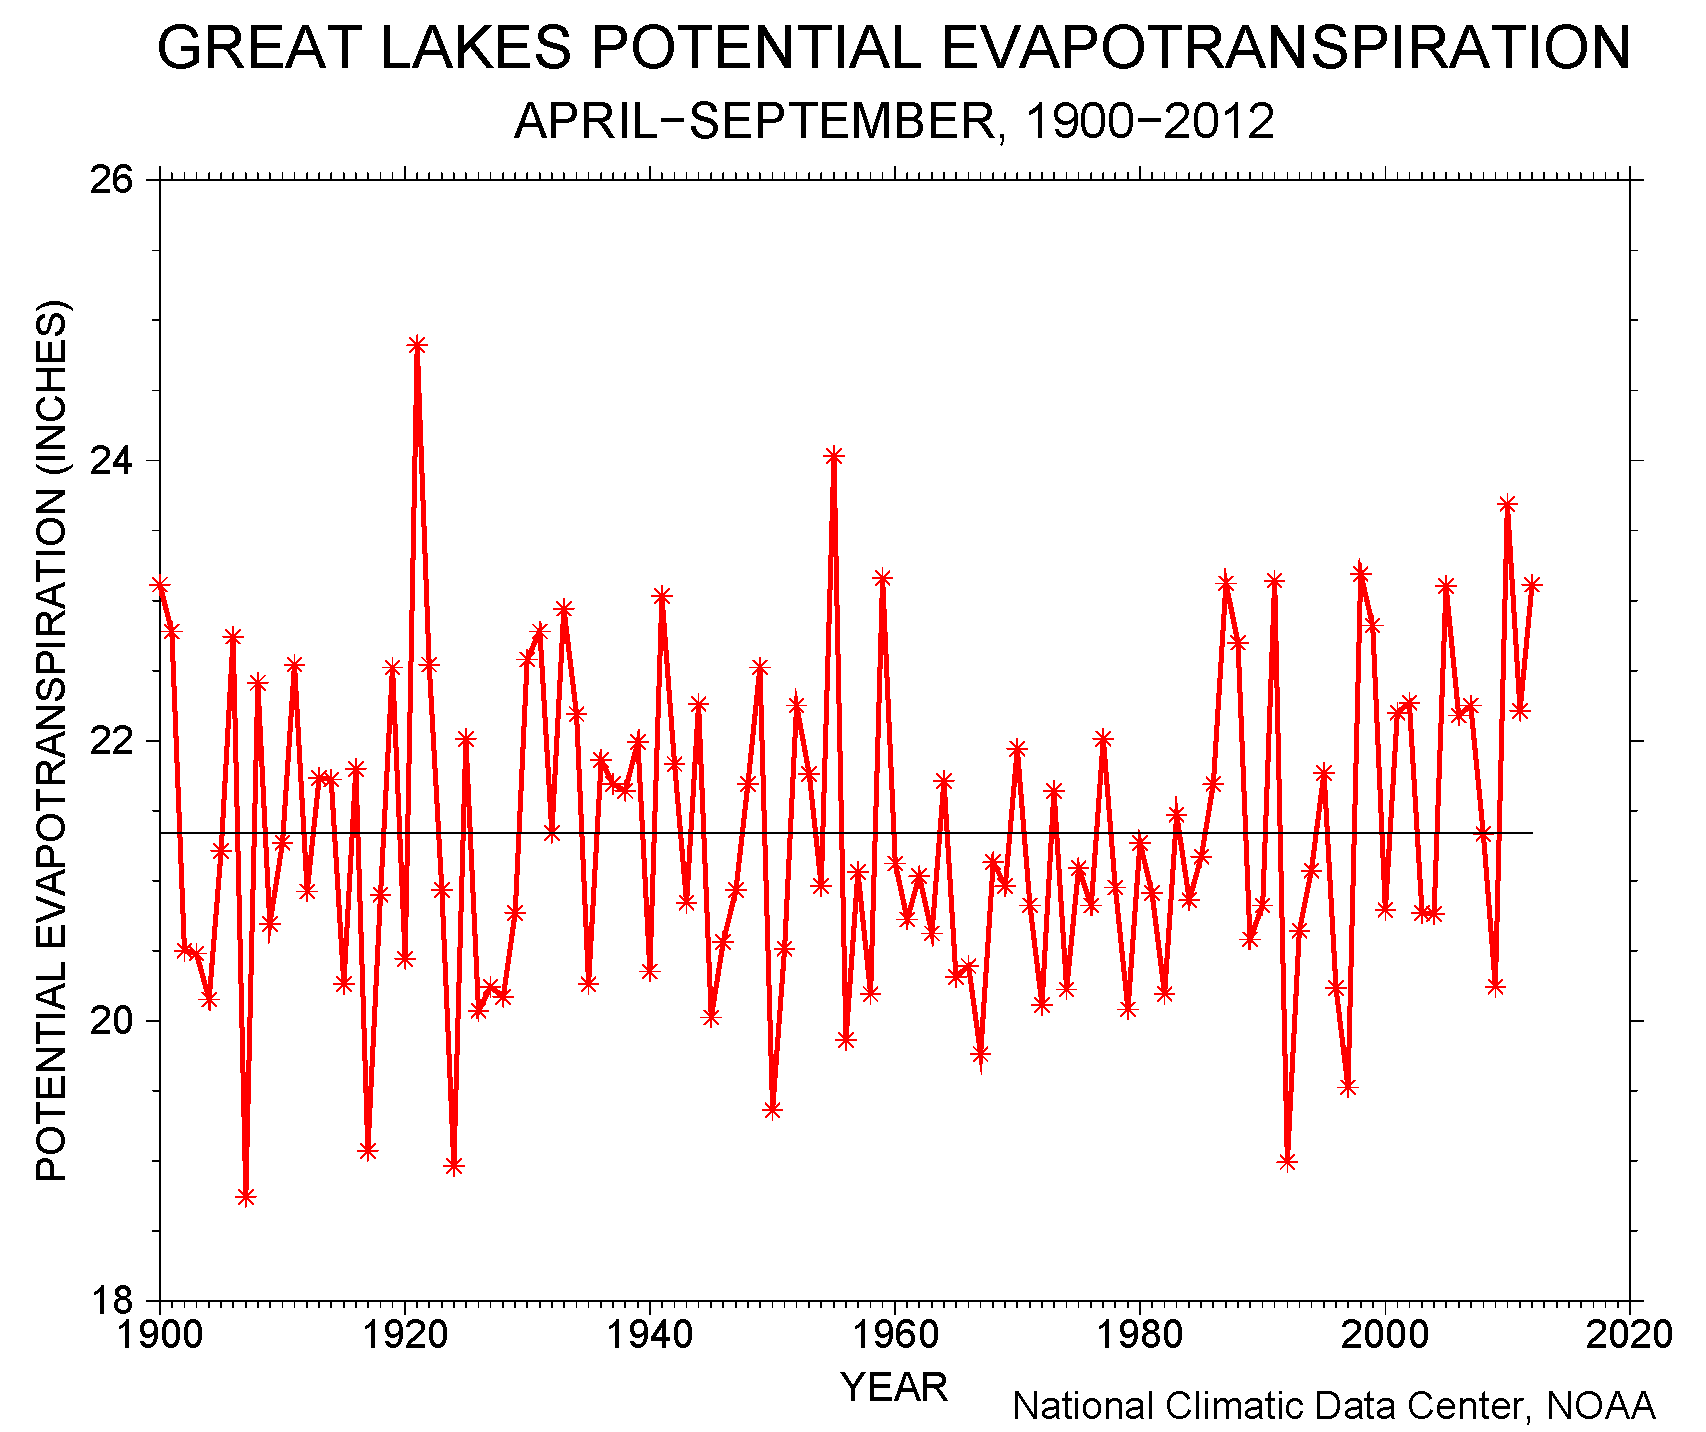
Winter ice cover provides an effective cap to reduce evaporation from the Great Lakes during the cold season. Temperature is one of the factors controlling the timing and extent of ice cover development. Great Lakes ice cover has been greatly reduced during the last 15 years, with the current season-to-date ice cover continuing this trend. Reduced ice cover results in more evaporation, and the potential evaporation (estimated from temperature) for October-March of last year was the highest of the 1900-2012 record. Warm season potential evaporation has been consistently above the long-term average during the last 15 years. On average, temperature-based estimates of cold season potential evaporation are only about a tenth of the warm season potential evaporation.
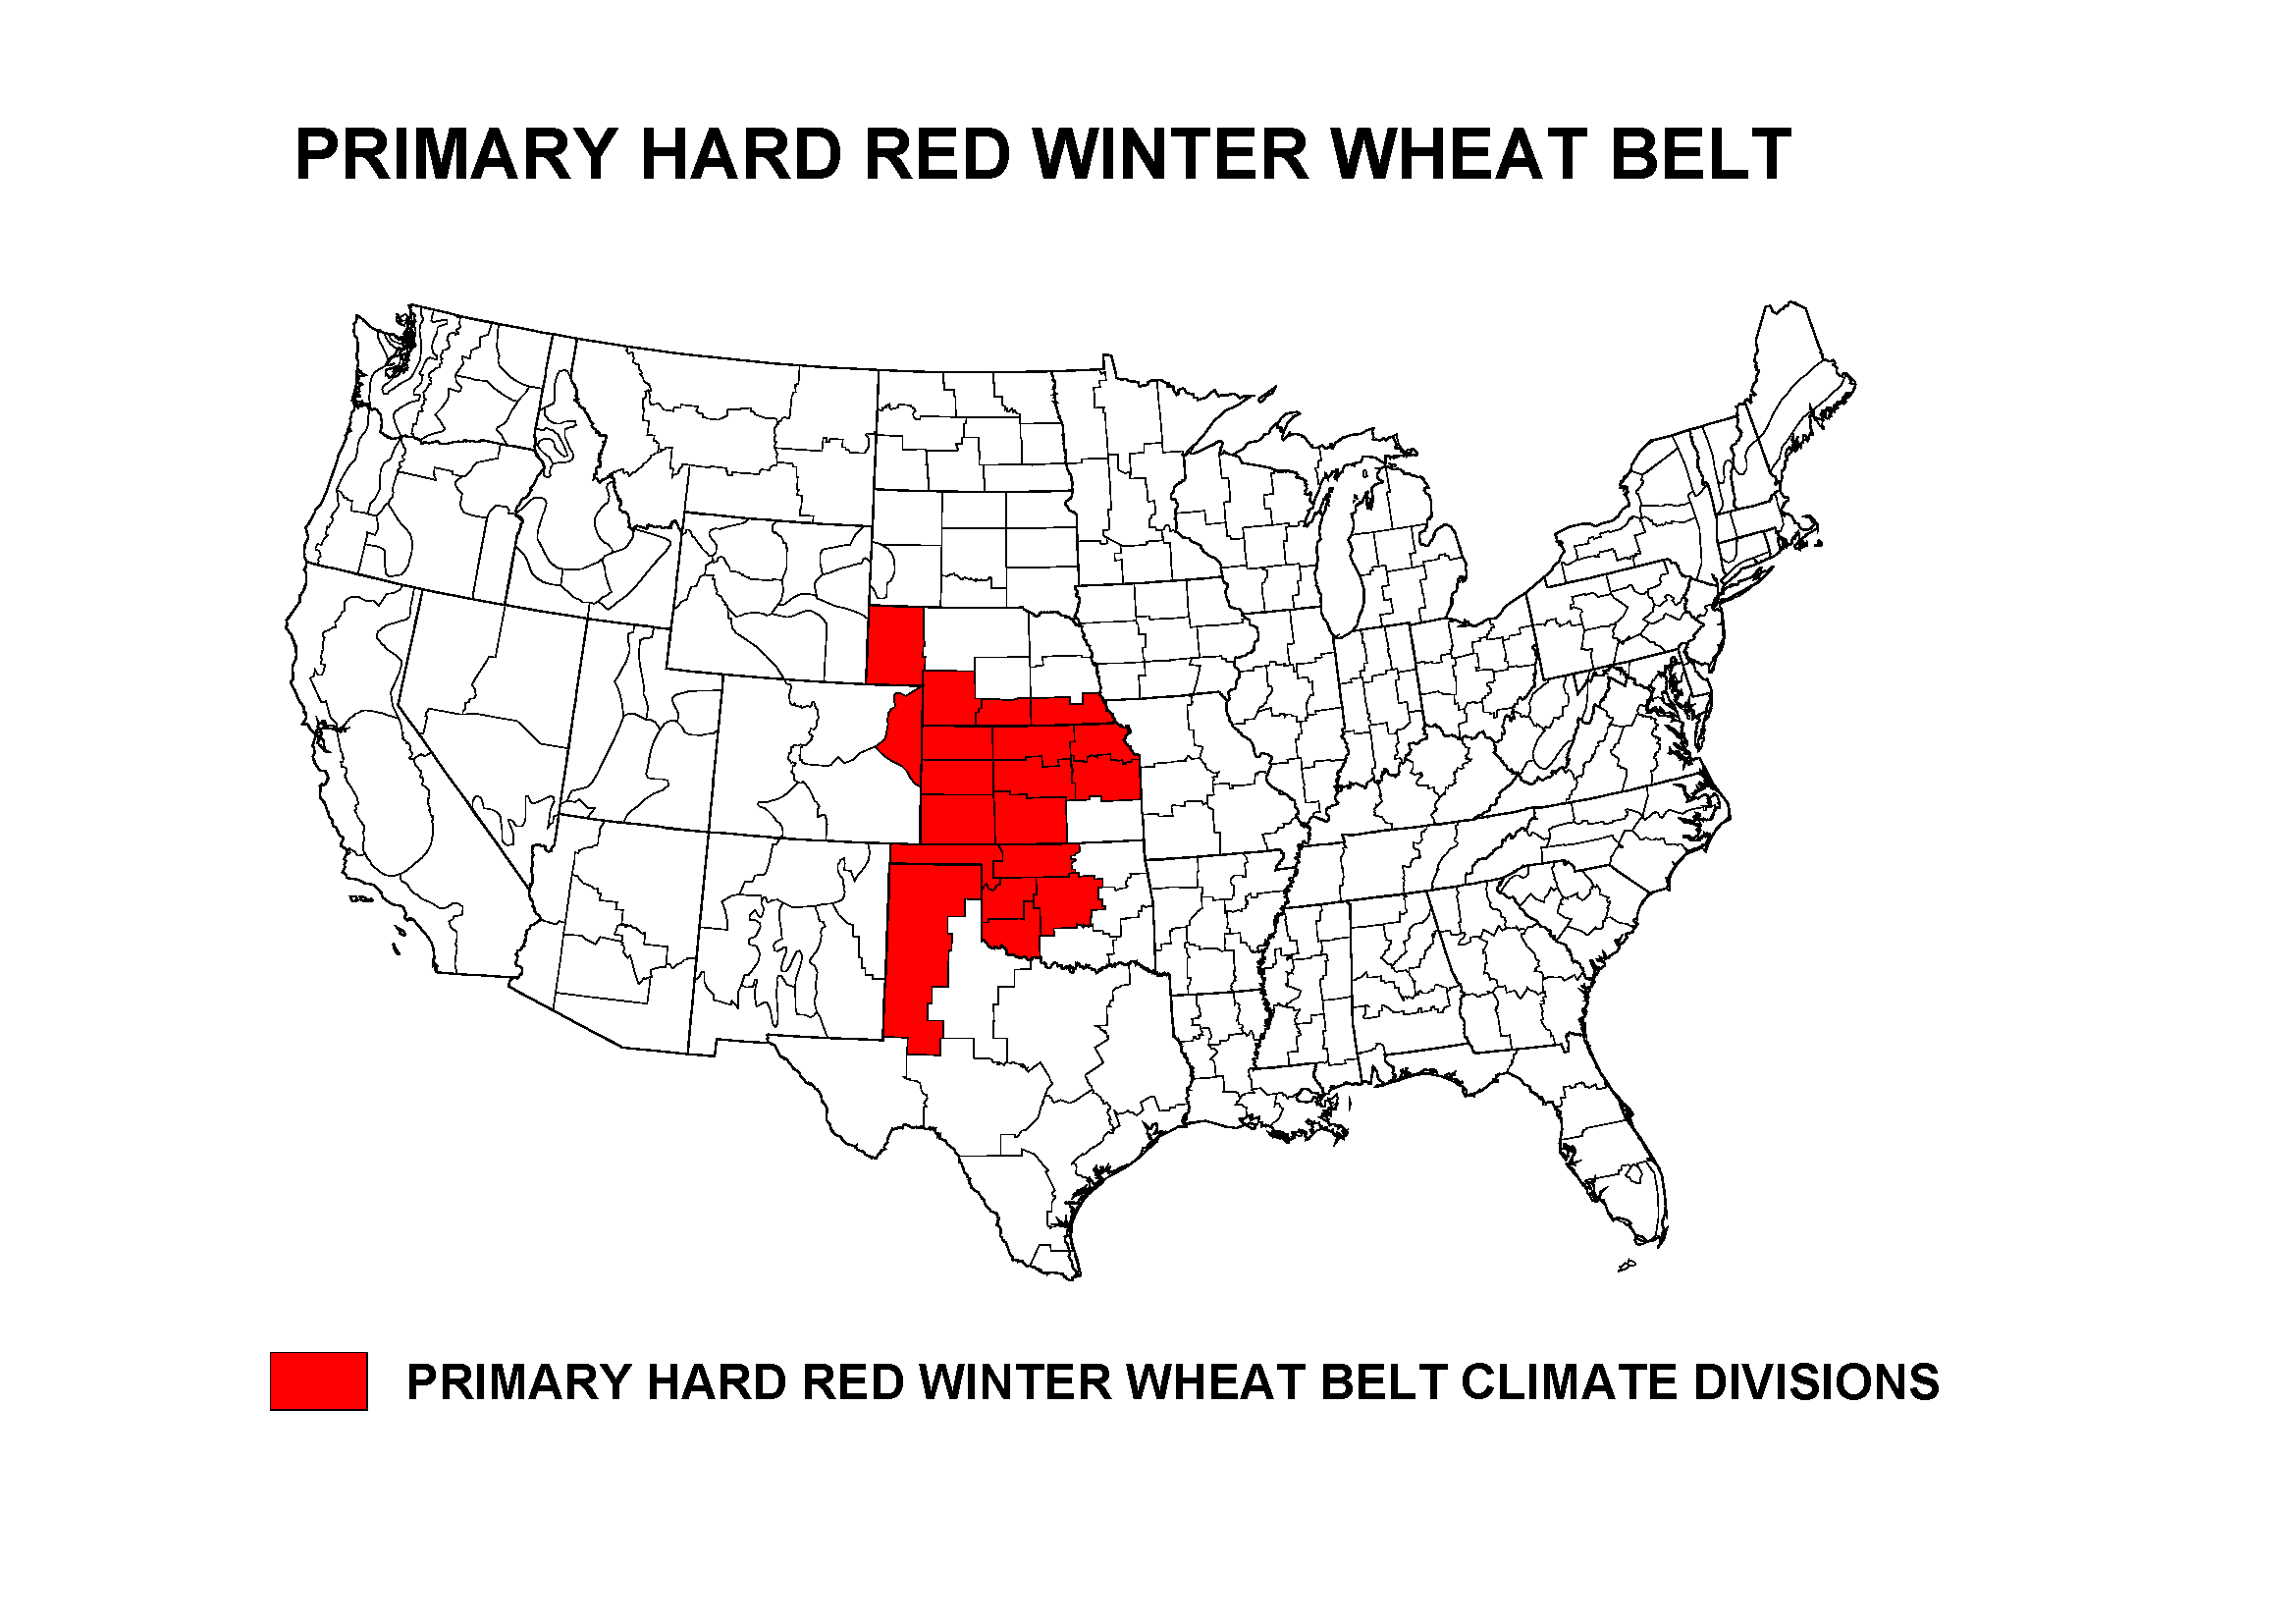
Primary Hard Red Winter Wheat Belt
| The growing season (October-April) continued to be dry for the Primary Hard Red Winter Wheat agricultural belt. October 2012-January 2013 ranked as the 15th driest such period in the 1895-2013 record. Temperatures for the period ranked 25th warmest. The PHDI continued at extreme drought levels, regionwide. |
 |
NOAA Regional Climate Centers:
A more detailed drought discussion, provided by the NOAA Regional Climate Centers and others, can be found below.
West — Upper Colorado River Basin — Pacific Islands
As described by the High Plains Regional Climate Center, the January 2013 nationwide picture showed that the eastern U.S. generally experienced above normal temperatures while the western U.S. had below normal temperatures. Average temperatures across the High Plains region were generally near normal, except for western areas of Colorado and Wyoming. Storm systems pushing through the region brought both cold air down from Canada and warm air up from the south. This led to a wide range of temperatures and to many new daily record highs and lows.
Precipitation was hit or miss across the High Plains region this month. Because winter precipitation is generally light, there was little to no change in the drought regardless of whether a location received ample precipitation or not. Overall precipitation varied widely as totals ranged from 0 to 400 percent of normal. Above normal precipitation was concentrated in north central Wyoming, southwestern Colorado, southwestern and central South Dakota, and central and southeastern Kansas. Other areas of the region received little to no precipitation. Rock Springs, Wyoming had its driest January on record with only a trace amount of precipitation. The old record of 0.02 inch (1 mm) was set in 2004 (period of record 1948-2013). Several systems affected the region this month, bringing a wide range of temperatures and precipitation types including snow, sleet, freezing rain, and rain (some of which fell from thunderstorms).
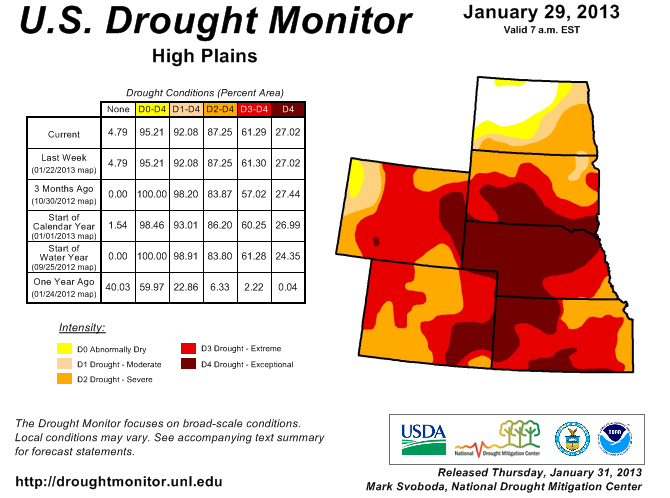
As expected for this time of year, there was little change to the U.S. Drought Monitor over the past month. Approximately 92 percent of the Region was still in moderate (D1) to exceptional (D4) drought. This was down slightly from the end of last month when 93 percent of the Region was in D1-D4. The only improvement was in north-central North Dakota where much of the abnormally dry conditions (D0) were erased. Drought conditions worsened in Colorado where the snowpack was significantly behind. The last holdout of D1 in the north-central part of the state deteriorated to severe drought (D2). In addition, extreme drought (D3) expanded slightly in the west-central part of the state. Those changes have put the entire state of Colorado in D2-D4. Drought conditions in the remaining states in the region did not change with Nebraska leading the way with 77 percent of the state in D4.
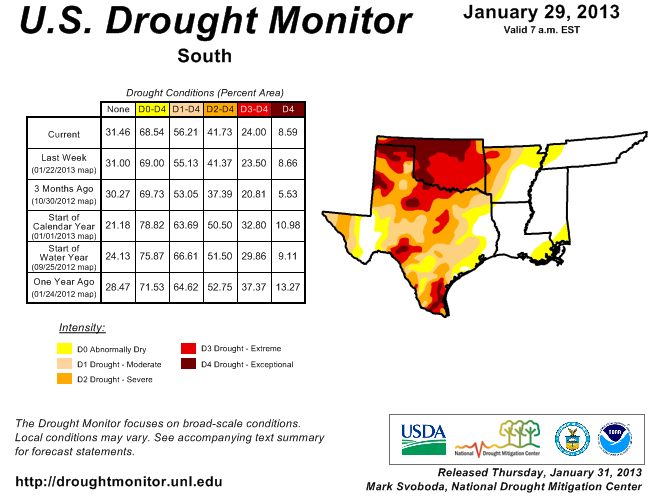
As explained by the Southern Regional Climate Center, January proved to be another consecutive warm month for the region, and it was a very wet month for most of the region. There were some areas in the region that received less than normal precipitation. This includes much of central and western Oklahoma, southern Texas, and a small pocket in north central Texas. Despite high precipitation totals, drought conditions did not change too much over the past month. This is due in part to the fact that much of the heavy rainfall occurred in areas that were not experiencing drought, such as in Louisiana, Tennessee and Mississippi for example. High precipitation totals in Arkansas did result in about a one category improvement, but much of the northwest portions of the state remained in moderate to extreme drought. In central Texas, above normal precipitation did result in some improvement, but a little over half the state was still experiencing severe drought conditions or worse.
For Texas, many AgriLife Extension agents expect that the January rainfall, while not ensuring a successful harvest, did prevent winter wheat from being lost entirely, with some believing it saved over a million dollars. Cotton farmers are less fortunate, with initial yield estimates dropping by 500,000 due to the persistently dry conditions across most of the state. While snow cover in the western parts of the state have farmers cautiously optimistic, the long-term conditions are so poor that it was not believed that the melt water would be enough to replenish soil moisture. With soil moisture conditions so poor, ranchers were still having trouble keeping their herds fed, causing the Cargill Meatpacking Plant in Plainview to lay off 2000 workers. Longer-term ecological damage has also been seen in recent months, culminating in the Wildlife Department falling short $4.6 million last year (Information provided by the Texas Office of State Climatology).
Despite high precipitation totals in Texas, many regions were still suffering from low water supply, notably west Texas. The Lower Colorado River Authority enacted emergency conservation plans in January, and various levels of government were attempting to tackle the problem. Potential solutions included implementation of a 100-year plan in Lubbock estimated to cost anywhere between $4.1 and $10 billion, and a $2 billion appropriation plan introduced in the state legislature (Information provided by the Texas Office of State Climatology).
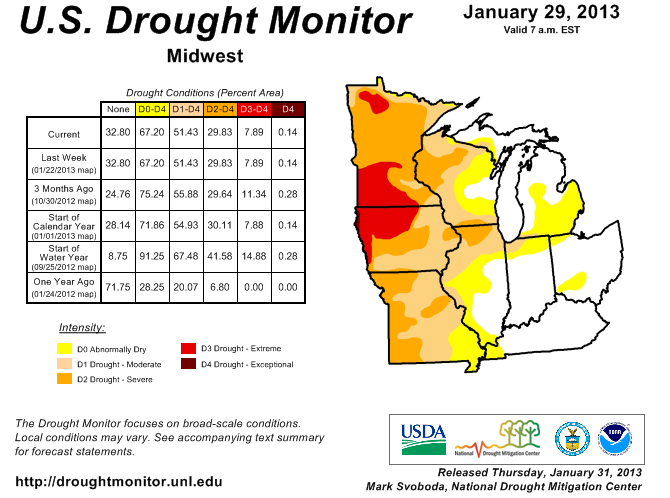
As summarized by the Midwest Regional Climate Center, January temperatures were above normal across the region. Despite the above normal temperatures for the month, there were several pushes of cold Arctic air that reached the Midwest in January. January precipitation was near normal in Iowa, Minnesota, and Ohio and well above normal in the other Midwest states. Precipitation ranged from about 140 percent of normal to about 200 percent of normal. Snowfall for January was below normal for most of the Midwest. Upper Michigan, northeast Wisconsin, and northwest Minnesota were the only areas with above normal snowfall for the month.
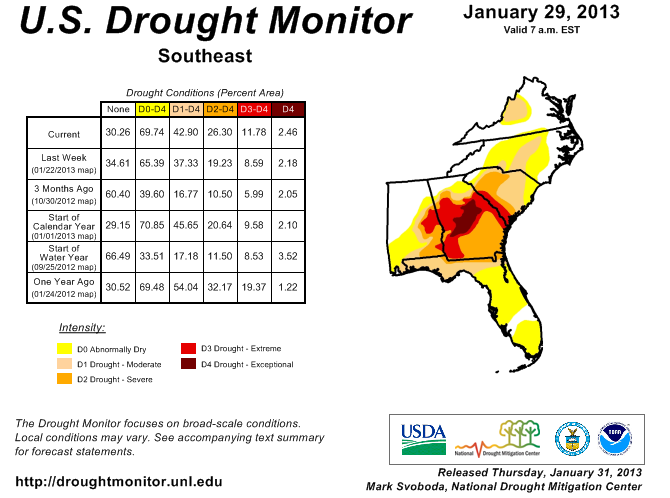
As noted by the Southeast Regional Climate Center, mean temperatures were above average across the region in January, generally above average across Puerto Rico, and near average across the U.S. Virgin Islands. Precipitation in January was highly variable across the Southeast. Monthly totals were above normal in a swath extending from central and northern Alabama through northern sections of Georgia and South Carolina, western North Carolina, and much of Virginia. In contrast, monthly precipitation was well below normal across eastern sections of South Carolina and Georgia, and most of Florida, Puerto Rico, and the U.S. Virgin Islands, with monthly totals less than 25 percent of normal. Augusta, GA (period of record 1871-2013) and Charleston, SC (period of record: 1938-2013) recorded their driest January on record with monthly totals of 0.60 and 0.35 inch (15.2 and 8.9 mm), respectively.
Heavy rainfall across the interior of the region helped eliminate drought conditions across northern parts of Alabama and Georgia, western North Carolina, and parts of central Virginia. Drought conditions also improved across parts of central North Carolina, eastern Alabama, and western Georgia. On the other hand, the lack of rainfall in January contributed to a re-emergence of abnormally dry (D0) conditions across central Florida and an intensification of drought across southeastern Georgia, the Florida Panhandle, and along the Savannah River watershed at the border of Georgia and South Carolina. On the 9th of the month, 92 counties in Georgia received designation as natural disaster areas due to losses and damages from the on-going drought. Across Florida, the warm, dry weather in January aided the growth of strawberries and helped farmers prepare for spring planting. However, several fruit trees did not receive adequate chill hours and the lack of rain continued to limit the growth of citrus trees and winter forage. There was also concern that the early blooming of some plants and trees will make them susceptible to a late winter or early spring freeze.
As explained by the Northeast Regional Climate Center, the trend of warmer-than-average temperatures in 2012 continued right into 2013. The Northeast's average temperature of 26.5 degrees F (-3.1 degrees C) was 2.9 degrees F (1.6 degrees C) above normal but 1.2 degrees F (0.7 degrees C) cooler than January 2012. It was the 27th warmest January in 119 years. January 2013 was drier than normal in the Northeast. The region's monthly precipitation of 2.54 inches (64.52 mm), 82 percent of normal, was 0.53 inches (13.46 mm) below average. Nine states were drier than normal with departures ranging from 39 percent of normal in Connecticut to 88 percent of normal in New Jersey. Several states had Januarys that ranked in their top 25 driest: Connecticut, 9th driest; Maine and Rhode Island, 11th driest; Massachusetts, 13th driest; New Hampshire, 16th driest; and Vermont, 23rd driest. Two states received near-average precipitation with Pennsylvania coming in at 100 percent of normal and Maryland at 101 percent of normal. West Virginia was the wettest state at 135 percent of normal making it their 30th wettest January since 1895.
As summarized by the Western Regional Climate Center, unusually cold conditions dominated the West, especially in the interior, this month as strong inversions developed in the Great Basin and other low-lying areas. These inversions resulted from widespread snow cover established in December and intrusion of cold air masses followed by persistent ridges of high pressure at upper levels. These conditions prohibited vertical mixing and horizontal flow, resulting in poor air quality and record low temperatures in affected areas. Precipitation was below normal for much of the region, though with several pockets above average in the Southwest and Montana. Of note in the southern Great Basin was only trace of snowfall on Mt. Charleston near Las Vegas, Nevada where normal January snowfall is 21.9 in (56 cm). This month ties January 2003 for the least January snowfall at Mt. Charleston. Snow water equivalent in the Sierra Nevada snowpack started the month near 140% of normal and ended the month close to 90% of normal for the date. Despite daily record snowfalls and above normal precipitation in the northern and southern reaches of Montana, statewide precipitation averaged approximately 0.2 in (5 mm) below normal this month. This breaks a trend of above normal precipitation since October that followed a very dry spring and summer.
January provided relief from persistent drought in the northwestern portion of the Hawaiian Islands. After its driest December on record, Honolulu, Oahu finally saw above normal precipitation this month at 2.42 in (62 mm), 105% of normal. The islands of Kauai and Molokai also fared well this month with above normal precipitation at most locations. Dry conditions continued for Maui and Big Island, especially in leeward areas, which were generally below 50% of normal for the month.
Further north, Alaska was warmer and wetter than normal for the month. Several daily snowfall and precipitation records as well as high temperature records were set throughout the state.
Upper Colorado River Basin: As reported by the Colorado Climate Center, the February 5th NIDIS (National Integrated Drought Information System) assessment for the Upper Colorado River Basin (UCRB) indicated that the month of January brought above normal precipitation for the four corners and San Juan mountains as well as central and NE Utah and NW Colorado. NW Colorado and NE Utah saw over 150% of normal while the San Juan and parts of the Gunnison basin received over 100% of normal, with San Juan county, Utah reporting over 150% of normal. The northern and central mountains in CO as well as east of the Continental Divide saw below normal precipitation. For the water year precipitation percentage of normal through the end of January, much of Colorado remained below normal, in particular the Arkansas and Republican basins which were 50% of normal or worse. The Green and Duschesne River basins reported in the normal or above categories for the water year.
Water-year-to-date SNOTEL precipitation percentiles in the UCRB were highly variable depending on location. Along the Wasatch and Uintah ranges in UT, percentiles were in the normal range, with slightly lower percentiles in the Upper Green River basin in southwest WY. Higher percentiles in the 50s and 60s were reported in Uintah county, UT. The northern and central CO mountains showed precipitation below the 20th percentile at most locations, with sites in Grand, Summit, Eagle, Pitkin, Lake and Gunnison counties reporting below the 5th percentile. Percentile rankings in southwest CO in the San Juan mountains have recovered somewhat, now reporting in the teens and 20s. The Sangre de Cristo range in SE Colorado also reported below the 10th percentile at several sites in Costilla county. Basin snow water equivalent was less than normal on the east side of the UCRB and near normal on the west side of the basin. Sub-basins in western CO were all between 68% and 87% of normal snowpack with the Colorado basin reporting the lowest. The South Platte and Arkansas basins in CO were in the 61-64 % of normal range.
The lowest streamflows were recorded on headwater streams in the Colorado basin and Uncompahgre basin. Below normal flows (10th-24th percentile) were recorded on the San Juan river. The gages reporting in Utah and Wyoming were mainly in the normal category. Flows on the Arkansas and Republican rivers were mainly in the below to much below normal range with a few sites setting record low flows. The South Platte tributaries were quite variable with a few sites (Cache La Poudre and Big Thompson) recording much below normal.
Pacific Islands: According to reports from National Weather Service offices, the Pacific ENSO Applications Climate Center (PEAC), and partners, conditions varied across the Pacific Islands.
As noted by the National Weather Service office in Honolulu, several heavy rain events in January brought varying levels of drought relief to all four counties across the state. For some locations it was the wettest January in at least five years. Conditions on Kauai have improved to the point where the entire island is now drought-free. Oahu has only a small area of moderate drought, or D1 category conditions in the USDM map, over the leeward slopes of the Waianae range. Improvements also occurred over Lanai and west Molokai. Extreme drought, or D3 category conditions, improved to severe drought, or D2 conditions, in both areas. Unfortunately, leeward areas of Maui and the Big Island did not receive as much rainfall as the west half of the state and rainfall coverage was less consistent. Improvements in drought conditions occurred on both islands but the extent of these improvements was much more limited. Thus, extreme drought on Maui remains over the Kihei, lower Kula, Ulupalakua, and the lower Kaupo areas. Severe drought eased to moderate drought near the Pukalani and Makawao areas. On the Big Island, extreme drought continued over the Kawaihae area of the south Kohala district and the Pohakuloa area of the Hamakua district. Extreme drought eased to severe drought over the southern Kau district and the Waikoloa area of the south Kohala district. Severe drought remained in place over most of the north Kona and south Kona districts.
Some drought impacts impacts in Hawaii include the following:
KAUAI.
SUFFICIENT RAINFALL OCCURRED OVER THE PAST MONTH TO HELP CONTINUE
PASTURE IMPROVEMENTS TO THE POINT WHERE THE ISLAND IS NO LONGER
CONSIDERED TO BE UNDER DROUGHT.

OAHU.
PASTURES AND GENERAL VEGETATION CONDITIONS OVER THE LEEWARD WAIANAE
RANGE HAVE BEEN IMPROVING AS A RESULT OF RAINFALL IN JANUARY.   MORE
RAINFALL IS NEEDED TO SUSTAIN THE RECOVERY PROCESS.

MOLOKAI.
PORTIONS OF MOLOKAI HAD ITS WETTEST MONTH IN OVER FIVE YEARS. RECENT
GROUND REPORTS ARE NOT AVAILABLE BUT VEGETATION HEALTH DATA FROM
REMOTE SENSING SOURCES INDICATE THAT PASTURES AND GENERAL VEGETATION
CONDITIONS HAVE IMPROVED.  IT REMAINS TO BE SEEN HOW MUCH ADDITIONAL
RAINFALL WILL OCCUR TO SUSTAIN THE IMPROVEMENTS.

THE WATER LEVEL IN THE KUALAPUU RESERVOIR SHOWED ONLY A SMALL
INCREASE IN THE PAST MONTH AND REMAINS LOW.  THUS...THE STATE OF
HAWAII DEPARTMENT OF AGRICULTURE HAS CONTINUED A MANDATORY 30
PERCENT REDUCTION IN IRRIGATION WATER CONSUMPTION.

LANAI.
A RECENT GROUND REPORT IS NOT AVAILABLE BUT VEGETATION HEALTH DATA
FROM REMOTE SENSING SOURCES INDICATE THAT PASTURES AND GENERAL
VEGETATION CONDITIONS HAVE IMPROVED IN THE PAST MONTH WHICH IS
CONSISTENT WITH THE INCREASE IN RAINFALL.

MAUI.
LEEWARD MAUI RECEIVED SOME RAINFALL OVER THE PAST MONTH WHICH HELPED
KEEP POOR PASTURE CONDITIONS FROM WORSENING OR SPREADING.  THE MAUI
COUNTY DEPARTMENT OF WATER SUPPLY CONTINUED ITS LONG STANDING
REQUEST FOR A 5 PERCENT REDUCTION IN WATER USE FOR UPCOUNTRY
RESIDENTS.  THE REQUEST FOR A 10 PERCENT REDUCTION IN WATER USE BY
CENTRAL AND SOUTH MAUI RESIDENTS ALSO REMAINED IN EFFECT.

BIG ISLAND.
THE KAU DISTRICT HAS RECEIVED ENOUGH RAINFALL TO SUPPORT GOOD
PASTURE AND GENERAL VEGETATION RECOVERY.  PORTIONS OF THE SOUTH
KOHALA DISTRICT NEAR WAIKOLOA RECEIVED ENOUGH RAINFALL TO SUPPORT
REGROWTH OF GRASSES AS WELL.  HOWEVER...PASTURES IN THE LOWER
ELEVATIONS OF THE SOUTH KOHALA DISTRICT NEAR AND NORTH OF KAWAIHAE
STILL CANNOT SUPPORT GRAZING.  VEGETATION IN THE POHAKULOA AREA ALSO
REMAINS VERY DRY AND FIRE OFFICIALS CONTINUE TO RATE THE AREA AS
UNDER EXTREME FIRE RISK.
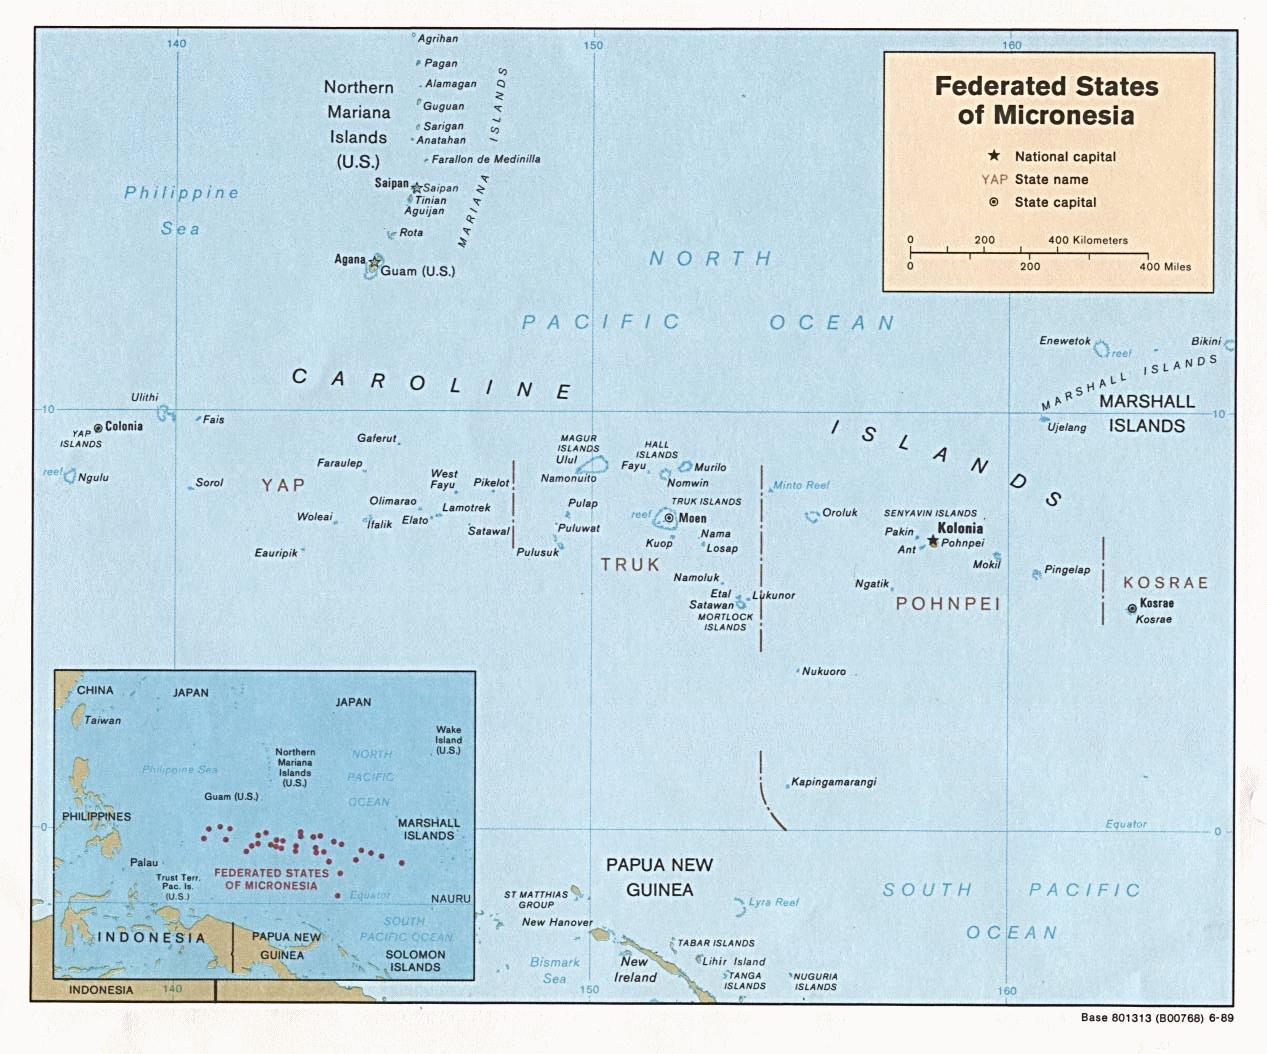
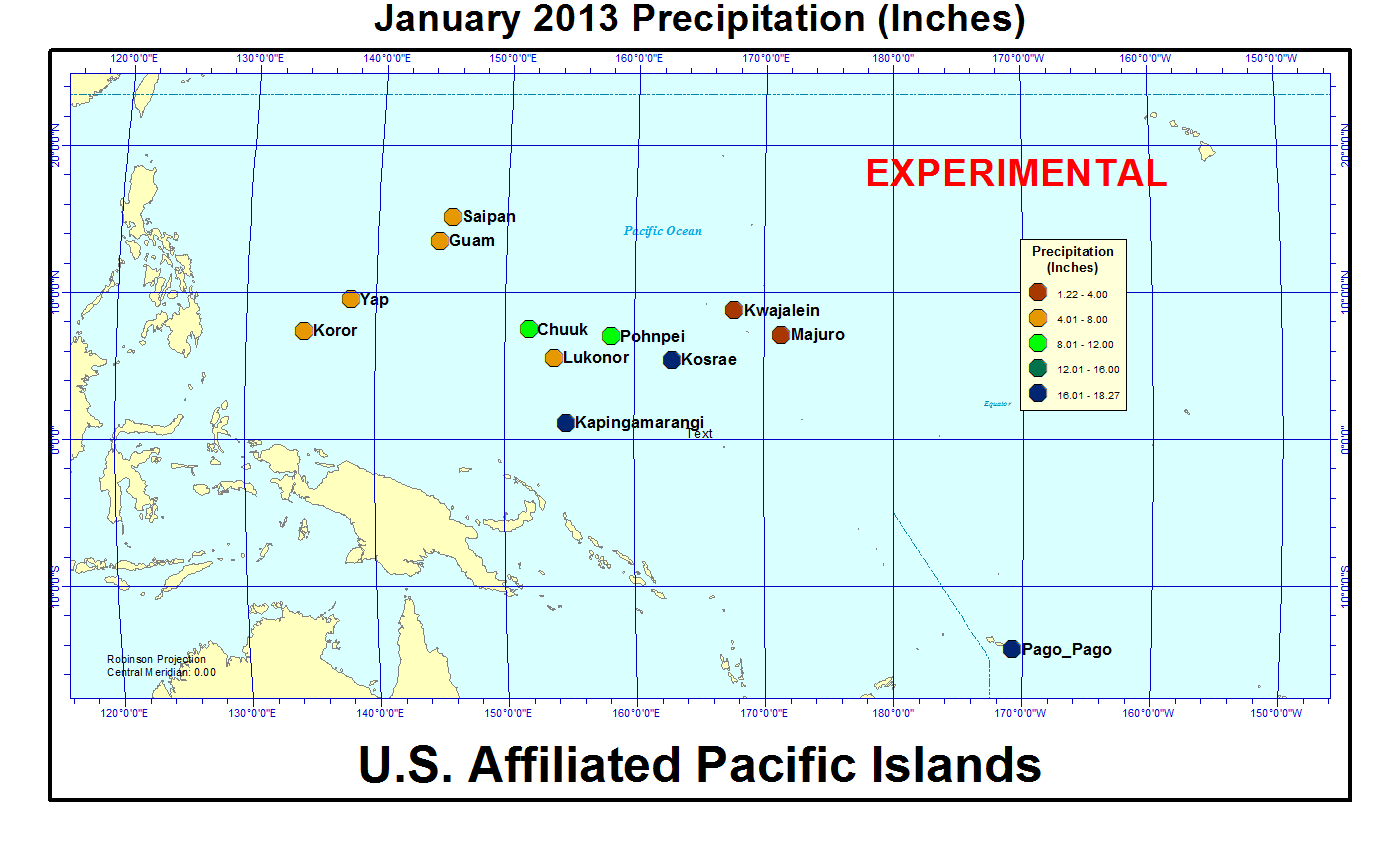
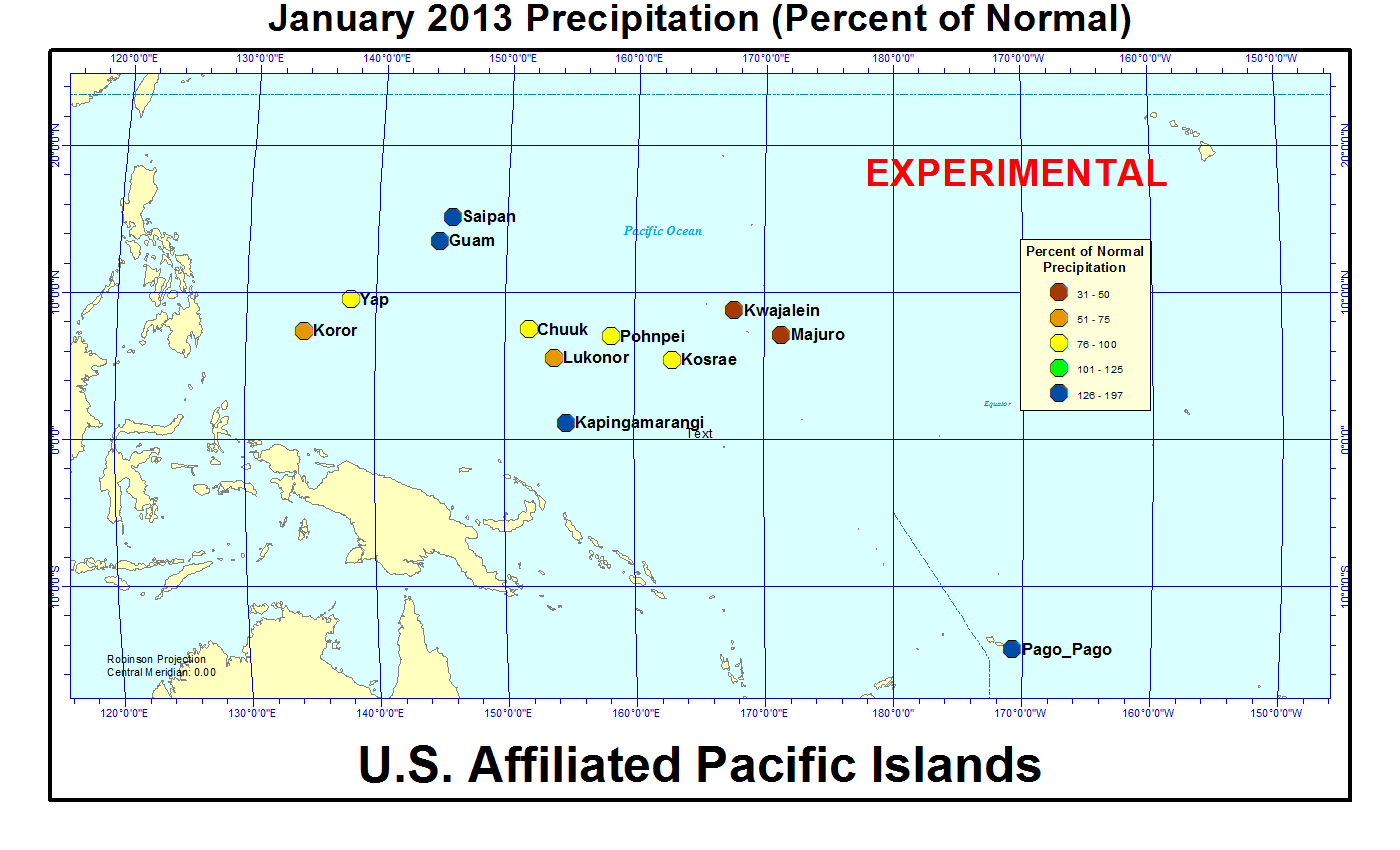
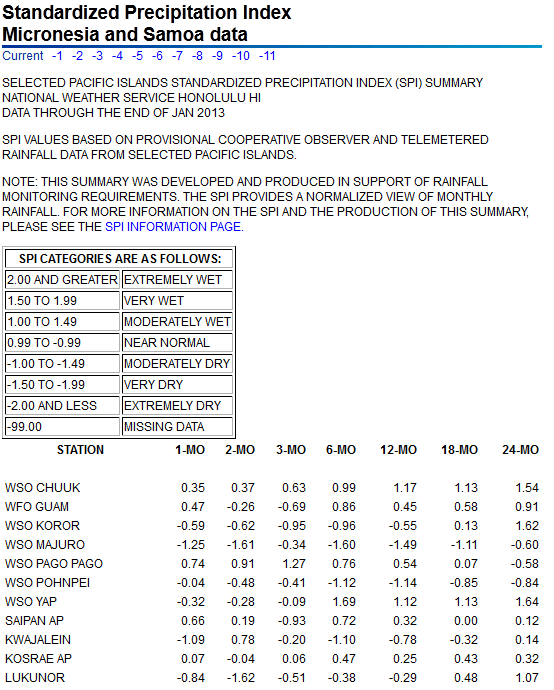
On other Pacific Islands (maps — Micronesia, Marshall Islands, basinwide), January was drier than normal for Koror, Yap, Chuuk, Lukonor, Pohnpei, and Kosrae, and much drier than normal for Kwajalein and Majuro. January rainfall amounts were below four inches at Kwajalein and Majuro and below 8 inches at Koror, Yap, Guam, Saipan, and Lukonor. According to NWS and media reports, the main reservoir in Majuro had about a week's supply of water and water restrictions were in effect; strong water conservation measures will be needed to avoid depletion of wells, reservoirs, and catchments. Majuro has been below normal for nine of the last 12 months. Total rainfall for the last 12 months (February 2012-January 2013) was near to above normal for all stations except Majuro and Pohnpei.
| Station Name | Feb 2012 | Mar 2012 | Apr 2012 | May 2012 | Jun 2012 | Jul 2012 | Aug 2012 | Sep 2012 | Oct 2012 | Nov 2012 | Dec 2012 | Jan 2013 | Feb- Jan |
|---|---|---|---|---|---|---|---|---|---|---|---|---|---|
| Chuuk | 181% | 107% | 40% | 173% | 131% | 141% | 169% | 86% | 128% | 144% | 116% | 99% | 120% |
| Guam NAS | 94% | 215% | 121% | 224% | 107% | 66% | 179% | 126% | 92% | 74% | 55% | 128% | 99% |
| Kapingamarangi | 71% | 121% | 102% | 143% | 179% | 146% | 192% | 147% | 138% | 167% | 74% | 197% | 123% |
| Koror | 126% | 121% | 120% | 122% | 95% | 88% | 102% | 111% | 78% | 67% | 103% | 72% | 91% |
| Kosrae | 185% | 60% | 84% | 86% | 99% | 124% | 144% | 109% | 113% | 119% | 110% | 98% | 91% |
| Kwajalein | 114% | 84% | 68% | 161% | 117% | 120% | 95% | 57% | 73% | 45% | 230% | 39% | 93% |
| Lukonor | 124% | 135% | 76% | 106% | 125% | 82% | 73% | 148% | 74% | 178% | 62% | 60% | 89% |
| Majuro | 65% | 194% | 97% | 59% | 81% | 68% | 87% | 67% | 46% | 154% | 53% | 31% | 81% |
| Pago Pago | 98% | 131% | 90% | 126% | 115% | 105% | 59% | 195% | 54% | 181% | 143% | 137% | 107% |
| Pohnpei | 138% | 98% | 45% | 115% | 100% | 92% | 96% | 90% | 82% | 109% | 71% | 83% | 89% |
| Saipan | 183% | 35% | 33% | 166% | 118% | 77% | 135% | 101% | 172% | 31% | 89% | 191% | 111% |
| Yap | 117% | 185% | 89% | 142% | 99% | 84% | 128% | 187% | 140% | 121% | 102% | 90% | 118% |
| Station Name | Feb 2012 | Mar 2012 | Apr 2012 | May 2012 | Jun 2012 | Jul 2012 | Aug 2012 | Sep 2012 | Oct 2012 | Nov 2012 | Dec 2012 | Jan 2013 | Feb- Jan |
|---|---|---|---|---|---|---|---|---|---|---|---|---|---|
| Chuuk | 13.13" | 8.87" | 5.02" | 19.56" | 15.27" | 16.92" | 21.78" | 10.04" | 14.68" | 15.30" | 13.09" | 10.00" | 163.66" |
| Guam NAS | 2.85" | 4.45" | 3.05" | 7.63" | 6.63" | 6.74" | 26.42" | 15.98" | 10.56" | 5.45" | 2.81" | 5.12" | 97.69" |
| Kapingamarangi | 6.61" | 13.82" | 13.91" | 17.24" | 24.68" | 20.65" | 15.57" | 14.56" | 11.32" | 15.44" | 7.25" | 18.02" | 179.07" |
| Koror | 10.81" | 9.03" | 8.79" | 14.49" | 16.54" | 16.36" | 13.72" | 13.01" | 9.23" | 7.68" | 11.52" | 7.29" | 138.47" |
| Kosrae | 23.93" | 9.59" | 14.70" | 15.35" | 14.56" | 18.55" | 20.46" | 15.52" | 12.33" | 16.49" | 17.75" | 16.27" | 195.5" |
| Kwajalein | 3.01" | 1.97" | 3.58" | 10.82" | 8.08" | 11.83" | 9.23" | 6.17" | 8.18" | 5.09" | 15.33" | 1.22" | 84.51" |
| Lukonor | 11.06" | 12.51" | 8.60" | 12.35" | 14.53" | 13.08" | 10.26" | 15.02" | 8.39" | 16.18" | 7.00" | 5.05" | 134.03" |
| Majuro | 4.46" | 12.75" | 9.14" | 5.96" | 8.89" | 7.54" | 10.15" | 7.47" | 5.84" | 20.69" | 6.09" | 2.42" | 101.4" |
| Pago Pago | 11.76" | 14.00" | 8.41" | 12.15" | 6.13" | 5.84" | 3.19" | 12.73" | 4.99" | 18.34" | 18.31" | 18.27" | 134.12" |
| Pohnpei | 13.17" | 12.92" | 8.31" | 22.98" | 14.86" | 14.21" | 13.62" | 11.27" | 12.59" | 16.18" | 11.37" | 10.88" | 162.36" |
| Saipan | 4.75" | 0.66" | 0.88" | 3.96" | 4.26" | 6.86" | 17.73" | 10.24" | 18.31" | 1.75" | 3.44" | 4.83" | 77.67" |
| Yap | 6.09" | 8.43" | 5.00" | 11.14" | 11.95" | 12.74" | 18.92" | 25.19" | 17.08" | 10.67" | 8.68" | 5.72" | 141.61" |
| Station Name | Feb 2012 | Mar 2012 | Apr 2012 | May 2012 | Jun 2012 | Jul 2012 | Aug 2012 | Sep 2012 | Oct 2012 | Nov 2012 | Dec 2012 | Jan 2013 | Feb- Jan |
|---|---|---|---|---|---|---|---|---|---|---|---|---|---|
| Chuuk | 7.25" | 8.32" | 12.47" | 11.30" | 11.66" | 11.98" | 12.86" | 11.71" | 11.51" | 10.61" | 11.25" | 10.10" | 136.77" |
| Guam NAS | 3.03" | 2.07" | 2.53" | 3.40" | 6.18" | 10.14" | 14.74" | 12.66" | 11.44" | 7.38" | 5.11" | 4.01" | 99.09" |
| Kapingamarangi | 9.27" | 11.43" | 13.64" | 12.08" | 13.78" | 14.15" | 8.13" | 9.93" | 8.19" | 9.27" | 9.84" | 9.15" | 145.85" |
| Koror | 8.56" | 7.44" | 7.32" | 11.83" | 17.48" | 18.53" | 13.50" | 11.77" | 11.84" | 11.39" | 11.16" | 10.18" | 152.90" |
| Kosrae | 12.93" | 16.06" | 17.51" | 17.75" | 14.64" | 14.91" | 14.22" | 14.22" | 10.94" | 13.83" | 16.11" | 16.67" | 213.87" |
| Kwajalein | 2.64" | 2.35" | 5.26" | 6.72" | 6.93" | 9.87" | 9.74" | 10.74" | 11.18" | 11.28" | 6.66" | 3.16" | 90.41" |
| Lukonor | 8.93" | 9.26" | 11.31" | 11.69" | 11.65" | 15.93" | 14.04" | 10.15" | 11.32" | 9.08" | 11.27" | 8.41" | 151.36" |
| Majuro | 6.88" | 6.58" | 9.42" | 10.11" | 11.01" | 11.17" | 11.69" | 11.17" | 12.73" | 13.44" | 11.39" | 7.74" | 125.25" |
| Pago Pago | 12.00" | 10.68" | 9.39" | 9.66" | 5.33" | 5.55" | 5.38" | 6.53" | 9.26" | 10.14" | 12.84" | 13.34" | 125.57" |
| Pohnpei | 9.55" | 13.17" | 18.41" | 19.96" | 14.81" | 15.43" | 14.26" | 12.55" | 15.27" | 14.83" | 16.08" | 13.18" | 182.36" |
| Saipan | 2.59" | 1.89" | 2.63" | 2.38" | 3.62" | 8.91" | 13.13" | 10.09" | 10.62" | 5.61" | 3.85" | 2.53" | 70.25" |
| Yap | 5.19" | 4.56" | 5.63" | 7.85" | 12.04" | 15.08" | 14.82" | 13.50" | 12.18" | 8.83" | 8.51" | 6.39" | 120.31" |
[top]
State/Regional/National Moisture Status
A detailed review of drought and moisture conditions is available for all contiguous U.S. states, the nine standard regions, and the nation (contiguous U.S.):
| northeast u. s. | east north central u. s. | central u. s. |
| southeast u. s. | west north central u. s. | south u. s. |
| southwest u. s. | northwest u. s. | west u. s. |
| Contiguous United States |
[top]
Drought Indicators
- Palmer Drought Indices
- Standardized Precipitation Index
- long-term (36 to 60 month) percent of normal precipitation maps
- airport station percent of normal precipitation maps
- statewide precipitation rank maps
- Cooperative station percent of normal precipitation maps
- percent of average maps for the SNOTEL stations in the western mountains provided by the Western Regional Climate Center
- hydrologic year precipitation
- snow water equivalent of snowpack
- satellite-based observations of vegetative health
- National Weather Service model calculations of soil moisture, runoff, and evaporation
- National Weather Service model calculations of soil moisture using the Leaky Bucket Model
- Midwest Regional Climate Center model calculations of soil moisture
- topsoil moisture conditions observed by the USDA and mapped by the Climate Prediction Center
- pasture and range land conditions observed by the USDA and mapped by the Climate Prediction Center
- streamflow maps maintained by the USGS
[top]
Contacts & Questions