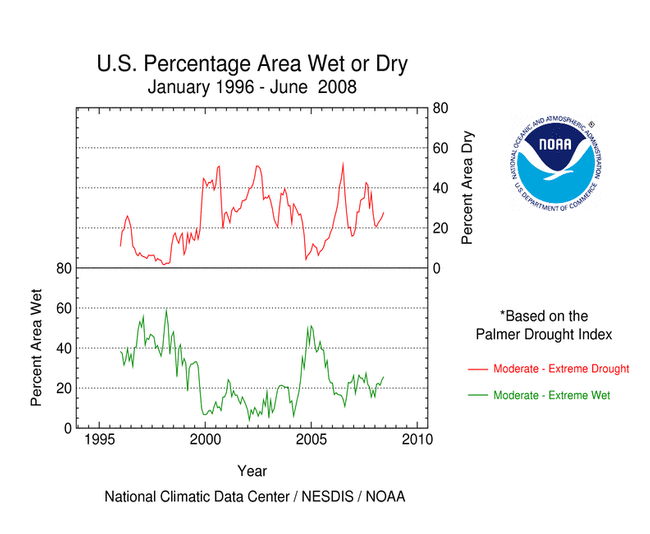
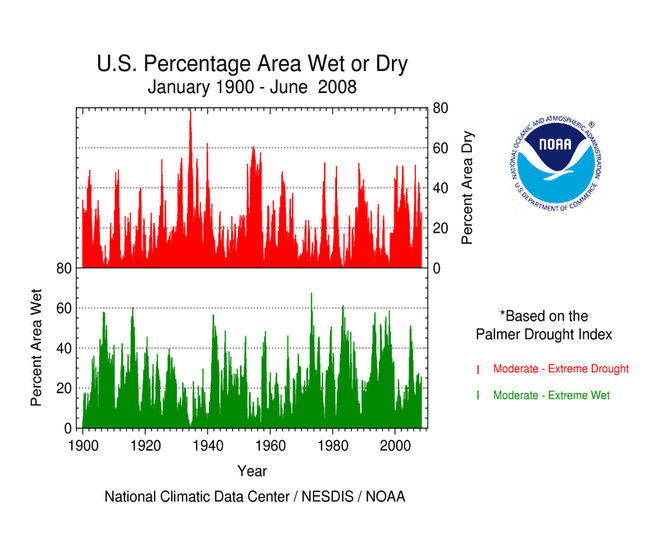
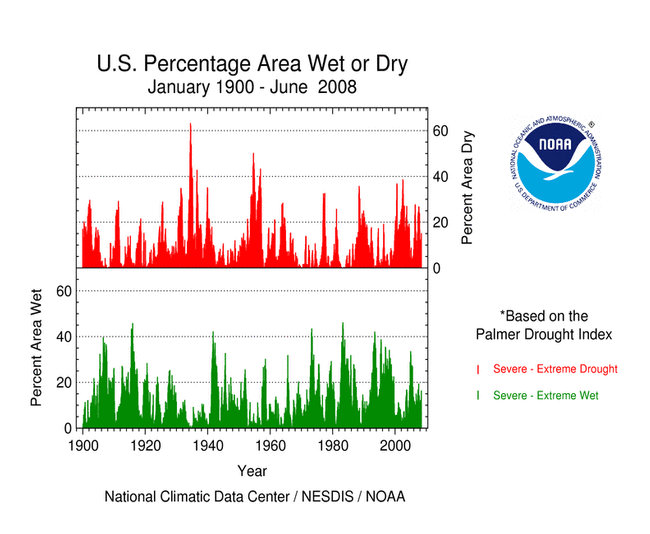
| Contents Of This Report: |
 |

|

|
|
|
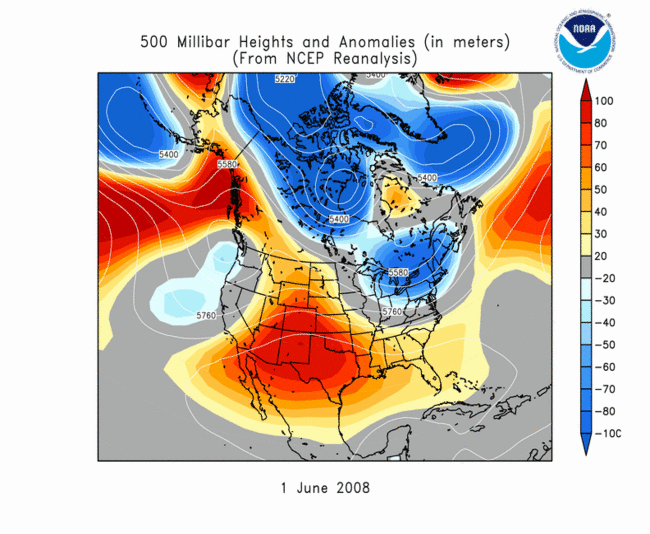
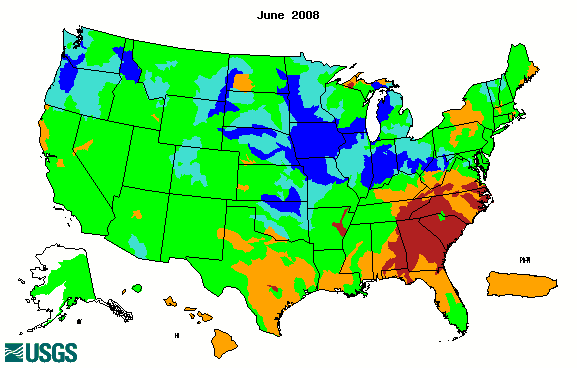
The weather pattern during June was a
continuation of the pattern of the last several months. A series of
cold upper troughs over the northwestern U.S. at the jet stream
level propagated low pressure
systems and cold fronts, with heavy rain and severe weather,
across the Midwest to Northeast. Dry, warm high pressure dominated
at the upper levels across the southern states. The result was wet
weather and flooding from the central Plains to the Great Lakes,
with drought conditions improving in the northern Plains. Dry
weather prevailed in the south, especially over the Southwest,
southern
Plains, and Southeast,
where drought conditions deteriorated this month (July 1 USDM
versus May
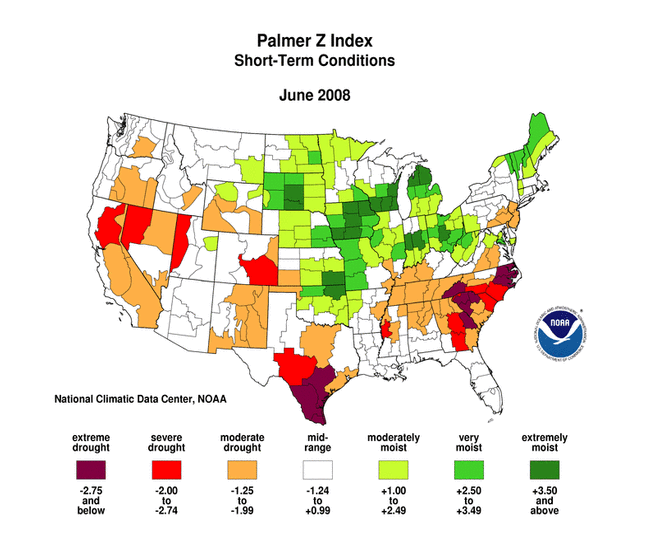
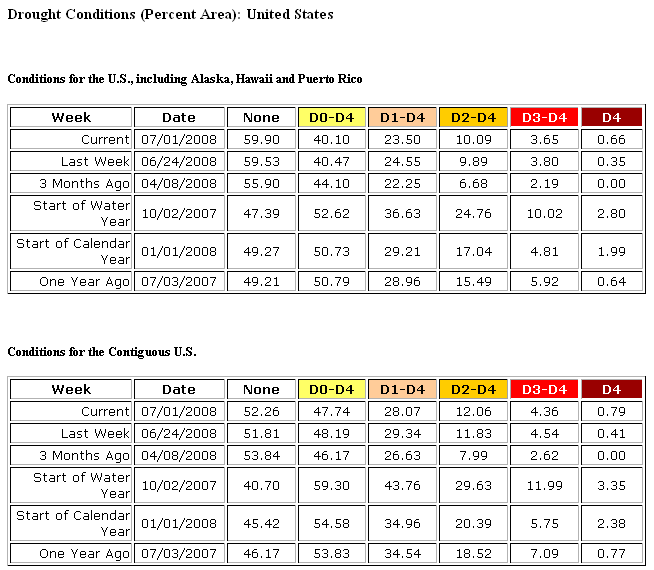
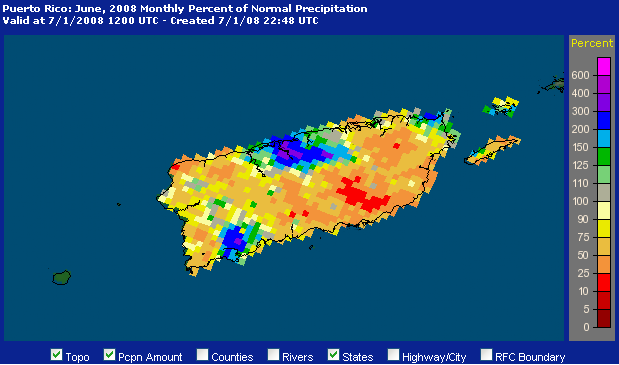
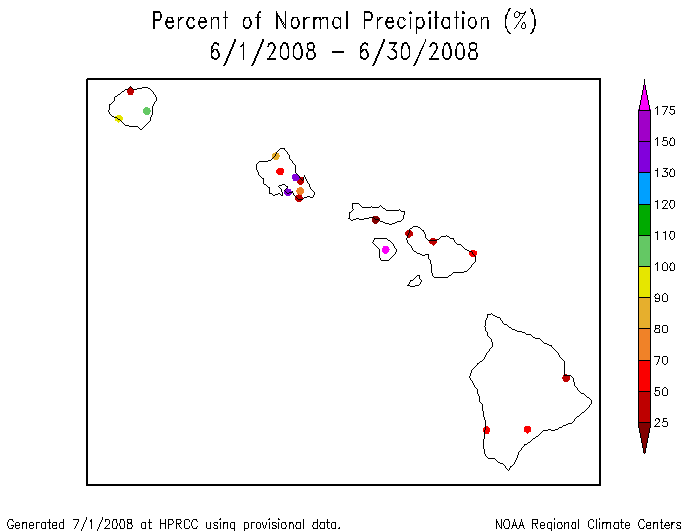
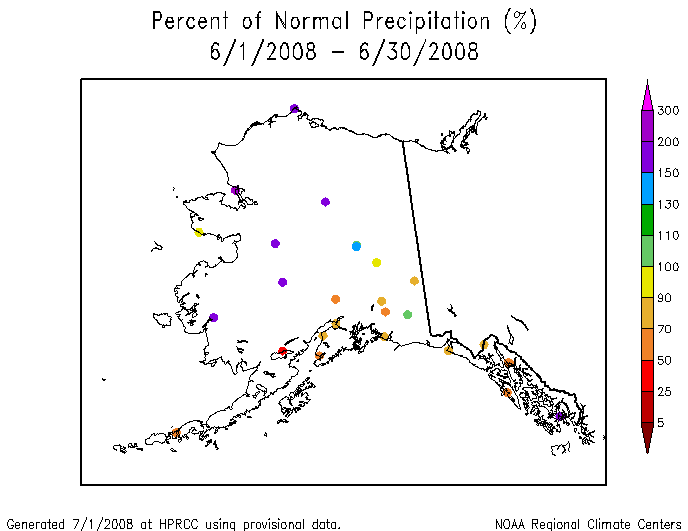
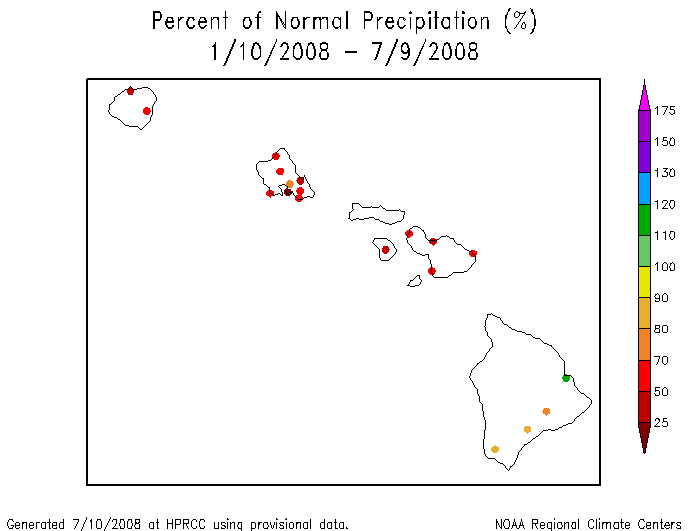
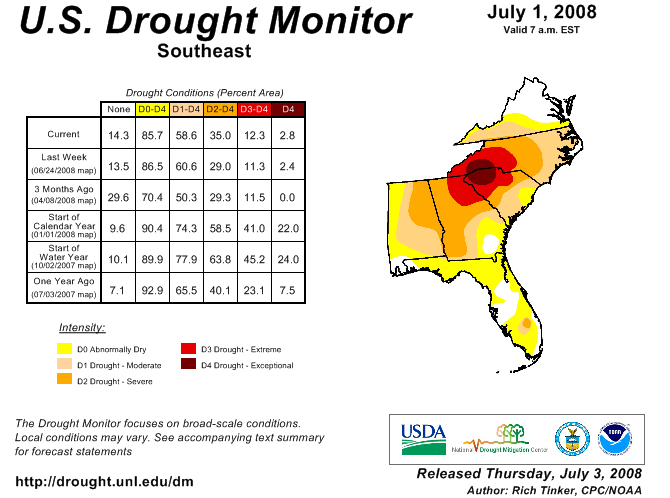
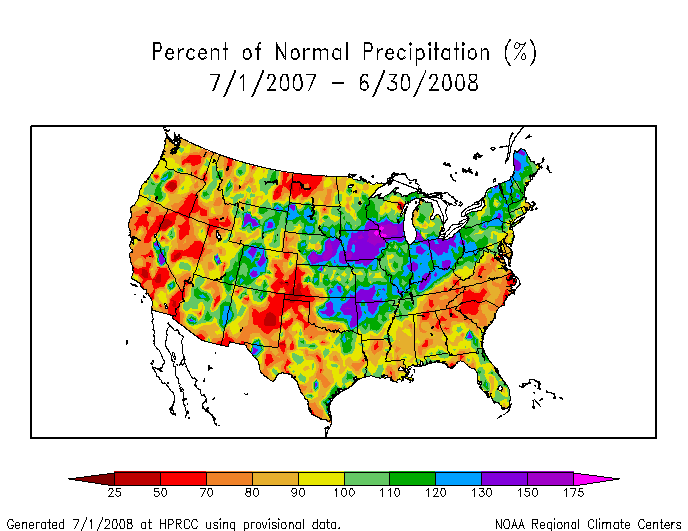
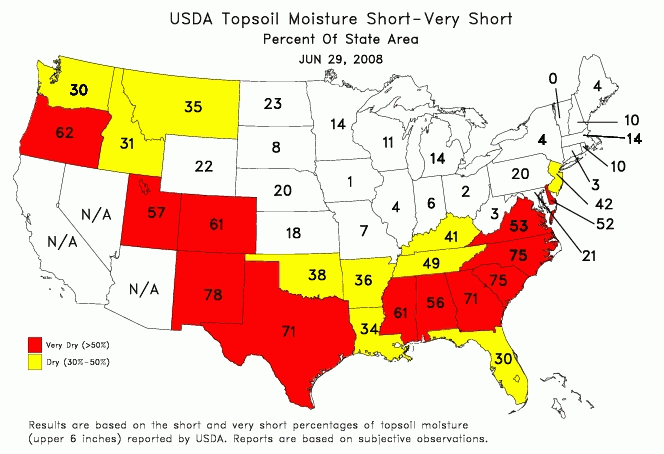
27 USDM).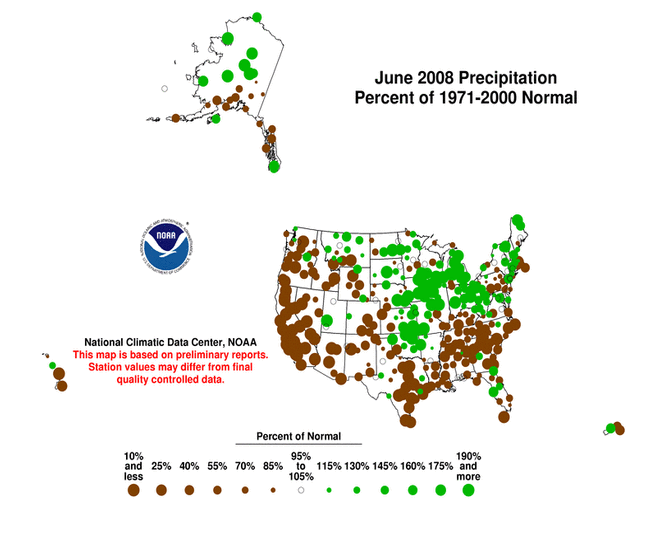 June was generally drier than average across much of Puerto Rico and Hawaii and across southern Alaska. The persistent dryness has resulted in reduced streamflow in Hawaii and Puerto Rico and contributed to the 6-month deficits in Hawaii. 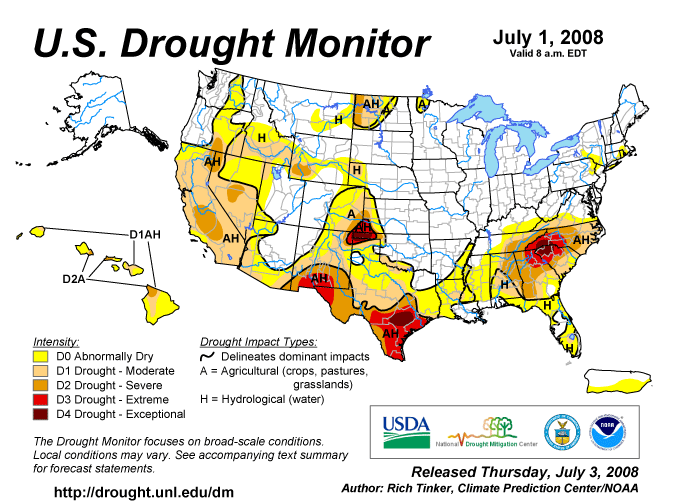 Drought conditions in the Southeast deteriorated with the addition of an area of exceptional (D4) drought. USDM statistics showed moderate to exceptional drought covering about 59% of the region by the end of June compared to about 40% at the end of May. Significant long-term hydrologic deficits remained, with low groundwater and streamflow levels and several states still suffering from severe long-term hydrologic drought. July-June 2007-2008 ranked as the third driest July-June on record for North Carolina. 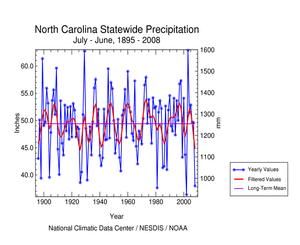 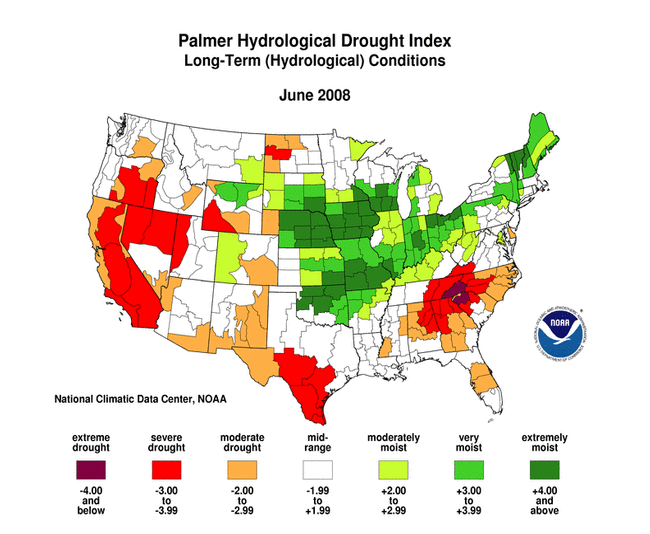 |
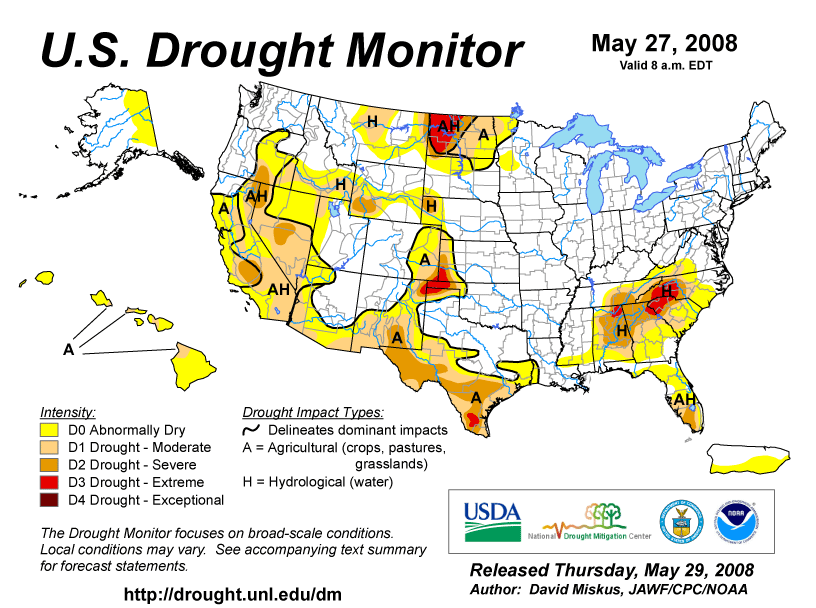
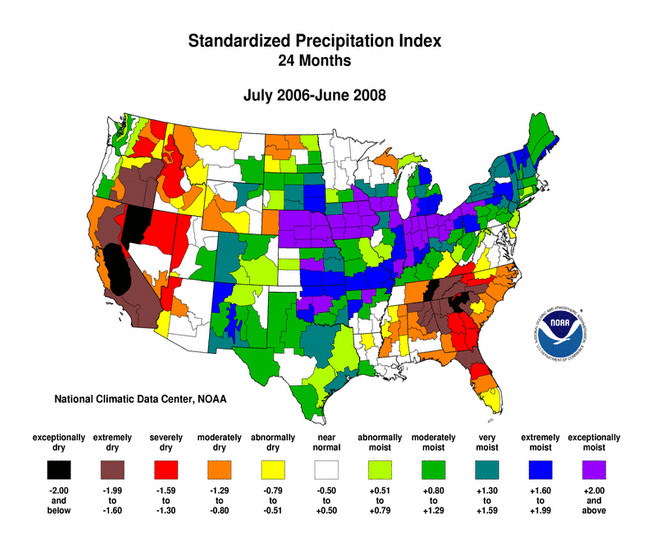
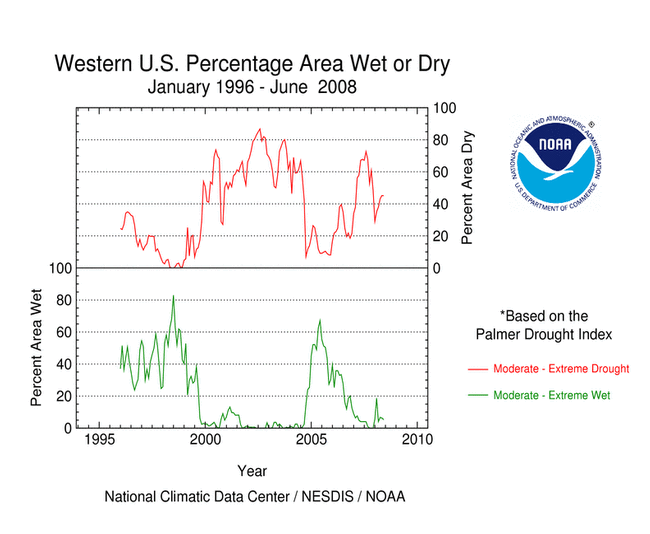
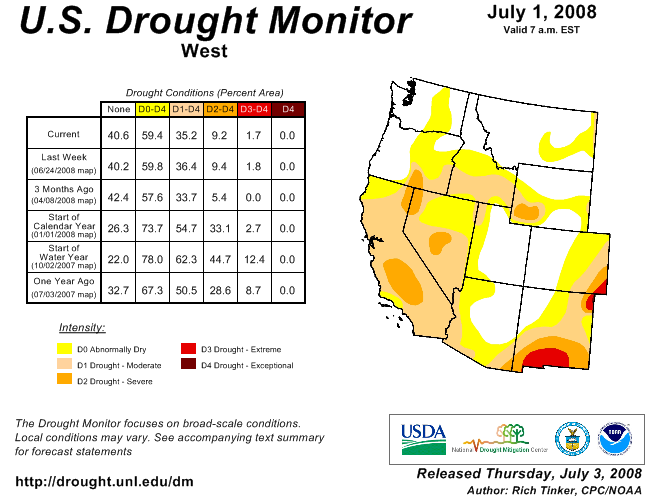
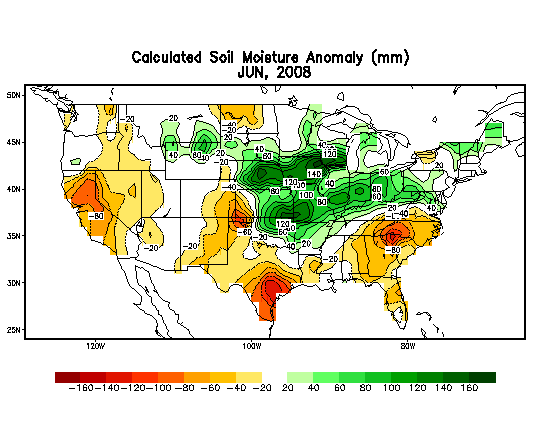
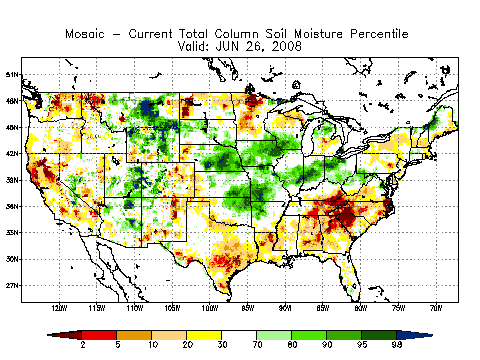
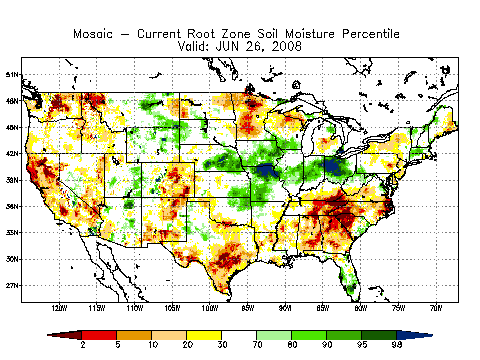
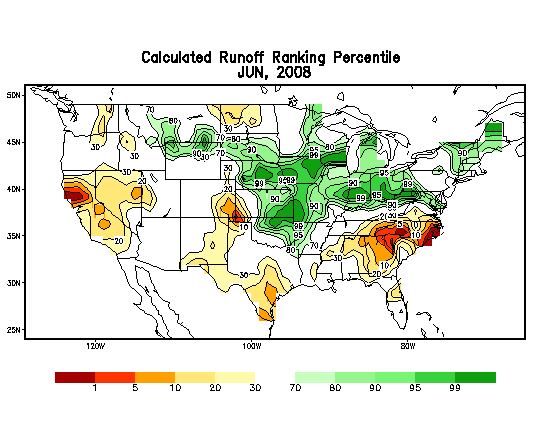
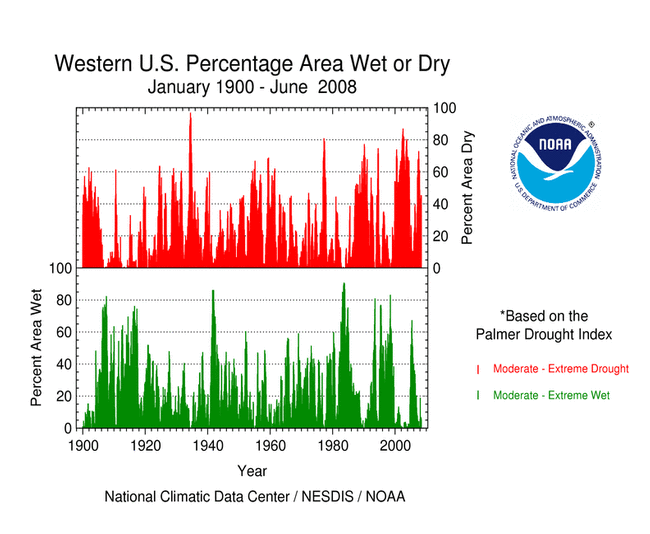 Drought expanded in the West during June, with USDM statistics showing moderate to extreme drought growing to 35% of the region by the end of the month compared to 26% a month ago. California had the fourth driest June and driest March-June in the 1895-2008 record. The California dryness was so severe that Governor Schwarzenegger declared the first statewide drought in 17 years. According to media reports, the last time a statewide drought was declared in California was 1991. Numerous lightning-sparked wildfires were burning across the state by the end of the month. 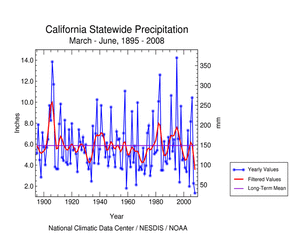 Hot and dry conditions expanded drought in the southern Plains, with the hardest-hit areas being southern Texas and the area centered around the western part of the Oklahoma panhandle. Drought was having some severe localized impacts in the Oklahoma panhandle. According to media reports (The Oklahoman, 6/13), impacts included large-scale livestock sell-offs, wildfires, and growing risk of significant dust storms. In Cimarron county, Oklahoma, the wheat crop was nonexistent this year, pastures were dormant or dead, and wind erosion of the soil was occurring — according to old-timers in the area — like back in the Dust Bowl days. Governor Henry requested federal disaster aid in June for Oklahoma farmers and ranchers who have been hit by drought and extreme weather conditions in nine northwest counties. Southern Texas (climate division 9) experienced the driest October-June in the 114-year record. According to media reports, Texas agricultural specialists feared record losses in agriculture this year due to heat and drought conditions combined with skyrocketing input costs. Cotton producers in southern Texas have already lost nearly their entire crop. 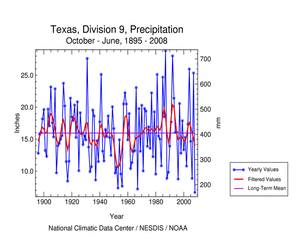 The persistent dryness has depleted soil moisture (especially in the Southeast and southern Plains but also across parts of California, the Pacific Northwest, and the north central states) and ravaged crop and rangeland, especially in the Southeast, southern High Plains, and California. Streamflow (both modeled and observed) averaged below normal across the Southeast and southern Plains. A more detailed drought discussion can be found below. |
|
|
|
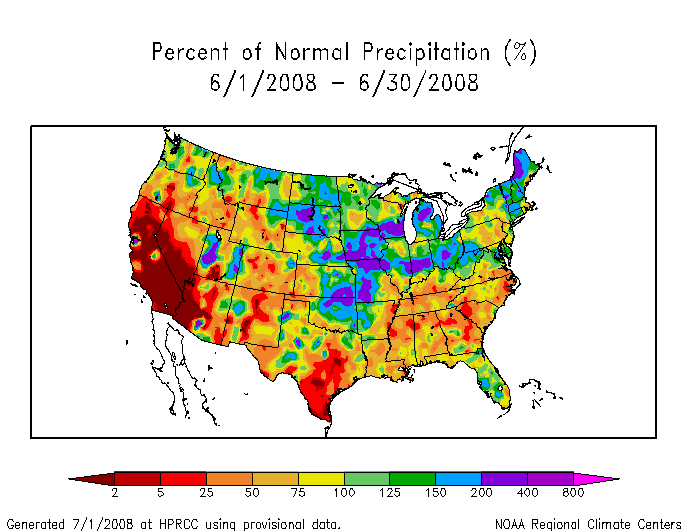
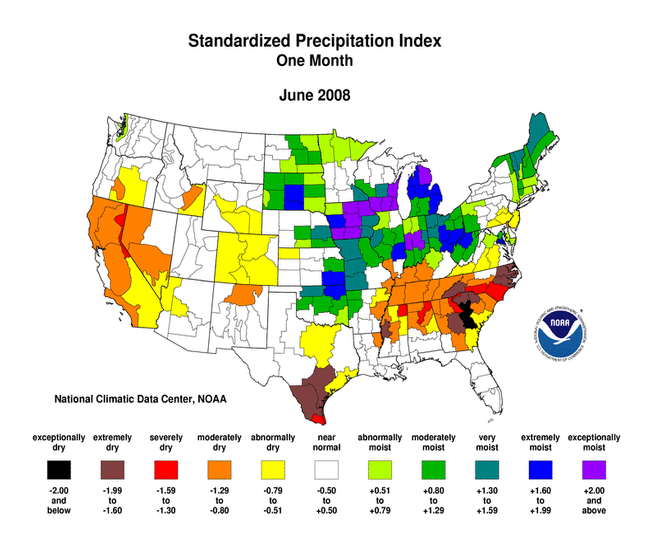
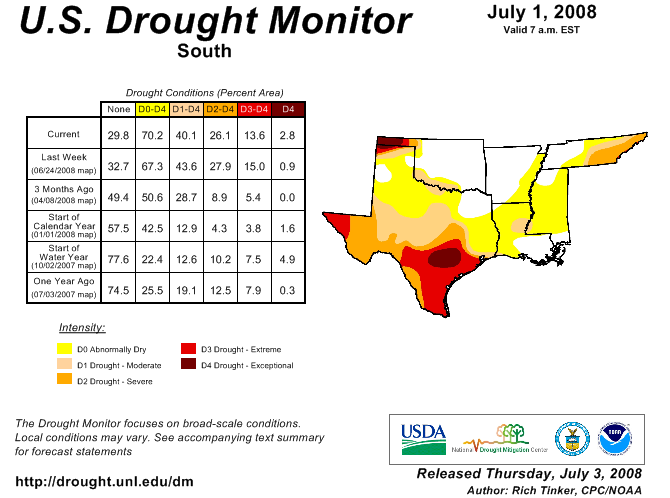
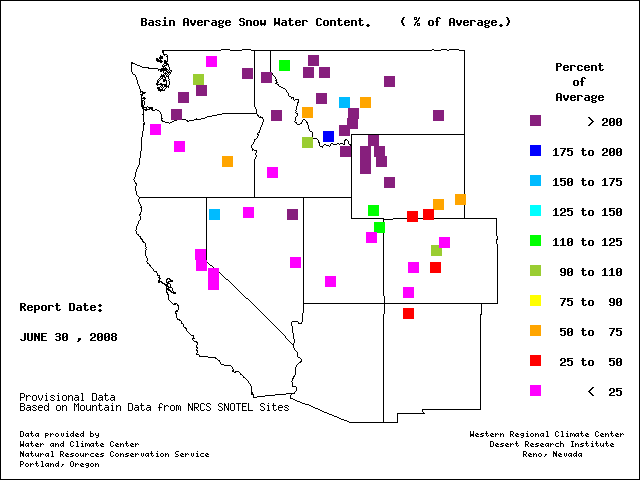
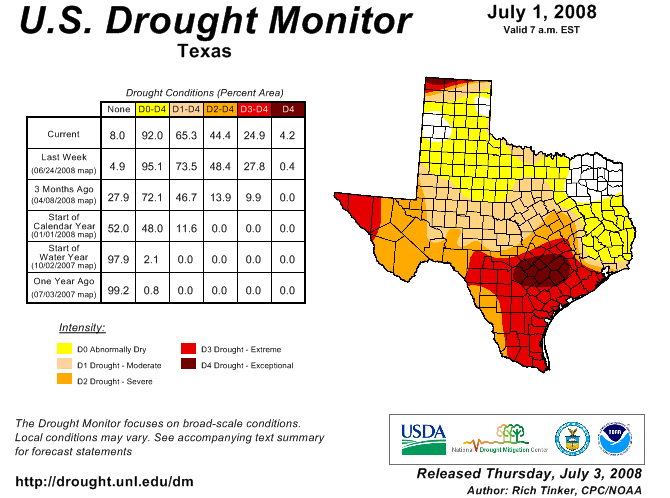
According to the Southeast Regional Climate Center, Florida, Puerto Rico and the Washington, D.C. area were all relatively wet during the month, with precipitation a few percent above normal. Most other areas were below normal. However, precipitation came almost exclusively from widely scattered showers. There was not a day in the month when there was not a thunderstorm somewhere in the region. So, although most stations had monthly totals below normal, some isolated stations had much above normal rainfall. On a state-by-state basis, this was most marked in North Carolina, where Andrews, in the mountains, had 10.7 in (272 mm), or 193% of normal, while Washington, NC, on the coast, had 0.15 in (4 mm), 3% of normal. Other notable dry stations include Atlanta, GA with 0.58 in (15 mm) or 16% of normal, Greenville-Spartanburg, SC with 3% of normal and the driest June on record, and Anniston, AL with 4%. After being free of "Exceptional Drought" since the middle of March, the low rainfall brought a return to this category for parts of the region during June. By the end of the month upstate South Carolina and western North Carolina were once again involved. The area with the somewhat less severe "Extreme Drought" expanded to include areas in northeast Georgia and broader areas of North and South Carolina. Only small areas of northern Virginia, south Alabama and central Florida were not in dry conditions. The weather pattern during June 2008 was dominated by an upper level ridge that steered precipitation-producing systems west and north of the region. These systems, however, pushed several relatively weak cold fronts through the area during the month and these provided isolated to scattered thunderstorms. Although we do not expect too many tornadoes in June in the Southeast, this year the number (18 tornadoes) was near average, with the flow pattern ensuring that most of them were associated with outbreaks at the northern edge of the region. As noted by the Southern Regional Climate Center, in general, precipitation for the month of June was below normal in most of the Southern Region. As expected for this time of year, there were small pockets of near-normal to above-normal precipitation. These areas were scattered about the region, but concentrated more in the west central area of Texas. The only main portion of the region that experienced above normal precipitation was in northwestern Arkansas and northeastern and southeastern Oklahoma. In that area, monthly totals ranged from 130 to 200 percent of normal. In the Southern Region, drought conditions during June changed slightly from last month, being predominant in three corners of the region: western Oklahoma and northeastern Texas, southern Texas, and eastern Tennessee. Since last month, a small patch of moderate drought has been identified in east central Louisiana along the Mississippi border. This area makes up approximately 9% of the state of Louisiana and just over 2% of Mississippi. Although the extent of drought has not changed much from last month in western Oklahoma, conditions have worsened. As of July 1, 2008, the entire panhandle was in a state of drought, with the two western-most counties showing D4, or exceptional drought conditions — the highest level of drought on the U.S. Drought Monitor. In addition, there was a narrow band of moderate drought in the southeastern portion of the state extending from Greer County to Marshall County. In the case of Tennessee, drought was still restricted to the eastern half of the state during June, with little change to the amount of areal extent from May. Similar to Oklahoma, however, drought conditions in eastern Tennessee worsened slightly. At the end of May, only 37% of the state observed moderate drought or worse, with one tenth of the state observing severe drought conditions. By July 1, approximately one third of Tennessee was in severe drought, with another 15% of the state in moderate drought. The most dramatic changes in drought were observed in Texas, where approximately 65% of the area was in a state of moderate drought or worse. A more significant change from May, however, was the amount of exceptional drought in Texas. At the end of May, only two small pockets (approximately 1.5% of the state) of exceptional drought were present, with a small area being located in the northern panhandle, and a second small area in the south central counties. By the end of June, much of the southern counties of the state were experiencing extreme or exceptional drought conditions. Extreme drought extended as far west as Edwards and Kinney Counties, and as far east as Galveston. It also extended as far south as Cameron County and as far north as Milam County. In total, approximately one quarter of the state was experiencing severe drought or worse, with approximately 13% of the state in exceptional drought conditions. In Texas, exceptional drought was observed in Dallam and Sherman counties in the northern panhandle, and in approximately a dozen counties in the south central portions of the state, centered about Gonzales County. As a result of the drought conditions in Texas, outdoor burn bans have been declared in many counties throughout the state. Because conditions continued to be dry, KSAT news in San Antonio reported that water restrictions were in effect for 58 public water systems across the state. As explained by the Midwest Regional Climate Center, June was a very wet month across a significant portion of the Midwest, with numerous heavy rain events that helped produce record flooding in Iowa, Wisconsin, Indiana, and Illinois. While most attention was focused on the heavy rainfall during June, dryness persisted from southeastern Missouri east through southern Kentucky. Rainfall over southern Kentucky was less than 50 percent of normal for the month. As noted by the High Plains Regional Climate Center, areas of much wetter than normal (150%+) and much drier than normal (50% and below) precipitation existed across the region. Areas well below normal precipitation occurred in the majority of Colorado and Wyoming with other areas including western Kansas and northeastern Nebraska. Drought conditions continued to persist over many of the same areas as May with one marked area of great improvement. The extreme drought conditions (D3) of North Dakota improved greatly and were reduced to a large area of D0 (abnormally dry) and D1 (moderate drought) in the west with a smaller area of D2 (severe drought) along the western border. Drought conditions no longer existed in eastern North Dakota. Northwestern Nebraska also dropped from D2 drought condition to D1 during June. Drought through the rest of the region remained the same with some increased D3 areas along the southern portions of the Colorado-Kansas border. As summarized by the Western Regional Climate Center, precipitation was characteristically sparse to nonexistent in the Southwest and most of the intermountain region. Pockets of Montana and the Pacific Northwest had above normal precipitation for the month, but otherwise most of the West had below normal rainfall. Of special note, the governor of California proclaimed a statewide drought after 2 consecutive years of below normal rainfall, especially the case from late winter to early summer. At the end of the precipitation season widely used in California (July 1, 2007 to June 30, 2008), much of the state had received only 75 percent of normal, after a promising start. The previous year had 20-60 percent of normal, so in some cases impacts have accumulated. Many locations in the state have had less rain in the past 24 months than their annual average. The cool conditions over the past three months have greatly reduced the melt rate of the snowpack in the Pacific Northwest. On June 30, the NRCS Mount Hood Test Site Snotel station at 5400 ft elevation (1646 m) in the Oregon Cascades reported 122.1 inches (3101 mm) of precipitation since October 1, with 50.3 inches (128 cm) of water content in the snow pack remaining on the ground. Other large totals included 175 inches (4445 mm) of precipitation since Oct 1 at Blazed Alder, OR, and 70.8 inches of water content (180 cm), nearly six feet, in the remaining soggy snowpack at Paradise Ranger Station on Mount Rainier in Washington. Many streams were running at all time high flows for this time of year in western Washington. From the 19th to the 22nd southern California suffered through record heat. The 21st brought dry lightning to much of the northern half of the state sparking over 800 fires and producing very thick smoke. Unhealthy air quality persisted through the end of the month in numerous California, Oregon, and Nevada locations. Alaska: According to National Weather Service reports (from information provided by Audrey Rubel at NOAA NWS Alaska Region Headquarters), June is normally one of the drier months of the year for the Alaska panhandle, but June 2008 was significantly drier than normal in many areas. The panhandle was drier than normal in northern and central locations, while southern locations were above normal for precipitation. The little rain that fell was distributed in a weak bimodal fashion during the first and last weeks of the month. Significant rain fell during the first week in northern portions of the panhandle, which helped alleviate the ongoing and significant precipitation deficit in this area. However, the far northern panhandle still lagged far below normal (15 inches/380 mm) in terms of the year-to-date accumulated precipitation. Rainfall amounts in the panhandle were 25%-54% below normal during the month. In central Alaska, June 2008 rainfall amounts were highly variable due to the scattered nature of most precipitation. The interior of Alaska experienced unusually low wildfire activity for June. At the end of the month, Fairbanks had yet to experience even a hint of smoke this summer. Despite the presence of boreal summer, snow was recorded at several locations in Alaska during June. As noted by the Northeast Regional Climate Center, rainfall totals were quite variable throughout the Northeast, especially in Maine. Totals in the Vacation State ranged from 2 inches (51 mm) along the coast to over 9 inches (229 mm) in the northwest portion of the state. Overall, the Northeast averaged 4.62 inches (117 mm) of rainfall, which was 113% of normal. Vermont, New Hampshire and Maine were the wettest states, with 152%, 144% and 143% of the 30-year normal, respectively. New Jersey and Delaware were the driest states in the region, averaging 75% and 80% of the normal June precipitation. By month's end, the U.S. Drought Monitor indicated abnormally dry conditions in Rhode Island, southeastern Massachusetts, southern West Virginia, eastern Long Island, NY, and along the Pennsylvania-New Jersey-New York border. |
|
| A detailed review of
drought and moisture conditions is available for all contiguous U.S.
states, the nine standard regions, and
the nation (contiguous U.S.): STATES: REGIONS:
|
|
|
|
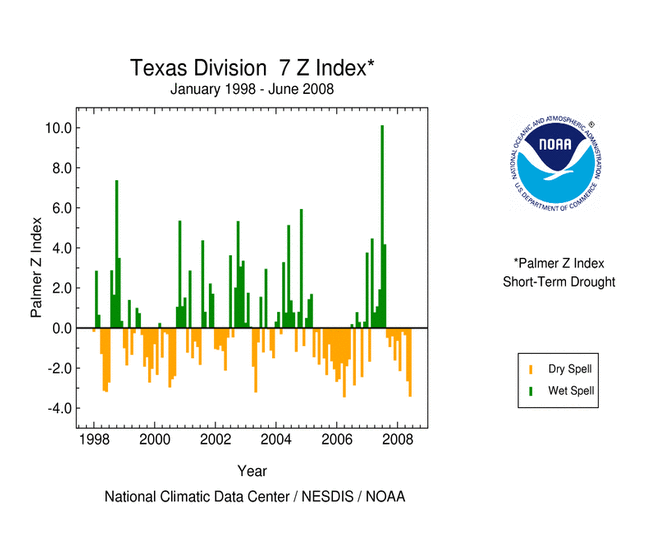
| On the heels of a
very
dry May, rainfall in June
in south central Texas (climate division 7) was a mere 0.65", 17%
of normal (based on 1950-2000), exacerbating drought
conditions that have been building since last fall.
Precipitation in division 7 has been 55% of normal since
September 2007 and 52% of normal since
December 2007. After the extremely dry June, most of division 7
was classified as being in "exceptional drought" (D4) on the late
June/early July U.S. Drought
Monitor — the driest spot in a state covered
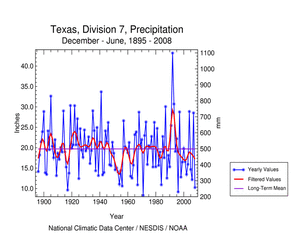
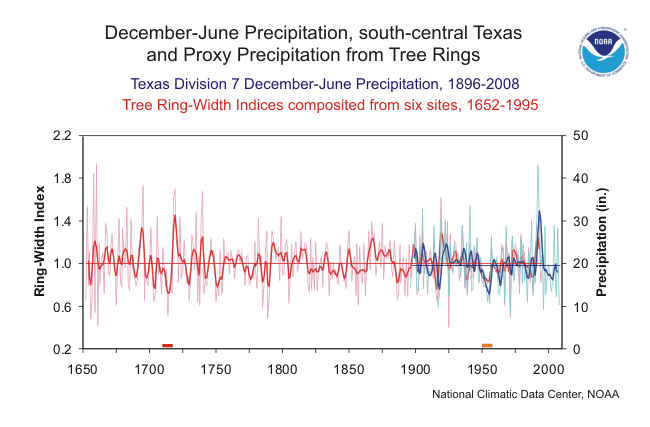
largely by drought. The graph below left shows December-June precipitation from 1896-2008 for Texas division 7. According to preliminary data, December 2007-June 2008 ranked as the fourth driest December-June in the 114-year record. The graph below right also shows the 1896-2008 December-June precipitation for Texas division 7 (annual values in light blue, 5-year weighted average in dark blue). The most striking multi-year anomaly in this record is the 1950s drought (indicated with the orange bar), which had seven consecutive years (1950-1956) with below-normal December-June precipitation. |
 large image |
 large image (50 KB) |
| The graph above right
also shows a 344-year tree-ring record (1652-1995; annual values in
light red; 5-year smoothed values in dark red) that corresponds
well to the variability in December-June precipitation. This record
is a composite of six post oak (Quercus stellata) tree-ring
chronologies from south Texas (Therell, 2000). The correlation
between the annual values of the tree-ring record and December-June
precipitation is 0.748, indicating a high degree of shared
variance. The tree-ring record captures both the inter-annual and
decadal-scale variability of the observed precipitation record very
well. The tree-ring record, as a proxy for precipitation, can put the December-June precipitation variability of the last century in south central Texas into a much longer perspective. In the approximately 250-years prior to 1896, the tree-ring record shows about a dozen individual years that likely had very low December-June precipitation similar to the lowest values in the past century, such as 2008. Looking at multi-year droughts, the 1950s drought appears to have been matched and possibly exceeded by one that occurred in the early 1700s (red bar), in which the ring-width index was below average for seven years in a row (1711-1717) and the cumulative ring-width anomaly for those seven years was slightly lower than for 1950-1956. While the recent dryness in south central Texas has been extreme, the tree-ring record indicates that it is an uncommon but not extraordinary drought event — the type that has occurred several times per century since at least 1650. |
Resources:
|