| Contents Of This Report: |
 |

|

|
|
|
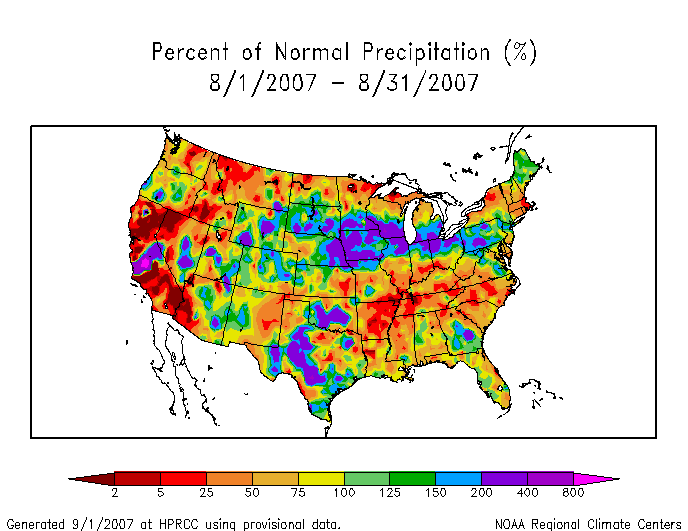
August 2007 was
characterized by a contrast in extreme weather. Very hot and
dry
conditions plagued most of the Southeast U.S., and dry weather
persisted across the northern Great Lakes and much of the West.
Meanwhile, heavy rain developed along a quasi-stationary front from
the central Plains to southern Great Lakes, splitting the northern
Great Lakes and Southeast drought
areas. Torrential rains from thunderstorms and the remnants of
Tropical Storm Erin inundated parts of the southern Plains, acting
as a wet barrier between the parched Southeast and drier portions
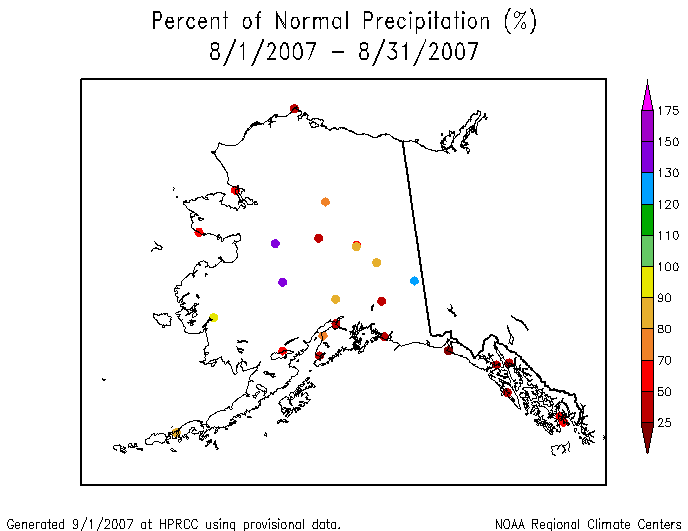
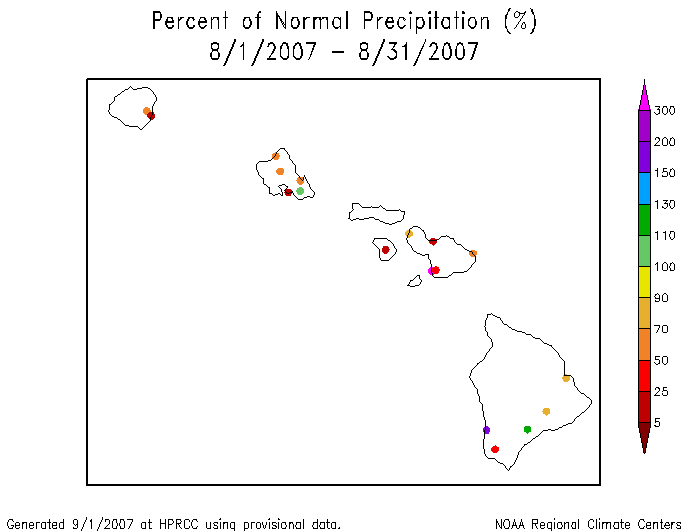
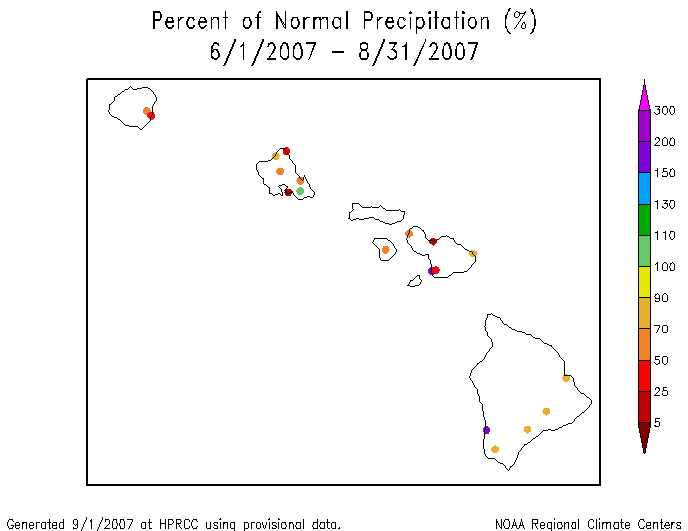
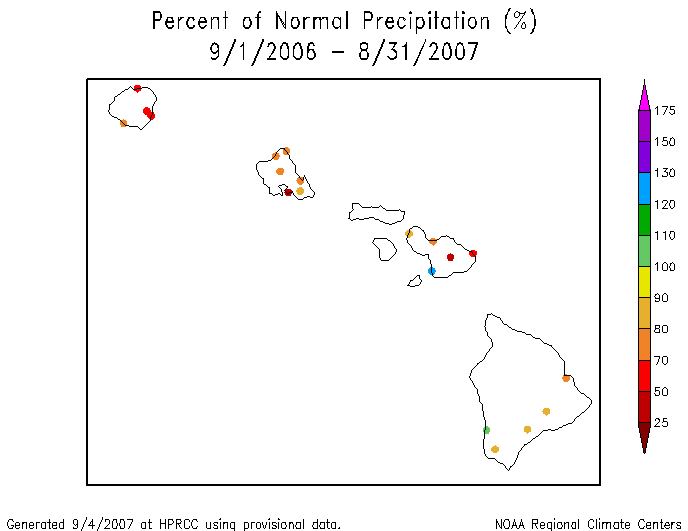
of the Far West. Drier-than-normal
conditions occurred across much of Alaska
and the Hawaiian
Islands, and parts of Puerto
Rico.
|
|
|
|
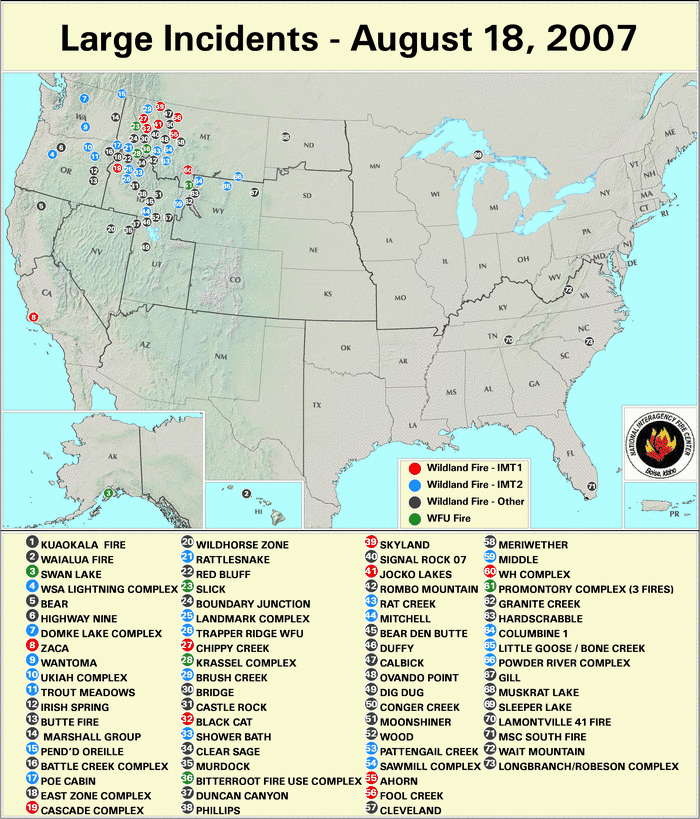
| Wildfires remained active
and difficult to contain across the northern Rockies and northern
Intermountain West. As of August 31, year-to-date wildfires across
the U.S. had burned about 7.0 million acres of vegetation (128
percent of the 10-year average), mostly in the
Northwest. The relentless spread of large wildfires prompted
Governor C.L. Otter to declare a statewide disaster emergency in
Idaho. The severe heat wave, which persisted beneath a strong upper high pressure system much of the month across southern and central parts of the nation, intensified evaporation. More than 30 all-time high station temperature records were tied or broken and more than 2000 new daily high temperature records were established. More than ten days of triple digit temperatures were recorded at numerous stations across the southeastern states. This heat combined with the general lack of rain to exacerbate drought conditions in the Southeast. Many communities had implemented mandatory water restrictions. Streams and lakes shrank, soils dried out (USDA observed and CPC modeled), and vegetation and crops withered (USDA observed and compared to average).
According to the Alabama State Climatologist, 96 percent of the state reported short to very short soil moisture, and Oaks were dying on ridges which will have serious consequences in the next two years. Historic low pools were expected for Alabama reservoirs. Brown's Ferry Number 2 nuclear power plant shut down due to the Tennessee River being too weak and too warm for cooling the reactor. Climate Division 4 in northeastern Alabama had record dry conditions since the beginning of this year.
|
The lack of rain in
recent months has dried out vegetation so much that the North
Carolina Division of Forest Resources imposed a statewide ban on
open burning and cancelled all burning permits. As reported by the
USGS, the hot and dry weather conditions in August brought record
lows to many of North Carolina's rivers and streams. The lowest
average August streamflow in 110 years of record was recorded on
the Tar River at Tarboro. The lowest average August streamflow on
record was measured at 12 other monitoring stations in the state,
with 9 of those sites located in central North Carolina. The
drought brought groundwater levels in unpumped wells in western
North Carolina and in the outer coastal plain to near the levels
observed during the 1998-2002 drought. The heat and low streamflows
also raised stream water temperatures, having an adverse effect on
fish and biological communities. As noted by the Midwest Regional Climate Center, drought conditions continued to expand and intensify in parts of the Midwest during August. Precipitation was only 10 to 25 percent of normal from the Missouri bootheel into western Kentucky and less than 25 percent of normal in the Michigan Upper Peninsula. Marquette, MI received only 0.85 inch of rain in August. This was the driest May-August on record in Marquette, with only 7.20 inches of rain. The previous record was 8.28 inches in May-August 1998. Water levels in Lake Superior reached a new record low for August as a result of the combination of warmer than normal weather and below normal precipitation over the last 20 months over the Lake Superior drainage basin. The average Lake Superior water level at the end of August 2007 was 600.4 feet above mean sea level, a foot lower than a year ago and two inches lower than the previous record of 600.5 feet in 1926. The all-time record low water level for Lake Superior is 599.5 feet in March and April 1926. Water levels in Lakes Michigan and Huron were about two feet below normal level, but still about nine inches above the record low water levels. In early August, the USDA declared 24 drought-stricken Minnesota counties to be agricultural disaster areas. And in the Northeast, state officials declared a drought watch across most of Pennsylvania in early August. |
|
| A detailed review of
drought and moisture conditions is available for all contiguous U.S.
states, the nine standard regions, and
the nation (contiguous U.S.): STATES: REGIONS:
|
|
|
|
| Much of Tennessee has experienced moderate drought conditions since late 2005, but conditions dramatically worsened this spring and summer. The U.S. Drought Monitor for late August/early September showed most of the state to be in category D4, "exceptional drought". Conditions were worse in some local areas. Tennessee Division 3 (central Tennessee) has experienced dry conditions since 2005 and has been persistently dry since February 2007. The Palmer Drought Severity Index (PDSI) for central Tennessee for August 2007 was -5.28, the lowest value ever recorded for any month during the instrumental period. |
|
  |
 |
 |
| The graph to the right shows the summer (June-August) average PDSI, 1895-2007, for Tennessee Division 3 (annual values in light blue, 5-year weighted average in dark blue). The value for 2007 (-4.31) is the lowest summer PDSI in the instrumental record. The most persistent drought was from 1940-1946, when summer PDSI was negative for seven years in a row, including three consecutive years (1941-1943) when summer PDSI was below -3 (yellow arrow). |
 large image (50 KB) |
The graph above also shows a 429-year tree-ring reconstruction (1550-1978) of summer PDSI for a gridpoint (35°N, 87.5°W) on the southern boundary of Tennessee Division 3 (annual values in light red, 5-year weighted average in dark red). This reconstruction is one of over 200 developed by Cook et al. (1999, 2004) across a gridded network covering much of North America, and is based on tree-ring data from 29 sites across the Southeast. The correlation between reconstructed gridpoint PDSI and instrumental Division 3 PDSI over their common period (1895-1978) is 0.673, indicating a high degree of shared variance. The tree-ring reconstruction can put the droughts of the last century in central Tennessee, including the current one, into a much longer historical perspective. "Extreme" summer drought (PDSI below -4) such as 2007 occurs very infrequently (less than once per century) in both the instrumental record and the tree-ring reconstructed records. One year in the tree-ring record (1839 with -5.43) had a reconstructed summer PDSI lower than the observed value for 2007, and another was very similar (1708 with -4.28). The tree-ring record confirms that the severity of this summer's drought is very unusual, but also suggests that it is not unprecedented. The most persistent period of reconstructed summer drought (1564-1573; red arrow) exceeds the duration of the 1940s drought by three years. However, the core of the 1940s drought appears to be unusual even in the context of the multicentury tree-ring record. No 3-year period in the tree-ring record has an average summer PDSI approaching that observed from 1941-1943 (-3.56). |
Resources:
References:
|