larger image
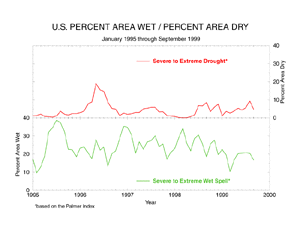
Above: Percent area of the contiguous U.S. experiencing severe to extreme long-term drought and wet spell conditions (as defined by the Palmer Drought Index), January 1995-September 1999.
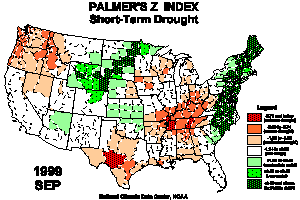
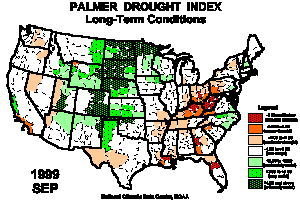
During September 1999, hurricanes Dennis and Floyd brought excessive rains to much of the eastern United States, effectively ending the drought in the rain areas. However, severe to extreme long-term drought continued over a large area from the southern Great Lakes and central Appalachians to the Southeast. Significant short-term (i.e., monthly) precipitation deficits occurred in September over much of the Pacific Northwest, Texas, and the Ohio and Tennessee valleys.
Damage due to the drought has been summarized by NOAA's Rapid Response Project. Crop impact information can be found at the USDA NASS (National Agricultural Statistics Service) and Weekly Weather and Crop Bulletin pages. Drought statements by local National Weather Service Offices can be found at the NWS Hydrologic Information Center. Drought threat assessments and other information can be found at NOAA's Drought Information Center. Additional drought information can be found at the National Drought Mitigation Center. The following states have set up web pages detailing their drought conditions:
Delaware - Georgia - Kentucky - Maryland - New Jersey - Pennsylvania - South Carolina

Contents of This Report:
- Palmer Drought Indices
- Drought and Streamflow
- Regional Drought Watch
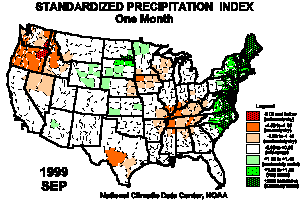
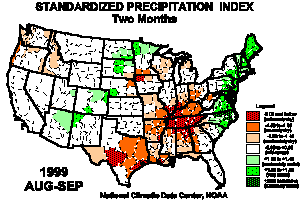
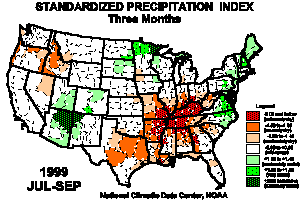
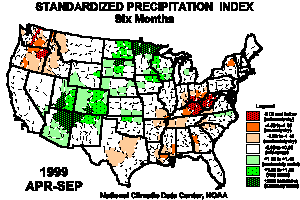
- Standardized Precipitation Index

 Palmer Drought Indices
The Palmer Z Index shows how monthly moisture conditions depart from normal (short-term drought and wetness). Hurricanes Dennis and Floyd brought extremely wet conditions to the rain-starved east coast states from South Carolina to Maine. Very wet conditions also occurred from the northern Plains into the central Rockies. Sandwiched between these wet zones was a large area of September dryness, stretching from the Ohio Valley into the Southeast and southern Plains. Unusually dry conditions also occurred this month in the Pacific Northwest. The animated maps show the geographical pattern of the moisture anomalies for the last 12 months. On these maps, the red shading denotes dry conditions while the green shading indicates wet conditions.
The Palmer Drought Index maps show long-term (cumulative) drought and wet conditions. The heavy rains from hurricanes Dennis and Floyd effectively ended the long-term drought along the east coast this month. However, the 1999 drought continued from the southern Great Lakes and central Appalachians to the Southeast. Much of the northern and central Plains and central Rockies continued in long-term wet spell conditions, although the eastern edge of this wet band has contracted in recent months. The animated maps show how the geographical pattern of the long-term moisture conditions has changed over the last 12 months. On these maps, the red shading denotes drought conditions while the green shading indicates wet conditions.
Z Index Legend:
-2.75 and below (extreme drought)
-2.00 to -2.74 (severe drought)
-1.25 to -1.99 (moderate drought)
-1.24 to +0.99 (mid-range)
+1.00 to +2.49 (moderately moist)
+2.50 to +3.49 (very moist)
+3.50 and above (extremely moist)
larger animated image
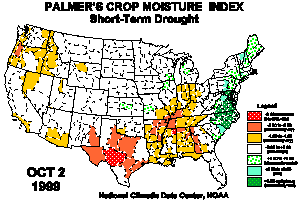
The Palmer Crop Moisture Index is computed on a weekly basis by the National Weather Service's Climate Prediction Center and is useful for following the impact of precipitation anomalies on agriculture. The Animated Crop Moisture Index maps show the weekly change in topsoil moisture conditions for 1999 through the end of September. The CMI maps illustrate the one-two punch of hurricanes Dennis and Floyd. The heavy rains from Dennis brought an end to the soil moisture deficits along the east coast, while the rains from Floyd caused excessively wet soil moisture conditions with widespread flooding. On these Crop Moisture Index maps, the red shading denotes dry conditions while the green shading indicates wet conditions.
larger animated image Palmer Drought Index Legend:
-4.00 and below (extreme drought)
-3.00 to -3.99 (severe drought)
-2.00 to -2.99 (moderate drought)
-1.99 to +1.99 (mid-range)
+2.00 to +2.99 (moderately moist)
+3.00 to +3.99 (very moist)
+4.00 and above (extremely moist)
Crop Moisture Index Legend:
-3.00 and below (severely dry)
-2.00 to -2.99 (excessively dry)
-1.00 to -1.99 (abnormally dry)
-0.99 to +0.99 (mid-range)
+1.00 to +1.99 (abnormally moist)
+2.00 to +2.99 (wet)
+3.00 and above (excessively wet)
larger animated image

 Drought and Streamflow
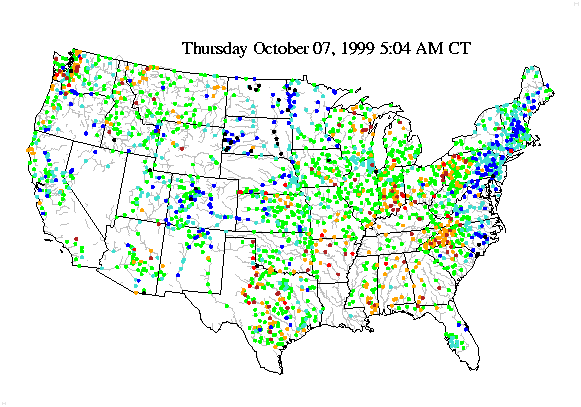
Preliminary streamflow measurements by the United States Geological Survey reveal unusually low daily streamflows associated with the drought from the southern Great Lakes to the Deep South during September. River stages were above normal during the month in the wet areas of the northern and central Plains, and many daily record flows occurred along the tracks of hurricanes Dennis and Floyd. Explanation:
New record high for day
90th percentile
75th - 89th percentile
25th - 74th percentile
10th - 24th percentile
10th percentile
New record low for day
larger animated image More streamflow information can be found at the United States Geological Survey's web page.

 Regional Drought Watch
Regions Discussed: Central Northwest Chesapeake Tri-State Area (MD, DE, VA) Northeast 
Central Region Precipitation Deficit
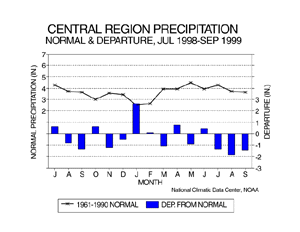
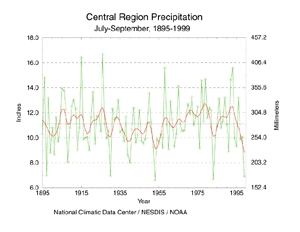
Nine of the last 15 months have averaged drier than normal across the Cental region. The last 3 months have been especially dry, with 1999 having the third driest August-September and third driest July-September in the last 105 years. Other 1999 statistics include: 12th driest April-September and 24th driest year-to-date.
larger image
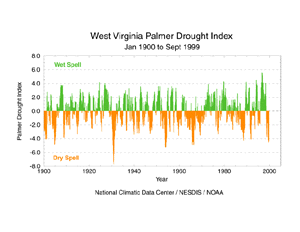
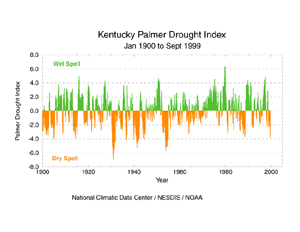
larger image The Palmer Drought Index (PDI) has been used for U.S. drought monitoring for the last 30 years. It is based on a water budget model that incorporates the balance between water supply (i.e., precipitation), soil moisture, runoff, and water demand (computed from estimates for evaporation and transpiration). The PDI is a long-term drought index which incorporates the current conditions (i.e., for the current month) and the past conditions (the preceding several months). The PDI is useful for showing how the current drought compares to past droughts.
Plots of the monthly PDI for January 1900-September 1999 are shown below for West Virginia and Kentucky. In both cases, conditions during the past 12 months rapidly deteriorated into severe to extreme long-term drought (PDI values of -3.0 to -4.0 and greater). However, the PDI indicates that the 1999 drought is not the worst long-term drought on record. In both states, droughts earlier this century have had a greater magnitude (PDI level as bad or more severe) and/or lasted much longer. The worst drought (as measured by the magnitude of the PDI) occurred in 1930-31.
larger image
larger image
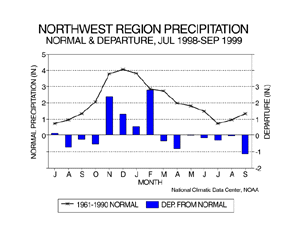
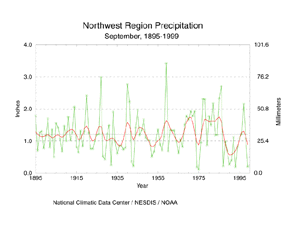
Northwest Region Precipitation Deficit
Based on preliminary data, the Northwest Region had the fourth driest September on record this year. This, in combination with dry conditions during spring and summer 1999, has given the region the 14th driest April-September. Short-term drought (as measured by the Crop Moisture Index) has expanded into the region during this period. However, the Pacific Northwest has a pronounced seasonal precipitation pattern, with November-March being the wet season. Water managers in this region are dependent on rivers fed by mountain snowpacks, which were unusually heavy this year due to the second wettest November-February on record.
larger image
larger image
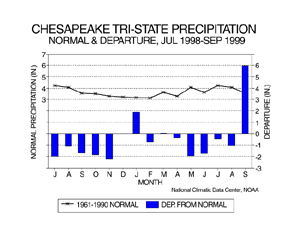
Chesapeake Tri-State Precipitation
larger image The Chesapeake Bay area suffered from drought from summer last year through this August. During that period, 11 out of 14 months were drier than normal. However, the remnants from two tropical systems, hurricanes Dennis and Floyd, dumped enough precipitation over the region in September to effectively end the long-term drought. September 1999 was the wettest September on record and brought the April-September 1999 precipitation rank to near normal.
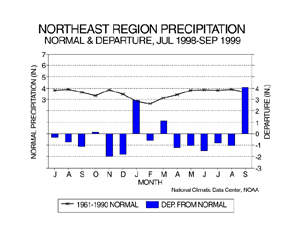
Northeastern U.S. Precipitation
Like the Chesapeake Tri-State area, the Northeast region was plagued by unusually dry conditions from last summer through this August. Heavy rains from the remnants of hurricanes Dennis and Floyd gave the region its wettest September on record and fourth wettest August-September. The long-term drought was effectively ended, with April-September 1999 ranking as only the 38th driest such period and January-September ranking as the 34th wettest year-to-date out of 105 years of record.
larger image

 Standardized Precipitation Index
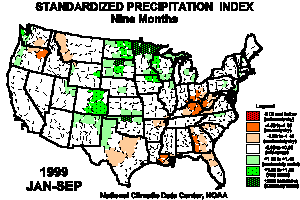
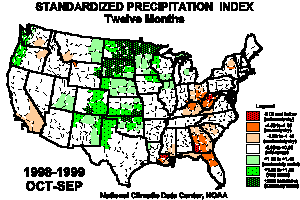
The Standardized Precipitation Index (SPI) is another way of measuring drought. The SPI is an index based on the probability of recording a given amount of precipitation. The probabilities are computed by mixing the likelihood of not receiving any precipitation, as in deserts, with the likelihood of receiving a given amount precipitation when precipitation falls. The probabilities are standardized so that an index of zero indicates the median precipitation amount (half of the historical precipitation amounts are below the median, and half are above the median). The index is negative for drought, and positive for wet conditions. As the dry or wet conditions become more severe, the index becomes more negative or positive. While the Palmer Drought Index is a water balance index that considers water supply (precipitation), demand (evapotranspiration) and loss (runoff), the SPI is a probability index that considers only precipitation. SPI Legend:
-2.00 and below (extremely dry)
-1.50 to -1.99 (severely dry)
-1.00 to -1.49 (moderately dry)
-0.99 to +0.99 (mid-range)
+1.00 to +1.49 (moderately moist)
+1.50 to +1.99 (very moist)
+2.00 and above (extremely moist)
The six maps below show the September 1999 spatial patterns of SPI for six different time frames ranging from one month (short-term conditions) to twelve months (long-term conditions). When taken together, they give a combined geographical and temporal picture of the severity of the precipitation deficits and surpluses. The maps indicate, for example, that the heavy September rains from hurricanes Dennis and Floyd show up as very moist conditions along the east coast as far back as the three-month SPI, and they counterbalance the drought resulting in a neutral SPI as far back as 12 months. Extremely dry conditions stretch from the Ohio Valley to the Southeast and southern Plains over the two- and three-month time frames, while the Pacific Northwest shows drought stress over the one- to six-month time frames. In the long term, a large area of moist conditions dominates from the northern Plains to the southern Rockies, while dry conditions dominate from the Ohio Valley to the Southeast.
larger image
larger image
larger image
larger image
larger image
larger image

Current data are based on preliminary reports from River Forecast Center stations and First and Second Order airport stations obtained from the National Weather Service (NWS) Climate Prediction Center and real time Global Telecommunications System (GTS) monthly CLIMAT summaries. THE CURRENT DATA SHOULD BE USED WITH CAUTION. These preliminary data are useful for estimating how current anomalies compare to the historical record, however the actual values and rankings for the current year may change as the final data arrive at NCDC and are processed.The following NCDC datasets are used for the historical U.S. data: the climate division drought database (TD-9640), and the hurricane datasets (TD-9636 and TD-9697). It should be noted that the climate division drought database consists of monthly data for 344 climate divisions in the contiguous United States. These divisional values are calculated from the 6000+ station Cooperative Observer network.
 NOAA's National Centers for Environmental Information
