Issued 11 April 2024


Please note that the values presented in this report are based on preliminary data. They will change when the final data are processed, but will not be replaced on these pages.
National Drought Highlights
- Based on the Palmer Drought Index, severe to extreme drought affected about 10% of the contiguous United States as of the end of March 2024, about the same as last month. About 6% of the contiguous U.S. fell in the severely to extremely wet categories.
- About 19% of the contiguous U.S. fell in the moderate to extreme drought categories (based on the Palmer Drought Index) at the end of March.
- On a broad scale, the 1980s and 1990s were characterized by unusual wetness with short periods of extensive droughts, the 1930s and 1950s were characterized by prolonged periods of extensive droughts with little wetness, and the first two decades of the 2000s saw extensive drought and extensive wetness (moderate to extreme drought graphic, severe to extreme drought graphic).
- A file containing the national monthly percent area severely dry and wet from 1900 to present is available for the severe to extreme and moderate to extreme categories.
- Historical temperature, precipitation, and Palmer drought data from 1895 to present for climate divisions, states, and regions in the contiguous U.S. are available at the Climate Division: Temperature-Precipitation-Drought Data page. These filenames begin with "climdiv".
- According to the weekly U.S. Drought Monitor (USDM), as of April 2, 2024, 18.01% of the contiguous U.S. (CONUS) (15.12% of the U.S. including Alaska, Hawaii, and Puerto Rico) was classified as experiencing moderate to exceptional (D1-D4) drought.
Detailed Drought Overview
The upper-level atmospheric circulation over North America during March 2024 was very active with several short-wave troughs and ridges migrating through the jet stream flow. A cutoff low took up residence over the southwestern CONUS at mid-month, bringing a wetter- and cooler-than-normal week to the Southwest. Cold fronts and low pressure systems associated with Pacific weather systems moving in the upper-level flow brought above-normal monthly precipitation to much of the West. Some of the lows tracked to the north, giving the Upper Midwest and Great Lakes above-normal precipitation for March. Some lows and cold fronts took a more southerly track, tapping Gulf of Mexico and Atlantic moisture to spread above-normal precipitation across the Deep South and along the East Coast. The rain and snow missed some areas, with parts of the West, much of the Great Plains, and most of the Ohio Valley having a drier-than-normal month. Numerous large wildfires developed from the southern Plains to Mid-Atlantic region (wildfire maps for March 21, 28, 31), fueled by low humidity and dry weather and fanned by strong winds. By the end of March, the number of fires for the year to date was below average, but the acreage burned was more than 3 times average at 1.6 million acres.
The long-wave pattern shifted from week to week, with long-wave ridges replacing troughs and vice versa. At times the circulation pattern was highly meridional, while at other times it flattened to more of a zonal flow. When averaged over the month, the upper-level circulation was fairly zonal with a trough over the Southwest and the hint of a ridge over the East Coast. The long-term average pattern consists of a ridge over the West and a trough over the East. March 2024 was a significant departure from the long-term average, with the anomalous western trough and eastern ridge accounting for the monthly temperature pattern consisting of cooler-than-normal temperatures over the West and warmer-than-normal temperatures east of the Rockies.
The above-normal precipitation in the West, Great Lakes, and along the Gulf of Mexico and East Coast, and in parts of the Plains, Mississippi Valley, and Puerto Rico, contracted or reduced the intensity of drought and abnormal dryness compared to the end of February. But dry conditions in parts of the Pacific Northwest and much of the Plains, Ohio Valley, and Hawaii resulted in expansion or intensification of drought and abnormal dryness. Drought contraction exceeded expansion with the USDM-based national moderate-to-exceptional drought footprint across the CONUS decreasing from 21.6% at the end of February to 18.0% at the end of March (from 18.1% to 15.1% for the 50 states and Puerto Rico).
According to the Palmer Drought Index, which goes back to the beginning of the 20th century, about 18.8% of the CONUS was in moderate to extreme drought at the end of March, which is about the same as the end of February (based on revised February values).

Drought conditions at the end of March, as depicted on the April 2, 2024 USDM map, included the following core drought and abnormally dry areas:

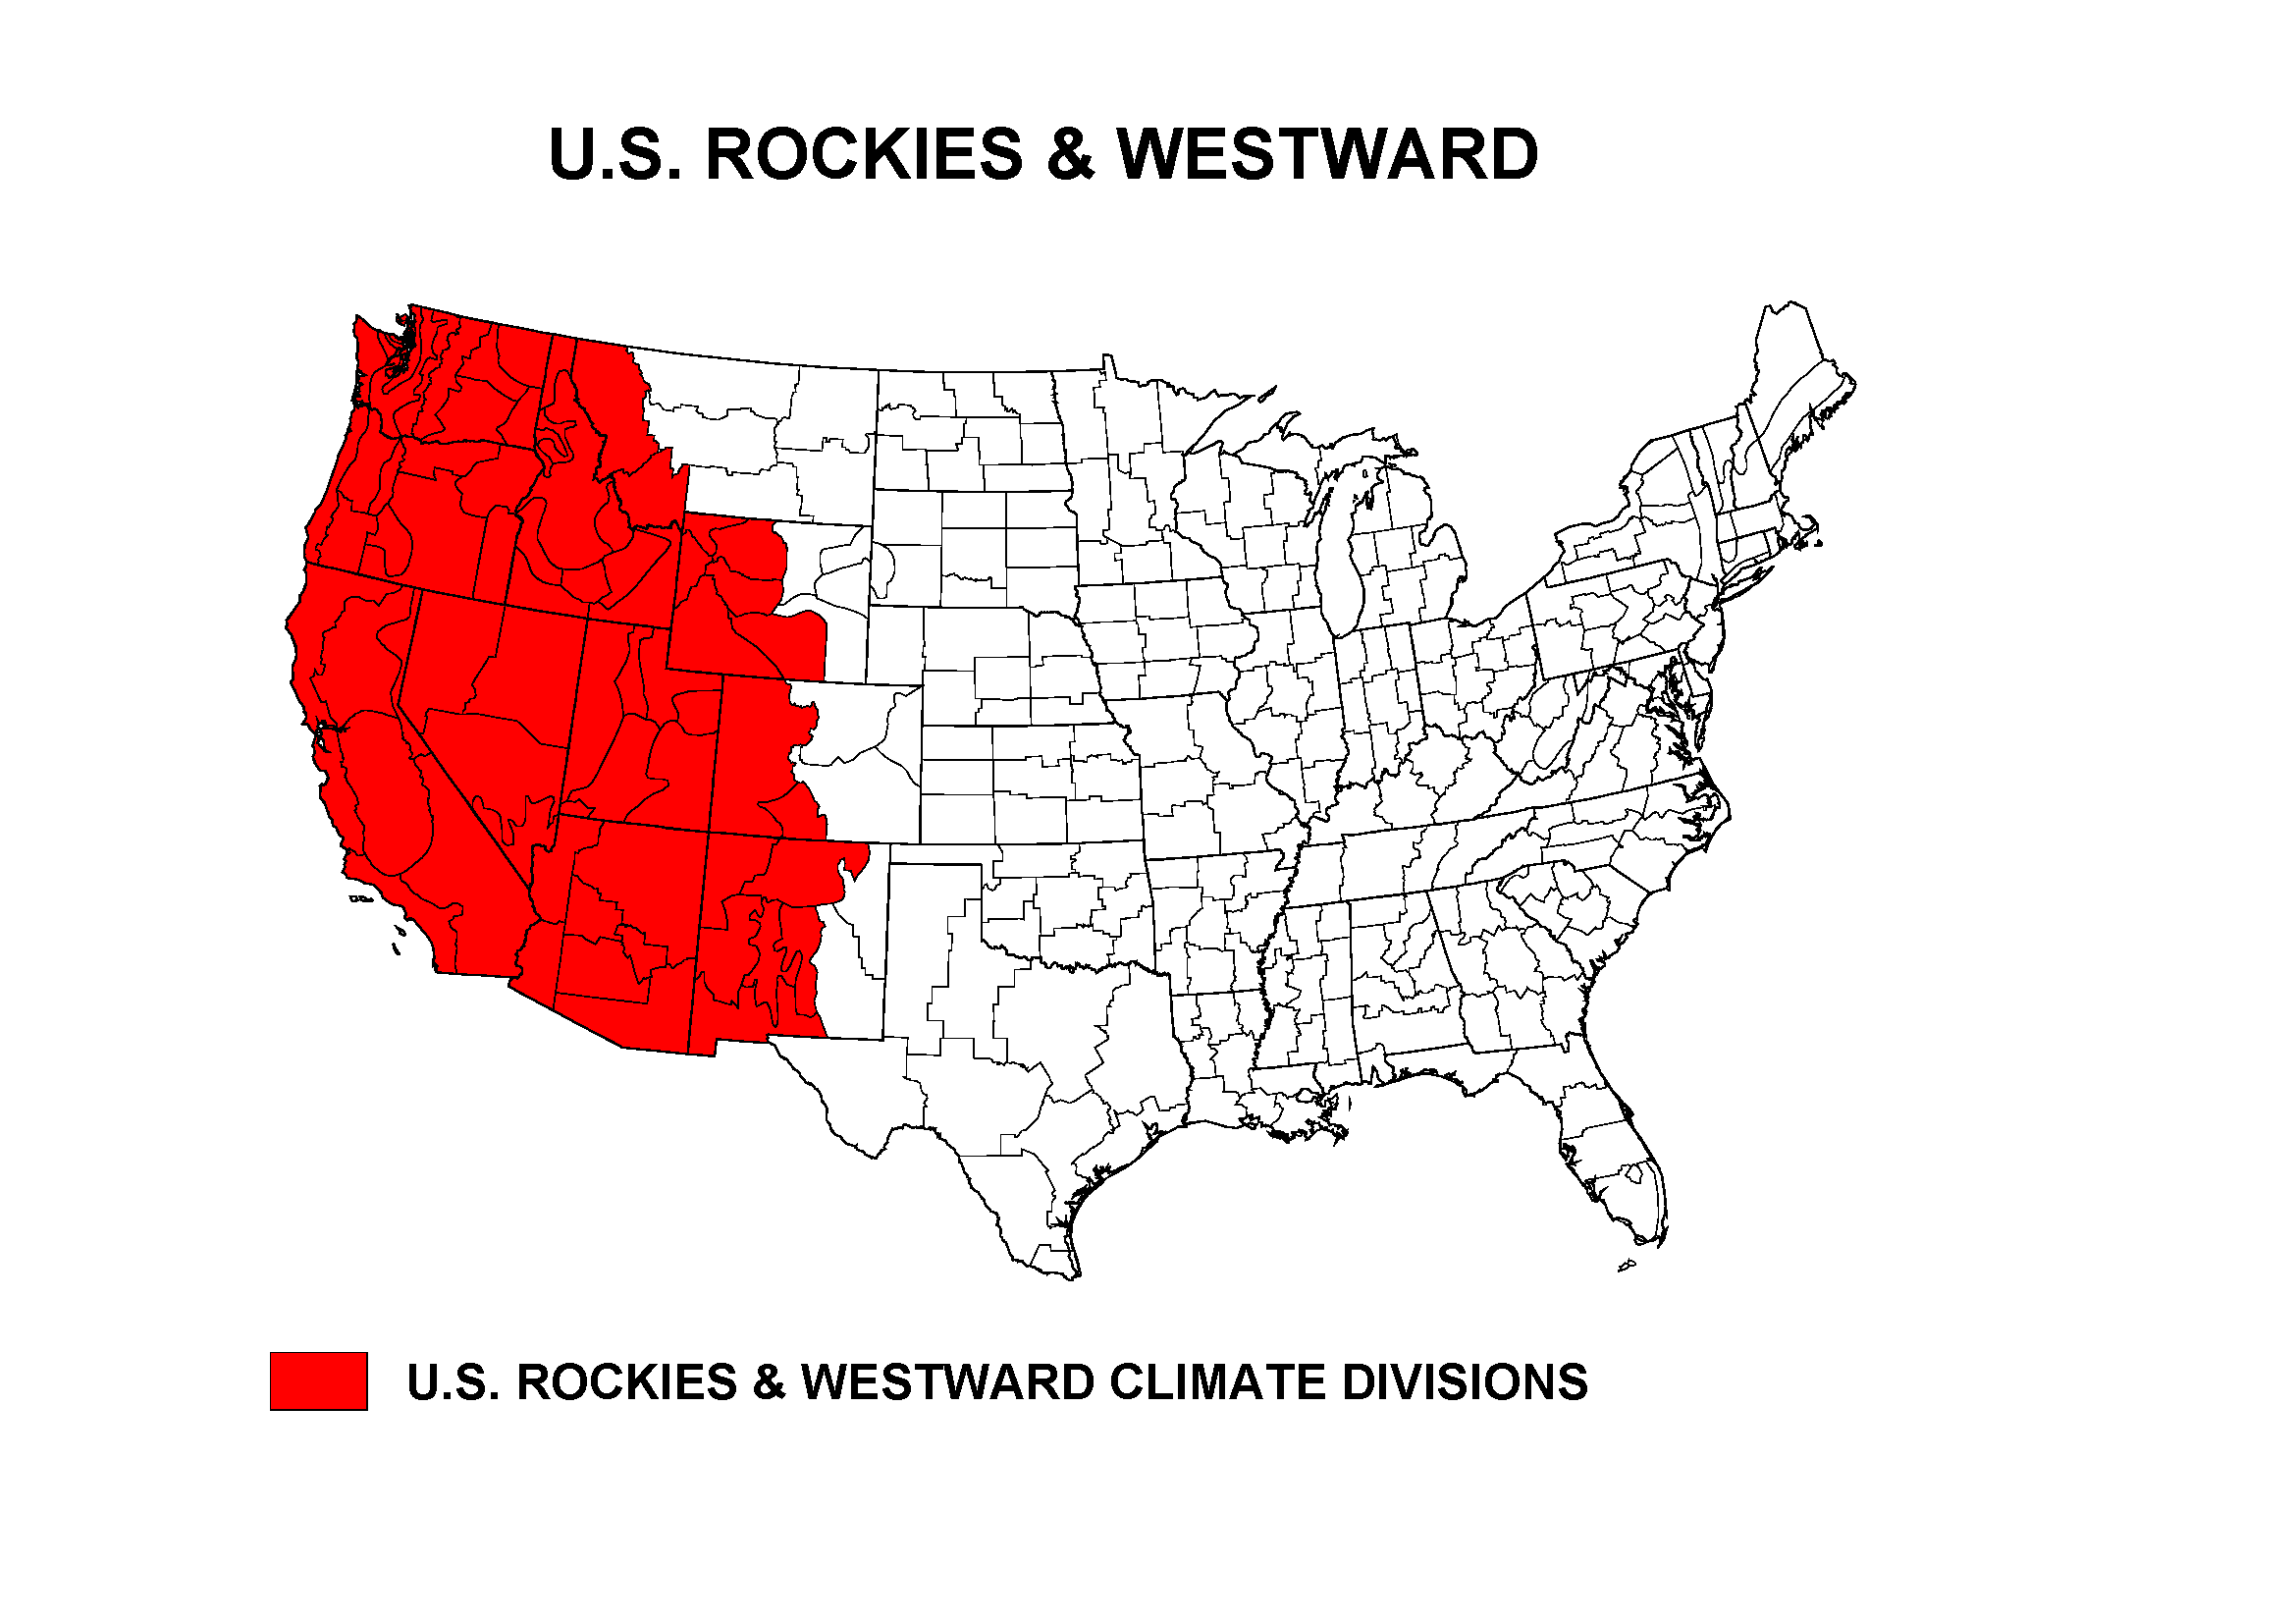
- In the West, moderate (D1) to extreme (D3) drought covers about 20.9% of the Pacific Northwest, which is less than last month, and moderate to exceptional (D4) drought affected about 33.4% of the Southwest (Four Corners states), which is also less than last month. For the West as a whole, the percent area experiencing moderate to exceptional drought, according to USDM statistics, decreased from 27.1% at the end of February to 22.4% at the end of March. Based on the Palmer Drought Index, the drought area across the West as a whole decreased from 16.7% at the end of February to 15.4% at the end of March. Mountain snowpack (based on USDA SNOTEL SWE data) was above normal in southern parts of the West and below normal in northern parts, with near to record low SWE (snow water content) recorded at some northern sites.
- In the Great Plains, moderate to severe (D2) drought covered about 17.7% of the central to northern Plains, which is less than last month, and 31.1% of the southern Plains, which is more than last month. The Lower Mississippi River Valley experienced a continued decrease in the drought area , going from 19.7% in moderate to severe drought at the end of February to 7.8% at the end of March. In Tennessee, the drought area shrank from 27.1% in moderate to severe drought at the end of February to 3.7% in moderate drought at the end of March. Taken together, the southern Plains, Lower Mississippi Valley, and Tennessee (South region) saw moderate to exceptional drought contract from 17.1% at the end of February to 14.8% moderate to extreme drought at the end of March.
- Moderate to extreme drought covered 28.0% of the Midwest, which is a decrease compared to last month.
- Moderate drought covered 0.2% of the Southeast, which is less than last month.
- One patch of moderate drought remained, with the drought area growing slightly to 0.5% of the Northeast.
- Drought expanded in Hawaii, with moderate to severe (D2) drought quadrupling to cover 41.6% of the state but abnormal dryness and drought shrinking to cover 68.0%.
- Moderate drought shrank to cover 8.3% of Puerto Rico, while, in the U.S. Virgin Islands, moderate drought improved to abnormal dryness on St. Thomas, and St. Croix and St. John remained free of drought and abnormal dryness.
- In the U.S.-Affiliated Pacific Islands (USAPI), 4 stations were abnormally dry, 4 were experiencing moderate drought, 4 were experiencing severe drought, and 2 had extreme drought conditions. This compares to 6 abnormally dry, 3 with moderate drought, and 6 with severe drought at the end of February.
Palmer Drought Index
The Palmer drought indices measure the balance between moisture demand (evapotranspiration driven by temperature) and moisture supply (precipitation). The Palmer Z Index depicts moisture conditions for the current month, while the Palmer Hydrological Drought Index (PHDI) and Palmer Drought Severity Index (PDSI) depict the current month's cumulative moisture conditions integrated over the last several months.

While both the PDSI and PHDI indices show long-term moisture conditions, the PDSI depicts meteorological drought while the PHDI depicts hydrological drought. The PDSI map may show less severe and extensive drought (as well as wet spell conditions) in some parts of the country than the PHDI map because the meteorological conditions that produce drought and wet spell conditions are not as long-lasting as the hydrological impacts.

Used together, the Palmer Z Index and PHDI maps show that short-term drought occurred in the Ohio and Tennessee Valleys, central Appalachians, and parts of the Pacific Northwest, central to southern Plains, Mississippi Valley, and Great Lakes, expanding or intensifying long-term drought (PHDI maps for March compared to February). Short-term wet conditions occurred across much of the West and Northeast, and in parts of the Great Lakes and Deep South, contracting or reducing the intensity of long-term drought and expanding or intensifying long-term wet conditions.
Standardized Precipitation Index
The Standardized Precipitation Index (SPI) measures moisture supply. The SPI maps here show the spatial extent of anomalously wet and dry areas at time scales ranging from 1 month to 24 months.


The SPI maps illustrate how moisture conditions have varied considerably through time and space over the last two years. Dryness is evident in parts of the Ohio Valley at 1- to 9-month time scales, with an interlude of no dryness at 3 months, but is widespread at 12 months and still present at 24 months. Much of the Tennessee Valley is dry at 6 to 12 months with dryness covering part of the valley at the 24-month time scale. Much of the Mississippi Valley is dry at 12 months, but only parts are dry at the other time scales. Parts of the Plains are dry at all time scales, with the most severe and widespread dryness at the 12- and 24-month time scales. The eastern Great Lakes are dry at 2 months. Parts of the Pacific Northwest show dry conditions at all time scales except 3 months. Much of the Southwest (Four Corners states including the Rio Grande Valley) is dry at 9 and 12 months, with part dry at 24 months. The eastern Carolinas and Gulf of Mexico coast have some dryness at 24 months. Wet conditions are evident in the West and Northeast at all time scales; across various parts of the Plains at all time scales; across parts of the Great Lakes at 1 and 3 to 9 months; and across much of the Southeast at 1- and 3-month time scales and parts of the Southeast at the other time scales.


Standardized Precipitation Evapotranspiration Index
The SPI measures water supply (precipitation), while the SPEI (Standardized Precipitation Evapotranspiration Index) measures the combination of water supply (precipitation) and water demand (evapotranspiration as computed from temperature). Warmer temperatures tend to increase evapotranspiration, which generally makes droughts more intense.


For the Northern Hemisphere, March is the beginning of climatological spring, which is the season when days get longer, sun angle increases, and temperatures and evapotranspiration increase. During March 2024, temperatures were warmer than normal across much of the CONUS east of the Rockies, especially in the Midwest to Northeast. Evapotranspiration was unusually high due to the anomalously warm temperatures and low humidity. The unusually high temperatures/evapotranspiration combined with low precipitation to produce SPEI values that were a little extreme than the corresponding SPI values in the Ohio Valley in March, and much more extreme during February-March. On the other hand, near-normal to cooler-than-normal temperatures in the South Dakota Black Hills and environs combined with drier-than-normal conditions to lessen the intensity of the SPEI there so that it was less than the corresponding SPI. At longer time scales, the hot conditions in the Southwest to Lower Mississippi Valley in 2023 contributed to more extreme SPEI values there than SPI values at the 9- to 12-month time scales (SPEI maps for the last 1, 2, 3, 5, 6, 9, 12 months) (SPI maps for the last 1, 2, 3, 5, 6, 9, 12 months).


The last 1 to 6 years have been unusually warm across much of the CONUS, especially in the South and West, but also in the Northeast (state temperature rank maps for the last 1, 2, 3, 4, 5 years). The last 1 to 2 years have been extremely dry in the southern Plains to Upper Mississippi Valley; the last 3 to 4 years have been quite dry in the West to Great Plains; and the last 5 years have been unusually dry across much of the West and southern Plains (state precipitation rank maps for the last 1, 2, 3, 4, 5 years). In the last 1 to 6 years, the SPEI is more extreme than the SPI in the Pacific Northwest but especially in the Southwest to Lower Mississippi Valley. In the western U.S., where drought has dominated for much of the last 20 years, the combination of excessive heat and dryness has resulted in more extreme SPEI values than SPI values in parts of the West for the last 2 to 6 years (SPEI maps for last 18, 24, 36, 48, 60, 72 months) (SPI maps for last 18, 24, 36, 48, 60, 72 months).


The 24-month SPEI for Louisiana is more extreme than the corresponding SPI, ranking second driest compared to the SPI which is only in the top 10 driest category.
Regional Discussion
Upper Mississippi River Basin


The Upper Mississippi River Basin was very dry during spring to fall last year. Above-normal precipitation during December 2023 and January and March 2024 helped lessen precipitation deficits. March 2024 ranked as the 53rd wettest March in the 1895-2024 record, basinwide. In spite of the recent wetness, the last 12 months were still the 13th driest April-March, as well as the warmest April-March on record. According to the USDM, 36.6% of the basin was in moderate to extreme drought at the end of March, which is less than the 54.3% at the end of February. Based on the Palmer Drought Index, 51.1% of the basin was in moderate to extreme drought at the end of March, which is less than the end of February. This is less than the peak last year of 78.0% and much less than the peak of 100% which occurred in the 1970s and several times in the 1930s.
Rio Grande River Basin


During October 2023-March 2024, parts of the Rio Grande River Basin were wetter than normal, parts drier than normal, and parts near normal. But very dry and hot conditions of summer and early fall last year created significant precipitation deficits and expanded drought. Basinwide, March 2024 ranked as the 60th wettest March on record. The last 12 months ranked as the 21st driest April-March, but also the second warmest. According to the USDM, 77.1% of the basin was in moderate to exceptional drought at the end of March, which is less than the 85.2% at the end of February. Based on the Palmer Drought Index, 66.7% of the basin was in moderate to extreme drought at the end of March, which is less than the end of February and less than the peak of 100% that occurred just last year and many times in the last 30 years, 1950s, and early 1900s.
Missouri River Basin


The Missouri River Basin has experienced extremes in precipitation during the last several years, with large areas wet some months and large areas dry other months, and parts wet and parts dry at the same time during yet other months. The last 2 decades have generally been warmer than normal. The last 4 years have, until recently, been a period of extensive drought. According to the USDM, 22.9% of the basin was in moderate to exceptional drought at the end of March 2024, which is less than the 25.3% at the end of February. But only 2 years ago, the moderate to exceptional drought area peaked at 78.5% on November 1, 2022 and 79.0% on March 15, 2022. Based on the Palmer Drought Index, 12.9% of the basin was in moderate to extreme drought at the end of March, which is more than the end of February. In 2022, the drought area peaked at 76.1% at the end of September, but it reached 100% ten years earlier and in the 1930s.
Hawaii


March 2024 was drier than normal across most of the Hawaiian Islands, except for the windward stations on the Big Island. The last 1 to 9 months were dominated by drier-than-normal conditions, with a mixed precipitation anomaly pattern evident at the 12-month time scale (precipitation anomaly maps for the last 1, 2, 3, 4, 6, 9, 12 months) (climate engine model percent of normal precipitation map for the last month).
Monthly streamflow was near normal across most of the main islands with some below-normal stream levels. Based on satellite analyses (stressed vegetation, drought stress, VHI), vegetation was stressed on parts of the Big Island, Molokai, and Maui.
Severe drought developed in Hawaii during March, with the drought area increasing from 10.3% at the end of February to about 41.6% of the state on the April 2, 2024 USDM map.
Alaska


March 2024 was drier than normal across parts of the Alaska panhandle and eastern interior to south coastal regions, and a few stations to the north. This pattern extended over the last 2 to 3 months, with dryness limited to the central to south coastal areas at the 4-month time scale. At 6 months, dry conditions extended to the northwest coast and along the Aleutian chain. Drier-than-normal conditions shifted back to the Cook Inlet to eastern interior areas, and remained far out along the Aleutian chain, at 9- to 12-month time scales (low elevation station precipitation anomaly maps for the last 1, 2, 3, 4, 6, 9, 12 months) (high elevation SNOTEL station precipitation percentile maps for the last 1 and 6 months) (SNOTEL basin and station percent of normal precipitation maps for the last 1 and 6 months) (climate division precipitation rank maps for the last 1, 3, 6, and 12 months) (climate engine model percent of normal precipitation map for the last month) (Leaky Bucket model precipitation percentile map).
March and February-March temperatures were near to warmer than normal across most of the state. The January-March anomaly pattern was warmer than normal in the west and north, near to cooler than normal in the eastern interior area, with a mixed anomaly pattern from the south central coastal area to panhandle; the December-March pattern similar except warmer than normal across the panhandle. At the 6- to 12-month time scales, it was warmer than normal across most of the state, but the Cook Inlet to Bristol Bay and Northwest Gulf regions had near-average temperatures when compared to the long-term (1925-2024) average. When compared to more recent (1991-2020) normals, cooler-than-normal temperatures were evident in the southwest third of the state with warmer-than-average temperatures to the east and north because of a pronounced warming trend in recent decades (low elevation station temperature anomaly maps for the last 1, 2, 3, 4, 12 months) (climate division temperature rank maps for the last 1, 3, 6, and 12 months) (gridded temperature percentile maps for the last 1 and 3 months) (Leaky Bucket model temperature percentile map).
Monthly streamflow was mostly near to above normal for those streams that aren't frozen. Snow covered the state, with snow water content (SWE) near to above normal in most of the state but below normal in the panhandle and northwest basins. Satellite observations of vegetative health (stressed vegetation, drought stress, VHI) revealed areas of stressed vegetation. Satellite-based or modeled observations of groundwater and soil moisture (GRACE root zone and GRACE surface soil moisture; SPoRT estimates of soil moisture at four depths [0-10 cm, 10-40 cm, 40-100 cm, 100-200 cm]; Leaky Bucket modeled soil moisture) suggested some dryness was occurring in parts of the south and northeast, but the ground is mostly frozen; a more accurate determination will be made once the ground thaws.
Alaska continued free of drought or abnormal dryness on the April 2, 2024 USDM map.
Puerto Rico and U.S. Virgin Islands


March 2024 was drier than normal across the U.S. Virgin Islands (USVI) with a mixed precipitation anomaly pattern across Puerto Rico (PR). Wetter-than-normal conditions dominated the 2- to 3-month time periods. The last 4 to 12 months were drier than normal for the USVI. Dryness over eastern and northwestern PR at 3 months expanded to cover much of the island at 6 months, with the northern two-thirds of PR dry and the southern coast wet at 12 months (radar-based precipitation anomaly estimates for the last 1, 2, 3, 6, and 12 months) (low elevation station precipitation anomaly maps for the last 1, 3, 4, 6, 12 months) (climate engine model percent of normal precipitation map for the last month: PR and USVI, Caribbean and Gulf of Mexico region).
Temperatures were generally warmer than normal for the last 1 to 12 months (low elevation station temperature departure maps for the last 1, 2, 3, 4, 12 months). Root zone analysis indicated that soil conditions were dry across the western and southern coasts of PR, with dryness more evident in the top soil layers compared to deeper soil layers (root zone soil saturation fraction, SPoRT estimates of soil moisture at four depths [0-10 cm, 10-40 cm, 40-100 cm, 100-200 cm]). Satellite observations of vegetative health (stressed vegetation for PR and USVI, drought stress for PR and USVI, VHI for PR and USVI) revealed areas of stressed vegetation in eastern PR. Monthly streamflow on PR showed mostly near-normal stream levels with some below-normal stream levels in the south and east. In the USVI, groundwater levels declined the first half of March then leveled off at St. Croix and St. Thomas, but steadily declined throughout the month at St. John. The end-of-March groundwater level continued well in the bottom third of the recent historical record at St. Croix, but was in the upper third at St. John and St. Thomas.
In the USVI, moderate drought improved to abnormal dryness on St. Thomas, while St. Croix and St. John continued free of drought and abnormal dryness. On PR, moderate drought contracted to cover about 8.3% of the territory on the April 2, 2024 USDM map, compared to 40.7% at the end of February.
CONUS State Precipitation Ranks


Parts of the CONUS have had very dry conditions at various times during the past 6 months, but the location of the dryness varied from month to month and some of the dry areas had wetter-than-normal conditions during intermittent months (low elevation station precipitation anomaly maps for the last 1, 3, 6, and 12 months) (climate division precipitation rank maps for the last 1, 3, 6, and 12 months). Persistently dry areas include parts of the Plains, Midwest, Pacific Northwest, and Southwest. Those states that were dry experienced enough precipitation over other parts of the state to balance out the dryness. So, 5 states ranked in the driest third of the 1895-2024 record for March, 3 states were in the driest third of the historical record for January-March, and 5 states were in the driest third for October-March, but none ranked in the top 10 driest category.


The last 12 months (April 2023-March 2024) were drier than normal across the Mississippi, Ohio, Tennessee, and Rio Grande valleys, most of the Southwest (Four Corners States), and parts of the Pacific Northwest, Plains, and Gulf of Mexico coast. Fourteen states had a precipitation rank in the driest third of the historical record for April-March. None ranked in the top ten driest category, but 2 came close — Missouri (11th driest) and Iowa (13th driest).
Agricultural Belts


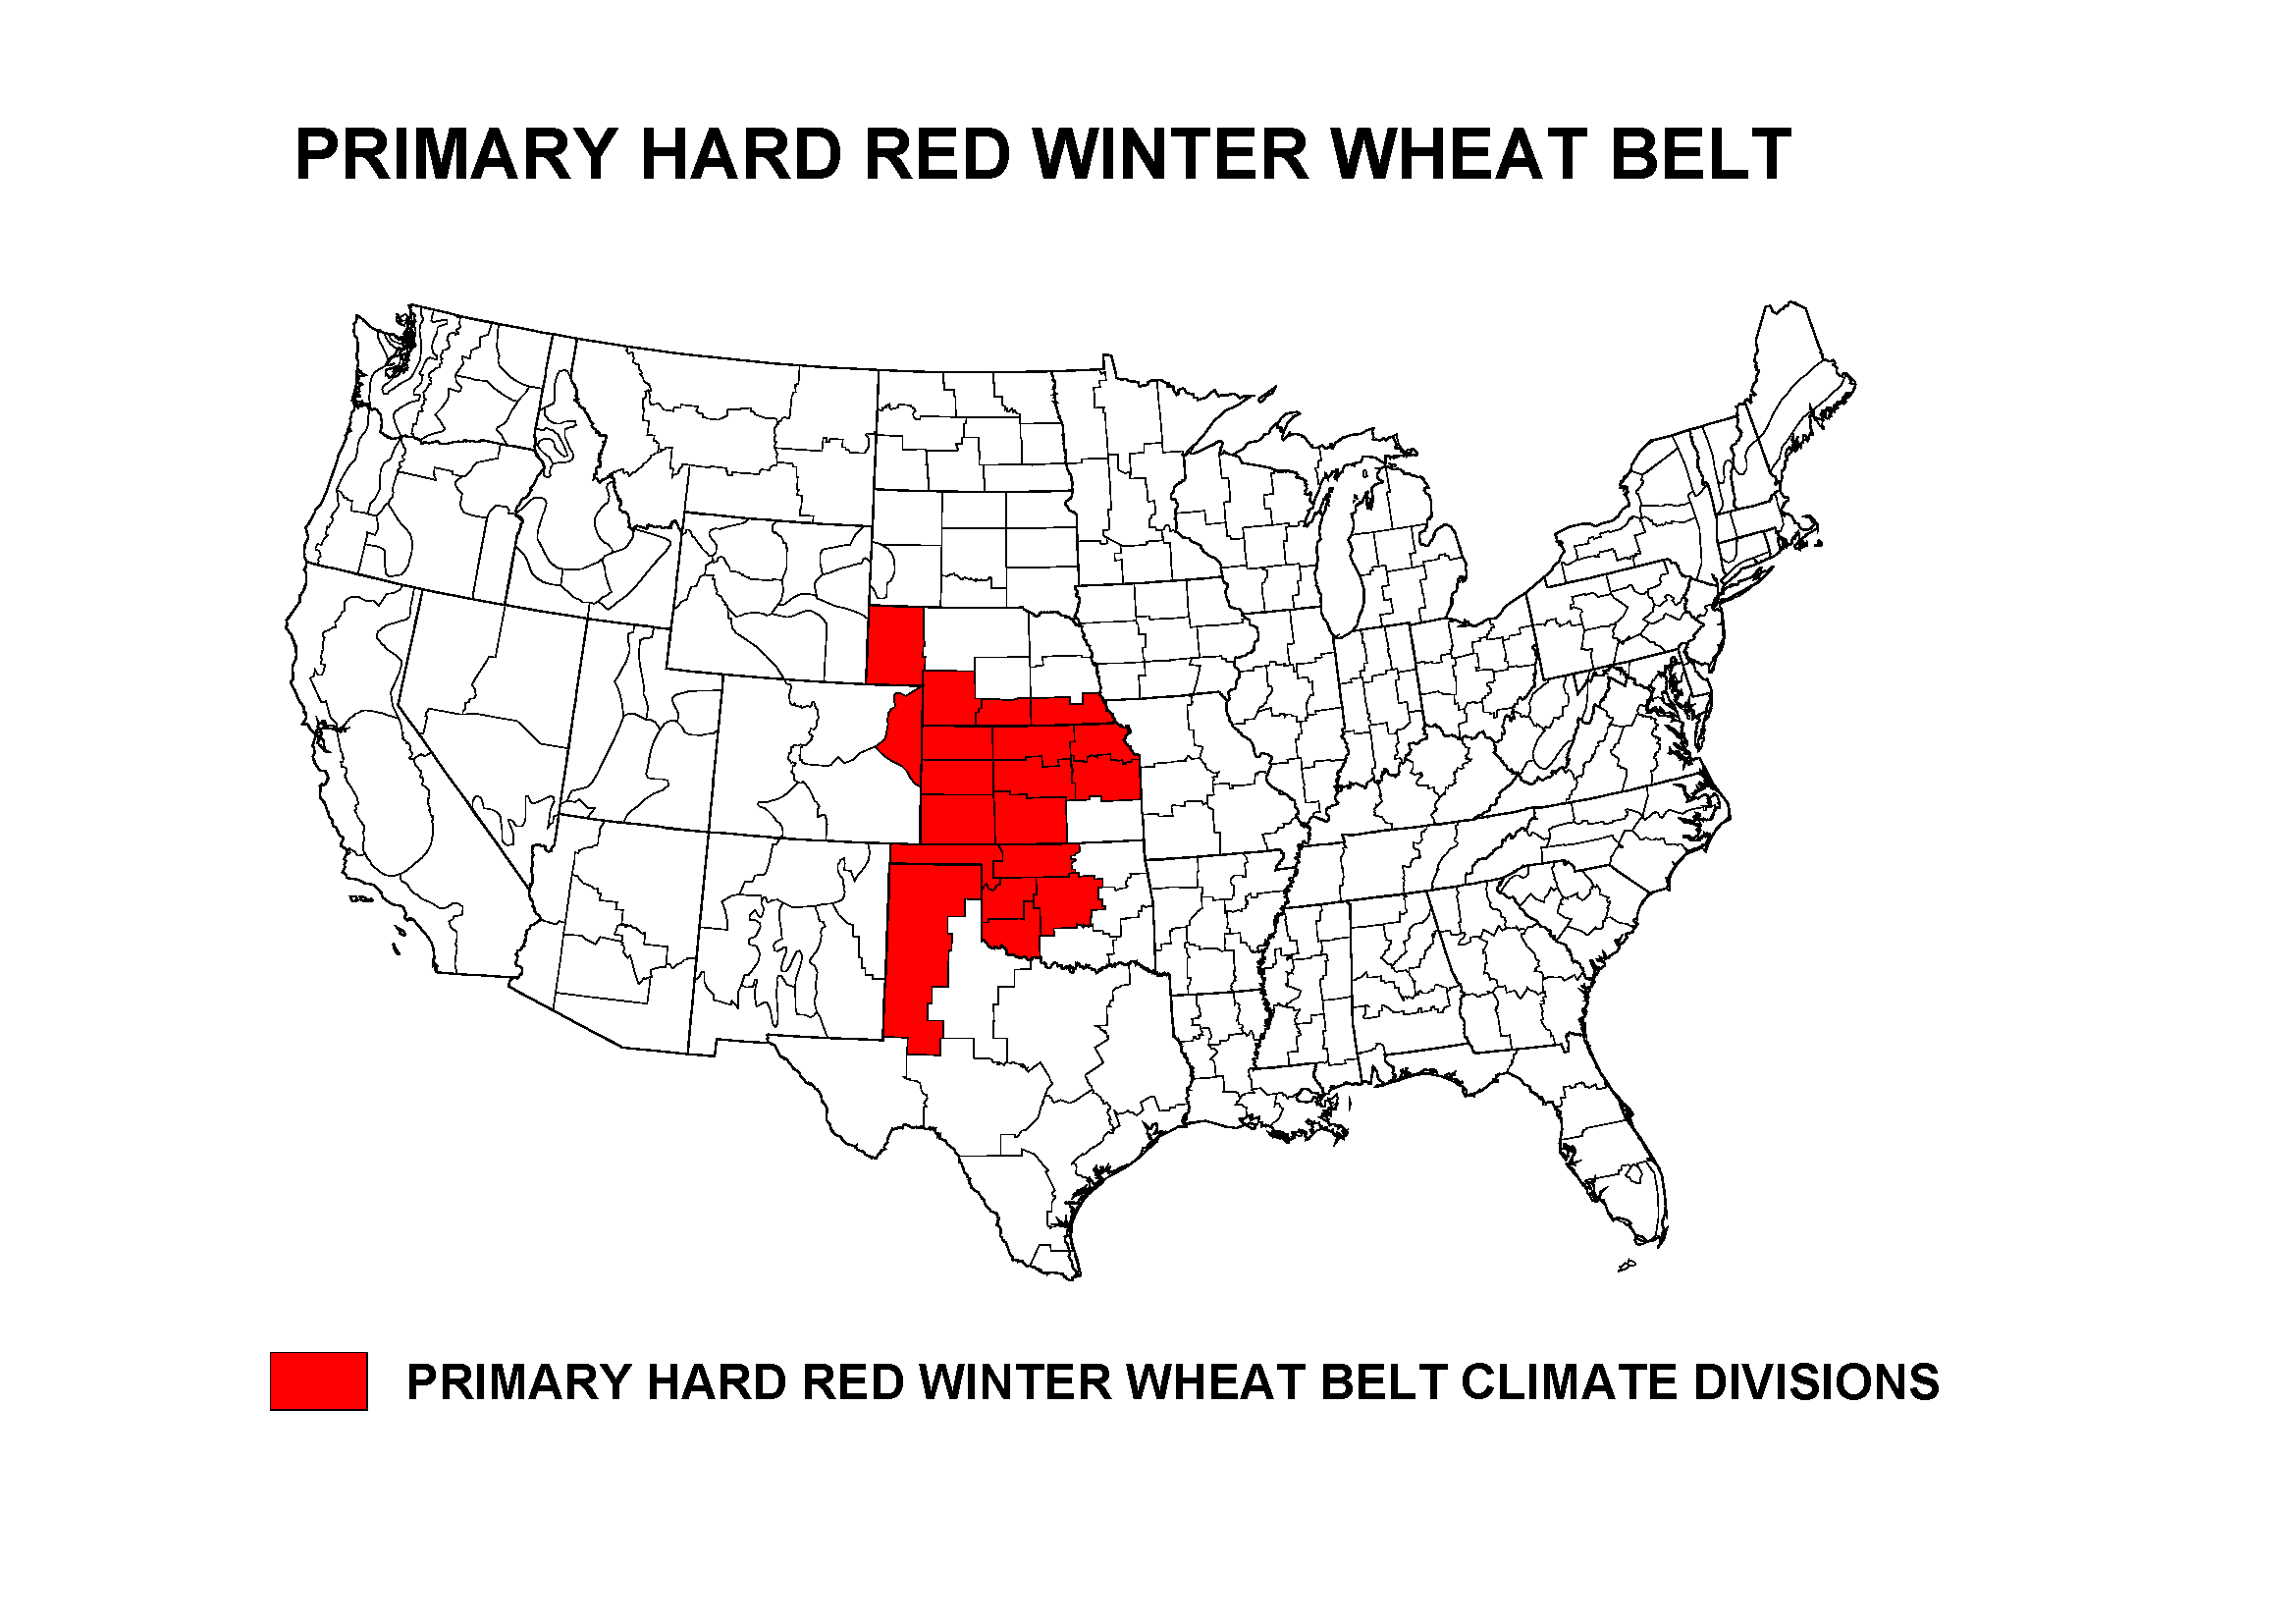
During March 2024, the Primary Hard Red Winter Wheat agricultural belt was near to warmer than normal and mostly drier than normal. The month ranked as the 35th driest and 25th warmest March, regionwide, in the 1895-2024 record.
October marks the beginning of the growing season for the Primary Hard Red Winter Wheat belt. October 2023-March 2024 was mostly warmer than normal with a mixed precipitation anomaly pattern. The period ranked as the 48th wettest and sixth warmest October-March, regionwide, on record.


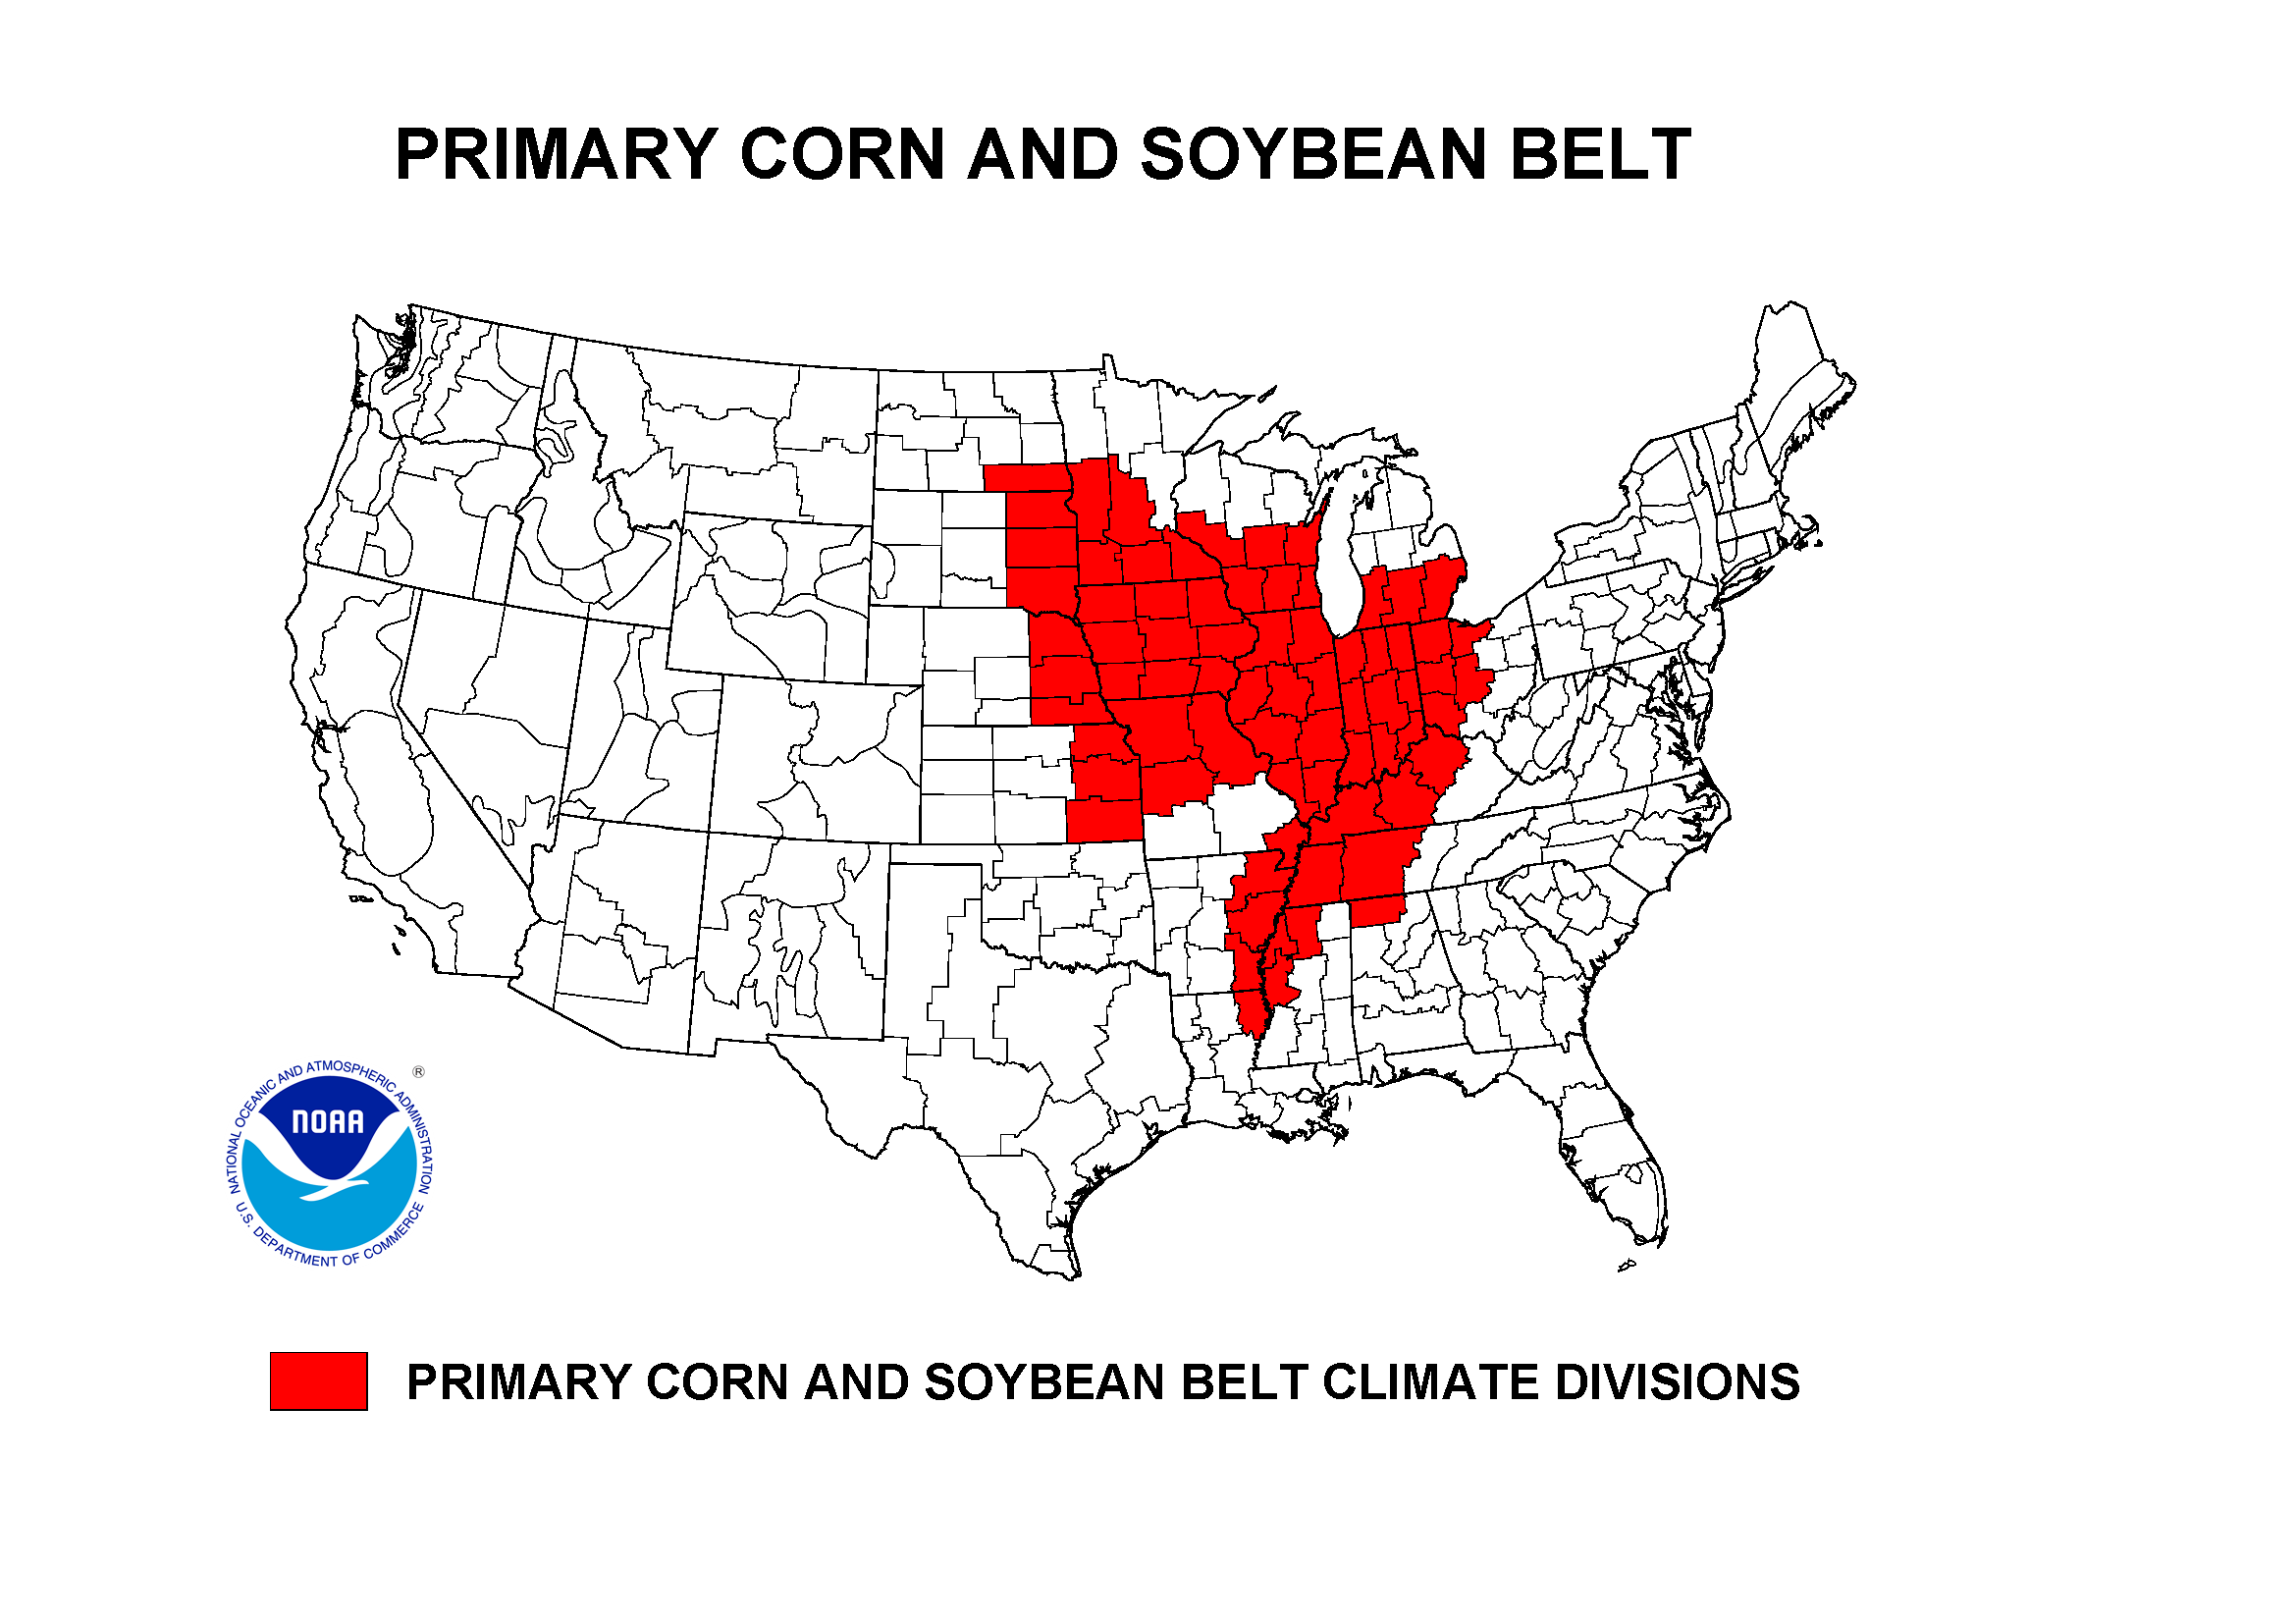
March also marks the beginning of the growing season for the Primary Corn and Soybean agricultural belt. March 2024 was mostly warmer than normal, but had a mixed precipitation anomaly pattern. The month ranked as the 14th warmest and 51st driest March, regionwide, in the 1895-2024 record.
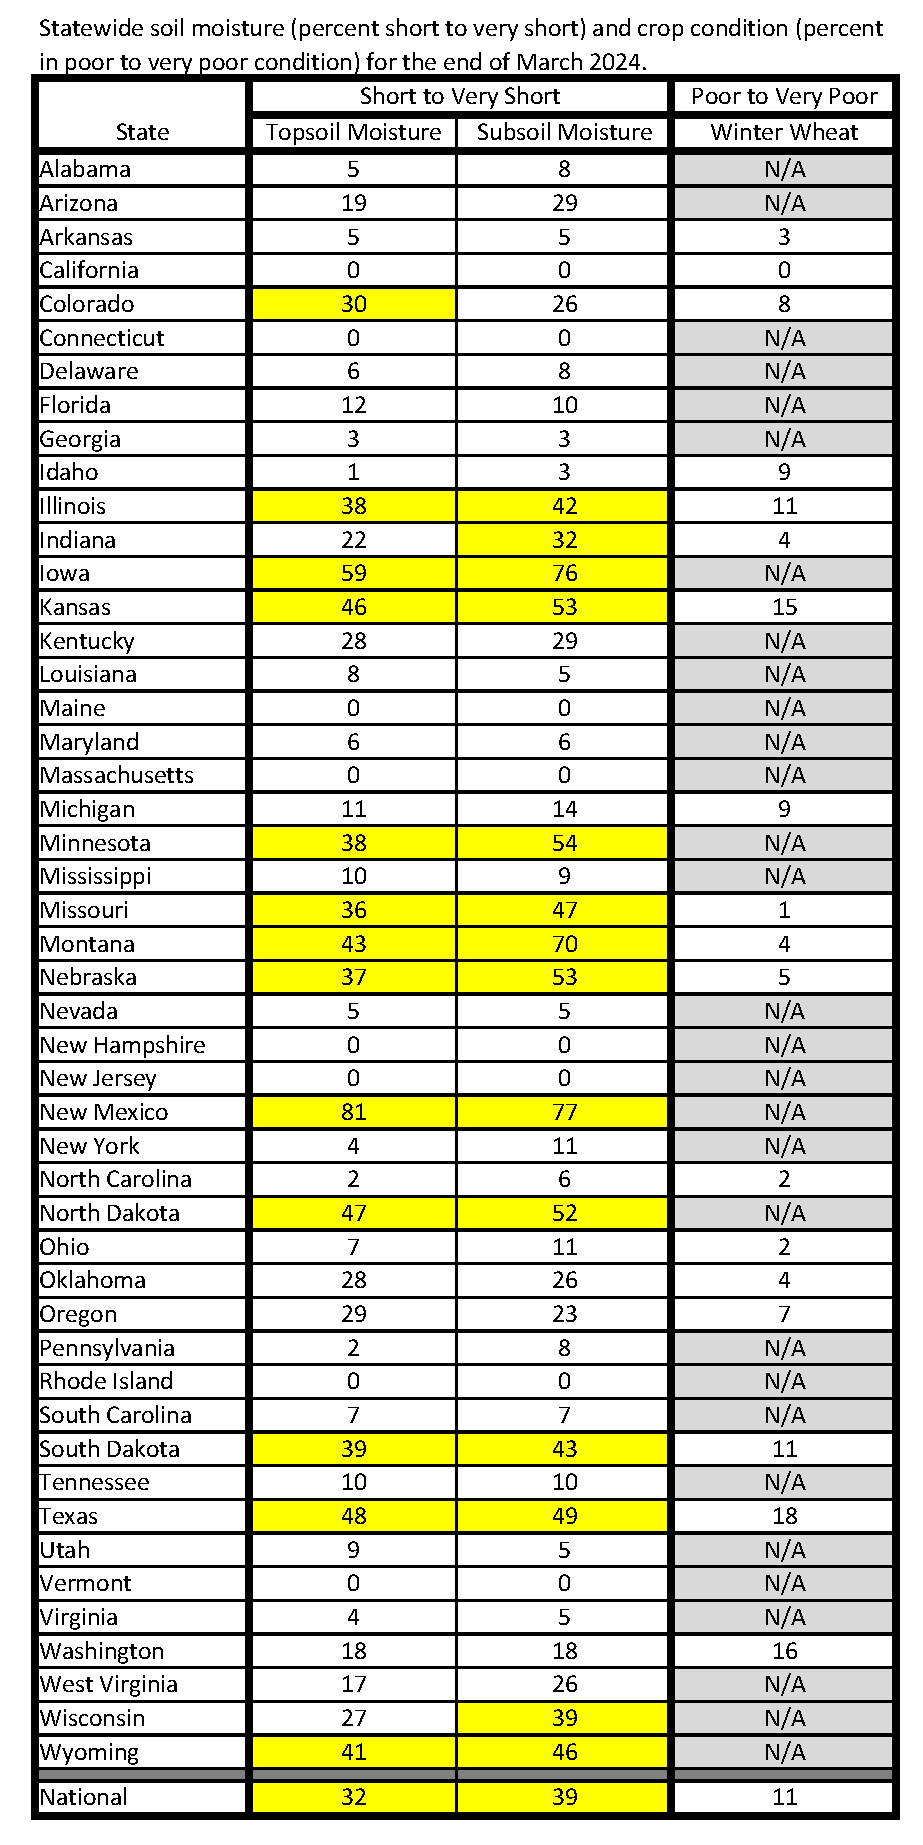
According to the U.S. Department of Agriculture (USDA), as of April 2, 2024, drought affected approximately 21% of barley production, 24% of corn production, 8% of cotton production, 14% of sorghum production, 22% of soybean production, 25% of spring wheat production, 18% of winter wheat production, 14% of hay acreage, 13% of the cattle inventory, 11% of the milk cow inventory, and 17% of the sheep inventory.
Based on March 31 USDA statistics, 11% of the nation's winter wheat crop was in poor to very poor condition, and 32% of the nation's topsoil and 39% of the subsoil were short or very short of moisture (dry or very dry). The table below lists the end-of-March soil moisture and winter wheat condition by state, with those states having 30 percent or more of topsoil or subsoil moisture short or very short, or 30 percent or more of the crop in poor or very poor condition, highlighted in yellow:
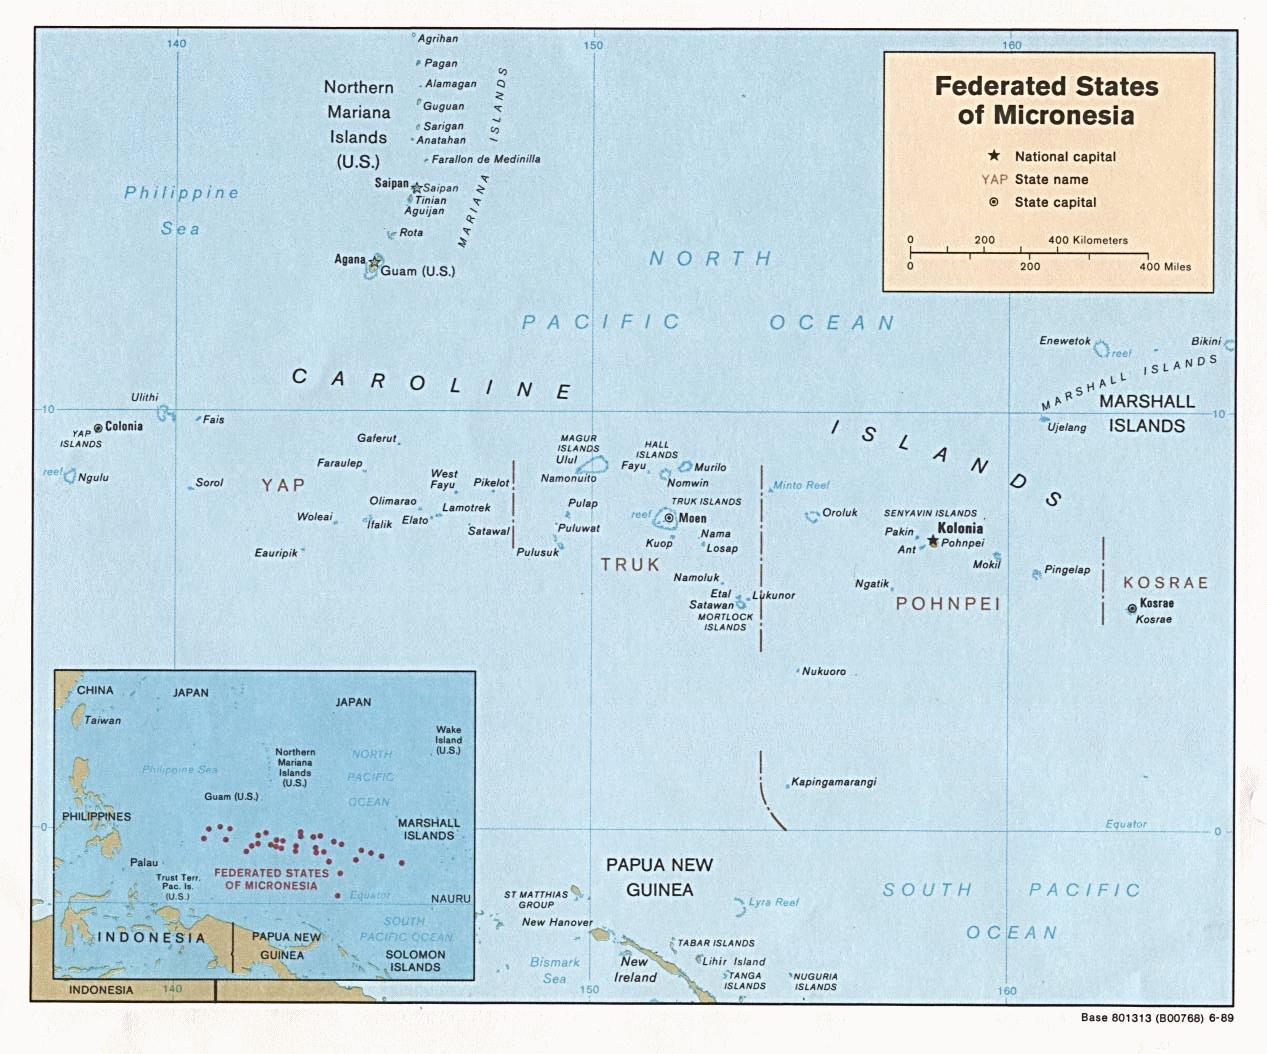
U.S.-Affiliated Pacific Islands
The NOAA National Weather Service (NWS) offices, the Pacific ENSO Applications Climate Center (PEAC), and partners provided reports on conditions across the Pacific Islands.
In the U.S. Affiliated Pacific Islands (USAPI) (maps — Federated States of Micronesia [FSM], Northern Mariana Islands, Marshall Islands [RMI], Republic of Palau [ROP], American Samoa, basinwide), March 2024 was drier than normal in the Marianas, Republic of Palau, most of the FSM, and part of the Marshalls, but near to wetter than normal in American Samoa, the southern FSM, and part of the Marshalls.
Monthly precipitation amounts were below the monthly minimum needed to meet most water needs (4 inches in the Marianas and Pago Pago, and 8 inches elsewhere) in the Marianas, Marshalls, Palau, and western to central FSM. March precipitation was above the monthly minimums in American Samoa, and in the southern to eastern FSM. The 4- and 8-inch thresholds are important because, if monthly precipitation falls below the threshold, then water shortages or drought become a concern.
The tropical Pacific climatology can experience extremes in precipitation, from very low precipitation during the dry season to very high precipitation during the wet season. This can result in monthly normal precipitation values that are different from the monthly minimum needed to meet most water needs, and this can lead to percent of normal values that seem odd. This was the case during March 2024, which was in the wet season for American Samoa, Kapingamarangi, and Kosrae, and in the dry season for most of the Micronesia region. Precipitation was below the monthly minimum but above normal (1981-2010 normal), because the normals are low, at:
- Kwajalein: March 2024 precipitation 4.61 inches, March normal mean 3.56 inches, March normal median 2.35 inches.
Precipitation was above the monthly minimum but below normal (1981-2010 normal), because the normals are high, at:
- Pohnpei: March precipitation 12.02 inches, March normal mean 14.13 inches, March normal median 13.17 inches.
- Kosrae: March precipitation 15.34 inches, March normal mean 15.78 inches, March normal median 16.06 inches.
- Nukuoro: March precipitation 12.49 inches, March normal mean 15.60 inches.
- Pingelap: March precipitation 9.95 inches, March normal mean 12.50 inches.
- Pago Pago: March precipitation 7.61 inches, March normal mean 11.66 inches, March normal median 10.68 inches.
In the table below, the station identified as Koror is Palau International Airport (Airai).
| Station Name | Apr 2023 | May 2023 | Jun 2023 | Jul 2023 | Aug 2023 | Sep 2023 | Oct 2023 | Nov 2023 | Dec 2023 | Jan 2024 | Feb 2024 | Mar 2024 | Apr- Mar |
|---|---|---|---|---|---|---|---|---|---|---|---|---|---|
| Chuuk | 137% | 191% | 118% | 130% | 118% | 112% | 110% | 141% | 100% | 100% | 76% | 40% | 113% |
| Guam NAS | 198% | 916% | 146% | 86% | 132% | 98% | 152% | 84% | 107% | 59% | 62% | 78% | 122% |
| Kapingamarangi | 141% | 137% | 145% | 162% | 121% | 256% | 117% | 153% | 74% | 188% | 206% | 196% | 140% |
| Koror | 77% | 165% | 77% | 145% | 125% | 130% | 108% | 85% | 67% | 136% | 140% | 48% | 103% |
| Kosrae | 120% | 87% | 166% | 132% | 104% | 123% | 153% | 163% | 44% | 90% | 119% | 96% | 96% |
| Kwajalein | 188% | 345% | 143% | 45% | 81% | 61% | 103% | 156% | 111% | 53% | 52% | 196% | 117% |
| Lukonor | 77% | 61% | 116% | 75% | 74% | 115% | 136% | 81% | 94% | 64% | 76% | 153% | 81% |
| Majuro | 151% | 102% | 105% | 70% | 95% | 56% | 86% | 101% | 70% | 57% | 74% | 16% | 83% |
| Pago Pago | 152% | 168% | 109% | 102% | 42% | 156% | 91% | 36% | 195% | 142% | 201% | 71% | 113% |
| Pohnpei | 141% | 145% | 121% | 148% | 219% | 156% | 83% | 178% | 48% | 50% | 170% | 91% | 125% |
| Saipan | 192% | 225% | 92% | 46% | 142% | 109% | 92% | 133% | 158% | 74% | 79% | 83% | 109% |
| Yap | 104% | 131% | 121% | 168% | 145% | 70% | 88% | 79% | 41% | 90% | 55% | 14% | 98% |
| Station Name | Apr 2023 | May 2023 | Jun 2023 | Jul 2023 | Aug 2023 | Sep 2023 | Oct 2023 | Nov 2023 | Dec 2023 | Jan 2024 | Feb 2024 | Mar 2024 | Apr- Mar |
|---|---|---|---|---|---|---|---|---|---|---|---|---|---|
| Chuuk | 17.14" | 21.57" | 13.73" | 15.56" | 15.23" | 13.07" | 12.70" | 14.93" | 11.22" | 10.05" | 5.49" | 3.30" | 153.99" |
| Guam NAS | 5.01" | 31.15" | 9.00" | 8.69" | 19.47" | 12.46" | 17.40" | 6.18" | 5.49" | 2.38" | 1.88" | 1.62" | 120.73" |
| Kapingamarangi | 19.19" | 16.59" | 20.04" | 22.86" | 9.87" | 25.45" | 9.55" | 14.14" | 7.33" | 17.18" | 19.05" | 22.43" | 203.68" |
| Koror | 5.60" | 19.53" | 13.44" | 26.81" | 16.86" | 15.26" | 12.80" | 9.65" | 7.46" | 13.85" | 11.97" | 3.56" | 156.79" |
| Kosrae | 21.08" | 15.41" | 24.30" | 19.67" | 14.72" | 17.52" | 16.79" | 22.60" | 7.06" | 15.04" | 15.43" | 15.34" | 204.96" |
| Kwajalein | 9.87" | 23.18" | 9.93" | 4.45" | 7.86" | 6.60" | 11.46" | 17.65" | 7.42" | 1.66" | 1.37" | 4.61" | 106.06" |
| Lukonor | 8.68" | 7.13" | 13.55" | 11.89" | 10.33" | 11.63" | 15.43" | 7.40" | 10.54" | 5.42" | 6.83" | 14.20" | 123.03" |
| Majuro | 14.23" | 10.35" | 11.56" | 7.87" | 11.07" | 6.27" | 10.98" | 13.51" | 7.96" | 4.38" | 5.11" | 1.08" | 104.37" |
| Pago Pago | 14.25" | 16.19" | 5.81" | 5.64" | 2.26" | 10.18" | 8.45" | 3.69" | 25.00" | 18.99" | 24.09" | 7.61" | 142.16" |
| Pohnpei | 25.90" | 29.02" | 17.94" | 22.76" | 31.21" | 19.57" | 12.71" | 26.39" | 7.76" | 6.65" | 16.27" | 12.02" | 228.2" |
| Saipan | 5.05" | 5.35" | 3.34" | 4.13" | 18.62" | 11.03" | 9.80" | 7.44" | 6.07" | 1.87" | 2.05" | 1.57" | 76.32" |
| Yap | 5.86" | 10.28" | 14.59" | 25.35" | 21.43" | 9.46" | 10.74" | 6.95" | 3.53" | 5.73" | 2.84" | 0.64" | 117.4" |
| Station Name | Apr 2023 | May 2023 | Jun 2023 | Jul 2023 | Aug 2023 | Sep 2023 | Oct 2023 | Nov 2023 | Dec 2023 | Jan 2024 | Feb 2024 | Mar 2024 | Apr- Mar |
|---|---|---|---|---|---|---|---|---|---|---|---|---|---|
| Chuuk | 12.47" | 11.30" | 11.66" | 11.98" | 12.86" | 11.71" | 11.51" | 10.61" | 11.25" | 10.10" | 7.25" | 8.32" | 136.77" |
| Guam NAS | 2.53" | 3.40" | 6.18" | 10.14" | 14.74" | 12.66" | 11.44" | 7.38" | 5.11" | 4.01" | 3.03" | 2.07" | 99.09" |
| Kapingamarangi | 13.64" | 12.08" | 13.78" | 14.15" | 8.13" | 9.93" | 8.19" | 9.27" | 9.84" | 9.15" | 9.27" | 11.43" | 145.85" |
| Koror | 7.32" | 11.83" | 17.48" | 18.53" | 13.50" | 11.77" | 11.84" | 11.39" | 11.16" | 10.18" | 8.56" | 7.44" | 152.90" |
| Kosrae | 17.51" | 17.75" | 14.64" | 14.91" | 14.22" | 14.22" | 10.94" | 13.83" | 16.11" | 16.67" | 12.93" | 16.06" | 213.87" |
| Kwajalein | 5.26" | 6.72" | 6.93" | 9.87" | 9.74" | 10.74" | 11.18" | 11.28" | 6.66" | 3.16" | 2.64" | 2.35" | 90.41" |
| Lukonor | 11.31" | 11.69" | 11.65" | 15.93" | 14.04" | 10.15" | 11.32" | 9.08" | 11.27" | 8.41" | 8.93" | 9.26" | 151.36" |
| Majuro | 9.42" | 10.11" | 11.01" | 11.17" | 11.69" | 11.17" | 12.73" | 13.44" | 11.39" | 7.74" | 6.88" | 6.58" | 125.25" |
| Pago Pago | 9.39" | 9.66" | 5.33" | 5.55" | 5.38" | 6.53" | 9.26" | 10.14" | 12.84" | 13.34" | 12.00" | 10.68" | 125.57" |
| Pohnpei | 18.41" | 19.96" | 14.81" | 15.43" | 14.26" | 12.55" | 15.27" | 14.83" | 16.08" | 13.18" | 9.55" | 13.17" | 182.36" |
| Saipan | 2.63" | 2.38" | 3.62" | 8.91" | 13.13" | 10.09" | 10.62" | 5.61" | 3.85" | 2.53" | 2.59" | 1.89" | 70.25" |
| Yap | 5.63" | 7.85" | 12.04" | 15.08" | 14.82" | 13.50" | 12.18" | 8.83" | 8.51" | 6.39" | 5.19" | 4.56" | 120.31" |
As measured by percent of normal precipitation, Kosrae, Majuro, and Yap were drier than normal at all time scales in the short term (March and the last 3 months [January-March]) and long term (last 12 months [April 2023-March 2024]). Chuuk, Guam, Pohnpei, and Saipan were drier than normal in the short term and wetter than normal in the long term. Airai, Kwajalein, and Pago Pago were drier than normal at one of the short-term time scales but near to wetter than normal at the other time scales. Lukunor was drier than normal in the long term and for the last 3 months, but wetter than normal for March. Kapingamarangi was wetter than normal in the short term and long term.


Based on percent of normal average (instead of normal median values), in the Marianas Islands, March and the last 3 to 4 months were drier than normal across the main islands. The last 6 months were drier than normal at most locations in the main islands, while a mixed precipitation anomaly pattern was evident at the 12-month time scale (percent of normal precipitation maps for the last 1, 3, 4, 6, 12 months).


Based on percent of normal average (instead of normal median values), the Marshall Islands were mostly drier than normal for March and the last 3 to 4 months, with a mixed anomaly pattern dominating at 6 to 12 months (percent of normal precipitation maps for the last 1, 3, 4, 6, 12 months).

According to the March 31 USDM produced for the USAPI:
- In the Marianas, moderate drought worsened to severe drought on Guam while severe drought continued on Saipan and moderate drought continued on Rota;
- In the FSM, severe drought worsened to extreme drought on Yap, abnormal dryness worsened to moderate drought at Chuuk, severe drought continued on Ulithi, moderate drought continued on Woleia, severe drought improved to abnormal dryness on Pingelap, and abnormal dryness ended at Lukunor, Nukuoro, and Pohnpei;
- In the Marshalls, severe drought worsened to extreme drought at Wotje, severe drought developed at Majuro, abnormal dryness developed at Ailinglaplap, abnormal dryness continued at Jaluit, and severe drought improved to moderate drought at Kwajalein; and
- Abnormal dryness developed at Palau.
The level of the reservoir on Majuro steadily declined throughout the month, falling from 25.1 million gallons on March 1 to a minimum of 19.5 million gallons on March 25, and ending the month at 20.2 million gallons. If the reservoir dips below 28.8 million gallons, drought becomes a concern. Satellite observations of vegetative health (drought stress, stressed vegetation, VHI) indicated areas of stressed vegetation on Guam.


The National Weather Service (NWS) office in Guam issued three Drought Information Statements (DGT) for drought for March (on March 1, 15, and 29). Drought impacts included:
- low or nearly empty water catchments on some islands, with water shortages occurring during the month for communities on the outer islands of Pohnpei State, Yap State, Chuuk State, and the northern RMI; wells on Lamotrek were low;
- agricultural strain is occurring on islands across Yap State, where taro patches are drying up and coconuts are drying out; there have been many reports of yellowing crops in the FSM and RMI, with crops turning brown in Yap State; the Northwest Islands of Chuuk state reported taro patches were dried up, young fruits were falling off breadfruit trees, and 90% of the breadfruit leaves were drying;
- wildfires have been reported on Guam, Rota, and Saipan in the Marianas, with isolated reports of wildfires on Palau, Yap, and Pohnpei;
- the Republic of Palau initiated Stage 1 of the Drought Action Plan due to drying conditions there;
- March 18 and March 25 statements discussed a Drought and Inundation Response Plan by the RMI government. The report estimated that 3,970 people in northern and western RMI were affected by the drought, with a total of 18 atolls/islands reporting water scarcity in their respective locations. Many islands have no water for people, livestock, and vegetation. The report warned that, even if rain were to begin by the end of April or early May, the impacts of the drought will continue for several months — it will take many months for water sources to be replenished, water quality to improve, and crops to be planted and harvested.
March 2024 precipitation ranks were mostly very dry to mid-range, based on data available at the time of this report. Short-term dryness was balanced by long-term wetness at a few locations, but others had long-term dryness as well as short-term dryness:
- Wotje: driest March (in a 41-year record) (March 2024 ties with March in 1994 and 1990, each of which had no measurable rainfall), and fifth driest February-March (last 2 months) and July-March (9-month period).
- Yap: second driest March (in a 73-year record), with fifth driest September-March and seventh driest February-March, December-March, and October-March.
- Ulithi: fourth driest March (41 years), and sixth driest November-March and seventh driest January-March and September-March.
- Majuro: fifth driest March (70 years), and fifth driest September-March (7-month period) and August-March (8-month period), fourth driest June-March (10 months) and April-March (last 12 months), and third driest July-March (9 months) and May-March (11-month period).
- Woleai: sixth driest March (40 years), and sixth driest February-March, January-March, and December-March.
- Chuuk: seventh driest March (73 years), and ninth driest February-March, but 22nd wettest April-March (last 12 months).
- Nukuoro: ninth driest March (41 years), but fifth driest February-March.
- Airai: ninth driest March (73-year combined record).
- Pingelap: 18th driest March (40 years), but fifth driest December-March, November-March, October-March, September-March, and last 12 months (April-March), and second driest June-March (10-month period).
- Guam: 14th driest March (68 years), and fourth driest November-March (last 5 months), but fifth wettest April-March (last 12 months).
- Jaluit: 13th driest March (41 years), and fifth driest July-March, May-March, and April-March, and fourth driest June-March.
- Kwajalein: 23rd wettest March (72 years), but ninth driest July-March (9-month period).
At the wet end of the scale:
- Kapingamarangi had the fourth wettest March (34 years) and wettest January-March and July-March back through April-March.
- Pohnpei had the 27th driest March (73 years) but third wettest May-March and April-March.
The following analysis of historical data for the USAPI stations in the Global Historical Climatology Network-Daily (GHCN-D) dataset, augmented with fill-in data from the 1981-2010 Normals, helps put the current data into historical perspective by computing ranks based on the period of record. The table below lists the precipitation ranks for March 2024, October 2023-March 2024 (last 6 months), and April 2023-March 2024 (the last 12 months). Some stations have a long period of record and their dataset is fairly complete, while other stations have a shorter period of record and the dataset has some missing data.
| Station | March 2024 | Oct 2023-Mar 2024 | Apr 2023-Mar 2024 | Period of Record | |||
|---|---|---|---|---|---|---|---|
| Rank | Years | Rank | Years | Rank | Years | ||
| Ailinglaplap | 13 | 41 | 29 | 39 | 33 | 38 | 1981-2024 |
| Airai | 9 | 73 | 27 | 73 | 44 | 71 | 1951-2024 |
| Chuuk | 7 | 73 | 20 | 73 | 51 | 72 | 1951-2024 |
| Fananu | -- | 8 | -- | 6 | -- | 2 | 2003-2023 |
| Guam | 14 | 68 | 22 | 67 | 63 | 67 | 1957-2024 |
| Jaluit | 13 | 41 | 10 | 39 | 5 | 38 | 1981-2024 |
| Kapingamarangi | 31 | 34 | 24 | 26 | 19 | 19 | 1962-2024 |
| Kosrae | 23 | 54 | 14 | 41 | 18 | 36 | 1954-2024 |
| Kwajalein | 50 | 72 | 42 | 72 | 49 | 71 | 1952-2024 |
| Lukunor | 32 | 40 | 16 | 38 | 8 | 27 | 1981-2024 |
| Majuro | 5 | 70 | 8 | 70 | 4 | 69 | 1954-2024 |
| Mili | -- | 40 | -- | 36 | -- | 34 | 1981-2024 |
| Nukuoro | 9 | 41 | 11 | 39 | 23 | 38 | 1981-2024 |
| Pago Pago | 16 | 58 | 44 | 58 | 44 | 58 | 1966-2024 |
| Pingelap | 18 | 40 | 5 | 36 | 5 | 34 | 1981-2024 |
| Pohnpei | 27 | 73 | 27 | 73 | 70 | 72 | 1951-2024 |
| Saipan | 17 | 43 | 16 | 35 | 23 | 35 | 1981-2024 |
| Ulithi | 4 | 41 | 9 | 38 | 23 | 37 | 1981-2024 |
| Utirik | -- | 17 | -- | 8 | -- | 4 | 1985-2020 |
| Woleai | 6 | 42 | 11 | 36 | -- | 27 | 1968-2024 |
| Wotje | 1 | 41 | 10 | 38 | 22 | 37 | 1981-2024 |
| Yap | 2 | 73 | 7 | 73 | 31 | 72 | 1951-2024 |


SPI values for seven time periods for Pacific Islands, computed by the Honolulu NWS office.

NOAA Regional Climate Centers
More information, provided by the NOAA Regional Climate Centers and others, can be found below.
Southeast
As noted by the Southeast Regional Climate Center, temperatures were above average across the Southeast in March, except in parts of southern Alabama, where temperatures were slightly below average, and precipitation was above average across most of the region. The wettest locations were found across southern portions of Alabama, Georgia, and South Carolina, as well as eastern portions of North Carolina and Virginia, while below-average precipitation was found in western portions of Virginia and parts of central Florida. Precipitation was variable across the U.S. Caribbean. Above-average precipitation was observed across the northern and southern slopes of Puerto Rico, while below-average precipitation was observed along the eastern and western slopes as well as the outlying islands. Precipitation was generally below average in Saint Thomas and near average in Saint Croix.
Drought conditions generally improved in March. Abnormal dryness (D0) was eliminated across the interior of the region and along the northern Gulf Coast but persisted across the West Coast of Florida and eastern portions of North Carolina. A very small pocket of moderate (D1) drought also persisted in eastern North Carolina. Over 97 percent of the region was free of any drought or abnormal dryness at the end of the month, the highest percentage since September 2021. Drought conditions also improved in Puerto Rico. Abnormal dryness (D0) was eliminated across the interior of the island. Moderate (D1) drought was also eliminated on the southwestern end of the island and contracted on the northwestern and eastern ends. Abnormal dryness (D0) persisted on Saint Thomas, while Saint John and Saint Croix remained free of any drought or abnormal dryness.
South
As explained by the Southern Regional Climate Center, temperatures were above normal across much of the Southern region during March, while precipitation was mixed across the region. Much of Louisiana, Mississippi, East Texas, and southern Arkansas recorded precipitation ranging from 125 and 200 percent of normal. The remainder of the region was near to below normal with the driest conditions being recorded in the western parts of the region.
During March, drought conditions remained largely steady across the Southern region, with some areas of Tennessee, Mississippi, Louisiana, and East Texas seeing improvements in existing drought conditions of one to two categories, according to the USDM. The only areas experiencing degradation in drought conditions were north-central Oklahoma and isolated areas of Central and South Texas. As of March 26th, Louisiana and Arkansas are essentially drought free; none of the region is in Exceptional Drought. Given normal to above average precipitation for much of the region over the previous months, subsoil moisture has rebounded across the region with the USDA reporting at least 50 percent of land having Adequate subsoil moisture in all states in the region except Texas which reported 46 percent of land having Adequate subsoil moisture. Planting of field crops began in southern portions of the region during March with Texas and Louisiana reporting 32 and 51 percent of rice acres planted and Texas reporting 57 percent of corn acres planted as of March 31st. The Smokehouse Creek Fire, which began in February, continued to affect the Texas Panhandle and western Oklahoma.
Midwest
As described by the Midwest Regional Climate Center, anomalous warmth was present across the entire Midwest region, with the average March temperature 40.5 degrees F (4.7 degrees C) regionwide, which was 3.6 degrees F (2 degrees C) above the 1991-2020 normal. March precipitation totaled 2.62 inches (67 mm) for the Midwest, which was 0.05 inch (1 mm) above normal, or 102 percent of normal. Precipitation varied across the region, ranging from up to 5 inches (127 mm) above normal across the Great Lakes to 3 inches (76.2 mm) below normal along the Ohio River.
The Midwest had some drought improvement throughout March. About 38 percent of the region started the month affected by drought. Drought coverage was reduced to about 27 percent by month's end. The epicenter of drought remained locked across eastern Iowa, with a large area affected by extreme (D3) drought, while the western half of the state had one category improvement on the USDM map. Drought improvements were noted across Missouri, Minnesota, and Wisconsin, although dryness and drought remained. Areas around the confluence of the Mississippi and Ohio Rivers trended drier in March, and drought development was an increasing concern there.
Northeast
As summarized by the Northeast Regional Climate Center, an unusually warm and record-wet March featured record low snowfall in some locations. The Northeast had its 10th warmest and fifth wettest March since records began in 1895. The USDM from March 5 showed less than one percent of the Northeast in moderate drought and three percent as abnormally dry. Moderate drought and abnormal dryness expanded slightly in western New York in response to continued precipitation deficits and much below-normal streamflow and groundwater levels. Meanwhile, moderate drought persisted on Nantucket, Massachusetts, driven mostly by reduced groundwater levels. However, conditions improved enough in northwestern Pennsylvania to ease abnormal dryness there. The USDM from March 26 showed less than one percent of the Northeast in moderate drought and two percent as abnormally dry. During March, western New York experienced record low or much below normal groundwater levels and 7-day streamflow, based on USGS data. During the spring fire season in the Mid-Atlantic, locally dry conditions contributed to multiple wildfires that burned several structures, led to evacuations, and reduced air quality in some locations.
High Plains
As discussed by the High Plains Regional Climate Center, much of the High Plains region received below-normal precipitation in March, despite a significant late-winter storm at the end of the month. March brought cooler temperatures for western parts of the region, while the eastern portions remained warm. Drought conditions within the region were in decent shape at the end of March. Expansion and intensification were sporadic, but not serious. Overall, the region observed a slight increase of less than a percent of D0 to D4 (abnormally dry to exceptional drought conditions). The drought that has plagued central and eastern Nebraska has slowly improved over the past few months, with a pocket of D2 (severe drought) remaining between Lincoln and Grand Island. This is a significant improvement over the previous year, when D4 was present within the state. Similar to Nebraska, Kansas was in much better shape than 2023. Although there was a slight intensification in the south-central part of the state where it was nearly bone-dry, the current situation was significantly less bleak than the previous year when D4 covered the southwestern portions of the state. Elsewhere in the region, other improvements and degradation were observed.
West
As summarized by the Western Regional Climate Center, the Southwest saw well-above-normal precipitation and temperatures were near to below normal. Continued dry and warm conditions persisted for much of the Pacific Northwest and northern Rockies with record-low snowpack for some locations raising concerns about worsening drought conditions. March was generally drier than normal in Washington, northern Oregon, northern Idaho, western Montana, and southeast New Mexico. The Washington Cascades and parts of the Rockies in Montana were particularly dry with SNOTEL stations reporting 40 percent to 60 percent of normal monthly precipitation; six SNOTEL stations in Washington and five in Montana are reporting the second lowest March precipitation totals on record. Low precipitation is being reflected in the well-below-normal snowpack in this region.
According to the USDM at the end of March, 23 percent of the West was in drought. Areas of extreme (D3) and exceptional (D4) drought are found in far southeast Arizona, southern New Mexico, and western Montana. Minor drought improvements were made throughout much of the West. However, the April 1 snowpack across Washington, northern Idaho, and western Montana was well below normal, and at record-low levels for some locations, and worsening drought conditions are expected heading into summer as a result.
Alaska summary: Precipitation was below normal for much of South Central, the Interior, and the southern half of the Panhandle. Ketchikan received 8.34 inches of precipitation for the month at 76 percent of normal and Petersburg received 4.87 inches at 64 percent of normal; this continues a several-month dry stretch for the southern Panhandle which has led to below-normal snowpack and potential summer drought impacts. Western coastal Alaska saw above-normal precipitation with Nome at 228 percent of normal and Kotzebue at 173 percent of normal. Most of the state saw temperature anomalies of one to four degrees Fahrenheit above normal with some isolated areas in southern Alaska much warmer including Northway at 6.8 degrees Fahrenheit above normal and Talkeetna at 6.1 degrees Fahrenheit above normal. Parts of southwest Alaska had slightly below-normal temperatures.
Hawaii summary: Hawaii saw drier-than-normal conditions across the entire chain of islands except for the east coast of the Big Island. Lihue had its sixth driest March with 0.89 inch of precipitation (16 percent of normal), Molokai had its sixth driest March with 0.45 inch of precipitation (15 percent of normal), and Honolulu the tenth driest with 0.23 inch of precipitation (10 percent of normal). Drought currently covers 42 percent of Hawaii with severe drought (D2) found only on the Big Island and Maui; spatial drought coverage has increased since the start of the calendar year but is still much less than the 81 percent of area covered at the start of the water year.