
The International Best Track Archive for Climate Stewardship (IBTrACS) project is the most complete global collection of tropical cyclones available. It merges recent and historical tropical cyclone data from multiple agencies to create a unified, publicly available, best-track dataset that improves inter-agency comparisons. IBTrACS was developed collaboratively with all the World Meteorological Organization (WMO) Regional Specialized Meteorological Centres, as well as other organizations and individuals from around the world.
To help the project receive continued support, updates, and improvement, tell us how you use IBTrACS data by completing our optional User Registration Form.
IBTrACS Version 4
Documentation
-
Caveats, usage information, and other details about how to use and apply IBTrACS data.
-
Descriptions of each CSV and shapefile data column.
-
Storm ID:
-
Information on IBTrACS storm identifier (SID).
Dataset Identifiers
- doi:10.25921/82ty-9e16
- NCEI data set identification (DSI): 9637
Citation
New users should document their data usage and provide feedback by completing IBTrACS voluntary User Registration. This information helps the IBTrACS team justify continued updates and support.
Please use both the BAMS paper and dataset citations when referencing IBTrACS in a written work that has a bibliography:
- Knapp, K. R., M. C. Kruk, D. H. Levinson, H. J. Diamond, and C. J. Neumann, 2010: The International Best Track Archive for Climate Stewardship (IBTrACS): Unifying tropical cyclone best track data. Bulletin of the American Meteorological Society, 91, 363-376. doi:10.1175/2009BAMS2755.1
- Knapp, K. R., H. J. Diamond, J. P. Kossin, M. C. Kruk, C. J. Schreck, 2018: International Best Track Archive for Climate Stewardship (IBTrACS) Project, Version 4. [indicate subset used]. NOAA National Centers for Environmental Information. doi:10.25921/82ty-9e16 [access date].
When the written work does not have a bibliography, please use:
- NOAA's International Best Track Archive for Climate Stewardship (IBTrACS) data, accessed on [Access Date]
Update Schedule
IBTrACS v04 is updated twice a week (usually on Monday and Friday), and could be updated more frequently to address specific needs and use cases. Fill out the voluntary User Registration Form to let us know if more frequent updates would help your project or research.
Access Methods
NetCDF
NetCDF is a self describing, mostly CF compliant format that uses global and variable attributes. Data are stored using the netCDF4 library.
Comma Separated Values (CSV)
Missing data are stored as blank cells to decrease file sizes (other netCDF and shapefiles use -9999.0 for missing data).
Shapefiles
Files are available as point and line shapefiles with the usual shapefile parts (prj, shx, shp, and dbf files). File metadata (xml files) are not currently available. The CSV column description file can be referenced for the definitions of each variable.
Tropical cyclone track data is available in several subsets, including:
ALL:
All storms available in the IBTrACS record
since1980:
The modern era of satellite observations
last3years:
3 most recent years of data
active:
storms active in the last 7 days
by basin:
- NI - North Indian
- SI - South Indian
- WP - Western Pacific
- SP - Southern Pacific
- EP - Eastern Pacific
- NA - North Atlantic
Release Information: v04r00
The first iteration of IBTrACS version 04 was released in March of 2019. It is updated weekly.
New Features (Improvements from v03)
- Best track data are updated daily, and contain provisional tracks of recent storms.
- Data are available in three inter-consistent (identical parameters, file structure, etc) formats (netCDF, CSV, shapefile).
- More parameters are available from best track data providers.
- Basin Assignment: Systems that occur within a basin are included in that basin file (in version 3, the storm was only included in its basin of origin)
- Storm translation speed and direction and other derived parameters requested by users are available in version v.
Known Issues
Check the IBTrACS News Forum for status updates.
Some early (pre-1950) storms were not correctly matched, so the number of storms in the record is artificially high. For example, SIO storms in 1901 are not matched, so the same storm is tracked by the following identifiers: ds824, td9636, and reunion. This storm is broken into different tracks because of temporal differences in the storm data.
v03r10
The last IBTrACS version 03 release. It includes storm data through 2016. The following is a summary of changes for v03r10.
Release date: 20 Sep 2017
New Features
- Best track data through 2016
- IBTrACS applied the new HKO categories to all HKO data to provide consistent storm categories.
Bug Fixes
- No major changes from v03r09.
Known Issues
- New datasets can cause new agency ordering in CSV and netCDF files
- Some early (pre 1950) storms were not correctly matched, so the number of storms in the record is artificially high. For example, SIO storms in 1901 are not matched, so ds824/td9636/reunion all track one storm, but is not identified as the same storm, so 3 separate tracks are created (due to temporal differences in the stormdata).
v03r09
The latest IBTrACS version includes storm data through 2015. The following is a summary of changes for v03r09.
Release date: 30 Sep 2016
New Features
- Best track data through 2015
Bug Fixes
- No major changes from v03r08.
Known Issues
- New datasets can cause new agency ordering in CSV and netCDF files
- Some early (pre 1950) storms were not correctly matched, so the number of storms in the record is artificially high. For example, SIO storms in 1901 are not matched, so ds824/td9636/reunion all track one storm, but is not identified as the same storm, so 3 separate tracks are created (due to temporal differences in the stormdata).
v03r08
Release date: 15 Jan 2016
New Features
- Best track data through 2014
- Two small bug fixes from v03r07
Bug Fixes
- Line shapefiles often had errant start and end lines
- In v03r07, there were five errant systems (INVESTs) in the North Atlantic that were not classified as tropical storms by NHC in HURDAT data. These were removed in v03r08.
Known Issues
- New datasets can cause new agency ordering in CSV and netCDF files
- Some early (pre 1950) storms were not correctly matched, so the number of storms in the record is artificially high. For example, SIO storms in 1901 are not matched, so ds824/td9636/reunion all track one storm, but is not identified as the same storm, so 3 separate tracks are created (due to temporal differences in the stormdata).
v03r07
Release date: 22 Oct 2015
New Features
- Best track data through 2014
- New 19th Century data for the North Atlantic from Mike Chenoweth This has a large effect on North Atlantic systems in the 19th century.
- New subbasins - We have finally implemented Gulf of Mexico and Caribbean Sea sub basins of the Atlantic. We used the definitions from the IHO (International Hydrographic Organization), using data from Marine Regions website.
Bug Fixes
- There was a small bug that ocurred when a storm had few (1 or 2) points in its track. This has a small effect on a few storms
Known Issues
- Line shapefiles often had errant start and end lines
- In v03r07, there were five errant systems (INVESTs) in the North Atlantic that were not classified as tropical storms by NHC in HURDAT data. These were removed in v03r08.
- New datasets can cause new agency ordering in CSV and netCDF files
- Some early (pre 1950) storms were not correctly matched, so the number of storms in the record is artificially high. For example, SIO storms in 1901 are not matched, so ds824/td9636/reunion all track one storm, but is not identified as the same storm, so 3 separate tracks are created (due to temporal differences in the stormdata).
v03r06
Release date: 2 Sep 2014
New Features
- Best track data through 2013
- Landfall Variables
- New variables in netCDF provide information on storm location with respect to land. The new variable dist2land provides information on the current distance to land. The new variable landfall provides the minimum distance to land between the current time and the next reporting time. Landfalling storms would at least one occurrences of a dist2land value > 0 but landfall = 0
- Improved North Atlantic/Eastern Pacific Basin delineation
Bug Fixes
- ATCF data from JTWC and NHC was being read in incorrectly. This caused a problem in many storm properties (wind radii, storm type, etc.) in previous IBTrACS versions.
- A HURDAT2 reading error was corrected (error affected only v03r05 wind radii since it was the first year with HURDAT2 data)
- Corrected an error in Wellington data for 2011 Wilma (problem with longitude positions near dateline)
Known Issues
- New datasets can cause new agency ordering in CSV and netCDF files
- Some early (pre 1950) storms were not correctly matched, so the number of storms in the record is artificially high. For example, SIO storms in 1901 are not matched, so ds824/td9636/reunion all track one storm, but is not identified as the same storm, so 3 separate tracks are created (due to temporal differences in the stormdata).
v03r05
Release date: 4 Nov 2013
New Features
- Best track data through 2012
- Data includes new data format from HURDAT which includes a) observations at non-synoptic times (e.g., near landfall or maximum intensity) and b) other variables (e.g., wind radii)
Bug Fixes
- Data
- Fixed assignment of dates to some tracks from the 1800s whose starting dates were approximate.
- Modified WMO agency identification to allow BoM to backup TCWCs Nadi and Wellington if either were missing but BoM was present. This fixed REWA (1993) where WMO track had gaps due to nadi not reporting the storm.
- Known Bugs
- New dataset causes new agency ordering in CSV and netCDF files
- Some early (pre 1950) storms were not correctly matched, so the number of storms in the record is artificially high. For example, SIO storms in 1901 are not matched, so ds824/td9636/reunion all track one storm, but is not identified as the same storm, so 3 separate tracks are created (due to temporal differences in the stormdata).
v03r04
Release date: 1 Oct 2012
New Features
- Best track data through 2011
- New dataset: Typhoon Analogs - Data for historical typhoons (1945-1976) includes numerous new parameters, recently uncovered at NCDC
Bug Fixes
- Data
- Removed non-developing storms that slipped in through ATCF B decks with numbers more than 49 (e.g., bal502007.dat)
- Fixed basin discrepancy between IBTrACS-All and IBTrACS-WMO occurring for some storms
- Shapefiles
- Fixed ArcGIS ingest error caused by column headers having spaces.
v03r03
Release date: 19 July 2011
New Features
- New data through 2010 for all agencies
- v03r03/ibtracs/*.nc files - New variable - wind_avg_period
- v03r03/all/shp - shapefiles - Support of shapefiles is a new development and should be considered as a test phase as this is our first dataset release with access to shapefiles directly produced by the IBTrACS software.
Using the IDL, shape files are created. Files are available for: individual storms, concatenated by year, concatenated by basin, or a file with everything. - v03r03/all/netCDF files
- New attribute: source
- New variables: lat_for_mapping, lon_for_mapping and basin
- Added variable attribute "_FillValue"
- v03r03/all/CSV files - New column/variables: lat_for_mapping, lon_for_mapping, track_type, and current basin
- v03r03/all/CSV/basin files - Columns with all missing data (no valid reports) have been removed
- v03r03/ibtracs/*.nc files and WMO files: netCDF, WMO, CSV, cXML - N. Atlantic, E. Pac. and C. Pac WMO source changed from HURDAT/CPHC to ATCF
Bug Fixes
- Data
- Some time parameters were stored in netCDF files as floats instead of doubles. One place this impacted were in the ISO times in the CSV files. The result was wrong times (due to truncation of the floats). This is now fixed in v03r03.
- Corrected spuriously low winds in TD9636 data (1885 and 1897 and 1945).
- Corrected a wind speed for ATCF bal191974.dat (2 --> 25)
- Corrected WMO tracks of spurs - Spurs containing WMO data inadvertently contained the entire WMO track instead of the just the portion that was a spur.
- Corrected a wind speed for Wellington 1974 ALICE: 6 --> 60
- CSV files
- Storm names no longer have commas.
- Corrected storm ordering.
- HURDAT_format files
- Corrected storm nature assignments.
- For NHC storms, the XING, SSS and maximum storm intensity now derive directly from the original HURDAT file. For other basins, maximum storm type is now assigned based on maximum intensity as a tropical cyclone
- WMO NetCDF file - source data was inadvertantly assigned only for the first observation. Source data is now (v03r03) assigned for each storm report.
Known Bugs
- Some early (pre 1950) storms were not correctly matched, so the number of storms in the record is artificially high. For example, SIO storms in 1901 are not matched, so ds824/td9636/reunion all track one storm, but is not identified as the same storm, so 3 separate tracks are created (due to temporal differences in the storm data).
v03r02
The only change between v03r01 and v03r02 is that the CMA/Shanghhai Typhoon Institute data was updated based on their September update.
Release date: 17 Sep 2010
v03r01
There are numerous changes and improvements from v02r01 to v03r01. A summary is below.
Release date: 1 Sep 2010
Best track Period of Records for IBTrACS
- 1906-2006 - Australian TCWCs (BoM)
- 1848-2009 - RSMC La Reunion (MFLR)
- 1851-2009 - RSMC Miami (HURDAT & ATCF)
- 1990-2009 - RSMC New Delhi (IMD)
- 1951-2009 - RSMC Tokyo (JMA)
- 1966-2008 - RSMC Honolulu (MS Excel file and ATCF B Decks)(CPHC)
- 1992-2009 - RSMC Nadi (FMS)
- 1968-2009 - TCWC Wellington (NZMS)
- 1949-2009 - CMA/STI
- 1945-2009 - JTWC
- 1961-2009 - HKO
- 1960-2007 - Neumann
- 1842-1989 - NCDC Data Set 9636
New Data Sources
- 2006-2009 - BoM Operational data (best track data not yet available)
- 2009-2009 - CPHC Operational data (best track data not yet available)
- 1877-1980 - UCAR ds824.1 - Global Tropical Cyclone "Best Track" Position and Intensity Data (not using data after 1980). Warning: ds824 provides wind speed when only the storm category was known (TD, TS or HR) and lists them as 25E or 35E or 65E. IBTrACS does not yet denote wind quality in many formats. Use wind data from ds824 with caution until a future IBTrACS release accurately denotes the wind quality.
Changes from v02r01 that affect cyclone data
- Intensity percentiles are now provided. The percentiles are calculated per agency and per basin. Percentiles are compiled based on a limited period record (1970-2009).
- Data are now provided in IBTrACS as it is provided to us. We no longer convert all observations to a 10-min wind speed.
Deprecated
- IBTrACS-ASCII format - This format is no longer produced or supported. Users of ibtracs_ascii should now use the CSV or netCDF files.
Known Bugs
- Some of the earliest storms in the South Indian Ocean (before 1890) have differing positions between La Reunion and DSI-9636.
Due to the amount of changes from version 2, the number was incremented to Version 3.
As this is the first release of version 2, it is named Release 1.
v02r01
There are numerous changes and improvements from v01cor-r01 to v02r01. A summary is below.
Release date: 24 Jul 2009
Updates from best track data sources through calendar year 2008:
- RSMC Miami (HURDAT) for North Atlantic and Eastern Pacific
- RSMC Tokyo (JMA) Western Pacific
- RSMC New Delhi (IMD) Northern Indian
- CMA/STI - Western Pacific
- JTWC - Western Pacific, Northern Indian, Southern Hemisphere
New Data Sources
- NOAA ATCF B Deck for North Atlantic and Eastern & Central Pacific
- NCDC DSI-9636 - Global Consolidated Tropical Cyclone Data
Changes from v01cor-r01 that affect cyclone data
- Correction to pres_minimum and pres_maximum
- New treatment of Neumann data
- New adjustment for CMA wind reports
- JTWC storm type now incorporated into IBTrACS
- Adjustment to the method for classiying storm trackss as spurs.
- Bug fix - Correction on how BoM data was read in for storms reported in more than one type of unit
Changes from v01cor-r01 that do not affect cyclone data
- Original reports of position and intensity from each agency are now available in some formats:
- ibtracs - Official IBTrACS Dataset netCDF format
- ibtracs_net - IBTrACS data for all cyclones in one large file
- ibtracs_csv - IBTrACS data in a comma separated file
- ibtracs_csv - now has two more header lines which provide column names and units
Known Bugs
Some of the earliest storms in the South Indian Ocean (before 1890) have differing positions between La Reunion and DSI-9636.
Due to the amount of changes from version 1, the number was incremented to Version 2.
As this is the first release of version 2, it is named Release 1.
v01cor-r01
All data are identical to v01r01, except for the corrections listed below. Check this area frequently as it may be updated without notice
Release date: 12/23/2008
Corrections that affect storm data
- ibtracs_tape: Winds are now 10-min winds.
Corrections that do not affect storm data
- ibtracs_net: Made CF-1.0 compliant
- Corrected wind speed units: "kn" → "kt" and "knots" → "kt"
- Corrected scale_factor for variables: lat, lon, pres and wind
Known Bugs
- Minimum and maximum pressure values are reversed in IBTrACS v01r01 and v01cor-r01. That is, the minimum pressure value from the available centers is reported as the maximum and vice versa. This will be corrected in a future release of IBTrACS.
- Error in BoM intensities - For some storms reported by BoM, intensities were incorrectly ingested into IBTrACS. This only affects cyclones where BoM changed the wind speed units during a storm's lifetime. In such cases, speeds were incorrectly handled (either by not converting m/s to kt or by converting kt to m/s). This bug is present v01r01, too, and is corrected in v02r01.
v01r01
Release Date 12/15/2008
Version 1.0, Release 01
Bugs
- ibtracs_tape: Wind speeds in ibtracs_tape files (i.e., HURDAT format) were inadvertantly provided as 1-minute winds. Winds should be corrected back to 10-minute by multiplying wind speeds by 0.88.
- ibtracs_net: files are not CF-compliant
- These bugs are corrected in v01cor-r01 (see above)
BETA00x
- Test versions (BETA00x) of the data set were available but are superceded by the release of IBTrACS version 1.
Browse IBTrACS Data
IBTrACS Browser (Hosted by NCICS)
View storm imagery (based on HURSAT), tracks, intensities and raw data.
CSC Historic Hurricane Track Mapper
Use this interactive map tool to search historic hurricane data (from IBTrACS and other datasets) by location, name, year, zip code, or basin.
Principles
Global
IBTrACS merges Tropical Cyclone (TC) storm track datasets from agencies around the world to create a global, best track TC database.
Open
The methods used to merge and maintain the data will be public, and all data quality revisions and additions will be recorded and open for review. Information about the integrity or quality of a storm track will also be available to the agencies that provide track data.
Provenance
All changes to data will be recorded, and each version of the data will be maintained. Data provenance will be recorded to preserve traceability, and to make it easy to identify data sources. The reasoning behind changes and algorithms that merge and adjust the datasets will be recorded so that the data can be well understood for years to come.
Ongoing
The dataset production will be ongoing and updated annually (in the boreal summer following the completion of the Northern Hemisphere TC season).
Accessibility
NCEI will maintain the official archive of this product in one format, but will provide the dataset in formats that are already used by the TC community.
Third IBTrACS Workshop

Purpose
This workshop was an opportunity for the IBTrACS Team to interact with technical and management staff from Regional Specialized Meteorological Centers and Tropical Cyclone Warning Centers around the world. The goal of these discussions were to improve the quality and utility of the IBTrACS dataset, discuss the production of best track data and the related data uncertainty, and develop an approach to deriving (as originally laid out by IWTC-VI) a "singular, uniform global best track dataset."
More Information
Best Track Data Sources in IBTrACS
Data in IBTrACS fall into one of three categories: static (no longer updated), annual updates, and daily updates.
Static Best Track Sources
- Charlie Neumann Southern Hemisphere Data
- Michael Chenoweth North Atlantic 19th Century Reanalysis
- TD9636: Global, consolidated tropical cyclone data that was jointly produced by the National Climatic Data Center (NCDC) and the Navy in the 1980s.
- TD9635: A historical set of reports on West Pacific systems that includes unique variables.
- dsi824: The data are updated regularly by the National Center for Atmospheric Research (NCAR), but their source for recent years is the Joint Typhoon Warning Center (JTWC).
Annually-Updated Best Track Sources
- Australian Bureau of Meteorology
- China Meteorological Administration - Shanghai Typhoon Institute
- Hong Kong Observatory
- Joint Typhoon Warning Center
- RSMC Honolulu, HI, USA (NOAA's Central Pacific Hurricane Center)
- RSMC La Reunion
- RSMC Miami, FL, USA (NOAA's Tropical Prediction Center) (HURDAT)
- RSMC Nadi, Fiji
- RSMC New Delhi, India
- RSMC Tokyo, Japan
- TCWC Wellington, New Zealand
Daily-Updated Provisional Track Data Sources
- TC Vitals
- NCAR Tropical Cyclone Guidance Project
- NHC provisional data
Tropical Cyclone Climatology
The following is a summary of annual or monthly counts based on IBTrACS. When using these numbers in any publication, please cite:
Schreck III, C. J., K. R. Knapp, and J. P. Kossin, 2014:
The Impact of Best Track Discrepancies on Global Tropical Cyclone Climatologies using IBTrACS, Monthly Weather Review, 142, 3881-3899. doi:10.1175/MWR-D-14-00021.1
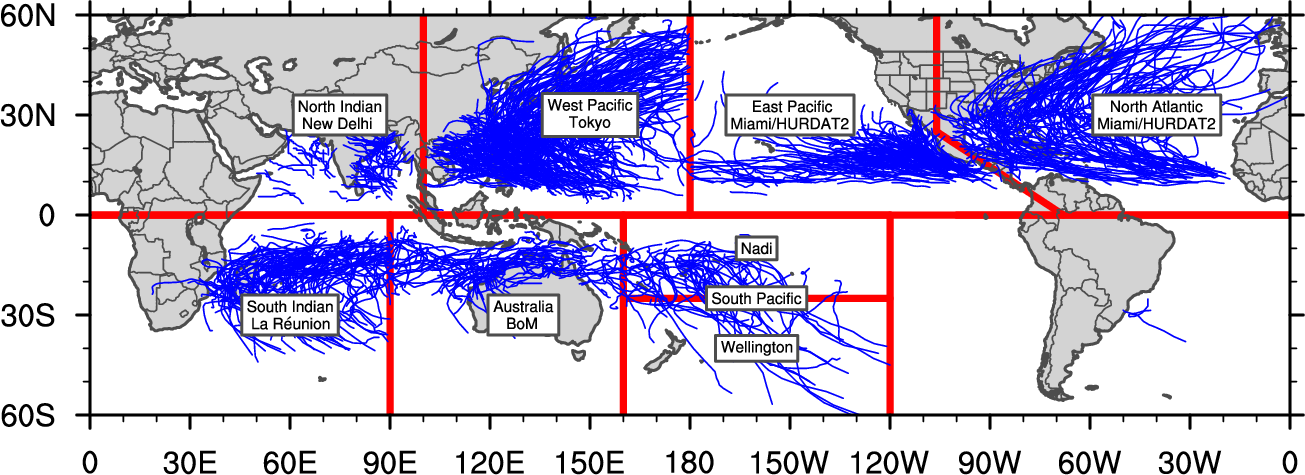
The Tropical Cyclone Climatology was constructed using two different approaches based on reports and data from the following organizations:
World Meteorological Organization (WMO)
Climatology based on reports from the WMO official forecast centers (referred to as RSMCs and TCWCs).
National Hurricane Center (NHC) and Joint Typhoon Warning Center (JTWC)
Climatology based on the combination of the NHC best track data for the North Atlantic and Eastern Pacific the JTWC for other basins.
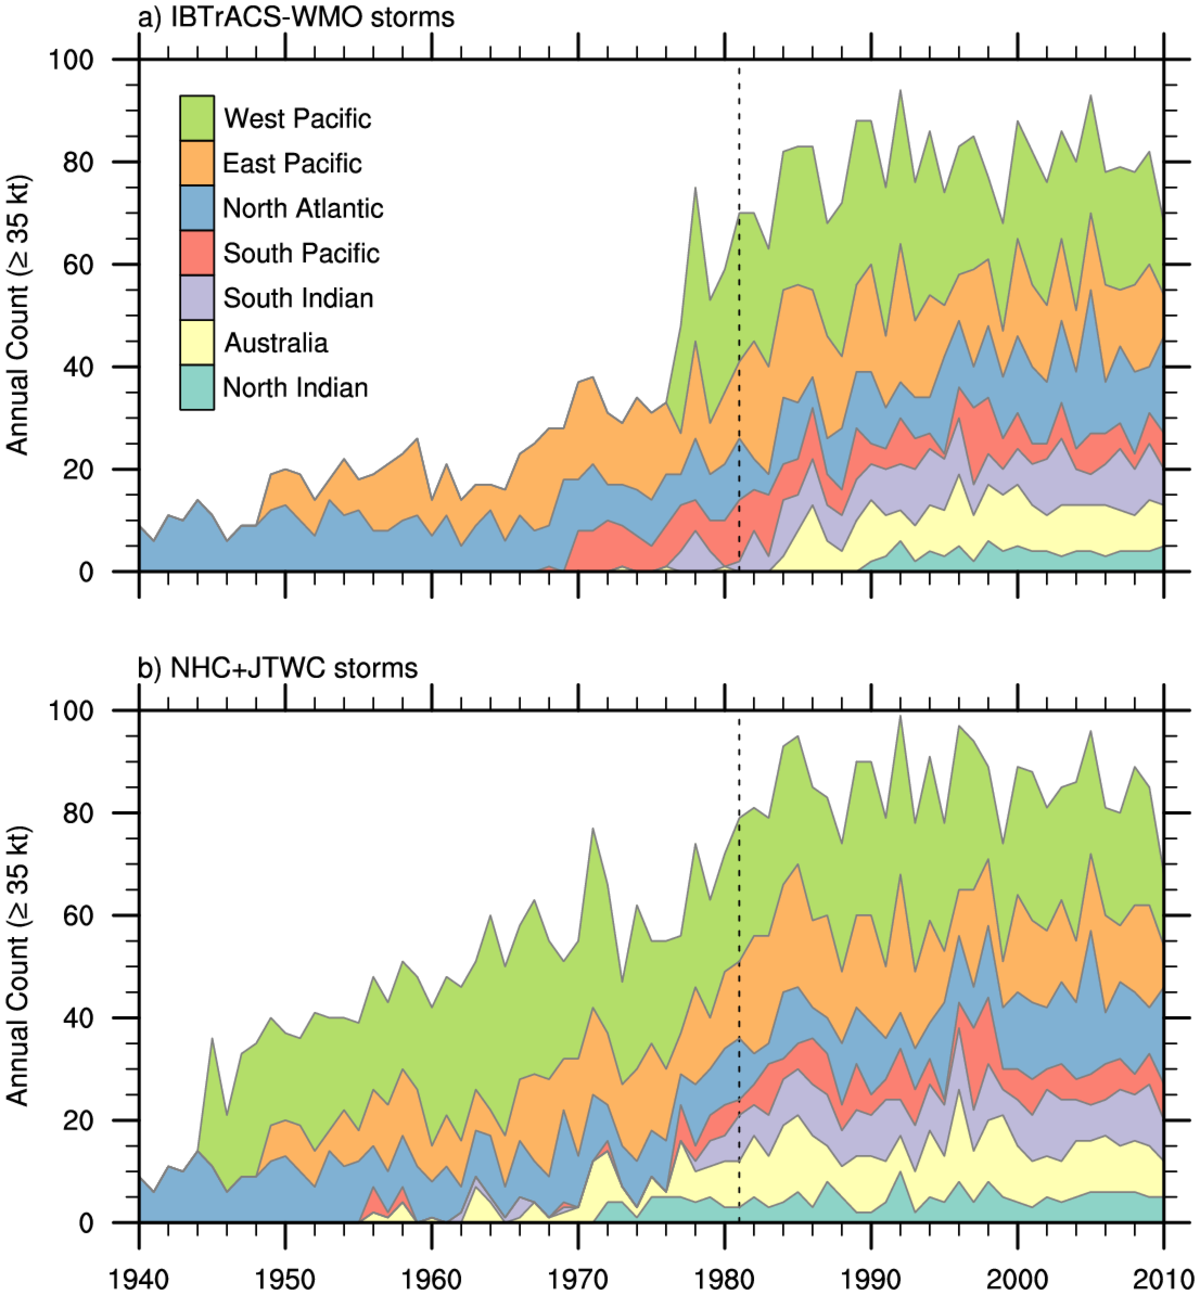
WMO Annual Tropical Cyclone Numbers
Based on tables 3 and 4 and figure 4 from Schreck et al. (2014)
Number of storms with winds ≥ 35 knots (e.g., tropical storms)
| Percentiles | ||||||
|---|---|---|---|---|---|---|
| Basin | Initial Year | Mean | Std. Dev. | 25th | 50th | 75th |
| North Atlantic | 1981 | 12.1 | 4.9 | 8 | 12 | 15 |
| East Pacific | 1981 | 16.5 | 4.6 | 14 | 16.5 | 20 |
| West Pacific | 1981 | 25.0 | 4.2 | 22 | 25 | 28 |
| North Indian | 1981 | 3.9 | 1.2 | 3 | 4 | 4.25 |
| South Indian | 1981/82 | 8.4 | 2.4 | 7.75 | 8 | 10 |
| Australian | 1984/85 | 9.1 | 3.1 | 7 | 9 | 11 |
| South Pacific | 1980/81 | 6.8 | 3.9 | 4 | 6 | 9 |
| Northern Hemisphere | 1981 | 57.5 | 6.2 | 52 | 55 | 61 |
| Southern Hemisphere | 1980/81 | 24.3 | 4.7 | 20 | 22.5 | 26 |
| Global | 1981 | 81.8 | 7.8 | 74 | 79.5 | 85 |
Number of storms with winds ≥ 64 knots (e.g., hurricanes)
| Percentiles | ||||||
|---|---|---|---|---|---|---|
| Basin | Initial Year | Mean | Std. Dev. | 25th | 50th | 75th |
| North Atlantic | 1981 | 6.4 | 3.1 | 4 | 6.5 | 8 |
| East Pacific | 1981 | 8.9 | 3.1 | 7 | 8.5 | 11 |
| West Pacific | 1981 | 15.3 | 4.1 | 13 | 16.5 | 18 |
| North Indian | 1981 | 1.4 | 0.9 | 1 | 1 | 2 |
| South Indian | 1981/82 | 4.7 | 2.3 | 3 | 5 | 6 |
| Australian | 1984/85 | 5.4 | 2.5 | 4 | 5 | 7 |
| South Pacific | 1980/81 | 4.0 | 2.8 | 1 | 4 | 6 |
| Northern Hemisphere | 1981 | 32.0 | 4.9 | 28 | 32 | 35 |
| Southern Hemisphere | 1980/81 | 14.1 | 3.6 | 12 | 13 | 16 |
| Global | 1981 | 46.1 | 6.0 | 40 | 46 | 49 |
Number of storms with winds ≥ 96 knots (e.g., major hurricanes)
| Percentiles | ||||||
|---|---|---|---|---|---|---|
| Basin | Initial Year | Mean | Std. Dev. | 25th | 50th | 75th |
| North Atlantic | 1981 | 2.7 | 1.9 | 1 | 2 | 4 |
| East Pacific | 1981 | 4.3 | 2.6 | 2 | 4 | 6 |
| West Pacific | 1981 | 7.5 | 3.0 | 6 | 7.5 | 9 |
| North Indian | 1981 | 0.6 | 0.7 | 0 | 1 | 1 |
| South Indian | 1981/82 | 2.4 | 1.8 | 1 | 2 | 4 |
| Australian | 1984/85 | 2.6 | 1.6 | 1 | 2 | 4 |
| South Pacific | 1980/81 | 1.6 | 1.7 | 0 | 1 | 2 |
| Northern Hemisphere | 1981 | 15.1 | 3.4 | 13 | 14 | 17 |
| Southern Hemisphere | 1980/81 | 6.6 | 2.7 | 4 | 6.5 | 8 |
| Global | 1981 | 21.7 | 4.6 | 18 | 21 | 23 |
When using these numbers in any publication, please cite:
Schreck III, C. J., K. R. Knapp, and J. P. Kossin, 2014: The Impact of Best Track Discrepancies on Global Tropical Cyclone Climatologies using IBTrACS Monthly Weather Review, 142, 3881-3899. doi:10.1175/MWR-D-14-00021.1
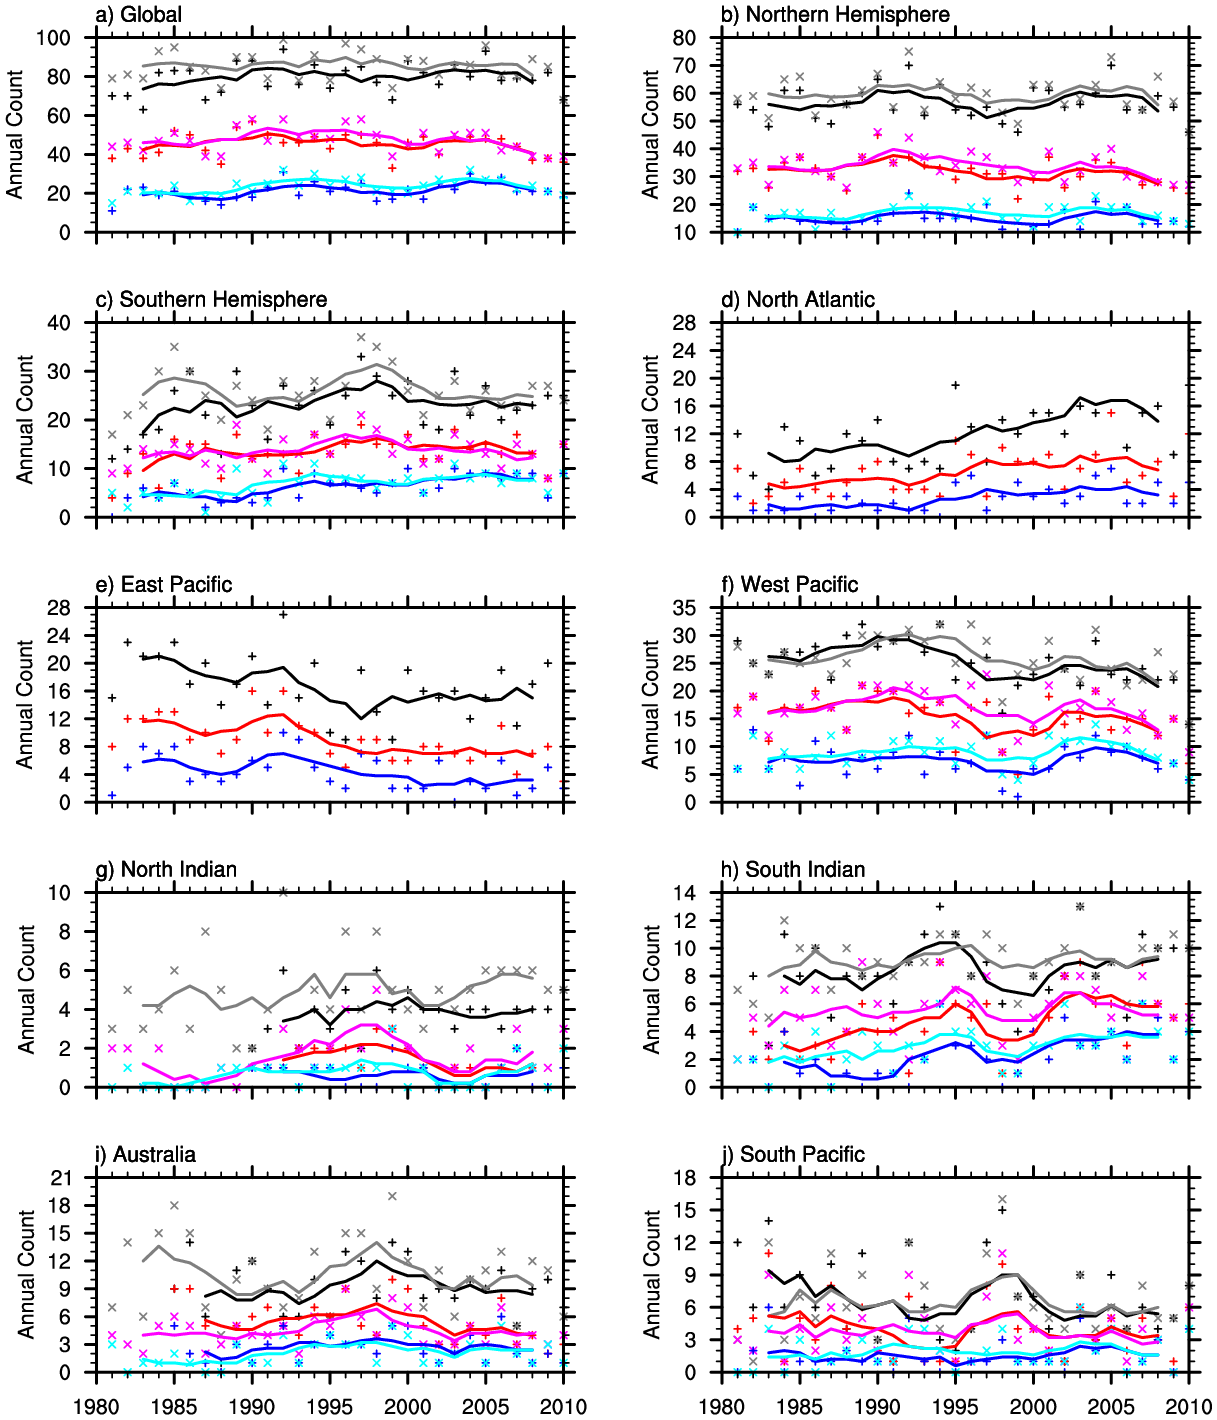
NHC and JTWC Annual Tropical Cyclone Numbers
Based on tables 3 and 4 and Figure 4 from Schreck et al. (2014)
Number of storms with winds ≥ 35 knots (e.g., tropical storms)
| Percentiles | ||||||
|---|---|---|---|---|---|---|
| Basin | Initial Year | Mean | Std. Dev. | 25th | 50th | 75th |
| North Atlantic | 1981 | 12.1 | 4.9 | 8 | 12 | 15 |
| East Pacific | 1981 | 16.5 | 4.6 | 14 | 16.5 | 20 |
| West Pacific | 1981 | 25.7 | 4.2 | 23 | 25 | 29 |
| North Indian | 1981 | 4.9 | 1.9 | 4 | 5 | 6 |
| South Indian | 1980/81 | 9.0 | 1.9 | 8 | 9 | 10 |
| Australian | 1980/81 | 10.4 | 4.0 | 7 | 10.5 | 13 |
| South Pacific | 1980/81 | 6.3 | 3.5 | 4 | 5.5 | 8 |
| Northern Hemisphere | 1981 | 59.2 | 6.6 | 55 | 58 | 63 |
| Southern Hemisphere | 1980/81 | 25.7 | 4.3 | 23 | 25 | 28 |
| Global | 1981 | 84.9 | 7.6 | 79 | 85 | 90 |
Number of storms with winds ≥ 64 knots (e.g., hurricanes)
| Percentiles | ||||||
|---|---|---|---|---|---|---|
| Basin | Initial Year | Mean | Std. Dev. | 25th | 50th | 75th |
| North Atlantic | 1981 | 6.4 | 3.1 | 4 | 6.5 | 8 |
| East Pacific | 1981 | 8.9 | 3.1 | 7 | 8.5 | 11 |
| West Pacific | 1981 | 16.6 | 3.8 | 14 | 17 | 20 |
| North Indian | 1981 | 1.5 | 1.3 | 1 | 1 | 2 |
| South Indian | 1980/81 | 5.4 | 2.1 | 4 | 5.5 | 7 |
| Australian | 1980/81 | 4.4 | 1.8 | 3 | 4 | 5 |
| South Pacific | 1980/81 | 1.9 | 1.7 | 2 | 3 | 5 |
| Northern Hemisphere | 1981 | 33.4 | 5.2 | 29 | 33 | 37 |
| Southern Hemisphere | 1980/81 | 13.5 | 3.1 | 11 | 13 | 15 |
| Global | 1981 | 46.9 | 6.2 | 42 | 47 | 51 |
Number of storms with winds ≥ 96 knots (e.g., major hurricanes)
| Percentiles | ||||||
|---|---|---|---|---|---|---|
| Basin | Initial Year | Mean | Std. Dev. | 25th | 50th | 75th |
| North Atlantic | 1981 | 2.7 | 1.9 | 1 | 2 | 4 |
| East Pacific | 1981 | 4.3 | 2.6 | 2 | 4 | 6 |
| West Pacific | 1981 | 8.8 | 2.6 | 7 | 9 | 11 |
| North Indian | 1981 | 0.7 | 0.7 | 0 | 1 | 1 |
| South Indian | 1981/82 | 2.9 | 1.6 | 2 | 3 | 4 |
| Australian | 1984/85 | 2.0 | 1.4 | 1 | 1.5 | 3 |
| South Pacific | 1980/81 | 1.9 | 1.7 | 1 | 1 | 3 |
| Northern Hemisphere | 1981 | 16.5 | 3.2 | 14 | 16.5 | 19 |
| Southern Hemisphere | 1980/81 | 6.8 | 2.6 | 5 | 7 | 8 |
| Global | 1981 | 23.3 | 4.3 | 21 | 24 | 27 |
When using these numbers in any publication, please cite:
Schreck III, C. J., K. R. Knapp, and J. P. Kossin, 2014: The Impact of Best Track Discrepancies on Global Tropical Cyclone Climatologies using IBTrACS, Monthly Weather Review, 142, 3881-3899. doi:10.1175/MWR-D-14-00021.1
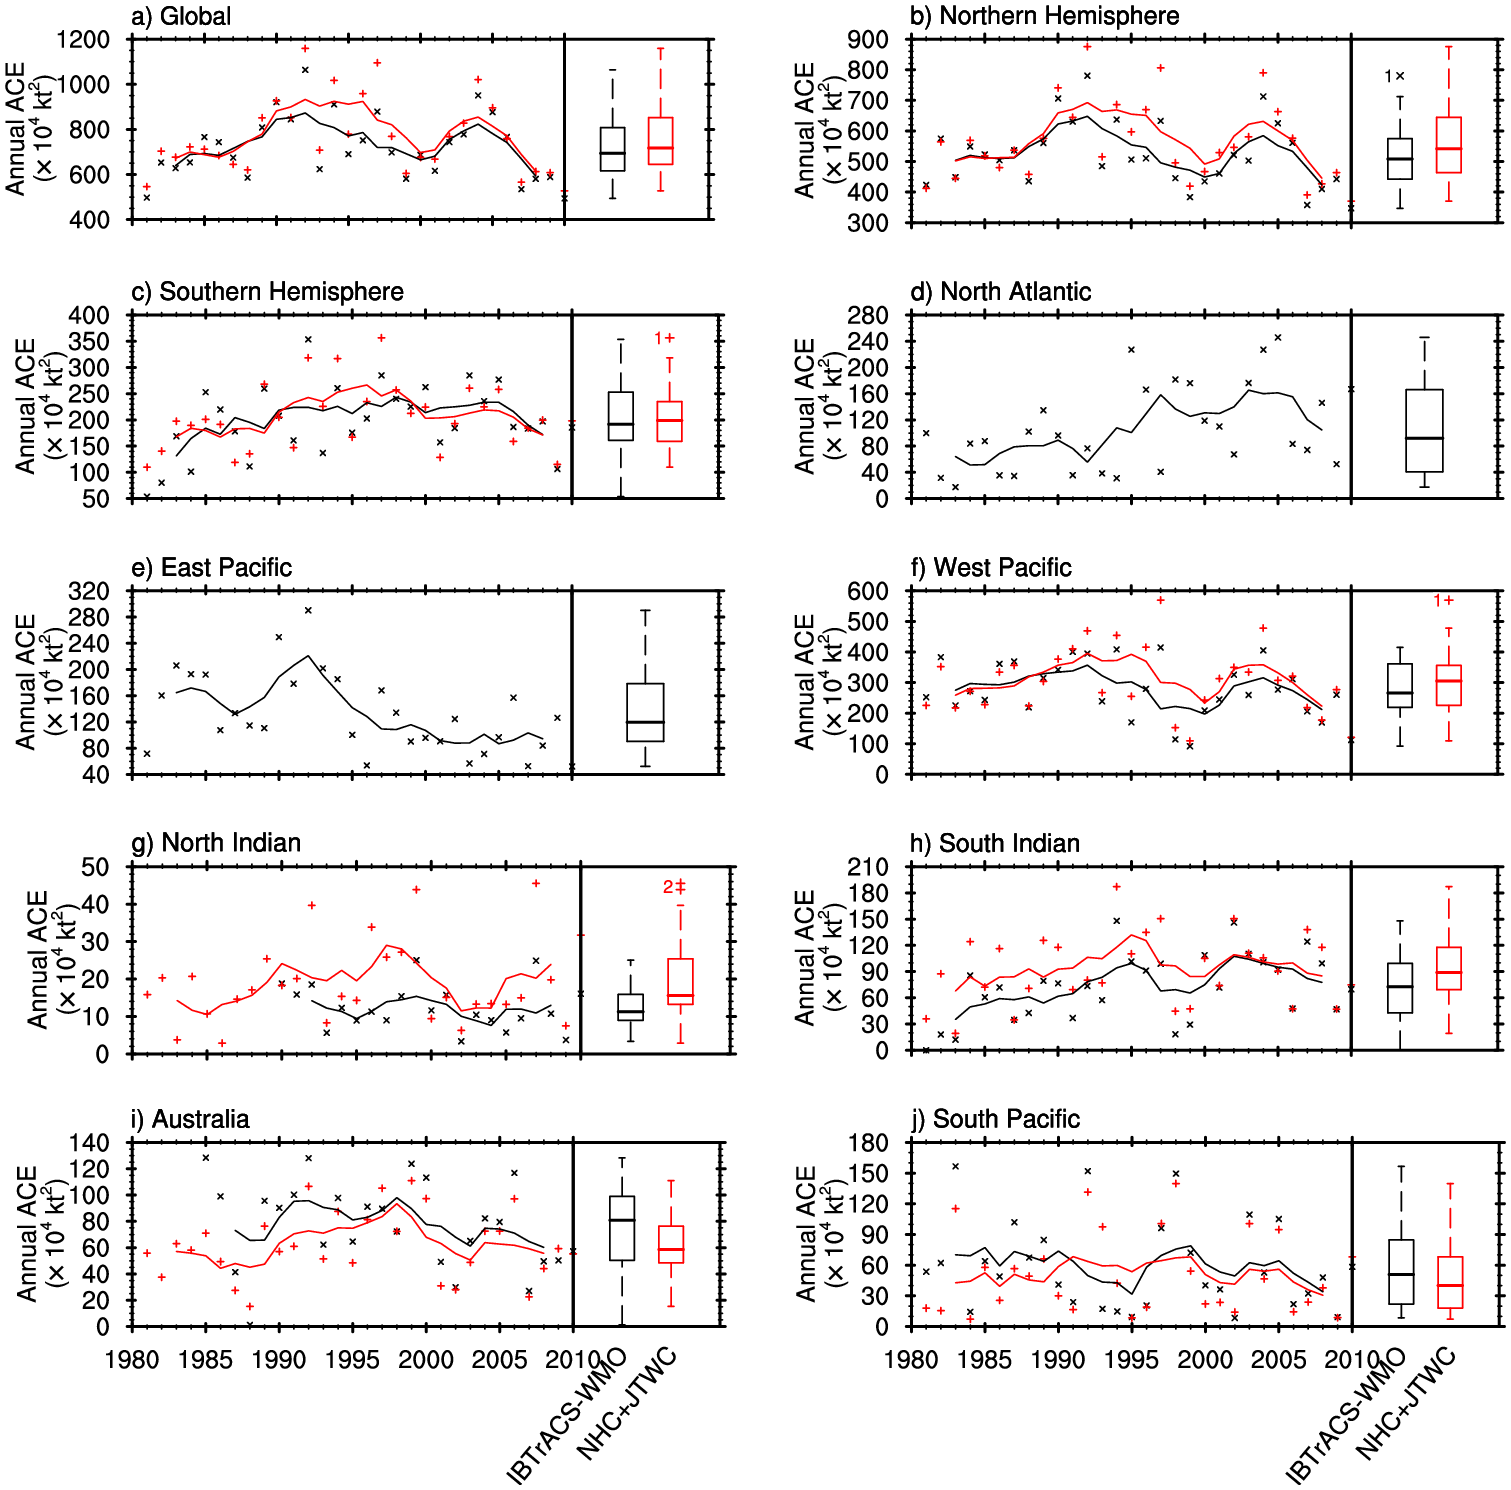
WMO Accumulated Cyclone Energy
Based on tables 5 and 6 and figure 7 from Schreck et al.(2014)
| Percentiles | ||||||
|---|---|---|---|---|---|---|
| Basin | Initial Year | Mean | Std. Dev. | 25th | 50th | 75th |
| North Atlantic | 1981 | 105 | 66 | 41 | 92 | 166 |
| East Pacific | 1981 | 132 | 61 | 90 | 120 | 178 |
| West Pacific | 1981 | 276 | 93 | 219 | 266 | 361 |
| North Indian | 1981 | 12 | 6 | 9 | 11 | 16 |
| South Indian | 1981/82 | 74 | 36 | 46 | 73 | 100 |
| Australian | 1984/85 | 77 | 33 | 50 | 81 | 99 |
| South Pacific | 1980/81 | 59 | 43 | 22 | 51 | 85 |
| Northern Hemisphere | 1981 | 525 | 107 | 443 | 508 | 575 |
| Southern Hemisphere | 1980/81 | 210 | 58 | 150 | 210 | 246 |
| Global | 1981 | 735 | 142 | 616 | 694 | 808 |
When using these numbers in any publication, please cite:
Schreck III, C. J., K. R. Knapp, and J. P. Kossin, 2014: The Impact of Best Track Discrepancies on Global Tropical Cyclone Climatologies using IBTrACS Monthly Weather Review, 142, 3881-3899. doi:10.1175/MWR-D-14-00021.1
NHC and JTWC Accumulated Cyclone Energy
Based on tables 5 and 6 and figure 7 from Schreck et al. (2014)
| Percentiles | ||||||
|---|---|---|---|---|---|---|
| Basin | Initial Year | Mean | Std. Dev. | 25th | 50th | 75th |
| North Atlantic | 1981 | 105 | 66 | 41 | 92 | 166 |
| East Pacific | 1981 | 132 | 61 | 90 | 120 | 178 |
| West Pacific | 1981 | 305 | 109 | 225 | 306 | 356 |
| North Indian | 1981 | 19 | 11 | 13 | 16 | 25 |
| South Indian | 1980/81 | 92 | 40 | 69 | 89 | 118 |
| Australian | 1980/81 | 62 | 26 | 48 | 59 | 76 |
| South Pacific | 1980/81 | 50 | 39 | 18 | 40 | 68 |
| Northern Hemisphere | 1981 | 561 | 128 | 463 | 542 | 645 |
| Southern Hemisphere | 1980/81 | 204 | 55 | 162 | 193 | 233 |
| Global | 1981 | 765 | 165 | 645 | 717 | 853 |
When using these numbers in any publication, please cite: Schreck III, C. J., K. R. Knapp, and J. P. Kossin, 2014: The Impact of Best Track Discrepancies on Global Tropical Cyclone Climatologies using IBTrACS Monthly Weather Review, 142, 3881-3899. doi:10.1175/MWR-D-14-00021.1
WMO Monthly Average Tropical Cyclone Numbers
Based on figure 9 from Schreck et al. (2014)
| Month | |||||||||||||
|---|---|---|---|---|---|---|---|---|---|---|---|---|---|
| Basin | Initial Year | Jan | Feb | Mar | Apr | May | Jun | Jul | Aug | Sep | Oct | Nov | Dec |
| North Atlantic | 1981 | 0.0 | 0.0 | 0.0 | 0.1 | 0.1 | 0.6 | 1.1 | 3.3 | 4.0 | 2.0 | 0.7 | 0.2 |
| East Pacific | 1981 | 0.0 | 0.0 | 0.0 | 0.0 | 0.7 | 1.9 | 3.6 | 4.2 | 3.6 | 2.1 | 0.3 | 0.1 |
| West Pacific | 1981 | 0.3 | 0.1 | 0.3 | 0.6 | 1.1 | 1.7 | 3.5 | 5.6 | 4.7 | 3.6 | 2.3 | 1.1 |
| North Indian | 1981 | 0.1 | 0.1 | 0.1 | 0.2 | 0.7 | 0.4 | 0.0 | 0.0 | 0.2 | 0.8 | 1.0 | 0.4 |
| South Indian | 1981/82 | 2.0 | 2.2 | 1.4 | 0.7 | 0.3 | 0.1 | 0.0 | 0.0 | 0.1 | 0.1 | 0.6 | 1.0 |
| Australian | 1984/85 | 2.0 | 1.8 | 2.0 | 1.4 | 0.3 | 0.0 | 0.0 | 0.0 | 0.0 | 0.1 | 0.4 | 1.2 |
| South Pacific | 1980/81 | 1.5 | 1.8 | 1.4 | 0.6 | 0.2 | 0.1 | 0.0 | 0.0 | 0.0 | 0.1 | 0.4 | 0.7 |
| Northern Hemisphere | 1981 | 0.4 | 0.2 | 0.4 | 0.9 | 2.5 | 4.7 | 8.3 | 13.1 | 12.5 | 8.4 | 4.3 | 1.8 |
| Southern Hemisphere | 1980/81 | 5.5 | 5.8 | 4.7 | 2.6 | 0.8 | 0.1 | 0.0 | 0.0 | 0.1 | 0.3 | 1.3 | 2.9 |
| Global | 1981 | 5.9 | 6.0 | 5.1 | 3.6 | 3.3 | 4.8 | 8.3 | 13.1 | 12.6 | 8.8 | 5.6 | 4.7 |
When using these numbers in any publication, please cite:
Schreck III, C. J., K. R. Knapp, and J. P. Kossin, 2014: The Impact of Best Track Discrepancies on Global Tropical Cyclone Climatologies using IBTrACS, Monthly Weather Review, 142, 3881-3899. doi:10.1175/MWR-D-14-00021.1
NHC and JTWC Monthly Average Tropical Cyclone Numbers
Based on figure 9 from Schreck et al. (2014)
| Month | |||||||||||||
|---|---|---|---|---|---|---|---|---|---|---|---|---|---|
| Basin | Initial Year | Jan | Feb | Mar | Apr | May | Jun | Jul | Aug | Sep | Oct | Nov | Dec |
| North Atlantic | 1981 | 0.0 | 0.0 | 0.0 | 0.1 | 0.1 | 0.6 | 1.1 | 3.3 | 4.0 | 2.0 | 0.7 | 0.2 |
| East Pacific | 1981 | 0.0 | 0.0 | 0.0 | 0.0 | 0.7 | 1.9 | 3.6 | 4.2 | 3.6 | 2.1 | 0.3 | 0.1 |
| West Pacific | 1981 | 0.4 | 0.1 | 0.4 | 0.6 | 1.1 | 1.7 | 3.6 | 5.5 | 4.8 | 3.7 | 2.4 | 1.3 |
| North Indian | 1981 | 0.1 | 0.1 | 0.0 | 0.2 | 0.8 | 0.5 | 0.1 | 0.0 | 0.3 | 1.0 | 1.2 | 0.5 |
| South Indian | 1981/82 | 2.1 | 2.1 | 1.4 | 0.6 | 0.2 | 0.1 | 0.1 | 0.1 | 0.2 | 0.4 | 0.7 | 1.0 |
| Australian | 1984/85 | 2.2 | 2.3 | 2.0 | 1.5 | 0.3 | 0.0 | 0.1 | 0.0 | 0.0 | 0.1 | 0.5 | 1.2 |
| South Pacific | 1980/81 | 1.4 | 1.6 | 1.3 | 0.5 | 0.1 | 0.1 | 0.0 | 0.0 | 0.0 | 0.2 | 0.3 | 0.8 |
| Northern Hemisphere | 1981 | 0.6 | 0.2 | 0.5 | 0.9 | 2.7 | 4.7 | 8.4 | 13.1 | 12.7 | 8.8 | 4.7 | 2.1 |
| Southern Hemisphere | 1980/81 | 5.7 | 6.0 | 4.8 | 2.7 | 0.7 | 0.1 | 0.2 | 0.1 | 0.3 | 0.6 | 1.5 | 3.1 |
| Global | 1981 | 6.3 | 6.2 | 5.2 | 3.5 | 3.4 | 4.9 | 8.6 | 13.1 | 12.9 | 9.4 | 6.2 | 5.1 |
When using these numbers in any publication, please cite:
Schreck III, C. J., K. R. Knapp, and J. P. Kossin, 2014: The Impact of Best Track Discrepancies on Global Tropical Cyclone Climatologies using IBTrACS, Monthly Weather Review, 142, 3881-3899. doi:10.1175/MWR-D-14-00021.1
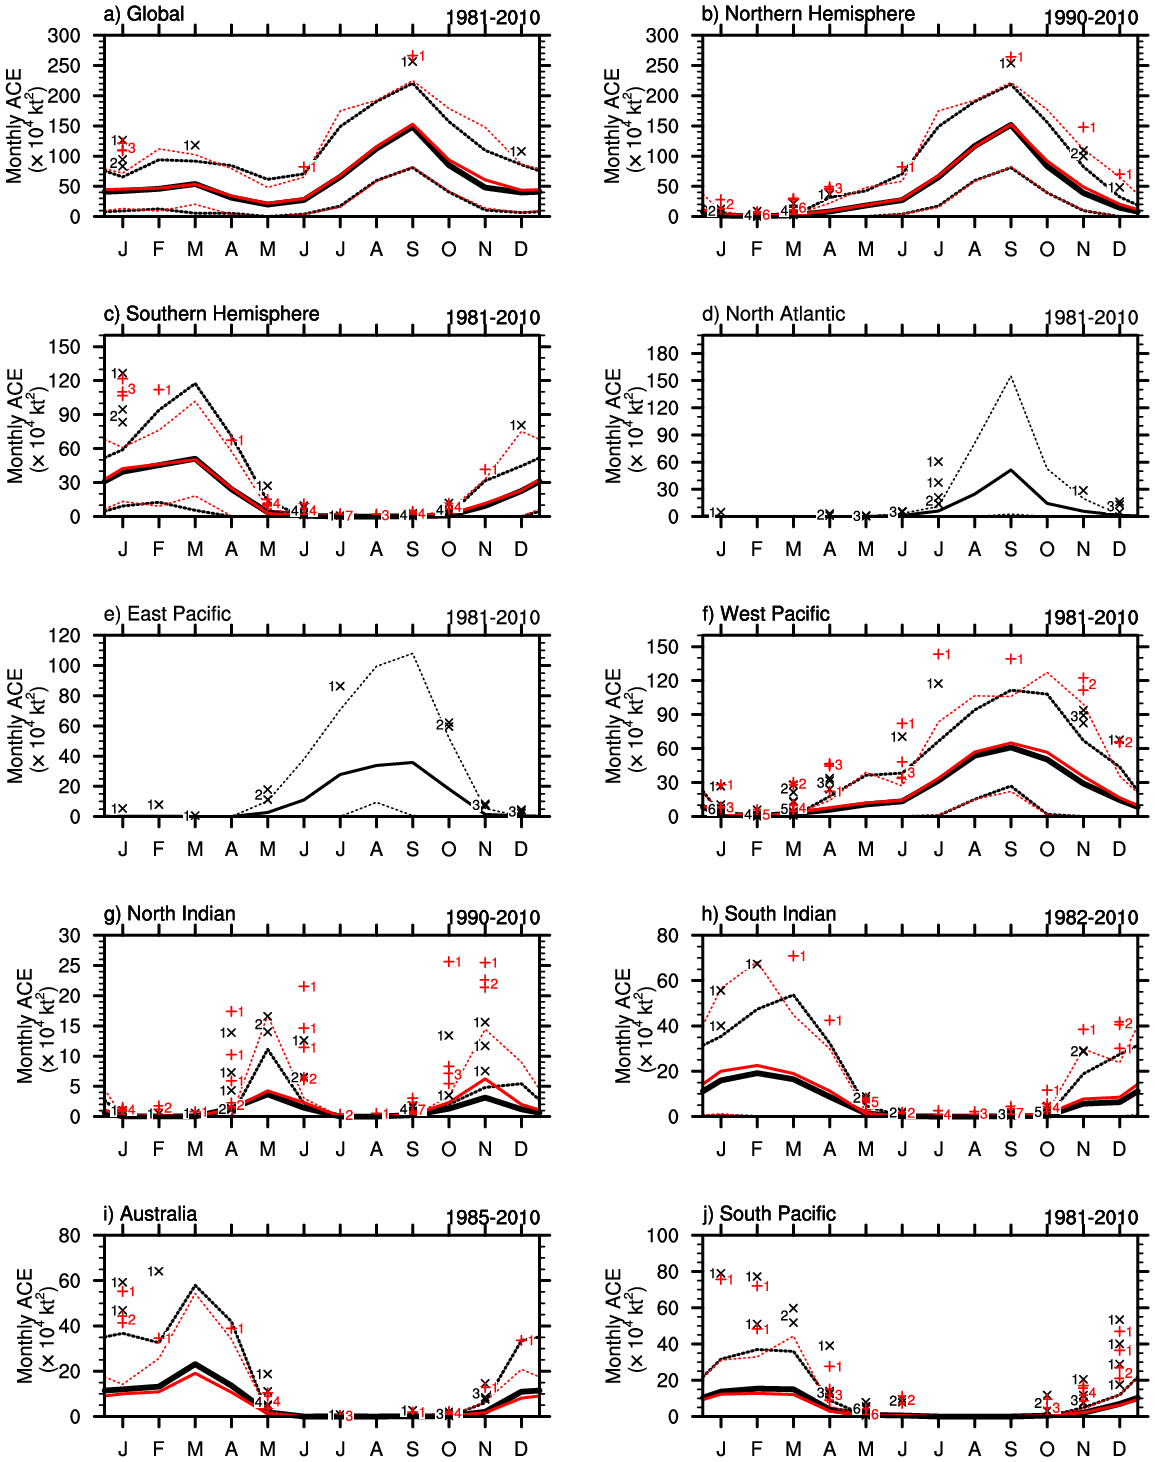
WMO Monthly Accumulated Cyclone Energy Values
Based on Figure 10 from Schreck et al. (2014)
| Month | |||||||||||||
|---|---|---|---|---|---|---|---|---|---|---|---|---|---|
| Basin | Initial Year | Jan | Feb | Mar | Apr | May | Jun | Jul | Aug | Sep | Oct | Nov | Dec |
| North Atlantic | 1981 | 0.2 | 0.0 | 0.0 | 0.1 | 0.1 | 1.2 | 6.1 | 24.8 | 51.4 | 14.5 | 5.8 | 1.4 |
| East Pacific | 1981 | 0.2 | 0.3 | 0.0 | 0.0 | 2.7 | 11.0 | 27.8 | 33.8 | 35.8 | 18.3 | 1.5 | 0.3 |
| West Pacific | 1981 | 2.3 | 0.3 | 2.8 | 6.0 | 10.7 | 13.4 | 31.6 | 53.8 | 61.0 | 50.4 | 29.1 | 14.5 |
| North Indian | 1981 | 0.1 | 0.0 | 0.0 | 1.3 | 3.7 | 1.5 | 0.0 | 0.0 | 0.2 | 1.3 | 3.1 | 1.2 |
| South Indian | 1981/82 | 16.0 | 19.2 | 16.5 | 8.7 | 1.4 | 0.1 | 0.0 | 0.0 | 0.1 | 0.4 | 5.7 | 6.3 |
| Australian | 1984/85 | 12.0 | 13.2 | 23.1 | 13.7 | 1.9 | 0.0 | 0.0 | 0.0 | 0.1 | 0.1 | 2.1 | 11.0 |
| South Pacific | 1980/81 | 13.8 | 15.4 | 15.1 | 3.9 | 0.9 | 0.6 | 0.0 | 0.0 | 0.0 | 0.5 | 2.1 | 7.0 |
| Northern Hemisphere | 1981 | 2.7 | 0.5 | 2.8 | 7.5 | 17.1 | 27,1 | 65.6 | 112.3 | 148.4 | 84.4 | 39.5 | 17.4 |
| Southern Hemisphere | 1980/81 | 41.7 | 47.8 | 54.7 | 26.3 | 4.1 | 0.7 | 0.0 | 0.0 | 0.2 | 1.0 | 9.8 | 24.3 |
| Global | 1981 | 44.4 | 48.3 | 57.5 | 33.7 | 21.2 | 27.8 | 65.6 | 112.3 | 148.6 | 85.4 | 49.4 | 41.7 |
When using these numbers in any publication, please cite:
Schreck III, C. J., K. R. Knapp, and J. P. Kossin, 2014: The Impact of Best Track Discrepancies on Global Tropical Cyclone Climatologies using IBTrACS, Monthly Weather Review, 142, 3881-3899. doi:10.1175/MWR-D-14-00021.1
NHC and JTWC Monthly Accumulated Cyclone Energy Values
Based on Figure 10 from Schreck et al. (2014)
| Month | |||||||||||||
|---|---|---|---|---|---|---|---|---|---|---|---|---|---|
| Basin | Initial Year | Jan | Feb | Mar | Apr | May | Jun | Jul | Aug | Sep | Oct | Nov | Dec |
| North Atlantic | 1981 | 0.2 | 0.0 | 0.0 | 0.1 | 0.1 | 1.2 | 6.1 | 24.8 | 51.4 | 14.5 | 5.8 | 1.4 |
| East Pacific | 1981 | 0.2 | 0.3 | 0.0 | 0.0 | 2.7 | 11.0 | 27.8 | 33.8 | 35.8 | 18.3 | 1.5 | 0.3 |
| West Pacific | 1981 | 2.5 | 0.3 | 3.1 | 7.9 | 12.1 | 14.3 | 33.7 | 56.9 | 65.0 | 56.7 | 35.4 | 16.6 |
| North Indian | 1981 | 0.2 | 0.1 | 0.0 | 1.3 | 4.2 | 2.3 | 0.0 | 0.0 | 0.3 | 2.3 | 6.2 | 2.0 |
| South Indian | 1981/82 | 20.0 | 22.6 | 19.0 | 11.3 | 1.3 | 0.1 | 0.1 | 0.1 | 0.4 | 1.2 | 7.8 | 8.5 |
| Australian | 1984/85 | 10.0 | 10.9 | 19.1 | 10.7 | 1.2 | 0.0 | 0.0 | 0.0 | 0.1 | 0.2 | 1.7 | 8.2 |
| South Pacific | 1980/81 | 12.3 | 12.8 | 12.1 | 3.0 | 0.3 | 0.6 | 0.0 | 0.0 | 0.0 | 0.5 | 2.2 | 6.4 |
| Northern Hemisphere | 1981 | 3.0 | 0.6 | 3.2 | 9.3 | 19.1 | 28.8 | 67.7 | 115.5 | 152.4 | 91.8 | 48.9 | 20.3 |
| Southern Hemisphere | 1980/81 | 42.4 | 46.3 | 50.2 | 25.0 | 2.8 | 0.7 | 0.2 | 0.1 | 0.4 | 1.9 | 11.7 | 23.0 |
| Global | 1981 | 45.4 | 46.9 | 53.4 | 34.3 | 21.8 | 29.5 | 67.8 | 115.6 | 152.9 | 93.7 | 60.6 | 43.4 |
When using these numbers in any publication, please cite:
Schreck III, C. J., K. R. Knapp, and J. P. Kossin, 2014: The Impact of Best Track Discrepancies on Global Tropical Cyclone Climatologies using IBTrACS, Monthly Weather Review, 142, 3881-3899. doi:10.1175/MWR-D-14-00021.1
Please note the following caveats when using information from these tables
Initial dates vary: Data from some agencies are not available for all 30 years of the climatology.
Counts based solely on wind: The climatologies are based solely on wind speed. Storms without wind speeds were not included in the climatology. Wind speed data is available for most storms from 1980–2010.
Wind speed homogeneities: Wind speed averaging periods vary between agencies, which affects the WMO inter-basin count values. In this climatology, we attempted to reduce these differences by converting to 1-min winds.
Counting monthly storms: Storms are only for the month they start in. However, ACE values are only calculated for the portion of the storm during that month.
Counting storms in basins: A storm is only counted in a basin if it starts in that basin.
Basin map
News Forum
Visit the IBTrACS News Forum for recent dataset changes, updates, issues, and other information about the product.
Questions and Answer Forum
Use the question and answer (QA) forum to browse previous questions from the IBTrACS user community or ask your own question about the project.
Terms of Use
IBTrACS was developed to support scientific research efforts. The IBTrACS data usage policy follows the World Data Center for Meteorology (WDC), which provides full and open access to the data. We have agreements from the Regional Specialized Meteorological Centers that provide track data to make IBTrACS data open for distribution to contribute to global tropical cyclone research. We also use the World Meteorological Organization's Resolution 40 policy as the guide for commercial use of IBTrACS data.
Related Publications
- Schreck III, C. J., K. R. Knapp, and J. P. Kossin, 2014: The Impact of Best Track Discrepancies on Global Tropical Cyclone Climatologies using IBTrACS. Monthly Weather Review, 142, 3881-3899. doi:10.1175/MWR-D-14-00021.1
- Knapp, K. R., J. A. Knaff, C. R. Sampson, G. M. Riggio, and A. D. Schnapp, 2013: A pressure-based analysis of the historical western North Pacific tropical cyclone intensity record. Monthly Weather Review, 141, 2611-2631. doi:10.1175/MWR-D-12-00323.1.
- Diamond, H.J., A.M. Lorrey, and J.A. Renwick, 2013: A Southwest Pacific Tropical Cyclone Climatology and Linkages to the El Nino Southern Oscillation. Journal of Climate, 26, 3-25. doi:10.1175/JCLI-D-12-00077.1.
- Diamond, H.J., A.M. Lorrey, K.R. Knapp, and D.H. Levinson, 2012: Development of an enhanced tropical cyclone tracks database for the southwest Pacific from 1840-2010. International Journal of Climatology, 32, 2240-2250. doi:10.1002/joc.2412.
- Levinson, D. H., H. J. Diamond, K. R. Knapp, M. C. Kruk, and E. J. Gibney, 2010: Toward a homogenous global tropical cyclone best track dataset. Bulletin of the American Meteorological Society, 91, 377-380. doi:10.1175/2010BAMS2930.1
- Kruk, M. C., K. R. Knapp, and D. H. Levinson, 2010: A technique for merging global tropical cyclone best track data. Journal of Atmospheric and Oceanic Technology, 27,680-692. doi:10.1175/2009JTECHA1267.1
- Knapp, K. R., and M. C. Kruk, 2010: Quantifying Interagency Differences in Tropical Cyclone Best-Track Wind Speed Estimates. Monthly Weather Review, 138, 1459-1473. doi:10.1175/2009MWR3123.1.
- Levinson, D. H., and H. J. Diamond, 2009: Combining Tropical Cyclone Data Sets Worldwide
- Eos, 90. doi:10.1029/2009EO350006.
- Knapp, K. R., M. C. Kruk, D. H. Levinson, and E. J. Gibney, 2009: Archive compiles new resource for global tropical cyclone research. Eos, Transactions, AGU., 90, 46. doi:10.1029/2009EO060002.


